Article

Genome-Wide Identification of TLP Gene Family in Populus trichocarpa and Functional Characterization of PtTLP6, Preferentially Expressed in Phloem

1
State Key Laboratory of Tree Genetics and Breeding, Northeast Forestry University, Harbin 150040, China
2
College of Life Sciences, Northeast Forestry University, Harbin 150040, China
3
Agricultural Botany Department, Faculty of Agriculture, Tanta University, Tanta 31527, Egypt
*
Author to whom correspondence should be addressed.
These authors contributed equally to this work.
Int. J. Mol. Sci. 2024, 25(11), 5990; https://doi.org/10.3390/ijms25115990
Submission received: 10 April 2024 / Revised: 19 May 2024 / Accepted: 27 May 2024 / Published: 30 May 2024
(This article belongs to the Special Issue Advances in Forest Tree Physiology, Breeding and Genetic Research)

Abstract

:
Thaumatin-like proteins (TLPs) in plants are involved in diverse biotic and abiotic stresses, including antifungal activity, low temperature, drought, and high salinity. However, the roles of the TLP genes are rarely reported in early flowering. Here, the TLP gene family was identified in P. trichocarpa. The 49 PtTLP genes were classified into 10 clusters, and gene structures, conserved motifs, and expression patterns were analyzed in these PtTLP genes. Among 49 PtTLP genes, the PtTLP6 transcription level is preferentially high in stems, and GUS staining signals were mainly detected in the phloem tissues of the PtTLP6pro::GUS transgenic poplars. We generated transgenic Arabidopsis plants overexpressing the PtTLP6 gene, and its overexpression lines showed early flowering phenotypes. However, the expression levels of main flowering regulating genes were not significantly altered in these PtTLP6-overexpressing plants. Our data further showed that overexpression of the PtTLP6 gene led to a reactive oxygen species (ROS) burst in Arabidopsis, which might advance the development process of transgenic plants. In addition, subcellular localization of PtTLP6-fused green fluorescent protein (GFP) was in peroxisome, as suggested by tobacco leaf transient transformation. Overall, this work provides a comprehensive analysis of the TLP gene family in Populus and an insight into the role of TLPs in woody plants.

1. Introduction

Thaumatin-like proteins (TLPs) belong to the PR-5 family of pathogenesis-related proteins (PRs), which were named based on the high sequence similarity to the sweet-tasting thaumatin protein from Thaumatococcus daniellii Benth [1] {XE “[1]”}{XE “[1]”}{XE “[1]”}. Members of the PR-5 family exhibit various biological functions such as peptide binding activity, β-1,3-glucanase activity, antifungal properties, osmotic regulation, and enzyme inhibition [2]. Most TLPs contain a highly conserved motif, which is G-X-[GF]-X-C-X-T-[GA]-D-C-X-(1,2)-G-X-(2,3) –C and a REDDD (arginine, glutamic acid, and three aspartic acid residues) structure, of which ten or sixteen conserved cysteine residues can form five or eight disulfide bonds [3,4,5]. These disulfide bonds help to maintain the 3D structure of TLPs under unfavorable conditions of high temperature or low pH, and it is essential for the antifungal activity of TLPs [6].
TLP genes have been reported in fungi, animals, and plants. The TLP genes in fungi, including in Irpex lacteus, Lentinula edodes, and Rhizoctonia solani, were first reported by Grenier et al. [7]. After searching for homologs in the genomic databases at NCBI using the amino acid sequences of reported TLPs, it has been revealed that the TLP gene family generally contains 2–3 members in fungi [2]. The TLP genes of animals were first found in Caenorhabditis elegans, and according to its sequence, TLP homologs have also been found in other insects, including Schistocerca gregaria, Aphididae, and Pyrochroidae [3,8]. TLP genes are ubiquitous in plants, including angiosperms, gymnosperms, and bryophytes. The 44, 49, and 24 TLPs were identified in the databases of rice, maize, and Arabidopsis [9]. Although there are many members of the TLP gene family in plants, their functions are relatively obscure. In particular, the roles of TLP genes remain largely unknown in Populus.
TLP genes have been reported to respond to different kinds of biotic stresses in plants. Cold-induced TLP genes in winter wheat epidermis displays antifungal activity against snow mold [6,10], while VvTLP-1 from grapes significantly inhibits the in vitro spore germination and hyphal growth of Botrytis cinerea [11,12]. Overexpression of ObTLP1 in Arabidopsis enhances transgenic plant resistance to Sclerotinia sclerotiorum and Botrytis cinerea [13], and AsPR5 plays the role in garlic and Arabidopsis resistance to gray mold [14]. Overexpression of GbTLP1 in cotton fibers affects secondary cell wall development and leads to enhancing the resistance of transgenic lines to Verticillium dahliae [15]. The VqTLP29 gene in grapes plays a role in the closure of stomatal immunity in response to pathogen-associated molecular patterns, increasing resistance to powdery mildew [12]. TLP genes also play the important roles in abiotic stress, including low temperature, drought, and high salinity. Overexpression of the AnTLP13 gene enhances the tolerance of tobacco to cold stress [5], and overexpression of ObTLP1 in Arabidopsis and of VqTLP29 in grapes enhances resistance to methyl jasmonate, salicylic acid, and ethylene [12,13]. In addition, some TLPs participate in other processes such as floral organ formation, seed germination, and secondary wall development in cotton fibers [15,16,17].
Currently, the structures of several TLPs, including thaumatin, zeamatin, tobacco PR-5, and osmotin, have been identified [18,19,20,21]. All have similar three-dimensional structure, generally including three regions, with an acid/basic separation structure between regions I and II to bind different protein receptors [22]. In some plant TLPs with known antifungal activities, the cleft is acidic and contains five highly conserved amino acids (arginine, glutamate, and three aspartate residues). Identification of the P. trichocarpa TLP gene family can reveal the characteristics, evolutionary relationships, and structural information of plant TLP genes. In this study, we identified the TLP genes in P. trichocarpa and explored the function of phloem-preferentially-expressed PtTLP6 through its overexpression in Arabidopsis.

2. Results

2.1. Identification and Phylogenetic Analysis of TLP Gene Family in P. trichocarpa

To identify the TLP gene family in P. trichocarpa, we searched the Pfam thaumatin domain (PF00314) and the reported Arabidopsis TLPs sequences as the queries in its genome. As a result, a total of 49 TLP genes were identified in the P. trichocarpa genome. All TLP genes were named as PtTLP1 to PtTLP49 according to the successive order of genes in the chromosomes, and the length of proteins encoded by the PtTLP genes varied from 155 to 686 amino acids (Table S1). More information on the PtTLP genes, including molecular weight, theoretical pI, instability, aliphatic, grand average of hydropathicity, and the proposed protein subcellular localization, are shown in Table S2.
We constructed a phylogenetic tree with the 49 PtTLP genes, as well as 24 known Arabidopsis TLP genes (Figure 1). According to the phylogeny of Arabidopsis TLP genes and Oryza TLP genes [23], 49 PtTLP genes were classified into 10 clusters, named as Cluster I-X. The phylogenetic analysis showed that each cluster contained at least one AtTLP gene from Arabidopsis, suggesting a homologous relationship between PtTLP genes and AtTLP genes. Among ten clusters, cluster Ⅵ contains the most PtTLP members, with 23 PtTLP genes, while cluster Ⅳ contains the fewest members, with only one PtTLP gene.

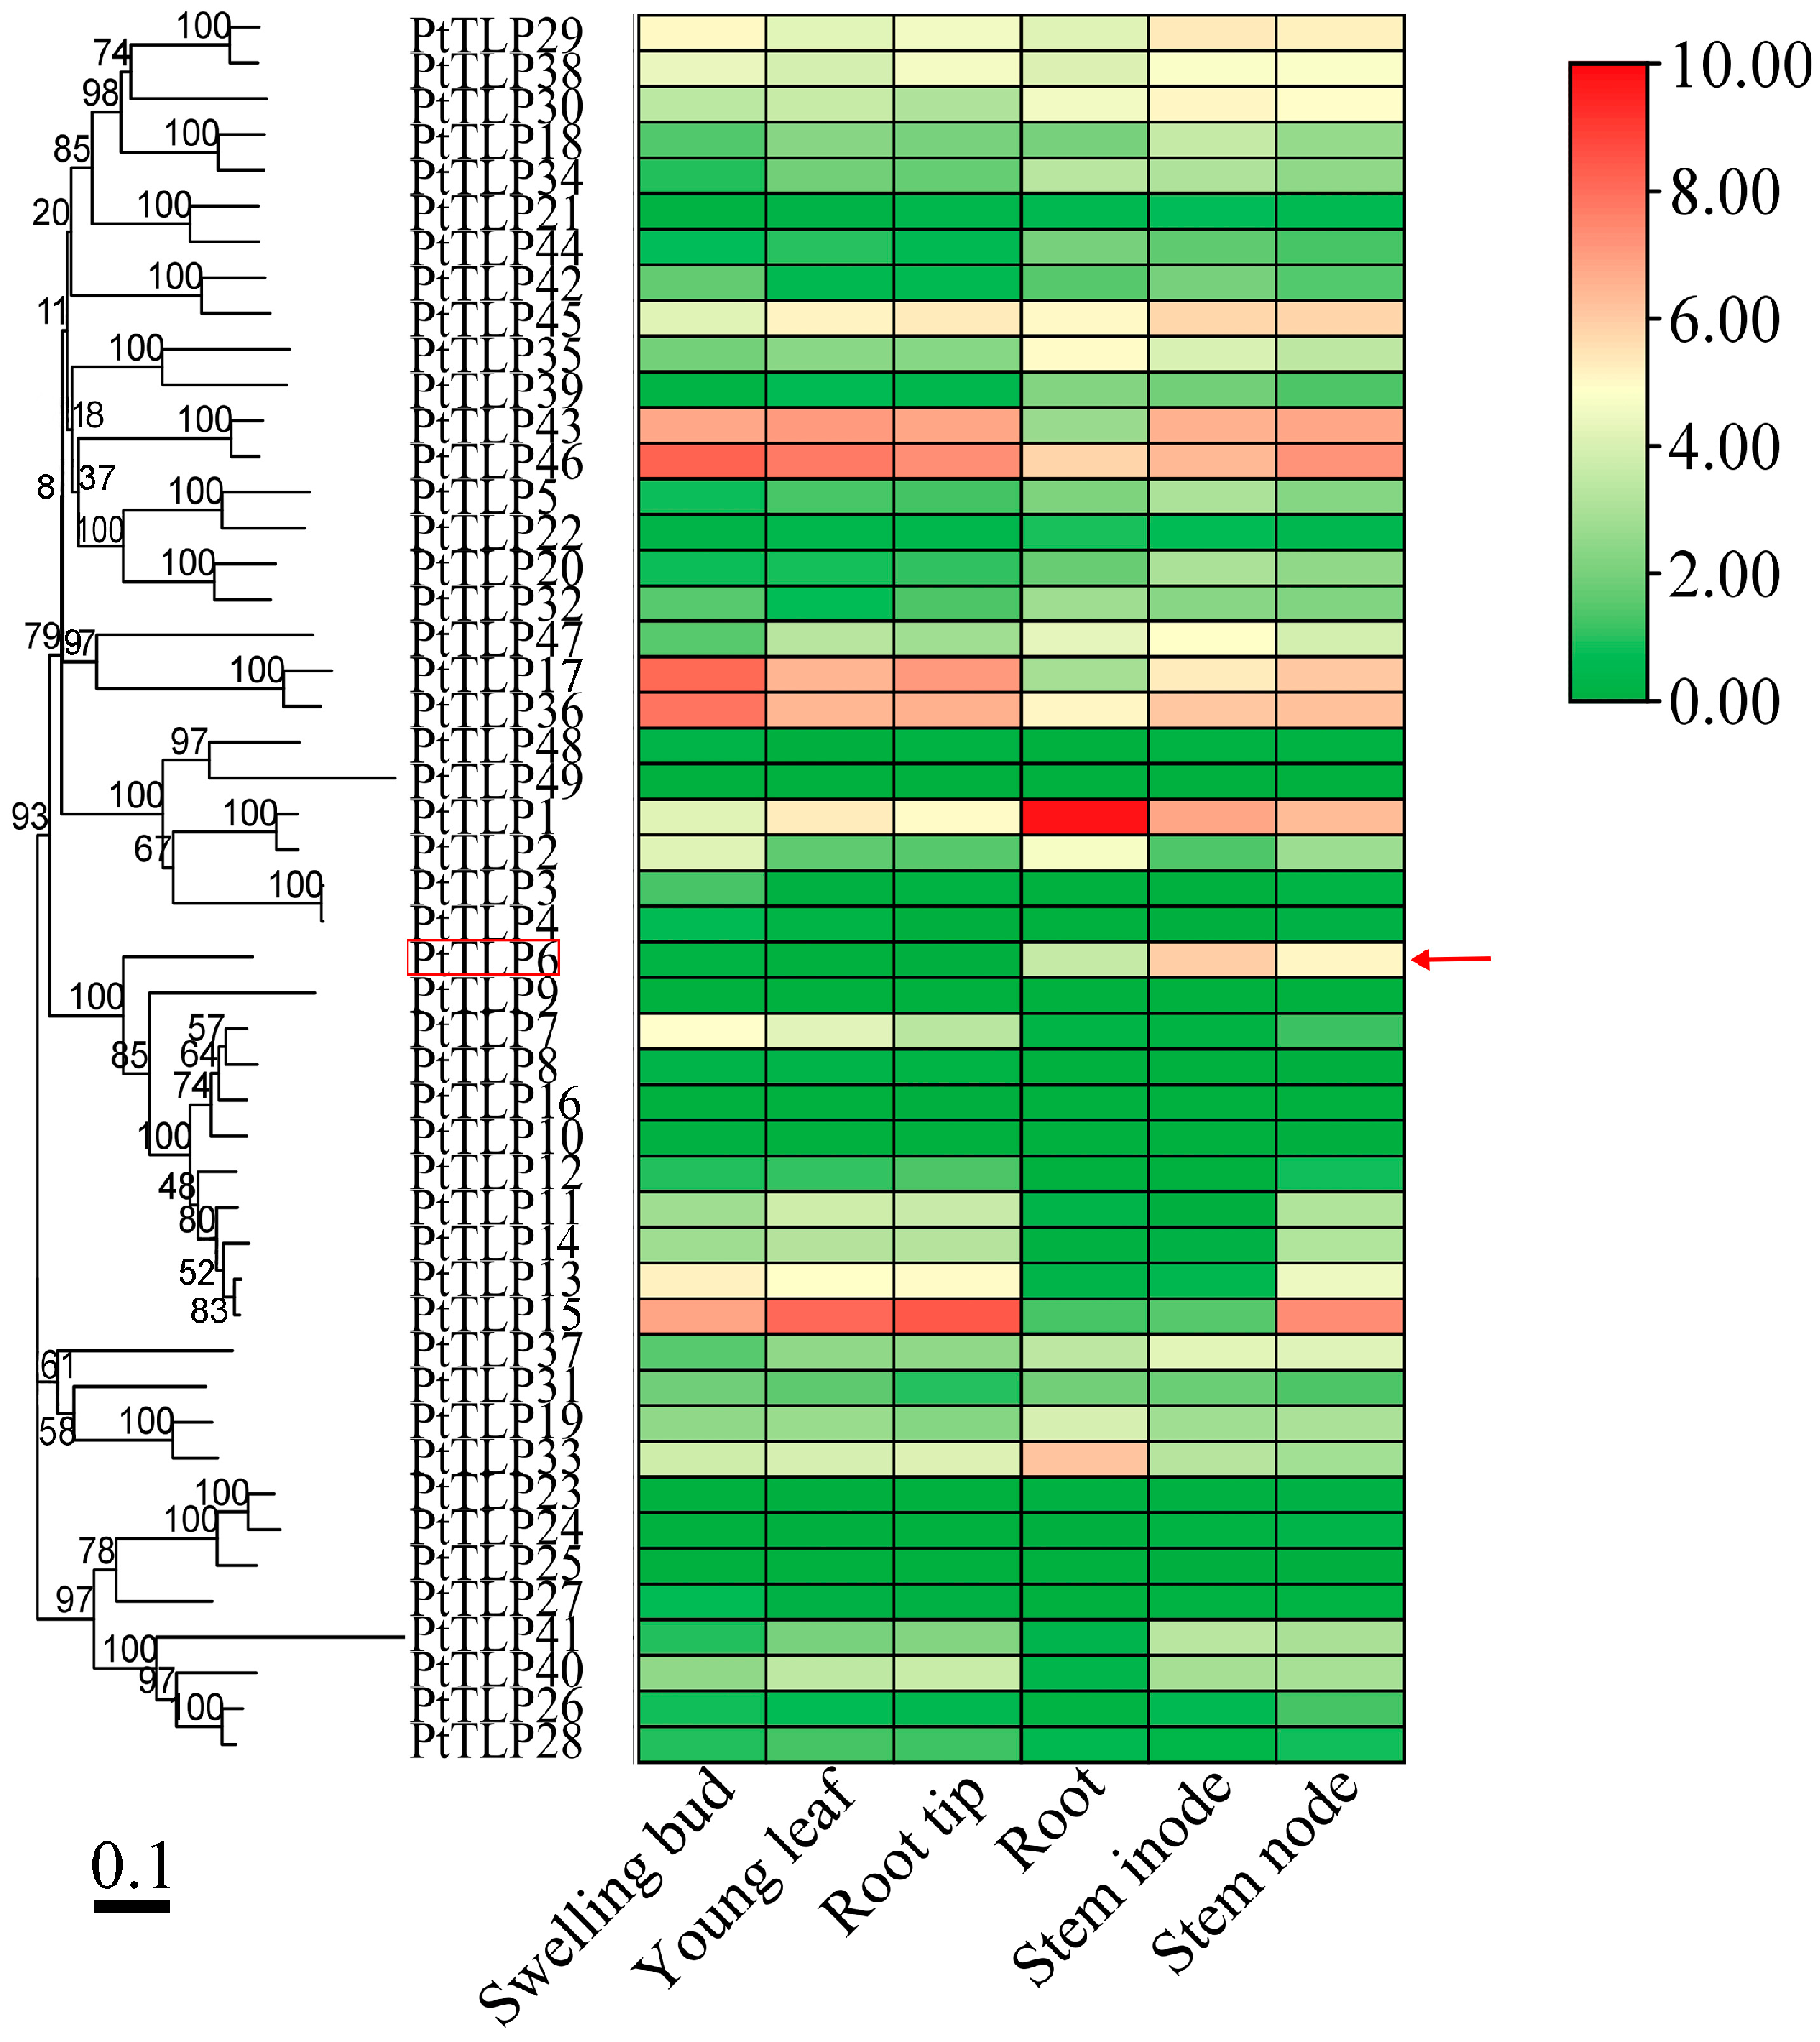
2.2. Gene Structures, Conserved Motifs, and Expression Patterns in PtTLP Genes

We mapped 49 PtTLP genes on chromosomes by TBtools-Ⅱ (Figure S1). The physical locations of these PtTLP genes on chromosomes were scattered and uneven on 14 chromosomes. Chromosome 1 contained the maximum number (17 members) of PtTLP genes, while chromosomes 10 and 17 contained only one member. Tandem and segmental duplications are the main mechanisms leading to gene family expansion [24,25,26]. Based on the searches in the PGDD database [27], the PtTLP gene family contained 17 segmental duplicate gene pairs, which are PtTLP5/22, PtTLP21/44, PtTLP23/40, PtTLP20/32, PtTLP17/36, PtTLP42/45, PtTLP43/46, PtTLP18/29, PtTLP18/30, PtTLP18/33, PtTLP18/37, PtTLP29/30, PtTLP29/33, PtTLP29/37, PtTLP30/33, PtTLP30/37, and PtTLP33/37 (Figure S1). Among these gene pairs, PtTLP18, 29, 30, 33, and 37, located on the replication blocks, formed a reciprocal duplicate gene group. The replication blocks are presumed to have arisen from the salicoid-specific genome duplication, and the specific locations on the chromosomes have been provided by Tuskan GA et al. [28]. We carried out a sequence alignment of the reciprocal duplicate genes, and their sequences exhibited high similarities (Figure S2). Seven groups of PtTLP genes, namely PtTLP2/3/4, PtTLP18/19, PtTLP30/31, PtTLP33/34, PtTLP37/38, PtTLP40/41, and PtTLP48/49, were located in tandem on chromosomes 1, 2, 5, 5, 9, 11, and 18, respectively. PtTLP2/3/4, PtTLP40/41, and PtTLP48/49 belonged to the same cluster in the phylogenic tree (Figure 1). This suggests that they might arise from recent tandem duplication events [29]. Some tandem genes like PtTLP18/19 and PtTLP30/31 were grouped into different gene clusters, possibly because they have undergone neofunctionalization [28]. The indicator for this process is the ratio of nonsynonymous substitution rate (Ka) to synonymous substitution rate (Ks) between gene pairs being less than 1 [25]. We obtained the Ka and Ks of PtTLP tandem genes from PGDD [27], and the Ka/Ks ratios of PtTLP18/19, PtTLP30/31, and PtTLP33/34 are less than 1. In addition, the sequence identity and similarity of tandem gene pairs were shown in Figure S3; for instance, those of PtTLP18/19 were 52.74% and 63.69%. Overall, these results suggest that both tandem and segmental duplications play an important role in the expansion of the PtTLP gene family.
Furthermore, we analyzed the exon/intron arrangements of the 49 PtTLP genes based on their phylogenetic tree (Figure 2A). Most PtTLP genes within the same category exhibited similar gene structures in terms of exon/intron numbers and lengths, while those in different categories displayed distinct exon/intron structural features (Figure 2C). Genes in categories VII, VIII, and X all have 3 exons. In clusters I, II, and IV, all genes have two exons, whereas in clusters III and V, most genes only have one exon, except PtTLP48, with two exons. Clusters VI and IX show greater variations in gene structure, with exon numbers ranging from 1 to 4, but the number of the exon was similar within each subgroup. We analyzed the distribution of conserved motifs and captured 15 motifs using the MEME tool (Figure 2B and Figure S4). The length of the motifs of PtTLP genes ranged from 11 to 50 amino acids, and the number of conserved motifs varied from 5 to 15 in each of the PtTLP genes. Motifs 1 to 10 appeared in almost all members of PtTLP genes, whereas motifs 11 to 15 were specific to cluster Ⅰ.
To examine the expression patterns of the PtTLP genes, we analyzed their transcription levels across multiple tissues and organs (including swelling bud, young leaf, root tip, root, stem inode, and stem node) using the Gene Atlas dataset downloaded from the JGI Data Portal (Table S3). The heat map exhibited that the majority of PtTLP genes had tissue-specific or preferential expression patterns (Figure 3). PtTLP1 and PtTLP33 were mainly expressed in roots, but the transcription levels of PtTLP13, PtTLP17, PtTLP36, PtTLP43, and PtTLP46 were lower in root and higher in swelling bud. Notably, PtTLP6 showed lower expression levels in swelling bud, young leaf, root tips, and roots, but significantly higher expression specifically in stem node and inode. These results imply that the PtTLP genes may be involved in various processes of P. trichocarpa growth and development.

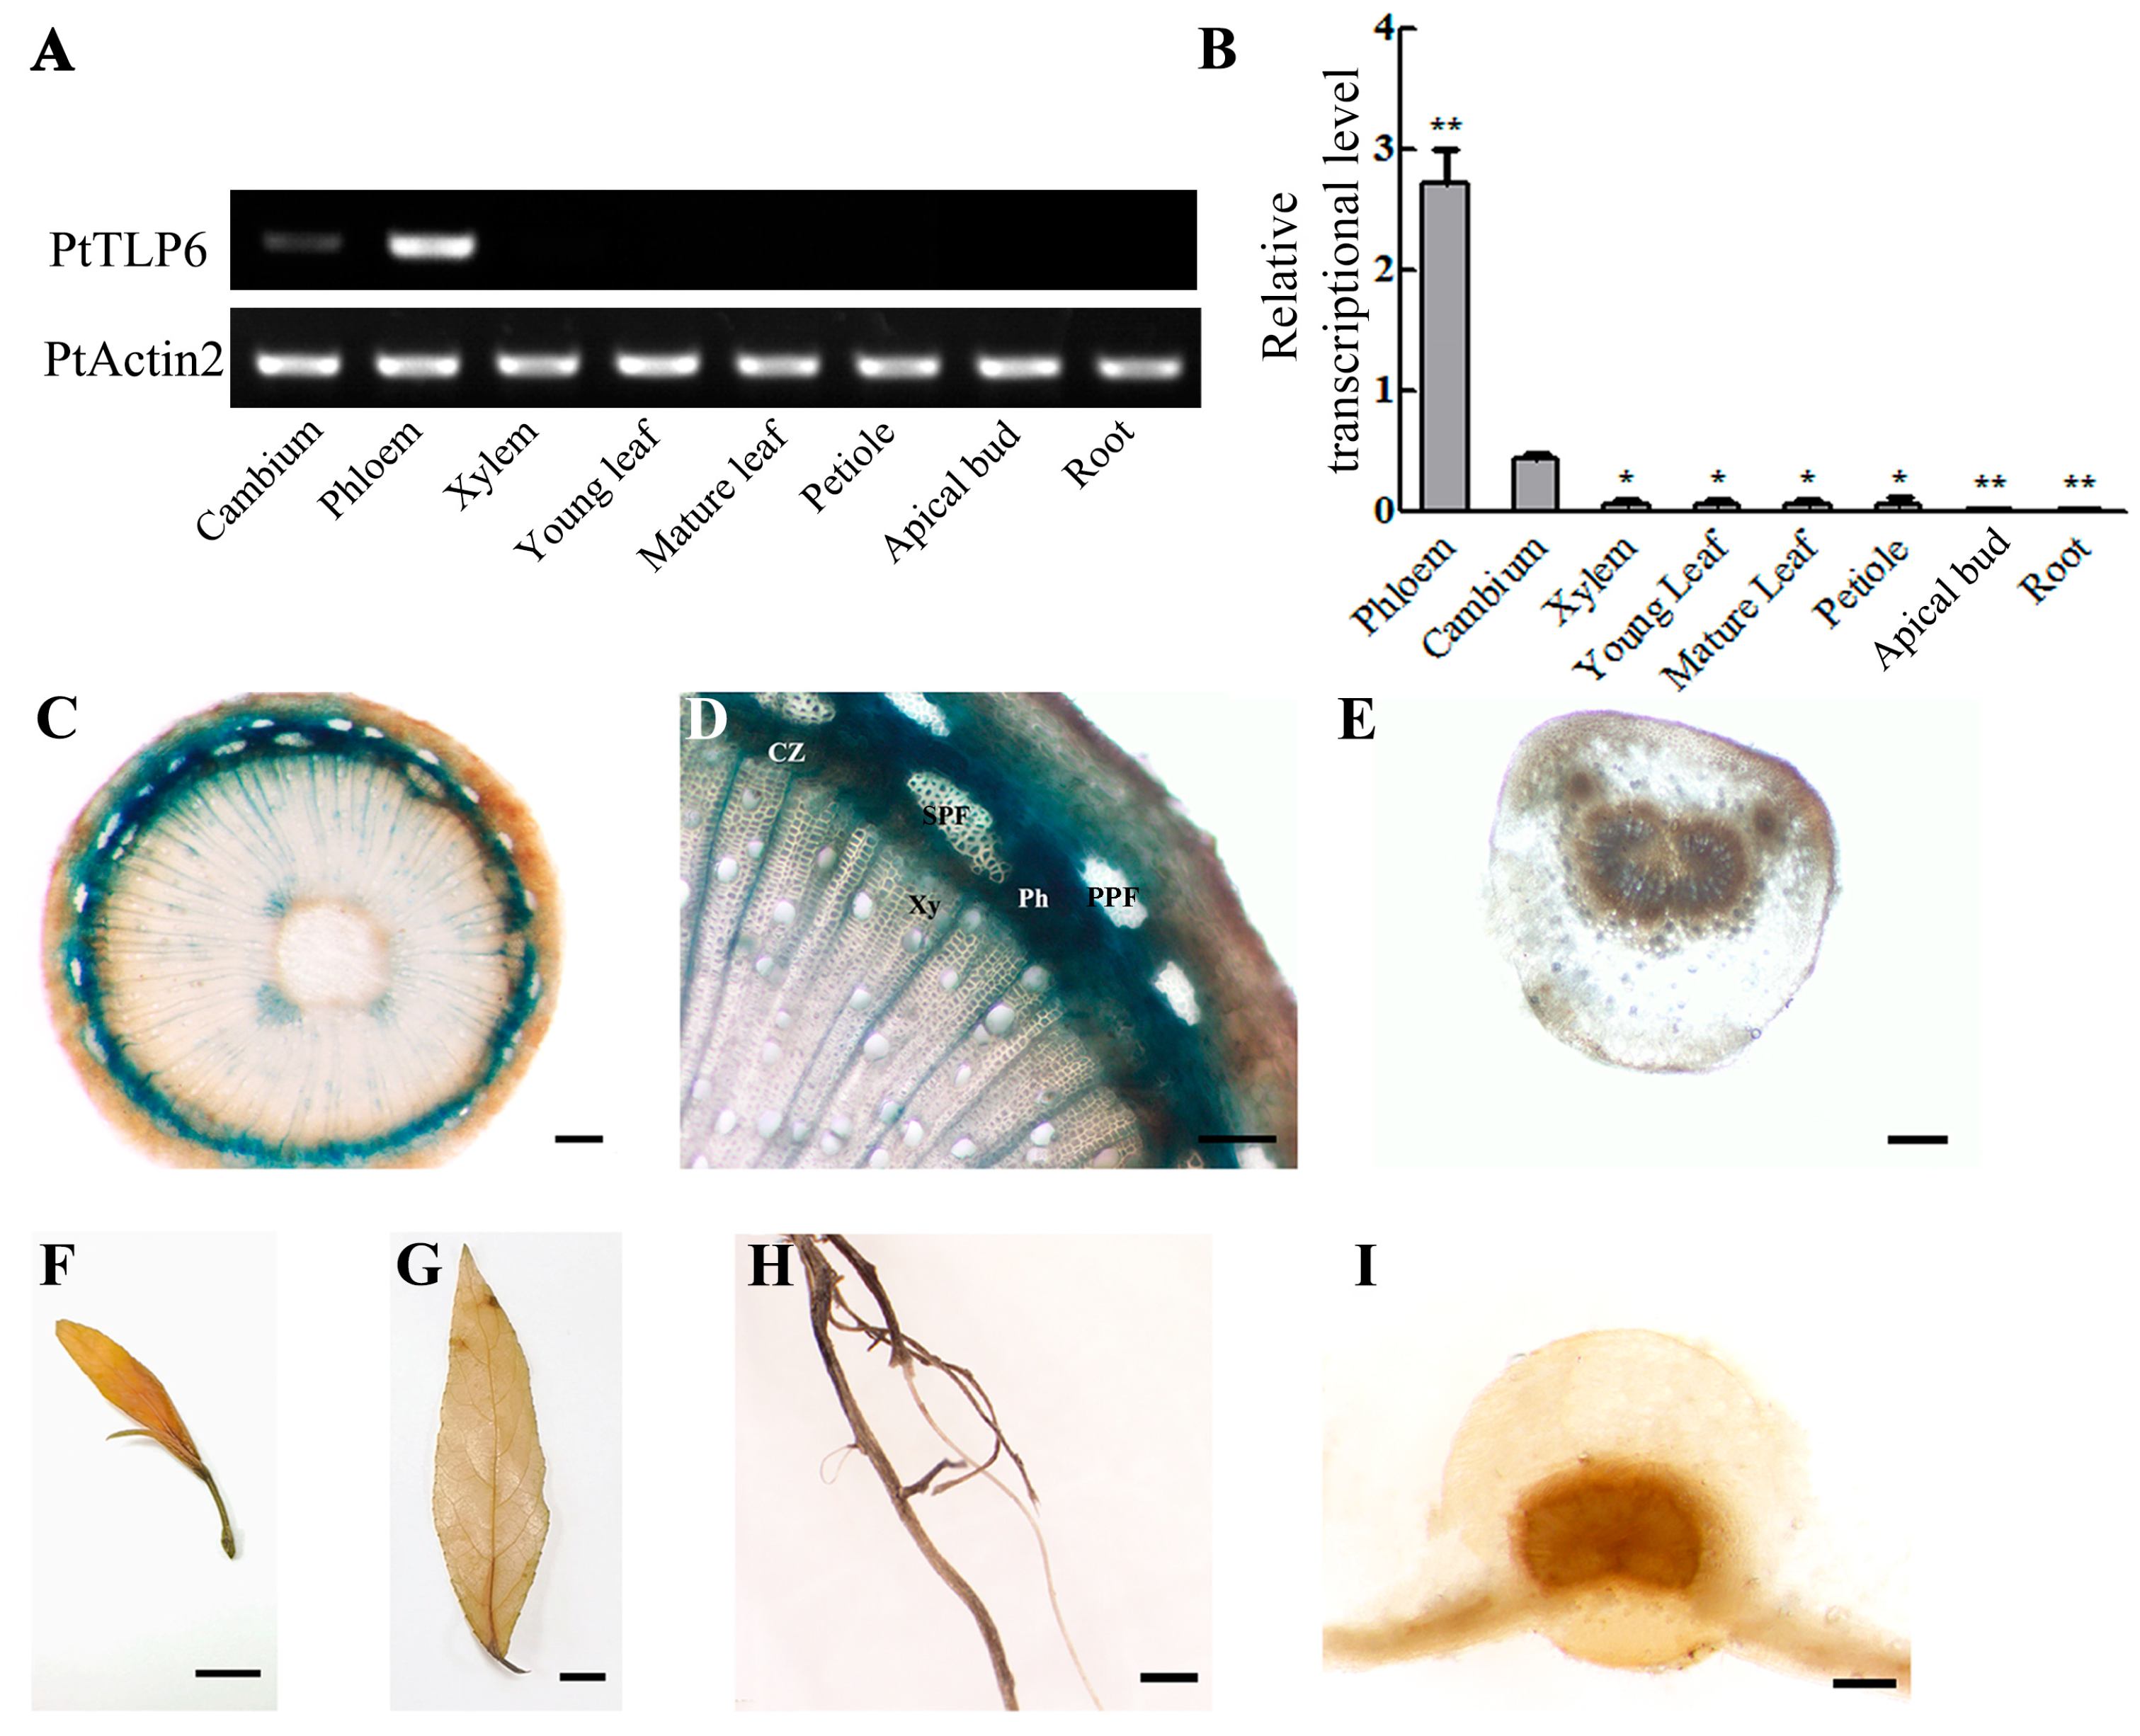
2.3. PtTLP6 Highly and Preferentially Expressed in Populus Phloem

To understand the function of the PtTLP6, we examined its expression pattern in various tissues in detail. Among xylem, cambium, phloem, young leaf, mature leaf, petiole, apical bud, and root tissues, RT-PCR data showed the highest expression level of PtTLP6 in phloem (Figure 4A). RT-qPCR analysis further revealed expression levels of PtTLP6 in different tissues (Figure 4B), which was in agreement with the results of RT-PCR analysis. These data suggested that the PtTLP6 was likely related to stem development or phloem function.
Next, we isolated the PtTLP6 gene promoter with the length of 2.38 kb, constructed the PtTLP6pro::GUS binary vector, and obtained transgenic P. trichocarpa plants expressing a GUS gene driven by PtTLP6 promoter. In 3-month-old PtTLP6pro::GUS transgenic plants, GUS staining signals were intensively detected in secondary phloem fibers, phloem parenchyma cells, sieve tubes, and companion cells in the tested stem internode 9 (Figure 4C,D), which transport the sugars produced by photosynthesis from the leaves to other parts of the tree for growth and energy. Similar results were observed in other stem internodes including the internodes 10 to 20. The cambium zone, xylem ray cells, and primary phloem fibers of stem internode 9 also showed slight GUS signals. Xylem and phloem cells are usually produced by inward and outward division of vascular cambium cells, respectively [31]. It is thus reasonable that PtTLP6 remains at a low expression level in the cambium. No GUS signal was observed in the cross section of the petiole and main vein of the 5th leaf, apical bud, mature leaf, and root (Figure 4E–I). Our findings suggest that PtTLP6 is highly and preferentially expressed in phloem tissues of poplars.

2.4. Overexpression of PtTLP6 Gene in Arabidopsis Leads to Early Flowering

To gain insight into the function of PtTLP6 gene, we generated transgenic Arabidopsis lines that overexpressed the PtTLP6 (fused with the FLAG tag at its carboxyl terminus), called PtTLP6-OE. We performed RT-qPCR analysis of PtTLP6 in five transgenic lines using the AtActin2 gene as an internal reference. PtTLP6-OE1, 2, and 4 exhibited high transcription levels of PtTLP6, which were 5–7 times higher than those of AtActin2 (Figure 5A). Western blot analysis using the anti-FLAG antibody (Abcam, Cambridge, UK) showed that four of five transgenic lines, PtTLP6-OE1, 2, 4, and 5, had significantly high PtTLP6 protein levels (Figure 5B). This suggests that these lines overexpressed the PtTLP6 in Arabidopsis.
Next, we planted PtTLP6-OE1, 2, 4, and wild type (WT) in the greenhouse to observe their phenotypes. It showed that the phenotype of the overexpression lines was similar to that of the WT at the seedling stage (Figure S5). At 21 days, there was no difference in the phenotypes, the number of rosette leaves, and the leaf size, between the overexpression lines and the WT (Figure 5C). The PtTLP6-OE lines flowered at 27 days, while the WT had not bolted yet (Figure 5D). By 35 days, the WT had bolted, while the overexpression lines had already developed the siliques (Figure 5E). We counted the days after germination to flowering and the number of rosette leaves of flowering PtTLP6-OE lines and WT plants (Figure 5F,G). After approximately 32 days of growth on soil, WT plants flowered, while PtTLP6-OE lines did at 25–27 days. When flowering, there were 12–13 rosettes in WT and 8-10 in PtTLP6-OE lines. The findings indicate that overexpression of PtTLP6 gene in Arabidopsis leads to early flowering, possibly by accelerating the growth process of transgenic plants.

2.5. Expression Levels of Flowering Regulating Genes Were Not Altered in PtTLP6-OE Arabidopsis

To examine whether early flowering results from the expression changes of flowering marker genes, we collected the sixth rosette leaves of WT and PtTLP6-OE lines to conduct RT-qPCR analysis of FLOWERING LOCUS T (FT), a key gene regulating the flowering time and flowering regulatory genes in various pathways [32,33]. The results showed that the transcription levels of FT were nearly unchanged between the WT and PtTLP6-OE lines (Figure 6B). In the aging pathway, the expression levels of SPL9, FUL, and LFY showed no significant variation among WT and PtTLP6-OE lines (Figure 6D). In the vernalization pathway, the transcription levels of the FLC, SVP, and FRI were not significantly altered among the WT and PtTLP6-OE lines (Figure 6E). The expression levels of FVE, FLD, and FCA in the autonomous pathway were not significantly changed among the WT and PtTLP6-OE lines (Figure 6F). Similarly, the transcription levels of GI, CDF, and CO from the photoperiod pathway almost stayed in line among the WT and PtTLP6-OE lines (Figure 6G). Overall, the transcription levels of these flowering regulatory genes tested remained largely unchanged between the WT and PtTLP6-OE transgenic lines.

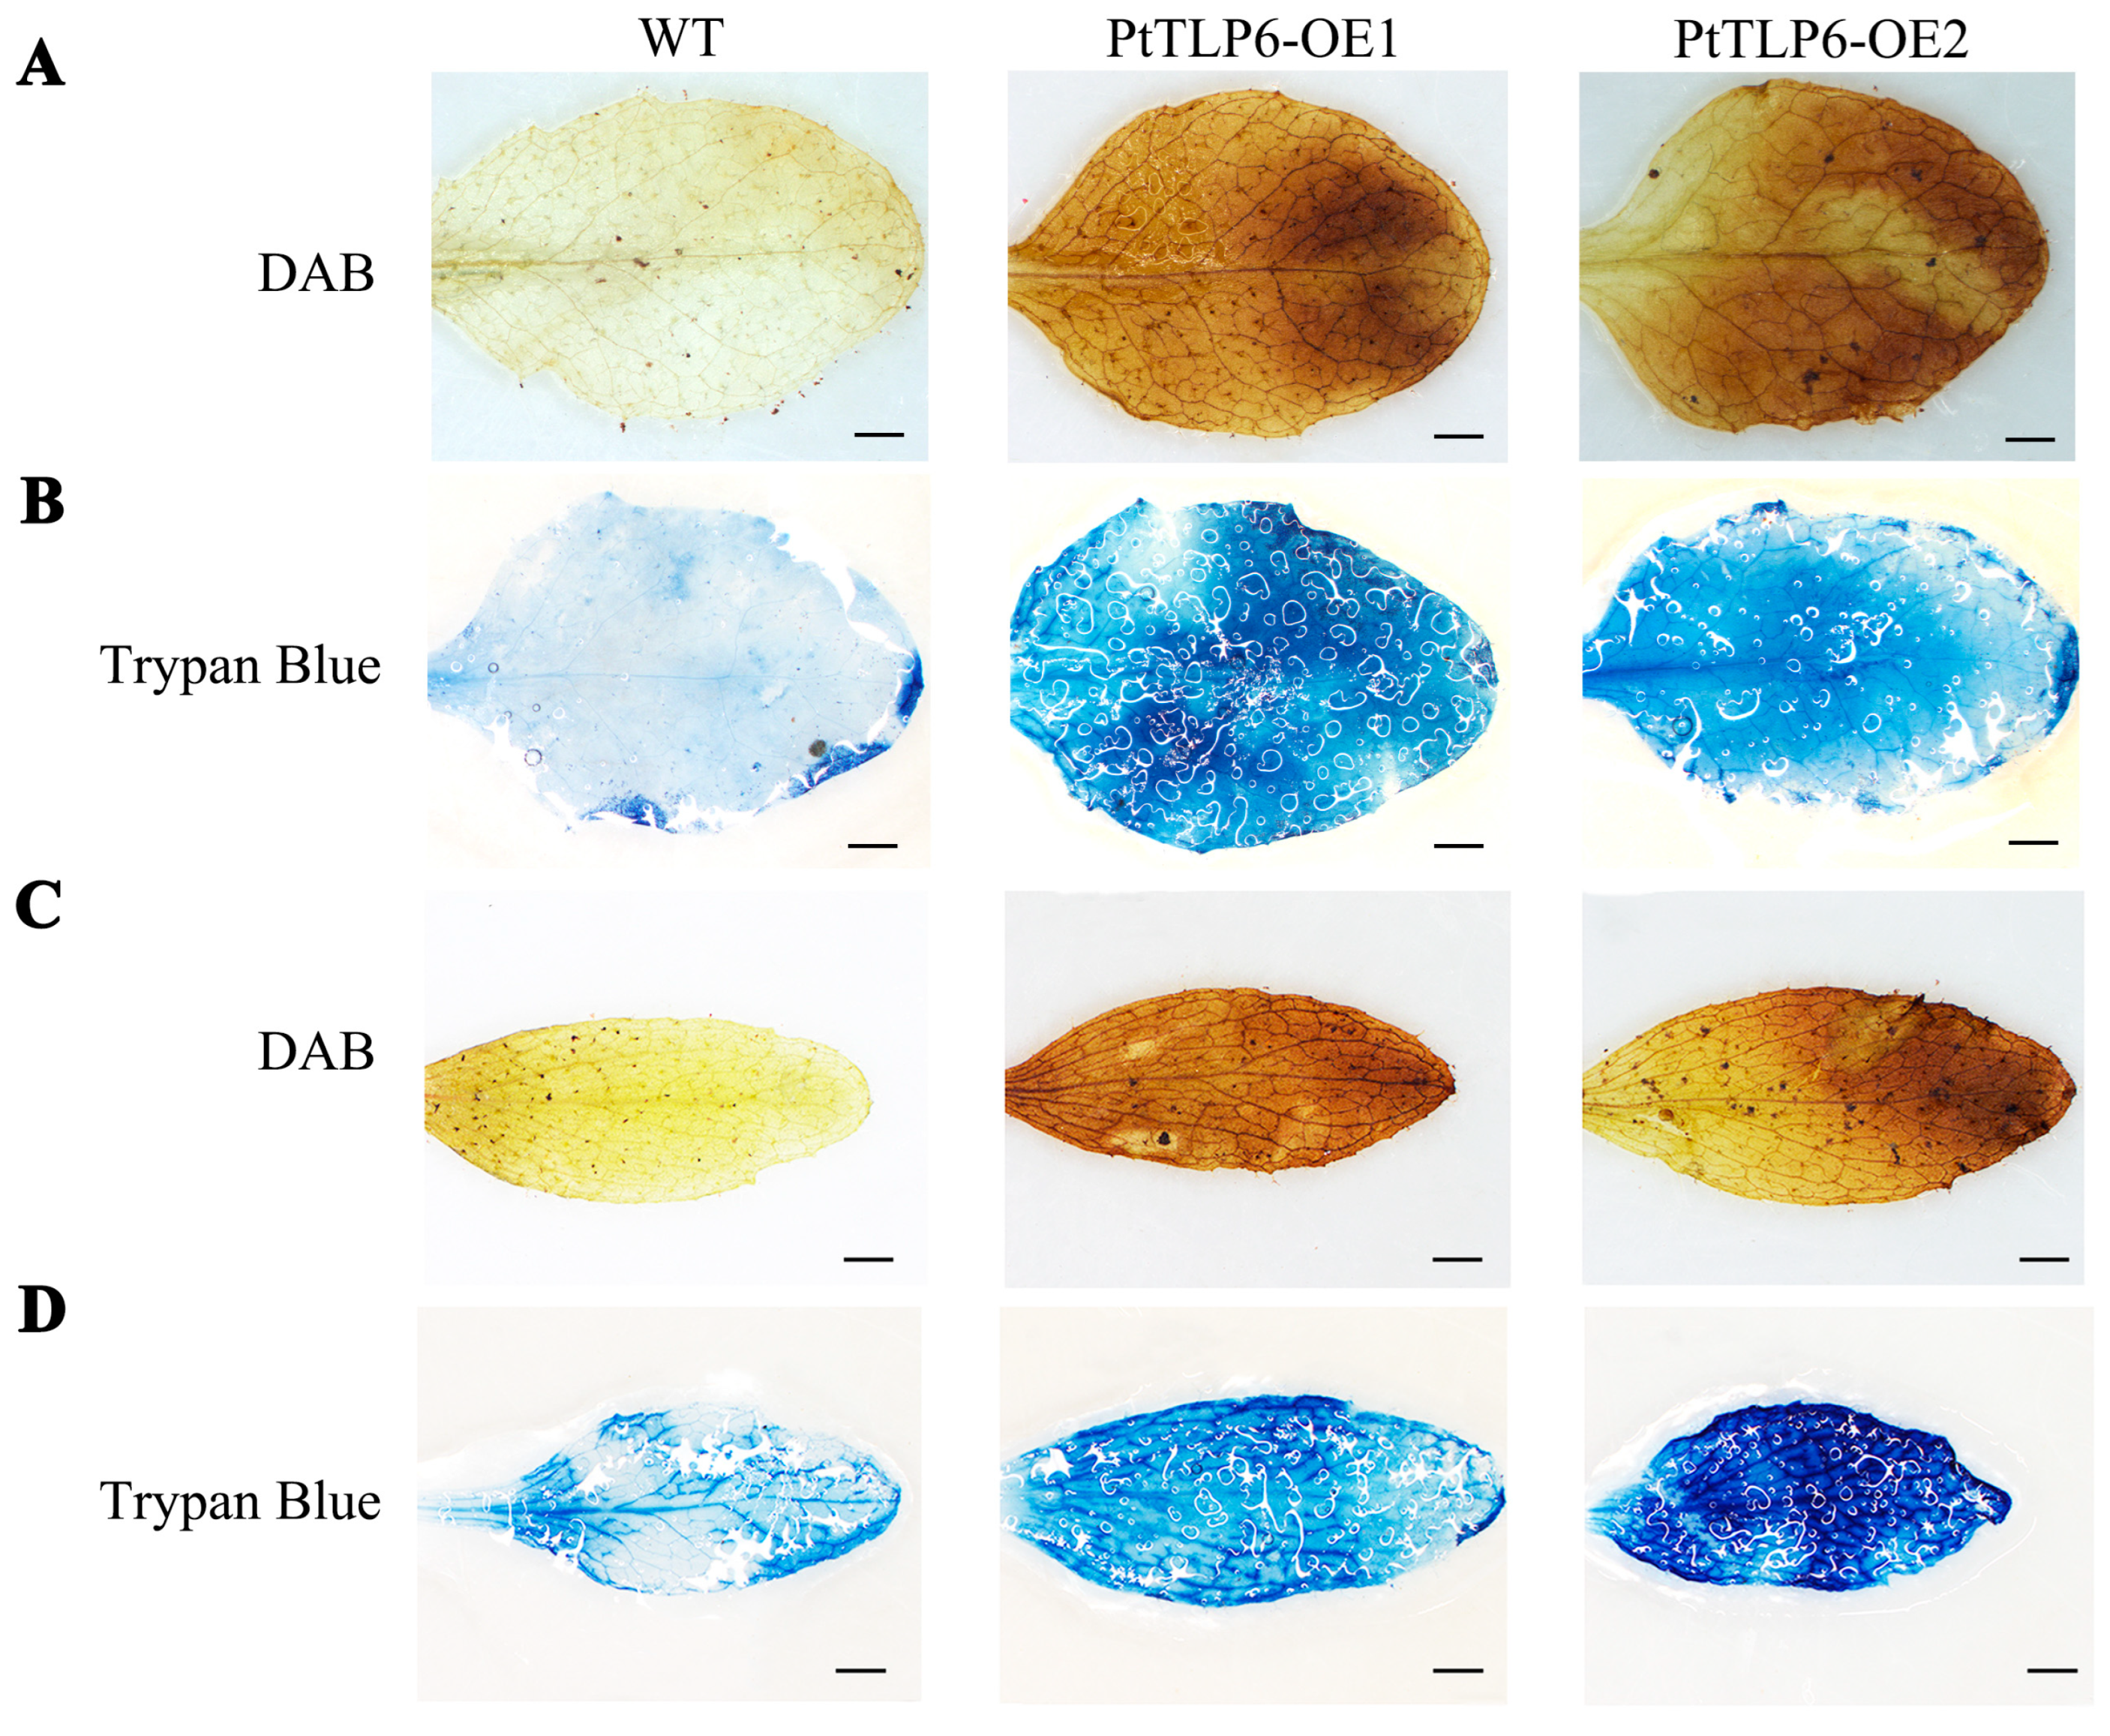
2.6. Overexpression of PtTLP6 Induces ROS Burst in Arabidopsis

In view of the advanced growth and development of PtTLP6-OE lines in comparison to the WT, we examined the ROS levels in these transgenic plants using DAB staining analysis. Both rosette and cauline leaves of the PtTLP6-OE lines showed obviously darker color than those of the WT (Figure 7A,C), indicating that the amount of hydrogen peroxide, a major ROS, was burst in PtTLP6-OE lines. Next, trypan blue staining was performed for assaying the proportion of dead cells in the rosette and cauline leaves of the WT and PtTLP6-OE lines. The data showed that compared with the WT, PtTLP6-OE lines had a much higher proportion of dead cells in the leaves (Figure 7B,D), revealing that excessively accumulated ROS might accelerate programmed cell death (PCD) in transgenic plants.

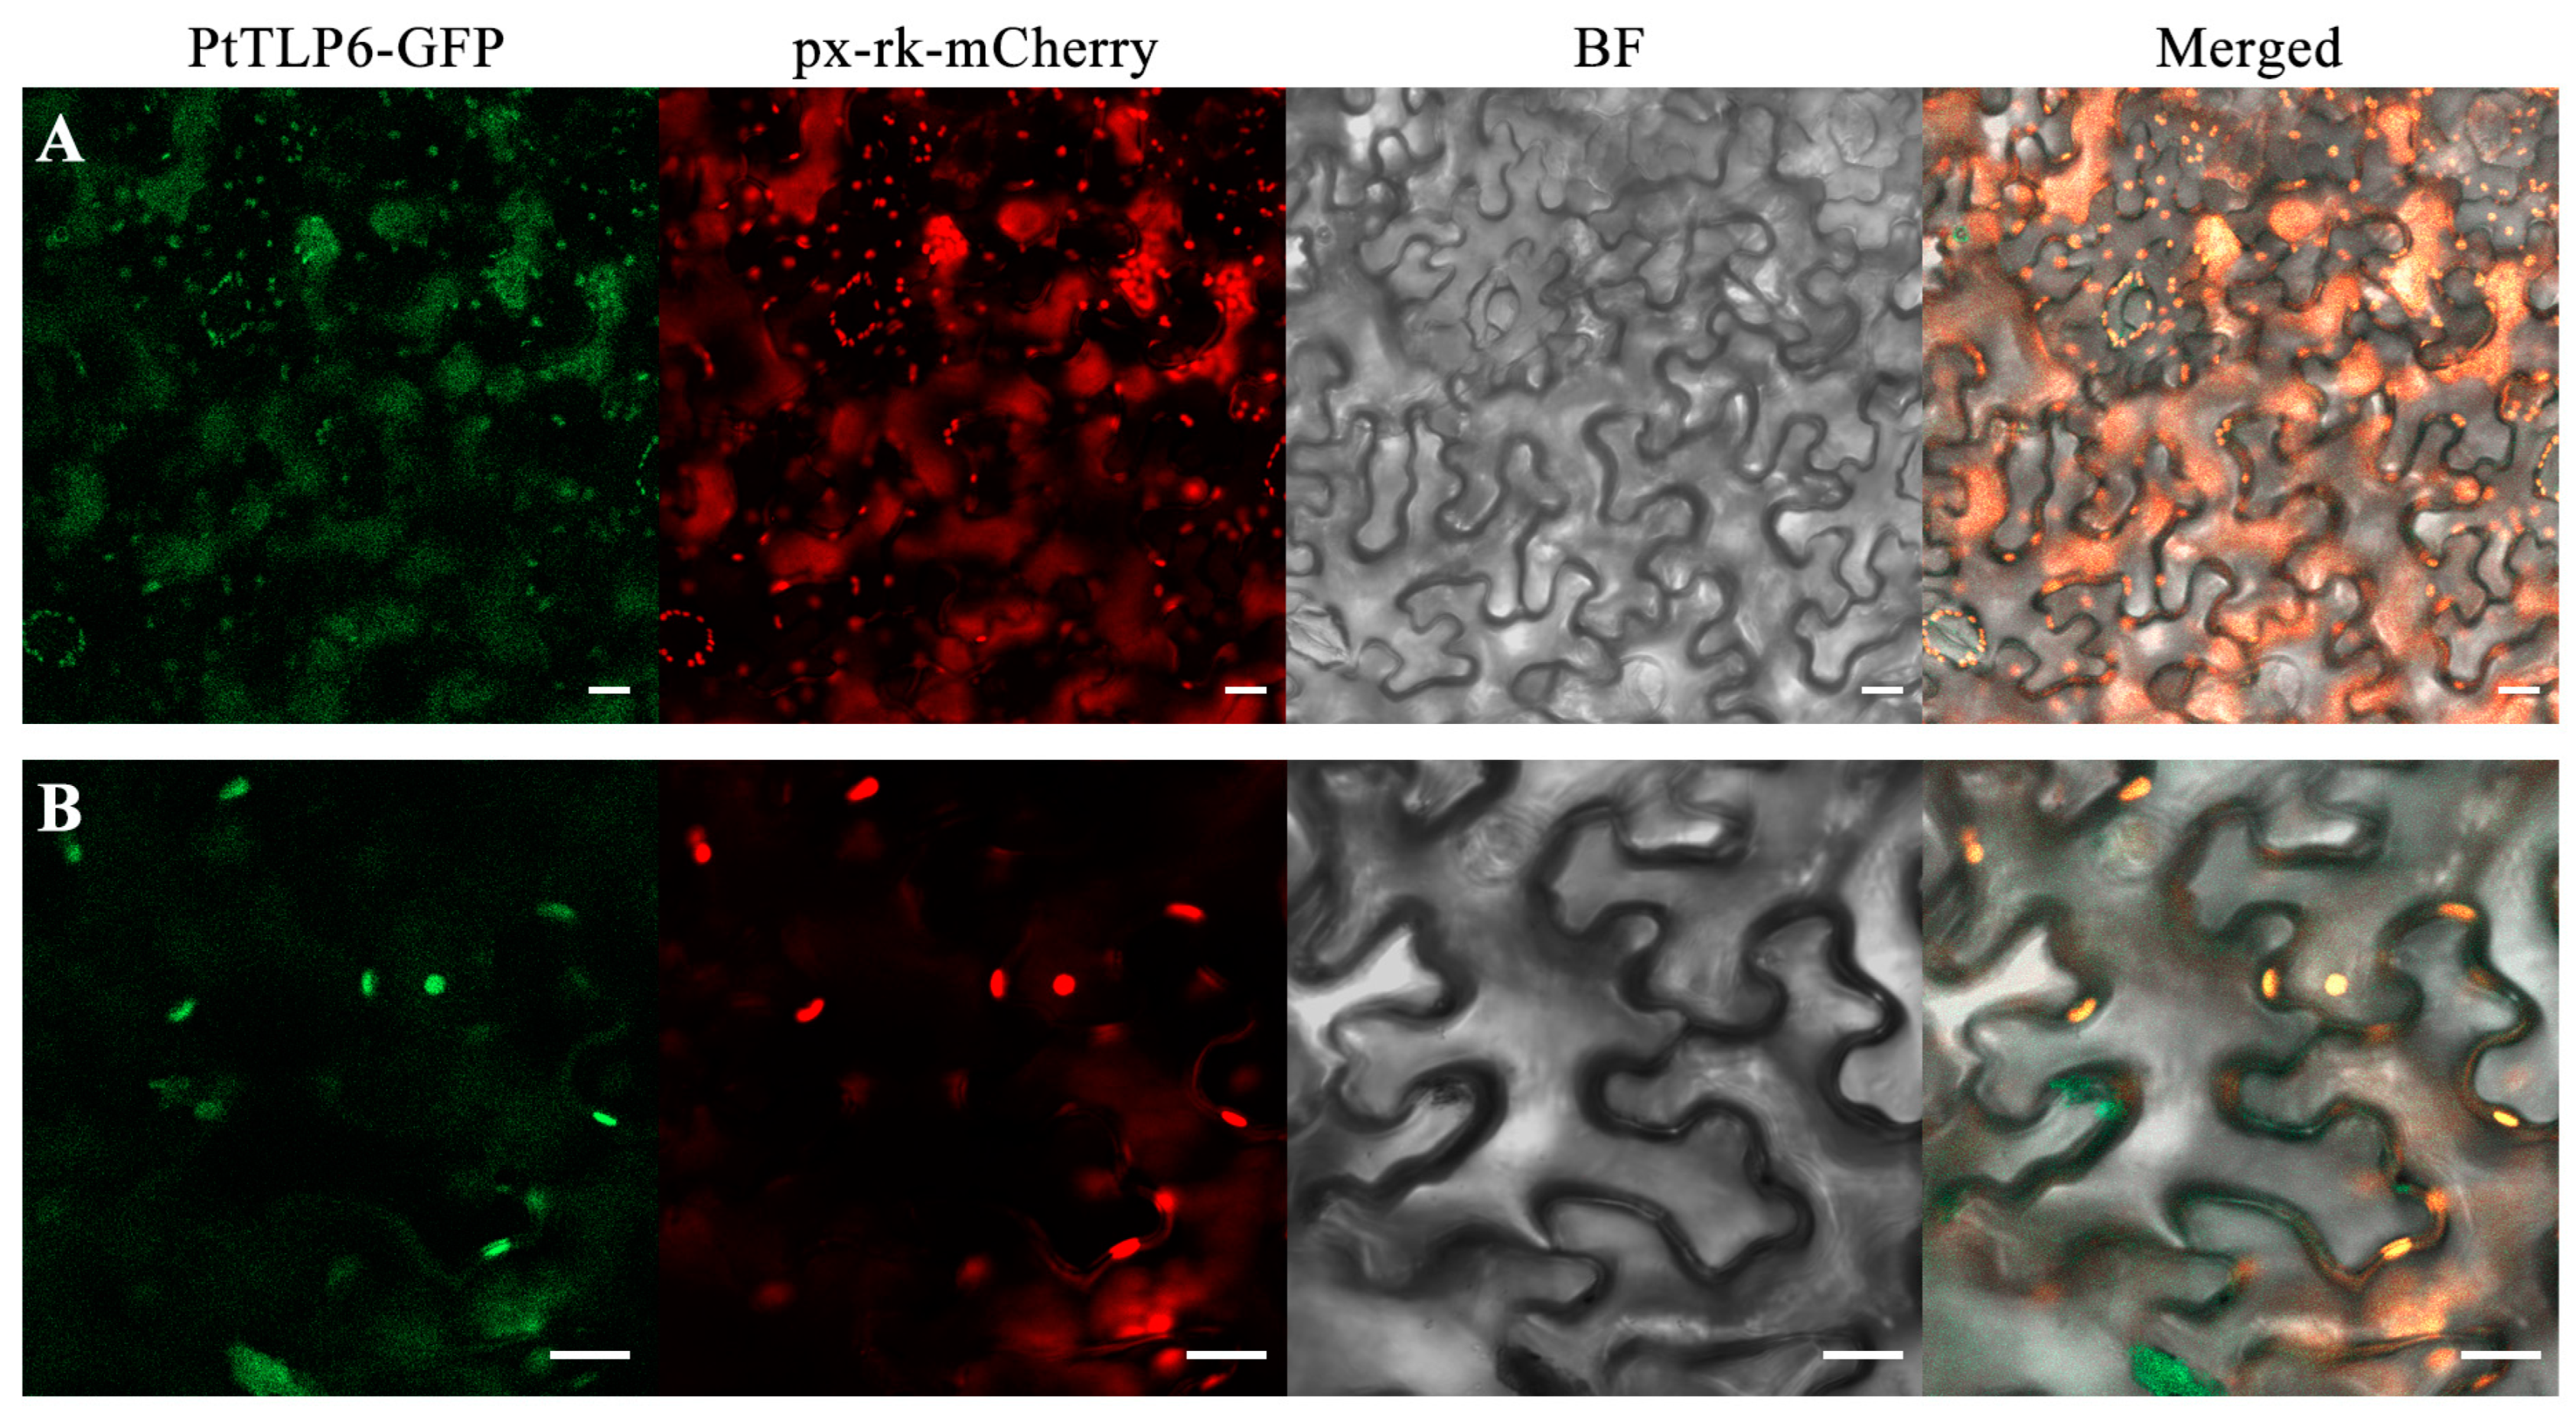
2.7. PtTLP6 Is Localized in Peroxisomes

To further understand the role of PtTLP6 in PtTLP6-OE Arabidopsis plants, we determined subcellular localization of PtTLP6 in tobacco leaf mesophyll cells. The CDS of PtTLP6 gene was fused into plant expression vector pGWB5, which contains a green fluorescent protein (GFP) gene. The resultant vector with the PtTLP6-GFP gene, the mt-rk-mCherry control vector containing the first 29 aa of yeast cytochrome c oxidase IV (ScCOX4) for mitochondria localization, and the px-rk-mCherry control vector containing peroxisomal targeting signal 1 (PTS1) for peroxisome localization were transformed into Agrobacterium tumefaciens [34,35,36] and co-transfected into the leaves of one-month-old tobacco. After one day of culture in darkness, tobacco mesophyll cells were observed under a laser confocal microscope. As a result, the fluorescence signal of PtTLP6-GFP protein completely co-localized with that of a peroxisome protein marker px-rk-mCherry (Figure 8). As a negative control, the fluorescence signal of a mitochondrial protein marker mt-rk-mCherry did not co-localize with that of PtTLP6-GFP (Figure S6). These findings reveal the localization of the PtTLP6-GFP protein in the peroxisomes of plant cells, which are the major organelle of cellular ROS production [37].

3. Discussion

In this study, we identified 49 PtTLP genes in P. trichocarpa, but a previous study presented 50 PtTLP genes [38]. One reason is that the database used here is the latest P. trichocarpa v4.1 of the Gene Atlas Project, from which many duplicate genes were deleted. In genome evolution, a gene generates two or more copies through gene duplication, which expands gene family. In the study of Liu et al. [2], 28 TLPs were shown in Arabidopsis by BLAST from genomic databases at NCBI. In fact, using the 28 TLPs as a query in the Arabidopsis Information Resource (TAIR 10), only 24 TLPs existed in the Arabidopsis genome. So, the 24 AtTLPs were included in the phylogenetic analysis of this study, which is consistent with other studies [9]. The number of PtTLP members was 49, far more than that of AtTLP members, perhaps because PtTLP genes has undergone more rounds of gene duplication. (Figure S1). Based on the phylogenetic classification of Arabidopsis TLP genes and Oryza TLP genes [23], 49 PtTLP genes were grouped into 10 clusters. In the study of Ren et al. [39], the seven clusters of wheat TLP genes were shown in the phylogenetic tree, but each did not require at least one AtTLP. In our study, each cluster of the PtTLP genes in the phylogenetic tree contains at least one AtTLP member, consistent with earlier studies [23,40]. PtTLP genes exhibit some conserved motifs, but specific motifs have evolved in different clusters, suggesting that PtTLP genes within the same cluster may share functional similarities.
Previous studies on TLP genes have focused on their functions in pathogenesis resistance. In this study, overexpression of the PtTLP6 gene led to early flowering of transgenic Arabidopsis plants. Under the same growth conditions, the OE-PtTLP6 Arabidopsis plants flower approximately 8 days earlier than the WT plants (Figure 5E). With the evolution of plants, complex flowering regulatory pathways have been formed through the interaction and mutual influence of the plant itself and external environmental factors. In Arabidopsis, studies have shown that a total of 306 genes are involved in regulating the process of flowering transition [41]. These genes have been divided into eight pathways: the photoperiod pathway, vernalization pathway, aging pathway, hormones pathway, temperature pathway, autonomous pathway, circadian clock pathway, and sugar pathway [32,33]. In our study, to seek the reasons for the early flowering in PtTLP6-OE lines, we analyzed the transcription levels in marker genes of the photoperiod pathway, autonomous pathway, vernalization pathway, and aging pathway in both the WT and PtTLP6-OE lines. The transcription levels of these genes were the same as those of the WT and PtTLP6-OE lines. Certainly, it could not be ruled out whether the expression of other flowering regulatory genes was altered in the PtTLP6-OE lines.
Our findings have revealed that PtTLP6 is specially expressed in the phloem (Figure 4). In plants, the main function of phloem is to transport photosynthetic products and a variety of signal substances to promote plant growth [42]. For example, CLE45 confers high-temperature tolerance during reproduction through its long-distance phloem transport [43]. Proteins are also important long-distance signals in the phloem vascular bundles, with a prime example being the FT protein. FT can be transported from leaves to top buds to regulate flowering time [44]. Other genes such as MRF1 have been reported to localize in the phloem and regulate flowering. Arabidopsis mrf1 mutants have shown the delayed flowering phenotype and, conversely, MRF1-overexpressing plants exhibited early flowering [45]. It has been reported that the maturity of the phloem affects the transportation of water and nutrients in plants, which could impact their growth and flowering [46]. The more mature the phloem is, the more effectively the plants are able to transport water and nutrients to the growing parts, which could promote plant growth and development.
It is possible that overexpression of PtTLP6 accelerates maturation of the phloem tissues in transgenic plants. Some TLP genes play the roles in disease resistance because of their β-1,3-glucanase activity [2]. For instance, overexpression of SlTLP5 or SlTLP6 leads to resistance to soil-borne diseases in Solanum lycopersicum by enhancing β-1,3-glucanase activity [47]. It is known that β-1,3-glucanase can promote the deposition of secondary cell wall in plants [48]. Although we have not confirmed whether PtTLP6 has the β-1,3-glucanase activity, overexpression of PtTLP6 in Arabidopsis may enhance β-1,3-glucanase activity, potentially modifying the cell walls of the phloem and ultimately leading to premature maturation of the phloem. In this case, many signal substances promoting plant growth, including FT, could be early transported through vascular system of premature phloem, which eventually brings about early flowering of PtTLP6-OE plants.
In this study, DAB staining of rosette leaves and stem leaves has revealed that the ROS levels in OE-PtTLP6 transgenic lines are higher than in WT plants (Figure 7A,C). A recent study has shown that overexpression of TaTLP1 in wheat regulates the activity of ROS-related enzymes and increases the expression of ROS burst-related genes [49]. It is well known that reactive oxygen species (ROS) can induce programmed cell death and apoptosis [50]. Maturation of the phloem vascular system is closely associated with the occurrence of programmed cell death [51]. Here, trypan blue staining has indicated that the leaves of OE-PtTLP6 plants have a much higher proportion of dead cells than those of WT (Figure 7B,D). Thus, excessively accumulated ROS presumably accelerates programmed cell death in OE-PtTLP6 plants, which advances prematurity of the vascular system in phloem.
In addition, our observations have suggested that overexpression of the PtTLP6 gene accelerates the development process of transgenic Arabidopsis plants (Figure 5F,G). It has been reported that ROS are involved in the growth of a variety of floral organs at early developmental stages, not only in the apical part of the growing tissue [52]. Treatments of litchi trees with sodium nitroprusside (SNP), NO donor, or methyl vitiliginine dichloride (MV) have increased the contents of H2O2 and NO in mixed buds, and these ROS have promoted reproductive growth by inhibiting basic leaf growth [53,54]. Compared with the WT, the level of ROS is elevated in the leaves of PtTLP6-OE transgenic plants. The ROS burst is likely to generate signals in leaves that are associated with the induction of flowering or changes in leaf metabolism in preparation for the growth of reproductive structures.
In plant cells, ROS can be generated in mitochondria, chloroplasts, and peroxisomes [55]. Since the majority of the processes carried out in peroxisomes are oxidative metabolism, peroxisome may be a major site of intracellular H2O2 production. Our findings have demonstrated that PtTLP6-GFP is localized in the peroxisomes of tobacco leaf cells (Figure 8), providing a basis of mediating intracellular H2O2 production. According to previous studies, at least two different signals directing proteins to the peroxisomal matrix have already been identified [56]. Peroxisomal targeting signal (PTS) type 1 (PTS1) is an uncleaved tripeptide (serine-lysine-leucine or variants) at the C-terminal [57], while type 2 (PTS2) is an N-terminal cleavable peptide containing 11 to 36 amino acids [58]. However, PtTLP6 does not contain these signal peptides, so further research is needed to determine how PtTLP6 is targeted to the peroxisome.
In conclusion, we have identified 49 TLP genes in P. trichocarpa and analyzed their gene structures, conserved motifs, and expression patterns. Of all, PtTLP6 is preferentially expressed in phloem, and the localization of PtTLP6-GFP is in peroxisome. Overexpression of PtTLP6 in Arabidopsis leads to early flowering, as it mediates the ROS burst in transgenic plants, which might advance plant development process. Overall, this work uncovers a novel role of the TLP genes in plant growth and development.

4. Materials and Methods

4.1. Plant Material and Growth Conditions

Wild-type P. trichocarpa (Nisqually-1) and transgenic plants were planted in the greenhouse under the long day condition (16 h light/8 h dark) at 23–25 °C of the Northeast Forestry University, China. Both wild-type and transgenic plants were propagated in vitro on WPM (Lloyd & McCown Woody Plant Basal Medium w/Vitamins; PhytoTech Lab, L449) plates supplemented with 2.5% (w/v) sucrose. Transcriptional levels of genes in different tissues were measured using 4-month-old wild-type trees, including phloem, cambium, xylem, apical bud, young leaf, mature leaf, petiole, and root.
Arabidopsis (Arabidopsis thaliana; ecotype Columbia) plants were grown in a greenhouse (16 h of light/ 8 h of dark) with a light intensity of 80–120 μmol photons m−2 s−1 at 22 °C. The Arabidopsis seeds were germinated on sterilized 1/2MS (Murashige & Skoog Basal Salt Mixture; PhytoTech Lab, Lenexa, KS, USA) plates supplemented with 1% sucrose and the seedlings were transplanted into soil, which contained a 5:3:2 ratio of black soil, perlite, and vermiculite.

4.2. Identification of the TLP Genes in P. trichocarpa

We identified the TLP gene family in the genome of P. trichocarpa by the following two methods: (1) thaumatin domain (PF00314) as a search query in the whole genome; (2) amino acid sequences of 24 known Arabidopsis TLP genes as a search query in the Phytozome 13 database. The protein sequences, genomic sequences, and coding sequences (CDS) of all TLP genes were downloaded from P. trichocarpa v4.1 (https://phytozome-next.jgi.doe.gov/info/Ptrichocarpa_v4_1; accessed on 23 September 2023) [30]. All target proteins were scanned to detect the thaumatin domain (PF00314) with the SMART database [59]. The physicochemical properties of PtTLPs, such as theoretical pI and instability, were determined by TBtools-II software (version 2.096) [60]. The subcellular localization of PtTLP genes was predicted by TargetP v2.0 [61]. The phylogenetic tree was constructed using the neighbor-joining method of MEGA11 with a bootstrap value of 1000 replicates.

4.3. Chromosomal Duplication Analyses and Gene and Protein Structure Analysis

Chromosomal locations of 49 PtTLP genes were marked on the chromosome using TBtools-II software (version 2.096) [60]. Segmental and tandem duplications are the main mechanisms leading to gene family expansion [23]. Multiple genes undergo segmental duplication, followed by chromosomal rearrangements [24], which may occur in the specific regions of chromosomes which are more prone to recombination or other types of the chromosomal rearrangement events [23], which we called duplication blocks. The duplicated blocks were utilized to elucidate the expansion of the PtTLP gene family. Based on the previous study [28], the duplicated blocks were downloaded from the Plant Genome Duplication Database (PGDD) [27]. The definition of reciprocal duplicate genes is a group of genes that are each other’s duplicate genes and are located on the replication blocks provided by PGDD [27]. Tandem duplication in the genome was defined as those closely related genes falling within 50 kb of one another [62]. If these tandem duplicate genes were duplicated recently, we name them recent tandem duplication genes. They may exhibit higher sequence similarity and may belong to the same cluster in the phylogenic tree [29]. Conversely, if the duplication event occurred long ago, they may have accumulated more mutations over time. The PtTLP genes in tandem on chromosomes were screened and outlined by blue boxes in Figure S1. The sequence alignment of homologous genes was performed using MUSCLE (https://www.ebi.ac.uk/jdispatcher/msa/muscle; accessed on 1 April 2024) [63].
Gene structures, including the organization of exon and intron, and conserved motifs, were generated with TBtools-II software [60]. Conserved motifs of the PtTLP genes were analyzed by the Multiple Expectation Maximization for Motif Elucidation (MEME) system (https://meme-suite.org/meme/doc/meme.html; accessed on 30 September 2023) [64].

4.4. Microarray Data Analysis and Extraction of RNA, RT-PCR, and RT-qPCR

Tissue-specific expression data on the PtTLP genes were downloaded from the JGI Data Portal (https://phytozome-next.jgi.doe.gov/geneatlas/; accessed on 10 October 2023) [30]. The heat map was generated by TBtools-II software [60]. Total RNAs were isolated from all samples using pBIOZOL (Bio-Flux, Beijing, China) in accordance with the manufacturer’s instructions. All isolated RNA samples were assessed for purity, and the ratios of OD260/280 and OD260/230 were greater than 1.9 for RNA samples. Then the qualified RNA samples were used to synthesize the cDNAs by reverse transcription using the PrimeScript RT Reagent Kit with gDNA Eraser (TaKaRa, Dalian, China).
Expression of the PtTLP6 gene in different tissues was examined by RT-PCR using 2 × Rapid Taq Master Mix (Vazyme, Nanjing, China). The reaction mixture contained 10 μL of Taq Master Mix, 1 μL of cDNA template, 0.5 μL of each gene-specific primer (10 μM) as well as 8 μL of distilled H2O. The PCR products were detected on the 2% agarose gels. Each reaction was performed three times to ensure the reproducibility of the results. RT-qPCR experiments were conducted using an ABI 7500 system (Applied Biosystems, Foster City, CA, USA) with SYBR Green (TaKaRa, Dalian, China). Each 20 µL reaction mixture contained 10 µL of 2 × TB Green Premix Ex Taq II (Tli RNaseH Plus), 1 µL of cDNA template, 0.4 µL of ROX Reference Dye II, 0.8 µL of each gene-specific primer, and 7 µL of distilled H2O. PtActin2 was used as an internal control, and gene expression levels were calculated using the comparative cycle threshold (Ct, 2−∆Ct) method. Three biological experiment replicates and three technical experiment replicates were performed for each outcome. All primers used for RT-qPCR and RT-PCR are listed in Table S4.

4.5. Vector Construction

The genomic DNA was extracted from the leaves of 3-month-old WT using a plant genomic DNA extraction kit (Bioteke, Beijing, China). With genomic DNA and cDNAs as templates, promoter regions (2.38 kb) and CDS of PtTLP6 were amplified by PCR and inserted into the vector pENTR/D-TOPO (Invitrogen, Carlsbad, CA, USA). After DNA sequencing, the PtTLP6 promoter fragments and CDS from the entry clones were constructed into the binary vector pGWB3, pGWB5, and pGWB11 by the Gateway LR Clonase II enzyme (Invitrogen, Carlsbad, CA, USA) to generate PtTLP6pro::GUS, 35S::PtTLP6-GFP (green fluorescent protein), and 35S::PtTLP6-FLAG constructs. All target vectors were transformed into Agrobacterium tumefaciens strain GV3101 for future transformation. All primers are listed in Table S4.

4.6. Genetic Transformation

The transformation of A. thaliana was done by the floral-dip method [65] to generate PtTLP6-OE transgenic lines. The GV3101 strains with the pGWB11 vector containing 35S::PtTLP6-FLAG were incubated overnight in YEP liquid medium supplemented with 50 µg mL−1 kanamycin, gentamicin, and rifampicin at 28 °C. When the OD600 value of the cultures reached 1.0, cell pellet was collected by centrifugation at 22,000× g for 8 min and suspended in 250 mL transformation medium (containing 0.54 g of MS, 12.5 g of sucrose, 0.125 g of MES). The flowers of wild-type Arabidopsis were dipped for 5 min in the transformation medium and incubated in the dark for 24 h. Next, light culture was resumed, and seeds were collected after maturity. The positive transformants were selected on 1/2 MS plates containing 50 µg mL−1 of kanamycin, and several transgenic lines with high transcriptional levels of PtTLP6 were further propagated.
For the P. trichocarpa transformation, the A. tumefaciens strains containing the PtTLP6pro::GUS vector were incubated overnight in 20 mL YEP liquid medium supplemented with 50 µg mL−1 kanamycin, gentamicin, and rifampicin at 200 rpm at 28 °C, until the OD600 value reached 0.8–1.0. Then, 2 mL of the bacterial cultures was inoculated into 50 mL YEP liquid medium supplemented with 50 µg mL−1 kanamycin, gentamicin, and rifampicin at 200 rpm at 28 °C, until the OD600 value reached 0.6. Cell pellet was collected by centrifugation at 2200× g for 10 min and suspended in 50 mL transformation medium (containing 0.04 g of WPM, 1.25 g of sucrose, 0.0136 g of MES). The wild-type stem explants were immersed in the transformation medium for 20 min with slight shaking, then incubated on WPM plates supplemented with 2.5% (w/v) sucrose in the dark for 48 h. Next, the stem explants were restored to light and cultured on WPM plates containing 2.5% (w/v) sucrose and 30 µg mL−1 kanamycin to screen the positive transgenic shoots. Detailed experimental procedures were carried out with reference to a previous study [66].
The transient transformation of tobacco mesophyll cells was performed in a previous study [67]; the A. tumefaciens strains with 35S::PtTLP6-GFP vector, mt-rk-mCherry control vector containing the first 29 aa of yeast cytochrome c oxidase IV (ScCOX4) for mitochondria localization, and px-rk-mCherry control vector containing peroxisomal targeting signal 1 (PTS1) for peroxisome localization [34,35,36] were all incubated overnight in 20 mL YEP liquid medium supplemented with 50 µg mL−1 kanamycin, gentamicin, and rifampicin at 200rpm at 28 °C, until the OD600 value reached 0.8. Then, 2 mL of the bacterial cultures was inoculated into 50 mL YEP liquid medium supplemented with 50 µg mL−1 kanamycin, gentamicin, and rifampicin at 200 rpm at 28 °C, until the OD600 value reached 0.5. Cell pellet was collected by centrifugation at 3000× g for 5 min and suspended in 50 mL transformation medium (containing 100 mM Mgcl2, 300 mM AS, 100 mM MES) for transient transformation. The transformation medium was then infiltrated into the air spaces of mesophyll cells of Nicotiana benthamiana leaves (also known as “agroinfiltration”), in which they transform plant cells, which in turn express the transgene within 48 h of dark culture.

4.7. GUS Staining

GUS staining analysis was performed using 3-month-old PtTLP6pro::GUS transgenic trees grown in the greenhouse, and four independent lines were analyzed to ensure reliability of the results. Consistent GUS staining results were recorded in representative transgenic lines, and wild-type plants were used as a negative control. Various tissues were incubated overnight at 37 °C in a GUS staining solution as previously described [68]. After the GUS signal was generated, chlorophyll was removed from the samples several times with 75% (v/v) ethanol. The images of the hand cross-sections of poplar leaf vein and the petiole were taken with a model SZX7 stereomicroscope (Olympus, Tokyo, Japan), and other tissues were taken by BX43 laboratory microscope (Olympus, Tokyo, Japan).

4.8. Subcellular Localization

By co-transfecting the A. tumefaciens strains containing 35S::PtTLP6-GFP vector with the A. tumefaciens strains containing mt-rk-mCherry vector for mitochondria localization or px-rk-mCherry vector for peroxisome localization [34,35,36] into tobacco leaves using agrobacterium tumefaciens-mediated transformation method mentioned above [67]. After 48 h of dark culture, the treated Nicotiana benthamiana leaves were collected and cut into little squares, avoiding the veins, to observe fluorescence under a confocal laser scanning microscope (LSM 800, Zeiss, Oberkochen, Germany), under a 488 nm excitation laser, which is the GFP specific excitation laser, showing the localization of PtTLP6-GFP, and under a 610 nm excitation laser, which is the mCherry specific excitation laser, showing the localization of mitochondria or peroxisomes. The specific localization of PtTLP6-GFP can be determined by merging the pictures under these two laser channels.

4.9. Protein Extraction and Western Blot Analysis

Plant materials were ground rapidly in liquid nitrogen and homogenized in the protein extraction buffer (5 mM DTT, 50 mM Tris-HCl, 2% SDS and 200 mM NaCl, pH 8.0) on ice for 1 h and then boiled for 10 min; after centrifugation at 14,000 rpm for 10 min, the supernatants (protein extracts) were collected for SDS-PAGE analysis. Total proteins were separated on a 10% SDS-PAGE gel and transferred into a PVDF membrane. The membrane was blocked in blocking solution overnight at 4 °C. Detailed experimental procedures were carried out as described previously [69]. The signals were captured by ECL Western Blotting Substrate (Thermo Fisher Scientific, Waltham, MA, USA) by exposure to X-ray films.

4.10. Histochemical Determination of H2O2

Leaves of the PtTLP6-OE Arabidopsis were treated with 3,3′-diaminobiline (DAB) solution: 1 mg/mL DAB, pH 3.8 [70]. In the presence of peroxidase, DAB can react with H2O2 to form a dark-brown polymerization product. After removing chlorophyll in leaves by boiling with a glycerol/acetic acid/ethanol (1:1:3, v/v/v) solution; the dark-brown product could be imaged with a model SZX7 stereo microscope (Olympus, Tokyo, Japan). Three biological experiment replicates and three technical experiment replicates were performed to ensure the reliability of the results.

4.11. Trypan Blue Staining

Trypan blue staining assay was performed as previously described [71]. In brief, leaves were immersed in trypan blue staining solution, containing 10 g phenol, 20 mL H2O, 10 mL lactic acid, 10 mL glycerol, and 10 mg trypan blue, boiled for 1–2 min, and then cooled down at room temperature for at least 1 h. Stained leaves were immersed in the chloral hydrate solution (50 g chloral hydrate dissolved in 20 mL water) and finally equilibrated with 70% glycerol. Three biological experiments and three technical experiment replicates were performed to ensure the reliability of the results.

4.12. Statistical Analysis

All data analyses and statistical tests were conducted by SPSS version 24.0. Values are displayed as the means ± standard deviation (SD), and the number of asterisks indicates statistical significance at different levels (* p < 0.05 and ** p < 0.01).

Supplementary Materials

The following supporting information can be downloaded at: https://www.mdpi.com/article/10.3390/ijms25115990/s1.

Author Contributions

M.G. and Y.C. designed the experiment; M.G. and S.X. performed the experiment; M.G., S.X., J.C., W.X., N.I.E. and X.M. performed data analysis; M.G. and Y.C. wrote the manuscript; Y.C. performed review and editing. All authors have read and agreed to the published version of the manuscript.

Funding

This work was financially supported by the Fundamental Research Funds for the Central Universities (2572021DT01), the China Postdoctoral Science Foundation (2022M710644), and the Heilongjiang Postdoctoral Fund (LBH-Z21034).

Institutional Review Board Statement

Not applicable.

Informed Consent Statement

Not applicable.

Data Availability Statement

Data is contained within the article and Supplementary Materials.

Conflicts of Interest

The authors declare no conflicts of interest.

References

  1. Selitrennikoff, C.P. Antifungal proteins. Appl. Environ. Microbiol. 2001, 67, 2883–2894. [Google Scholar] [CrossRef]
  2. Liu, J.J.; Sturrock, R.; Ekramoddoullah, A.K. The superfamily of thaumatin-like proteins: Its origin, evolution, and expression towards biological function. Plant Cell Rep. 2010, 29, 419–436. [Google Scholar] [CrossRef]
  3. Brandazza, A.; Angeli, S.; Tegoni, M.; Cambillau, C.; Pelosi, P. Plant stress proteins of the thaumatin-like family discovered in animals. FEBS Lett. 2004, 572, 3–7. [Google Scholar] [CrossRef]
  4. Li, Z.; Wang, X.; Cui, Y.; Qiao, K.; Zhu, L.; Fan, S.; Ma, Q. Comprehensive genome-wide analysis of thaumatin-like gene family in four cotton species and functional identification of GhTLP19 involved in regulating tolerance to Verticillium dahlia and drought. Front. Plant Sci. 2020, 11, 575015. [Google Scholar] [CrossRef]
  5. Liu, Q.; Sui, X.; Wang, Y.; Zhu, M.; Zhou, Y.; Gao, F. Genome-wide analyses of thaumatin-like protein family genes reveal the involvement in the response to low-temperature stress in Ammopiptanthus nanus. Int. J. Mol. Sci. 2023, 24, 2209. [Google Scholar] [CrossRef]
  6. Kuwabara, C.; Takezawa, D.; Shimada, T.; Hamada, T.; Fujikawa, S.; Arakawa, K. Abscisic acid- and cold-induced thaumatin-like protein in winter wheat has an antifungal activity against snow mould, Microdochium nivale. Physiol. Plant 2002, 115, 101–110. [Google Scholar] [CrossRef]
  7. Grenier, J.; Potvin, C.; Trudel, J.; Asselin, A. Some thaumatin-like proteins hydrolyse polymeric beta-1,3-glucans. Plant J. 1999, 19, 473–480. [Google Scholar] [CrossRef]
  8. Kitajima, S.; Sato, F. Plant pathogenesis-related proteins: Molecular mechanisms of gene expression and protein function. J. Biochem. 1999, 125, 1–8. [Google Scholar] [CrossRef]
  9. Cao, J.; Lv, Y.; Hou, Z.; Li, X.; Ding, L. Expansion and evolution of thaumatin-like protein (TLP) gene family in six plants. Plant Growth Regul. 2016, 79, 299–307. [Google Scholar] [CrossRef]
  10. Li, X.; Blackman, C.J.; Choat, B.; Rymer, P.D.; Medlyn, B.E.; Tissue, D.T. Drought tolerance traits do not vary across sites differing in water availability in Banksia serrata (Proteaceae). Funct. Plant Biol. 2019, 46, 624–633. [Google Scholar] [CrossRef]
  11. Jayasankar, S.; Li, Z.; Gray, D.J. Constitutive expression of Vitis vinifera thaumatin-like protein after in vitro selection and its role in anthracnose resistance. Funct. Plant Biol. 2003, 30, 1105–1115. [Google Scholar] [CrossRef]
  12. Yan, X.; Qiao, H.; Zhang, X.; Guo, C.; Wang, M.; Wang, Y.; Wang, X. Analysis of the grape (Vitis vinifera L.) thaumatin-like protein (TLP) gene family and demonstration that TLP29 contributes to disease resistance. Sci. Rep. 2017, 7, 4269. [Google Scholar] [CrossRef]
  13. Misra, R.C.; Sandeep Kamthan, M.; Kumar, S.; Ghosh, S. A thaumatin-like protein of Ocimum basilicum confers tolerance to fungal pathogen and abiotic stress in transgenic Arabidopsis. Sci. Rep. 2016, 6, 25340. [Google Scholar] [CrossRef]
  14. Rout, E.; Nanda, S.; Joshi, R.K. Molecular characterization and heterologous expression of a pathogen induced PR5 gene from garlic (Allium sativum L.) conferring enhanced resistance to necrotrophic fungi. Eur. J. Plant Pathol. 2016, 144, 345–360. [Google Scholar] [CrossRef]
  15. Munis, M.F.; Tu, L.; Deng, F.; Tan, J.; Xu, L.; Xu, S.; Long, L.; Zhang, X. A thaumatin-like protein gene involved in cotton fiber secondary cell wall development enhances resistance against Verticillium dahliae and other stresses in transgenic tobacco. Biochem. Biophys. Res. Commun. 2010, 393, 38–44. [Google Scholar] [CrossRef]
  16. Neale, A.D.; Wahleithner, J.A.; Lund, M.; Bonnett, H.T.; Kelly, A.; Meeks-Wagner, D.R.; Peacock, W.J.; Dennis, E.S. Chitinase, beta-1,3-glucanase, osmotin, and extensin are expressed in tobacco explants during flower formation. Plant Cell 1990, 2, 673–684. [Google Scholar] [CrossRef]
  17. Seo, P.J.; Lee, A.K.; Xiang, F.; Park, C.M. Molecular and functional profiling of Arabidopsis pathogenesis-related genes: Insights into their roles in salt response of seed germination. Plant Cell Physiol. 2008, 49, 334–344. [Google Scholar] [CrossRef]
  18. Ogata, C.M.; Gordon, P.F.; de Vos, A.M.; Kim, S.H. Crystal structure of a sweet tasting protein thaumatin I, at 1.65 A resolution. J. Mol. Biol. 1992, 228, 893–908. [Google Scholar] [CrossRef]
  19. Batalia, M.A.; Monzingo, A.F.; Ernst, S.; Roberts, W.; Robertus, J.D. The crystal structure of the antifungal protein zeamatin, a member of the thaumatin-like, PR-5 protein family. Nat. Struct. Biol. 1996, 3, 19–23. [Google Scholar] [CrossRef]
  20. Koiwa, H.; Kato, H.; Nakatsu, T.; Oda, J.; Yamada, Y.; Sato, F. Crystal structure of tobacco PR-5d protein at 1.8 A resolution reveals a conserved acidic cleft structure in antifungal thaumatin-like proteins. J. Mol. Biol. 1999, 286, 1137–1145. [Google Scholar] [CrossRef]
  21. Min, K.; Ha, S.C.; Hasegawa, P.M.; Bressan, R.A.; Yun, D.J.; Kim, K.K. Crystal structure of osmotin, a plant antifungal protein. Proteins 2004, 54, 170–173. [Google Scholar] [CrossRef]
  22. Ghosh, R.; Chakrabarti, C. Crystal structure analysis of NP24-I: A thaumatin-like protein. Planta 2008, 228, 883–890. [Google Scholar] [CrossRef]
  23. Shatters, R.G., Jr.; Boykin, L.M.; Lapointe, S.L.; Hunter, W.B.; Weathersbee, A.A., 3rd. Phylogenetic and structural relationships of the PR5 gene family reveal an ancient multigene family conserved in plants and select animal taxa. J. Mol. Evol. 2006, 63, 12–29. [Google Scholar] [CrossRef]
  24. Cannon, S.B.; Mitra, A.; Baumgarten, A.; Young, N.D.; May, G. The roles of segmental and tandem gene duplication in the evolution of large gene families in Arabidopsis thaliana. BMC Plant Biol. 2004, 4, 10. [Google Scholar] [CrossRef]
  25. Yu, J.; Wang, J.; Lin, W.; Li, S.; Li, H.; Zhou, J.; Ni, P.; Dong, W.; Hu, S.; Zeng, C.; et al. The genomes of Oryza sativa: A history of duplications. PLoS Biol. 2005, 3, e38. [Google Scholar] [CrossRef] [PubMed]
  26. Ramamoorthy, R.; Jiang, S.Y.; Kumar, N.; Venkatesh, P.N.; Ramachandran, S. A comprehensive transcriptional profiling of the WRKY gene family in rice under various abiotic and phytohormone treatments. Plant Cell Physiol. 2008, 49, 865–879. [Google Scholar] [CrossRef]
  27. Lee, T.H.; Tang, H.; Wang, X.; Paterson, A.H. PGDD: A database of gene and genome duplication in plants. Nucleic Acids Res. 2013, 41, 1152–1158. [Google Scholar] [CrossRef]
  28. Tuskan, G.A.; Difazio, S.; Jansson, S.; Bohlmann, J.; Grigoriev, I.; Hellsten, U.; Putnam, N.; Ralph, S.; Rombauts, S.; Salamov, A.; et al. The genome of black cottonwood, Populus trichocarpa (Torr. & Gray). Science 2006, 313, 1596–1604. [Google Scholar] [CrossRef] [PubMed]
  29. Liu, J.J.; Zamani, A.; Ekramoddoullah, A.K. Expression profiling of a complex thaumatin-like protein family in western white pine. Planta 2010, 231, 637–651. [Google Scholar] [CrossRef] [PubMed]
  30. Sreedasyam, A.; Plott, C.; Hossain, M.S.; Lovell, J.T.; Grimwood, J.; Jenkins, J.W.; Daum, C.; Barry, K.; Carlson, J.; Shu, S.; et al. JGI Plant Gene Atlas: An updateable transcriptome resource to improve functional gene descriptions across the plant kingdom. Nucleic Acids Res. 2023, 51, 8383–8401. [Google Scholar] [CrossRef] [PubMed]
  31. De Rybel, B.; Mähönen, A.P.; Helariutta, Y.; Weijers, D. Plant vascular development: From early specification to differentiation. Nat. Rev. Mol. Cell. Biol. 2016, 17, 30–40. [Google Scholar] [CrossRef] [PubMed]
  32. Fornara, F.; de Montaigu, A.; Coupland, G. SnapShot: Control of flowering in Arabidopsis. Cell 2010, 141, 550–550.e2. [Google Scholar] [CrossRef] [PubMed]
  33. Srikanth, A.; Schmid, M. Regulation of flowering time: All roads lead to Rome. Cell Mol. Life Sci. 2011, 68, 2013–2037. [Google Scholar] [CrossRef] [PubMed]
  34. Köhler, R.H.; Zipfel, W.R.; Webb, W.W.; Hanson, M.R. The green fluorescent protein as a marker to visualize plant mitochondria in vivo. Plant J. 1997, 11, 613–621. [Google Scholar] [CrossRef] [PubMed]
  35. Dabney-Smith, C.; van Den Wijngaard, P.W.; Treece, Y.; Vredenberg, W.J.; Bruce, B.D. The C terminus of a chloroplast precursor modulates its interaction with the translocation apparatus and PIRAC. J. Biol. Chem. 1999, 274, 32351–32359. [Google Scholar] [CrossRef] [PubMed]
  36. Nelson, B.K.; Cai, X.; Nebenführ, A. A multicolored set of in vivo organelle markers for co-localization studies in Arabidopsis and other plants. Plant J. 2007, 51, 1126–1136. [Google Scholar] [CrossRef] [PubMed]
  37. Del Río, L.A.; López-Huertas, E. ROS generation in peroxisomes and its role in cell signaling. Plant Cell Physiol. 2016, 57, 1364–1376. [Google Scholar] [CrossRef] [PubMed]
  38. Liu, Y.; Cui, J.; Zhou, X.; Luan, Y.; Luan, F. Genome-wide identification, characterization and expression analysis of the TLP gene family in melon (Cucumis melo L.). Genomics 2020, 112, 2499–2509. [Google Scholar] [CrossRef] [PubMed]
  39. Ren, R.; Zhou, X.; Zhang, X.; Li, X.; Zhang, P.; He, Y. Genome-wide identification and characterization of thaumatin-like protein family genes in wheat and analysis of their responses to Fusarium head blight infection. Food Prod. Process. Nutr. 2022, 4, 24. [Google Scholar] [CrossRef]
  40. Zhao, J.P.; Su, X.H. Patterns of molecular evolution and predicted function in thaumatin-like proteins of Populus trichocarpa. Planta 2010, 232, 949–962. [Google Scholar] [CrossRef]
  41. Bouché, F.; Lobet, G.; Tocquin, P.; Périlleux, C. FLOR-ID: An interactive database of flowering-time gene networks in Arabidopsis thaliana. Nucleic Acids Res. 2016, 44, D1167–D1171. [Google Scholar] [CrossRef] [PubMed]
  42. De Schepper, V.; De Swaef, T.; Bauweraerts, I.; Steppe, K. Phloem transport: A review of mechanisms and controls. J. Exp. Bot. 2013, 64, 4839–4850. [Google Scholar] [CrossRef] [PubMed]
  43. Endo, S.; Shinohara, H.; Matsubayashi, Y.; Fukuda, H. A novel pollen-pistil interaction conferring high-temperature tolerance during reproduction via CLE45 signaling. Curr. Biol. 2013, 23, 1670–1676. [Google Scholar] [CrossRef] [PubMed]
  44. Corbesier, L.; Vincent, C.; Jang, S.; Fornara, F.; Fan, Q.; Searle, I.; Giakountis, A.; Farrona, S.; Gissot, L.; Turnbull, C.; et al. FT protein movement contributes to long-distance signaling in floral induction of Arabidopsis. Science 2007, 316, 1030–1033. [Google Scholar] [CrossRef] [PubMed]
  45. You, Y.; Sawikowska, A.; Lee, J.E.; Benstein, R.M.; Neumann, M.; Krajewski, P.; Schmid, M. Phloem companion cell-specific transcriptomic and epigenomic analyses identify MRF1, a regulator of flowering. Plant Cell 2019, 31, 325–345. [Google Scholar] [CrossRef] [PubMed]
  46. Hardtke, C.S. Phloem development. New Phytol. 2023, 239, 852–867. [Google Scholar] [CrossRef]
  47. Li, X.; Xu, B.; Xu, J.; Li, Z.; Jiang, C.; Zhou, Y.; Yang, Z.; Deng, M.; Lv, J.; Zhao, K. Tomato-thaumatin-like protein genes Solyc08g080660 and Solyc08g080670 confer resistance to five soil-borne diseases by enhancing β-1,3-glucanase activity. Genes 2023, 14, 1622. [Google Scholar] [CrossRef] [PubMed]
  48. Fang, S.; Shang, X.; He, Q.; Li, W.; Song, X.; Zhang, B.; Guo, W. A cell wall-localized β-1,3-glucanase promotes fiber cell elongation and secondary cell wall deposition. Plant Physiol. 2023, 194, 106–123. [Google Scholar] [CrossRef]
  49. Wang, F.; Shen, S.; Cui, Z.; Yuan, S.; Qu, P.; Jia, H.; Meng, L.; Hao, X.; Liu, D.; Ma, L.; et al. Puccinia triticina effector protein Pt_21 interacts with wheat thaumatin-like protein TaTLP1 to inhibit its antifungal activity and suppress wheat apoplast immunity. Crop J. 2023, 11, 1431–1440. [Google Scholar] [CrossRef]
  50. Ye, C.; Zheng, S.; Jiang, D.; Lu, J.; Huang, Z.; Liu, Z.; Zhou, H.; Zhuang, C.; Li, J. Initiation and execution of programmed cell death and regulation of reactive oxygen species in plants. Int. J. Mol. Sci. 2021, 22, 12942. [Google Scholar] [CrossRef]
  51. Mittler, R.; Lam, E. In situ detection of nDNA fragmentation during the differentiation of tracheary elements in higher plants. Plant Physiol. 1995, 108, 489–493. [Google Scholar] [CrossRef]
  52. Lee, J.; Chen, H.; Lee, G.; Emonet, A.; Kim, S.G.; Shim, D.; Lee, Y. MSD2-mediated ROS metabolism fine-tunes the timing of floral organ abscission in Arabidopsis. New Phytol. 2022, 235, 2466–2480. [Google Scholar] [CrossRef] [PubMed]
  53. Lu, X.; Li, J.; Chen, H.; Hu, J.; Liu, P.; Zhou, B. RNA-seq analysis of apical meristem reveals integrative regulatory network of ROS and chilling potentially related to flowering in Litchi chinensis. Sci. Rep. 2017, 7, 10183. [Google Scholar] [CrossRef] [PubMed]
  54. Zhou, B.; Li, N.; Zhang, Z.; Huang, X.; Chen, H.; Hu, Z.; Pang, X.; Liu, W.; Lu, Y. Hydrogen peroxide and nitric oxide promote reproductive growth in Litchi chinensis. Biol. Plant. 2012, 56, 321–329. [Google Scholar] [CrossRef]
  55. Zimmermann, P.; Heinlein, C.; Orendi, G.; Zentgraf, U. Senescence-specific regulation of catalases in Arabidopsis thaliana (L.) Heynh. Plant Cell Environ. 2006, 29, 1049–1060. [Google Scholar] [CrossRef] [PubMed]
  56. Otera, H.; Okumoto, K.; Tateishi, K.; Ikoma, Y.; Matsuda, E.; Nishimura, M.; Tsukamoto, T.; Osumi, T.; Ohashi, K.; Higuchi, O.; et al. Peroxisome targeting signal type 1 (PTS1) receptor is involved in import of both PTS1 and PTS2: Studies with PEX5-defective CHO cell mutants. Mol. Cell. Biol. 1998, 18, 388–399. [Google Scholar] [CrossRef] [PubMed]
  57. Miura, S.; Kasuya-Arai, I.; Mori, H.; Miyazawa, S.; Osumi, T.; Hashimoto, T.; Fujiki, Y. Carboxyl-terminal consensus Ser-Lys-Leu-related tripeptide of peroxisomal proteins functions in vitro as a minimal peroxisome-targeting signal. J. Biol. Chem. 1992, 267, 14405–14411. [Google Scholar] [CrossRef] [PubMed]
  58. Osumi, T.; Tsukamoto, T.; Hata, S.; Yokota, S.; Miura, S.; Fujiki, Y.; Hijikata, M.; Miyazawa, S.; Hashimoto, T. Amino-terminal presequence of the precursor of peroxisomal 3-ketoacyl-CoA thiolase is a cleavable signal peptide for peroxisomal targeting. Biochem. Biophys. Res. Commun. 1991, 181, 947–954. [Google Scholar] [CrossRef]
  59. Letunic, I.; Copley, R.R.; Schmidt, S.; Ciccarelli, F.D.; Doerks, T.; Schultz, J.; Ponting, C.P.; Bork, P. SMART 4.0: Towards genomic data integration. Nucleic Acids Res. 2004, 32, 142–144. [Google Scholar] [CrossRef]
  60. Chen, C.; Wu, Y.; Li, J.; Wang, X.; Zeng, Z.; Xu, J.; Liu, Y.; Feng, J.; Chen, H.; He, Y.; et al. TBtools-II: A “one for all, all for one” bioinformatics platform for biological big-data mining. Mol. Plant 2023, 16, 1733–1742. [Google Scholar] [CrossRef]
  61. Almagro Armenteros, J.J.; Salvatore, M.; Emanuelsson, O.; von Heijne, G.; Elofsson, A.; Nielsen, H. Detecting sequence signals in targeting peptides using deep learning. Life Sci. Alliance 2019, 2, e201900429. [Google Scholar] [CrossRef] [PubMed]
  62. Riechmann, J.L.; Heard, J.; Martin, G.; Reuber, L.; Jiang, C.; Keddie, J.; Adam, L.; Pineda, O.; Ratcliffe, O.J.; Samaha, R.R.; et al. Arabidopsis transcription factors: Genome-wide comparative analysis among eukaryotes. Science 2000, 290, 2105–2110. [Google Scholar] [CrossRef] [PubMed]
  63. Madeira, F.; Pearce, M.; Tivey, A.R.N.; Basutkar, P.; Lee, J.; Edbali, O.; Madhusoodanan, N.; Kolesnikov, A.; Lopez, R. Search and sequence analysis tools services from EMBL-EBI in 2022. Nucleic Acids Res. 2022, 50, 276–279. [Google Scholar] [CrossRef] [PubMed]
  64. Bailey, T.L.; Boden, M.; Buske, F.A.; Frith, M.; Grant, C.E.; Clementi, L.; Ren, J.; Li, W.W.; Noble, W.S. MEME SUITE: Tools for motif discovery and searching. Nucleic Acids Res. 2009, 37, 202–208. [Google Scholar] [CrossRef] [PubMed]
  65. Clough, S.J.; Bent, A.F. Floral dip: A simplified method for Agrobacterium-mediated transformation of Arabidopsis thaliana. Plant J. 1998, 16, 735–743. [Google Scholar] [CrossRef] [PubMed]
  66. Li, S.; Zhen, C.; Xu, W.; Wang, C.; Cheng, Y. Simple, rapid and efficient transformation of genotype Nisqually-1: A basic tool for the first sequenced model tree. Sci. Rep. 2017, 7, 2638. [Google Scholar] [CrossRef]
  67. Rolland, V. Determining the subcellular localization of fluorescently tagged proteins using protoplasts extracted from transiently transformed Nicotiana benthamiana Leaves. Methods Mol. Biol. 2018, 1770, 263–283. [Google Scholar] [CrossRef]
  68. Cao, S.; Guo, M.; Cheng, J.; Cheng, H.; Liu, X.; Ji, H.; Liu, G.; Cheng, Y.; Yang, C. Aspartic proteases modulate programmed cell death and secondary cell wall synthesis during wood formation in poplar. J. Exp. Bot. 2022, 73, 6876–6890. [Google Scholar] [CrossRef]
  69. Cheng, H.; Liu, J.; Zhou, M.; Cheng, Y. Lectin affinity-based glycoproteome analysis of the developing xylem in poplar. For. Res. 2022, 2, 13. [Google Scholar] [CrossRef]
  70. Liu, Y.H.; Offler, C.E.; Ruan, Y.L. A simple, rapid, and reliable protocol to localize hydrogen peroxide in large plant organs by DAB-mediated tissue printing. Front. Plant Sci. 2014, 5, 745. [Google Scholar] [CrossRef]
  71. Bowling, S.A.; Clarke, J.D.; Liu, Y.; Klessig, D.F.; Dong, X. The cpr5 mutant of Arabidopsis expresses both NPR1-dependent and NPR1-independent resistance. Plant Cell 1997, 9, 1573–1584. [Google Scholar] [CrossRef] [PubMed]
Figure 1. Phylogenetic analysis of Populus and Arabidopsis TLP genes. A total of 49 PtTLP genes and 24 AtTLP genes were aligned with Clustal W, and the phylogenic tree was constructed by MEGA 11 using the neighbor-joining method with 1000 bootstrap replication. All TLP genes were classified into ten clusters with different colors. The branch lengths of the phylogenetic tree represent genetic distance; the scale represents 0.1.
Ijms 25 05990 g001
Figure 2. Phylogenetic tree, protein motif, and gene structure of 49 PtTLPs genes. (A) Phylogenetic tree. Branch lengths represent genetic distances, and the scale bar represents 0.1. We labeled cluster I–X and marked them with boxes of different colors. (B) Protein motifs. Conserved motifs 1–15 are represented by colored boxes, while non-conserved sequences are indicated by gray lines. (C) Gene structure. Yellow boxes represent exons, black lines represent introns, and untranslated regions (UTRs) are showed by green boxes. The sizes of the exons and introns can be estimated by the scale at the bottom.
Ijms 25 05990 g002
Figure 3. Hierarchical clustering of expression profiles of PtTLP genes in different tissues. The microarray data were downloaded from the JGI Data Portal (https://phytozome-next.jgi.doe.gov/geneatlas/; accessed on 10 October 2023) [30]. The color scale at the right of the graph indicates log2 expression values. PtTLP6 was marked with a red box and a red arrow. Branch lengths of the phylogenetic tree represent genetic distances, and the scale bar represents 0.1.
Ijms 25 05990 g003
Figure 4. PtTLP6 gene expression pattern in various tissues of P. trichocarpa. (A) RT-PCR analysis of PtTLP6 gene expression in different tissues, including xylem, cambium, phloem, young leaf, mature leaf, petiole, apical bud, and root. (B) RT-qPCR analysis of PtTLP6 gene expression in different tissues. The expression level of PtActin2 was used as an internal control. Statistically significant differences between cambium and other tissues were determined by t-test. (CI) GUS staining of different tissues in transgenic PtTLP6pro::GUS plants. (C,D) Cross-section of stem internode 9. (E,I) cross-sections of the 5th leaf petiole and main vein. (FH) Apical bud, mature leaf, and root. CZ, cambium zone; PPF, primary phloem fiber; SPF, secondary phloem fiber; Ph, phloem; Xy, xylem. In (B), the error bars represent SDs (n = 3). p < 0.05 was marked as *, p < 0.01 was marked as **. Scale bars in (CE,I) represent 200 μm; in (FH), 1 cm.
Ijms 25 05990 g004
Figure 5. Overexpression of PtTLP6 gene in Arabidopsis results in early flowering. (A) RT-qPCR analysis of PtTLP6 gene expression in transgenic Arabidopsis plants. PtActin2 was used as an internal control. (B) Western blot analysis of PtTLP6 protein levels in transgenic Arabidopsis plants. Total proteins were extracted from the leaves of WT, PtTLP-OE1, 2, 4, 5, and 9 transgenic lines, separated on a 12% SDS-PAGE gel, and immunoblotted with anti-FLAG antibody (Abcam, Cambridge, UK). A replicate coomassie brilliant blue (CBB)-stained gel is shown to confirm equal loading. The black arrow shows the approximate position of the PtTLP6 protein, which is 30 kDa in size. (CE) Photos were taken from WT and PtTLP6-OE2 plants grown on soils for 21 d (C), 27 d (D), and 35 d (E), respectively. In view of similar phenotypes of PtTLP6-OE1, 2, and 4 plants, only PtTLP6-OE2 is shown here. (F) Statistics of WT and PtTLP6-OE plant flowering time. (G) Statistics of the number of rosette leaves from WT and PtTLP6-OE plants when flowering. Data are means ± standard error of three technical replicate results. Scale bars, 1 cm; p < 0.01, **.
Ijms 25 05990 g005
Figure 6. Transcription levels of main flowering pathway genes in WT and PtTLP6-OE lines. (A) Four major pathways regulating flowering time and the marker genes involved. The marker genes labelled with red boxes were selected for RT-qPCR analysis. (B) Relative expression level of FT in WT and three PtTLP6-OE lines. (C) Relative expression level of the housekeeping gene AtActin2 of WT and three PtTLP6-OE lines. (DG) Relative expression levels of marker genes of aging pathway, vernalization pathway, autonomous pathway and photoperiod pathway of WT and three PtTLP6-OE lines. Three biological experiment replicates and three technical experiment replicates were performed for each outcome. Data are means ± SD (n = 3). FT, FLOWERING LOCUS T; SPL9, SQUAMOSA PROMOTER BINDING PROTEIN-LIKE 9; FUL, FRUITFULL; LFY, LEAFY; FLC, FLOWERING LOCUS C; SVP, SHORT VEGETATIVE PHASE; FRI, FLOWERING LOCUS A; FVE, MULTICOPY SUPPRESSOR OF IRA1 4; FLD, FLOWERING LOCUS D; FCA, FLOWERING CONTROL LOCUS A; GI, GIGANTEA; CDF, CYCLING DOF FACTOR 5; CO, CONSTANS.
Ijms 25 05990 g006
Figure 7. Cell viability staining of the rosette and cauline leaves of WT and PtTLP6-OE lines. (A,C) DAB staining of the rosette and cauline leaves from WT and PtTLP6-OE lines. (B,D) Trypan blue staining of the rosette and cauline leaves from WT and PtTLP6-OE lines. The scale bars are 100 µm.
Ijms 25 05990 g007
Figure 8. PtTLP6-GFP protein is localized in peroxisomes. (A,B) Fluorescence images were taken from tobacco leaf mesophyll cells under different channels of laser confocal microscopy at low (A) and high (B) magnifications. The GFP channel is used for the localization of PtTLP6-GFP protein and mCherry channel for the localization of px-rk-mCherry in peroxisomes. BF, bright field images. Merged, imaging of all channels. Bars, 20 μm.
Ijms 25 05990 g008
Disclaimer/Publisher’s Note: The statements, opinions and data contained in all publications are solely those of the individual author(s) and contributor(s) and not of MDPI and/or the editor(s). MDPI and/or the editor(s) disclaim responsibility for any injury to people or property resulting from any ideas, methods, instructions or products referred to in the content.

