2.1. Study Population and Data Sources
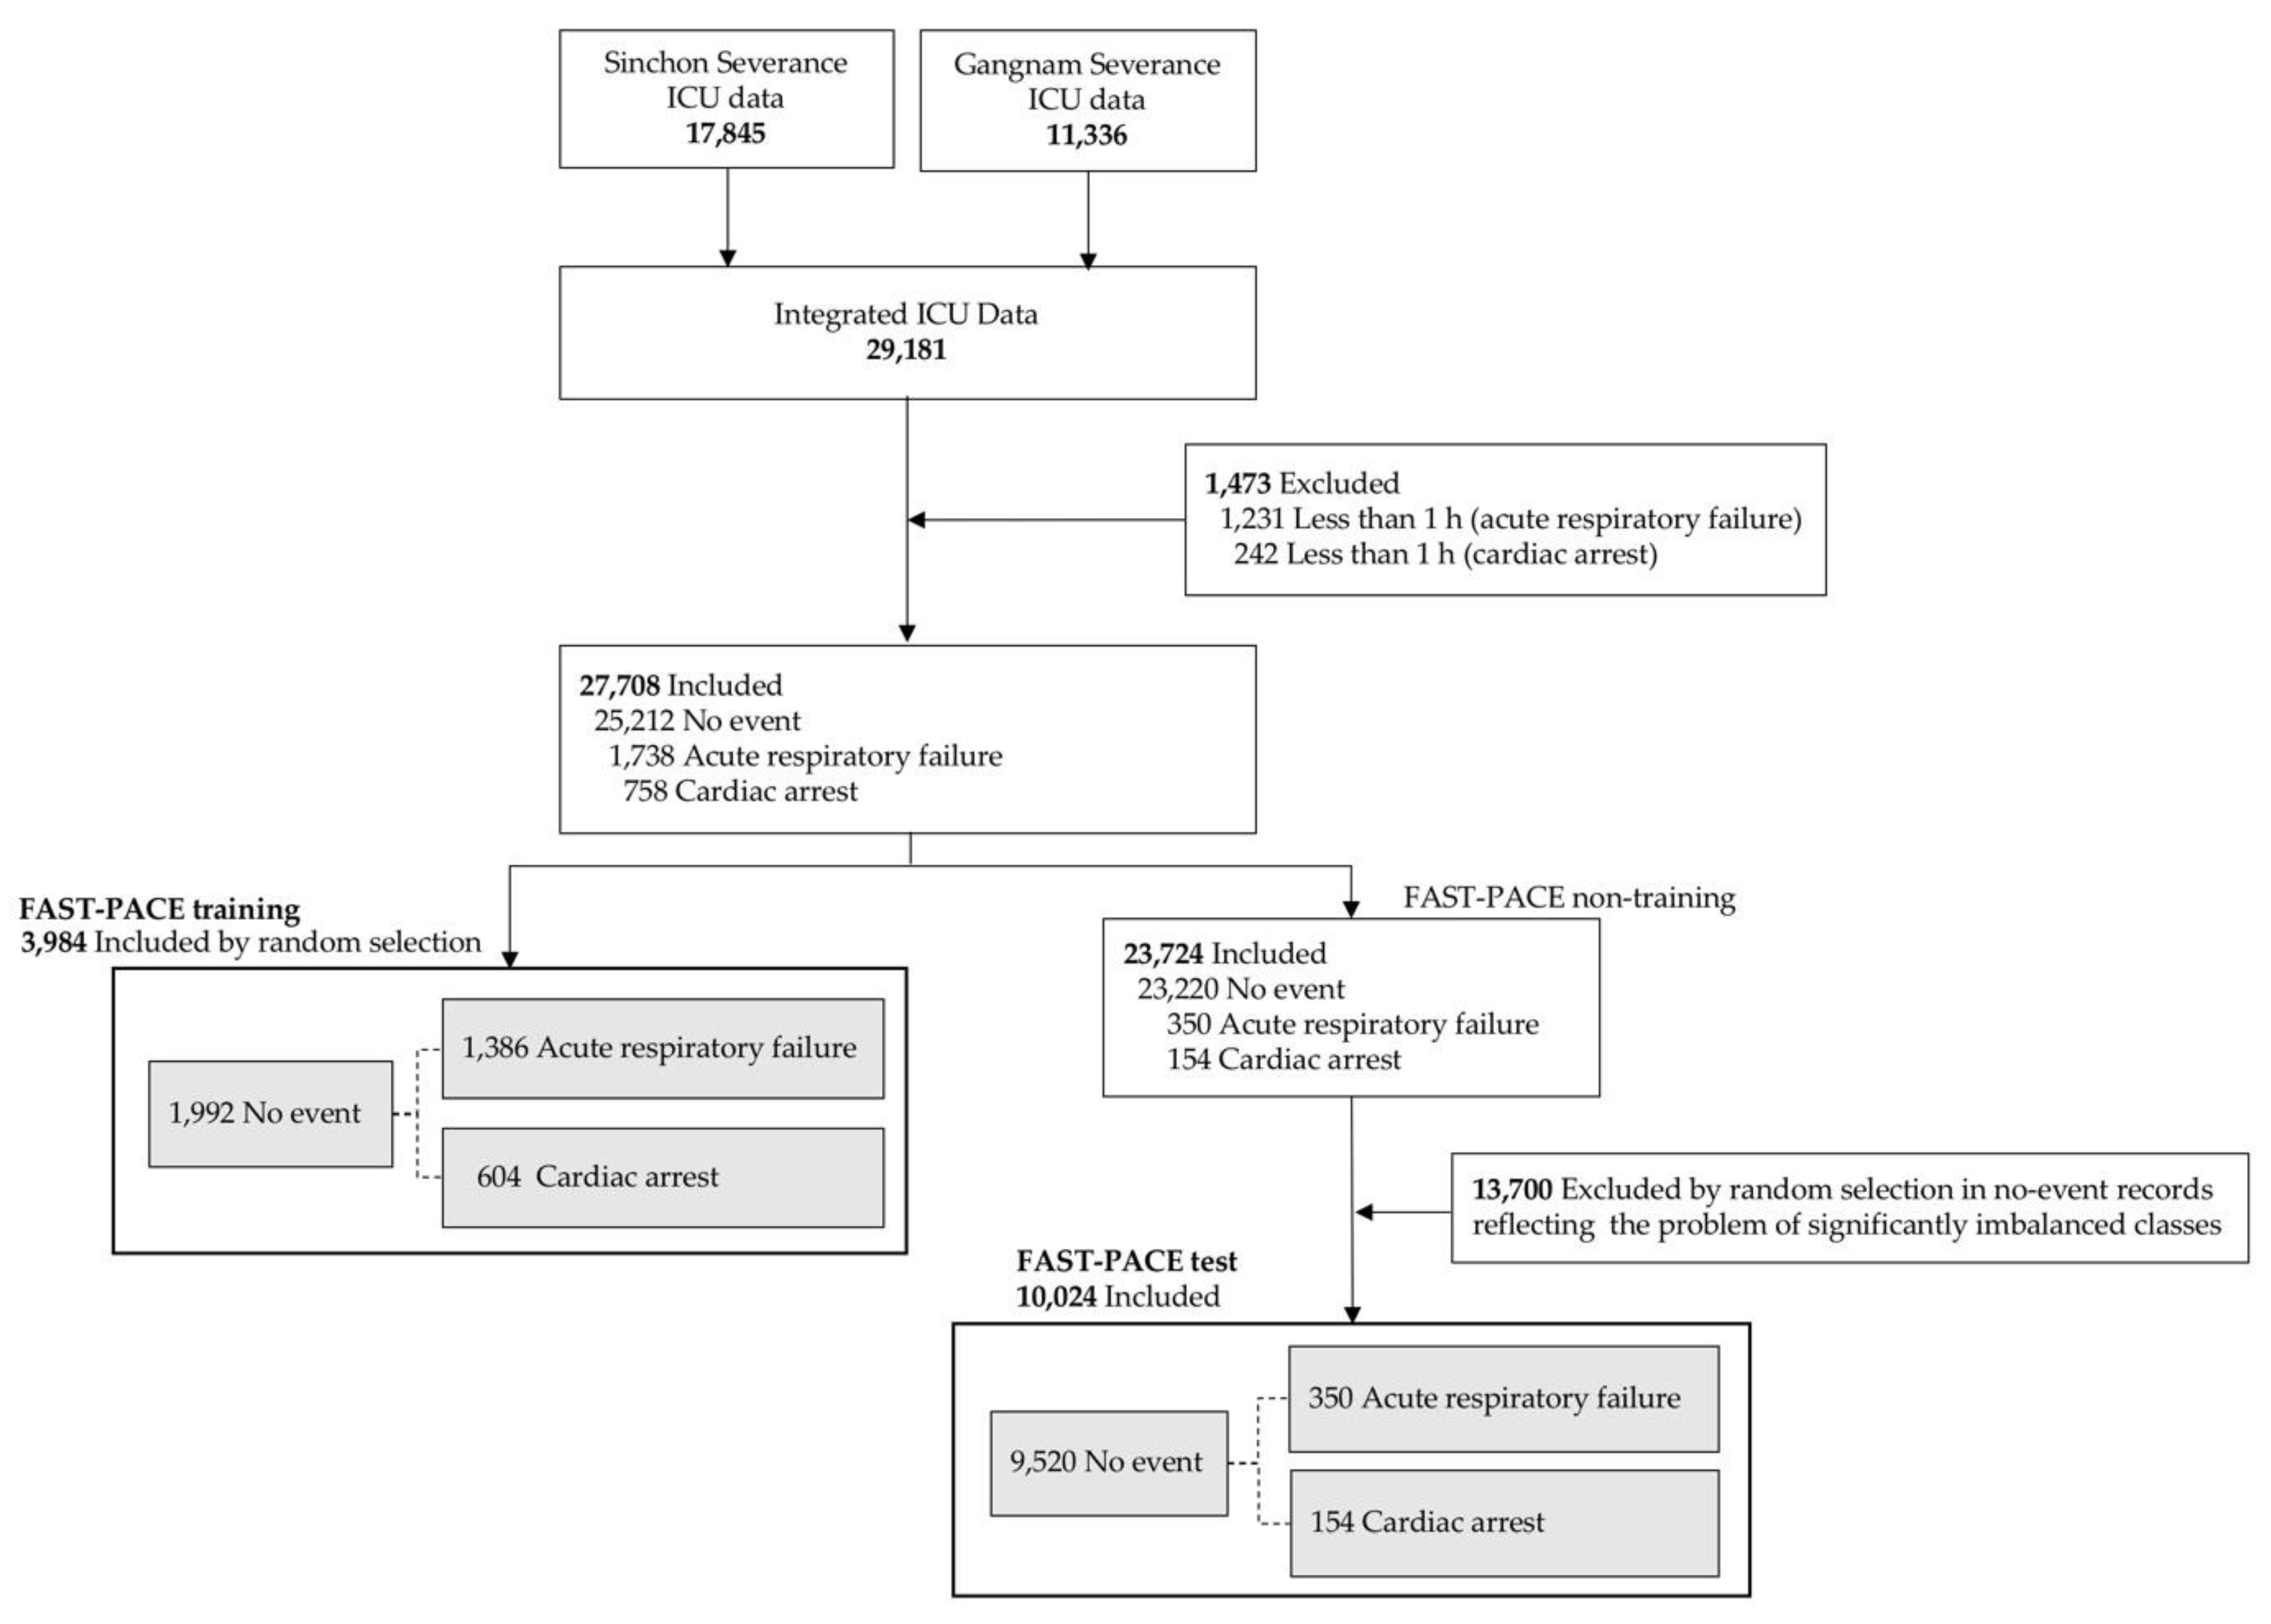
A total of 29,181 ICU patients were included from two hospitals within the Yonsei Health System (Severance Hospital and Gangnam Severance Hospital) from 2006 to 2017. The study protocol was approved by the Institutional Review Board of the Yonsei University Health System, Seoul, South Korea (Sinchon Severance Hospital and Gangnam Severance Hospital (#4-2017-1230 and #3-2018-0263, respectively)). We included patients above the age of 18 who were hospitalized in one medical ICU, one surgical ICU, and one mixed ICU with a total of 67 ICU beds. Patients were excluded if they underwent events within one hour of ICU admission or if they did not survive the first 6 h in ICU (1231 patients underwent acute respiratory failure events and 242 patients underwent cardiac arrest events; see
Figure 1). In this model, we define cardiac arrest as the start of cardiopulmonary resuscitation (CPR), and acute respiratory failure as endotracheal intubation. Both events were detected and managed by the rapid response system conducted in ICU. More specifically, as it is invasive, endotracheal intubation can result in many complications and is a rather difficult clinical procedure. Physicians attempt endotracheal intubation as a last resort; that is, when respiratory failure cannot be resolved with the provision of any other non-invasive oxygen supply. We define this point as respiratory failure requiring immediate intervention. In real-world applications of learning methods in medicine, the ratio of positive to negative instances is significantly low, and such imbalanced classes restrict prediction performance, although machine learning is a promising solution when using big data in medical machine learning [
15,
16]. As shown in
Figure 1, FAST-PACE also suffered from intrinsic imbalanced data. Therefore, we performed random undersampling, in which the training dataset was modified to produce a less balanced class distribution to allow learning to be conducted as a standard prediction. We randomly selected 3984 samples for the training dataset, which was composed of an identical number of positive (event group: 1992 samples) and negative (no-event group: 1992 samples) samples [
17]. However, we maintained the imbalanced ratio of positive to negative samples to demonstrate that the proposed solution is feasible in a real-world environment without overfitting, as shown in the FAST-PACE test of
Figure 1.
2.2. Feature Construction
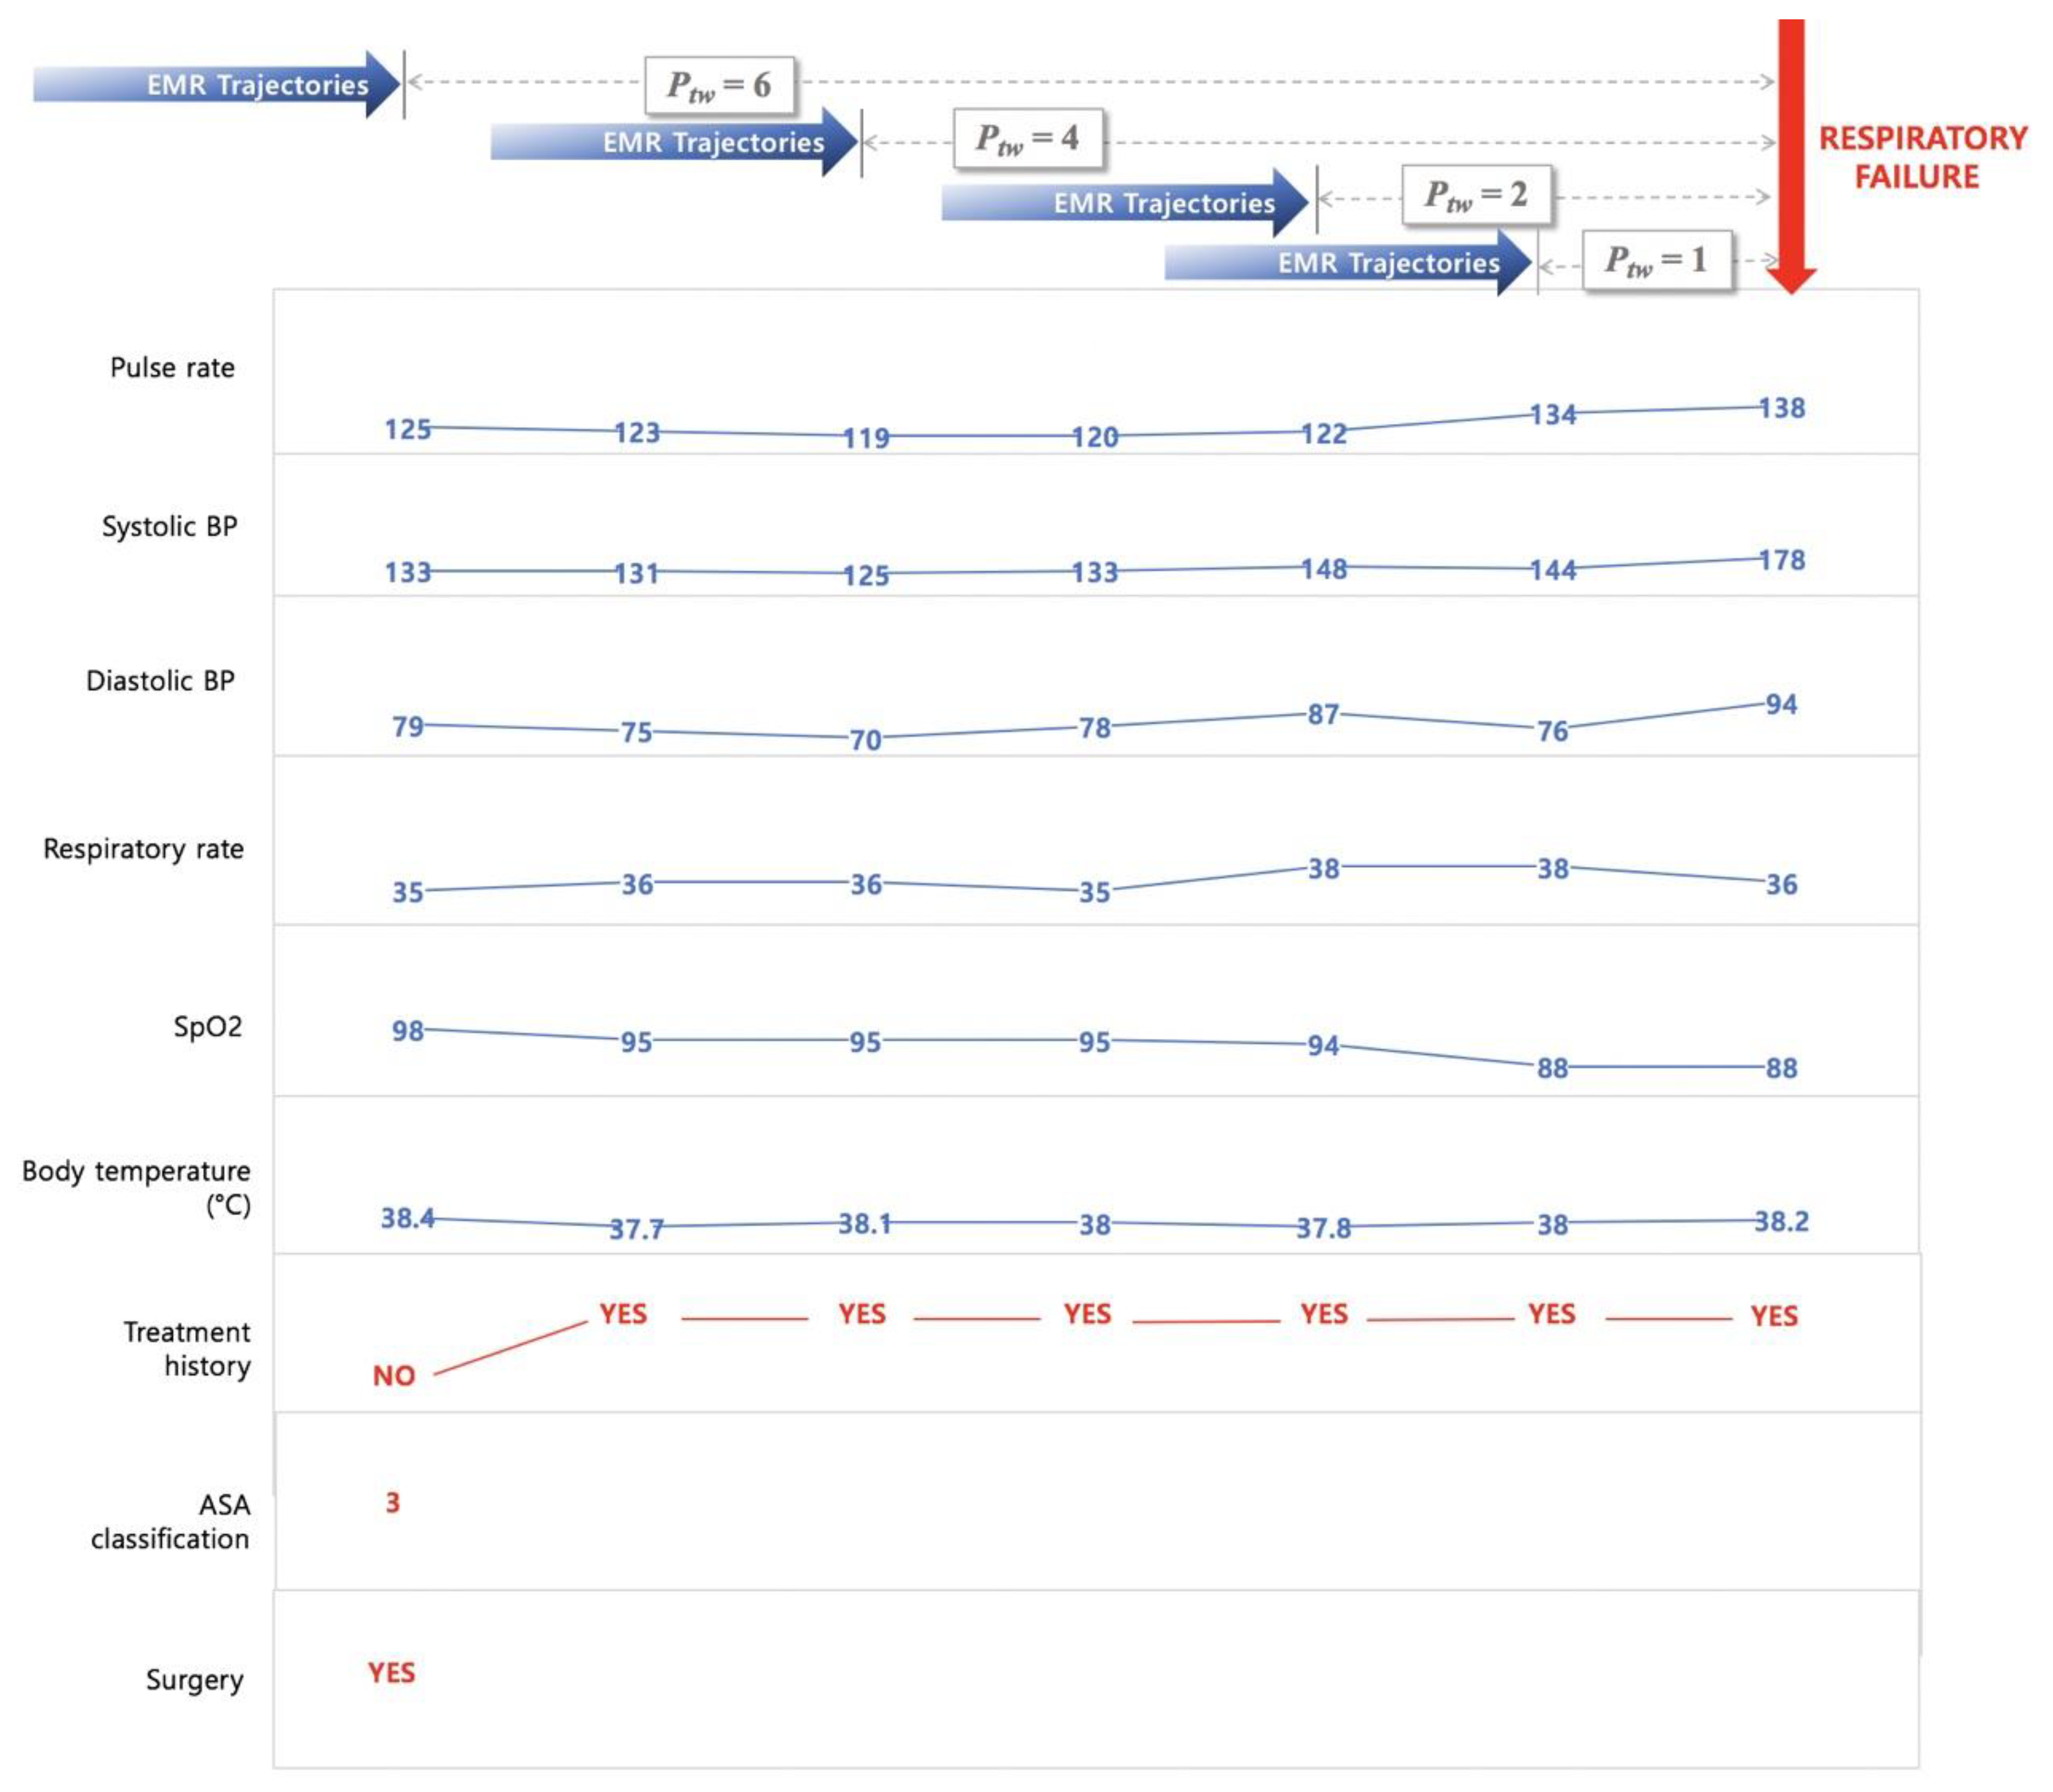
In this study, we retrieved a total of nine features from EMRs to predict two critical events—acute respiratory failure and cardiac arrest. The features used to develop this model were basic vital signs, such as pulse rate, systolic blood pressure (SBP), diastolic blood pressure (DBP), respiratory rate, peripheral oxygen saturation (SpO
2), body temperature, recent surgical history (within one week), and current health status (American Society of Anesthesiologists (ASA) classification). The prediction times are taken as 1 h, 2 h, 4 h, and 6 h to analyze the tendency of an adverse event, depending on the prediction time window (
Ptw = 1, 2, 4, and 6). To predict the probability of a critical event occurring at a specific time, data recorded from admission to
Ptw hours before the event can be used for the model construction. Therefore, as shown in
Figure 2, the EMR trajectories up to
Ptw hours before the reference point were retrieved to build the feature set of FAST-PACE.
Pulse rate, SBP, DBP, respiratory rate, SpO2, and body temperature were extracted for the investigation of vital signs of patients, and three additional information parameters (treatment history, current health status, and recent history of operations) were encoded. The treatment history was determined as a binary feature of pharmacological treatment and additional oxygen supply that could affect the vital signs at the time of measurement. The included drugs are vasopressors and inotropics, such as norepinephrine, vasopressin, phenylephrine, epinephrine, dobutamine, and dopamine. The oxygen supply includes all additional oxygen supply from the low flow system to the extracorporeal membrane oxygenation and is indicated as a 0 or 1 as a binary indicator. The recent surgery history was defined within one week of event occurrence. A few patients were also assessed by two conventional risk scores—MEWS and NEWS.
EMR data from ICUs contain abnormal records due to errors of the medical staff or unexpected omissions of data during the input process. We adopted the imputation and discretization methods to deal with such noise, missing values, and various ranges of features. Initial data cleaning was performed to refine the mixed value of each physiological signal as well as to remove outliers or invalid data since the initial vital sign values were recorded in a specific range rather than as a single value, or included additional information such as history of treatment, major symptoms, and units. The range value was replaced with the lowest value, and additional information including treatment history were separated to other features. Missing data were imputed by applying autoregressive integrated moving average (ARIMA) models, which have been widely used for time-series imputation [
18].
We define treatment history as medication administration or oxygen supplements that can affect heart rate, SpO2, SBP, DBP, and temperature using medication history and nursing records. The features were sampled hourly and discretized using the mean and standard deviation from the training set.
The ASA physical status classification system assesses the fitness of patients before surgery. In 1963, the ASA adopted the five-category physical status classification system; a sixth category was added later. This system, which continues to be a means of stratifying a patient’s systemic illness [
19,
20], is defined as follows:
Class 1. Healthy person.
Class 2. Mild systemic disease.
Class 3. Severe systemic disease.
Class 4. Severe systemic disease that is a constant threat to life.
Class 5. A moribund person who is not expected to survive without an operation.
Class 6. A declared brain-dead person whose organs are being removed for donor purposes.
Because ASA records exist only for patients who underwent surgery recently, the value was only extracted for 10% of the patients. The system provided by the ASA is a tool for evaluating the severity of underlying disease in patients using a few simple questions. Researchers, however, have not been able to extract ASA data for non-surgical patients. In future studies, the ASA questionnaire could be revamped to include a few simple questions to the above effect. Therefore, we included ASA data as a continuous feature in the model. The resulting z-scores were rounded to be within a range, differing depending on the features, as shown in
Table 1. Sequential repeated measurements of vital signs, pulse rate, SBP, DBP, SpO
2, and temperature were supplemented with missing values using an ARIMA model.
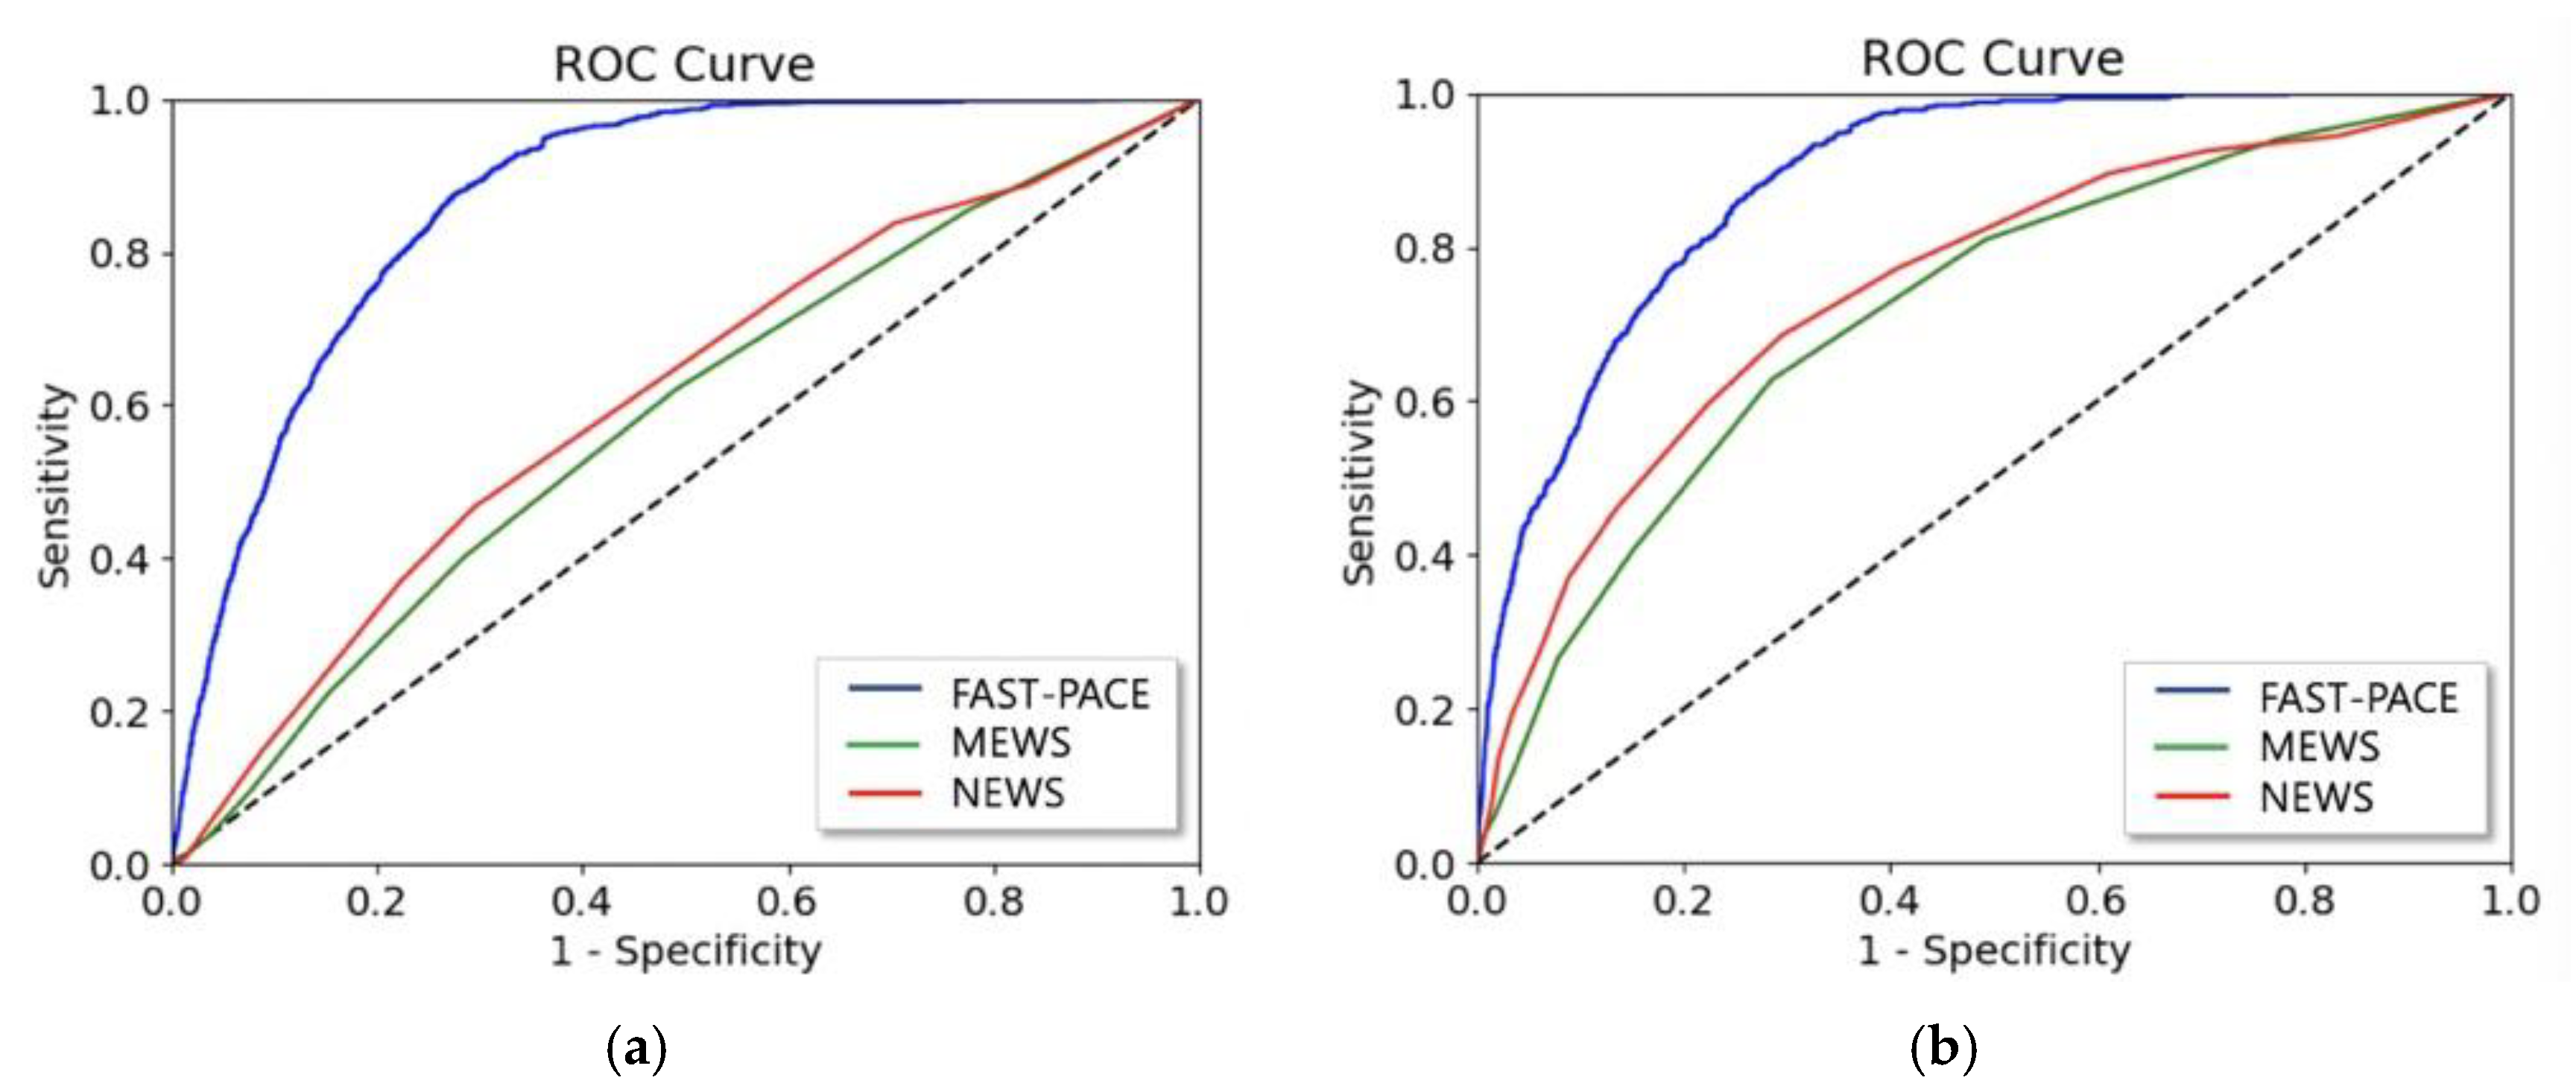
To compare the prediction performance of FAST-PACE to the baseline, we also obtained the values of MEWS and NEWS, which are conventional scores for the assessment of patients in wards. The composition of the scores is displayed in
Table 2.
2.3. Deep Learning Model
Vital signs data of ICU patients are a time series of periodic records. Recent studies have applied RNNs to analyze and predict patterns of a patient’s condition [
3,
22,
23]. Specifically, RNNs using the LSTM model equipped with memory cells to store trajectory information is broadly adopted in diagnosis and prediction in healthcare [
24,
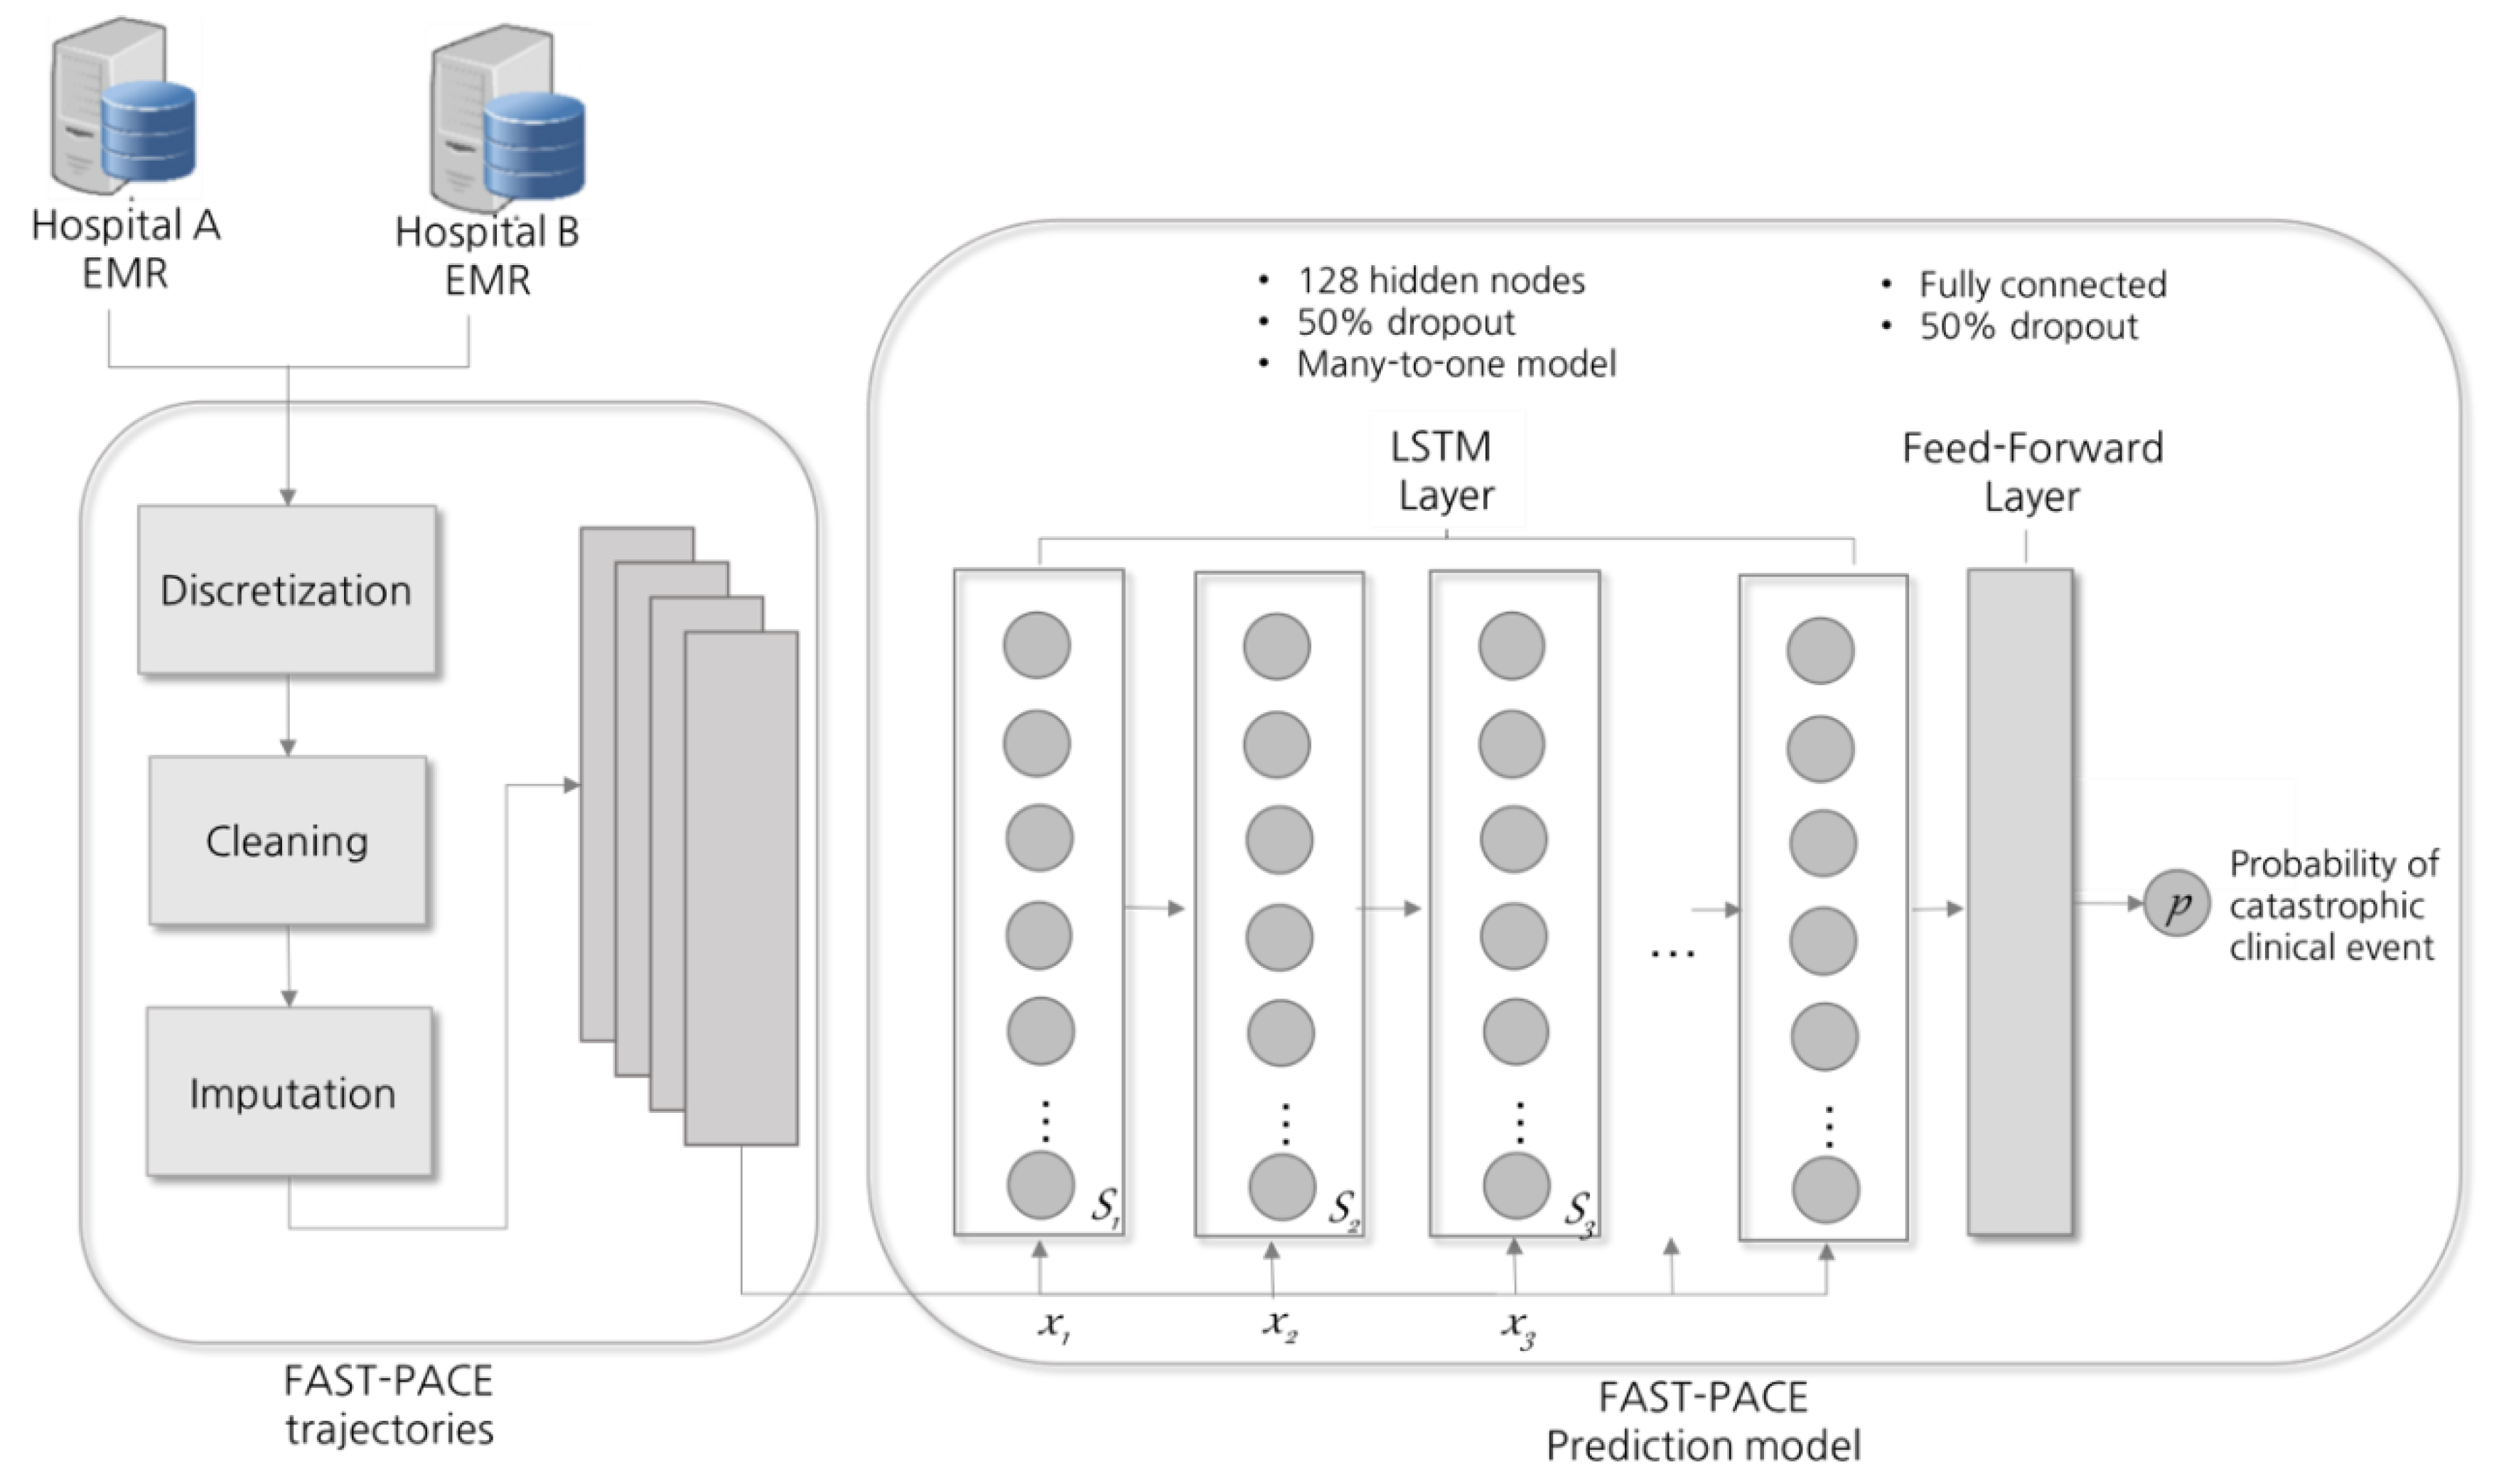
25]. At each time step, LSTM reads an input
xi, updates the memory cell (
Si), and returns an output, as shown in
Figure 3. Each input
xi is a two-dimensional vector composed of nine features and a time window, and the final output p denotes the probability of the occurrence of a critical event. LSTM extends memory block-typed neurons so that memory cells in nodes can properly control the influence of the previous input. In this study, LSTM is composed of a single hidden layer with 128 cells and a drop-out probability of 0.5 was applied as a normalization technique [
26]. LSTM equations with time-series inputs are detailed in [
10]. In addition, the
Adam (adaptive moment) optimization technique was applied to enhance the prediction performance [
27].
To generalize the proposed solution, the initial weights were set via Xavier initialization [
28]. Furthermore, early stopping was used, whereby training was stopped at the lowest error achieved on the validation set to improve generalization [
29]. We trained the model in TensorFlow 1.6 [
30] with the Python 3.5, pandas 0.19, NumPy 1.12, and SciPy 1.01 libraries.


