3.1. Characterization of HAp Powder Samples
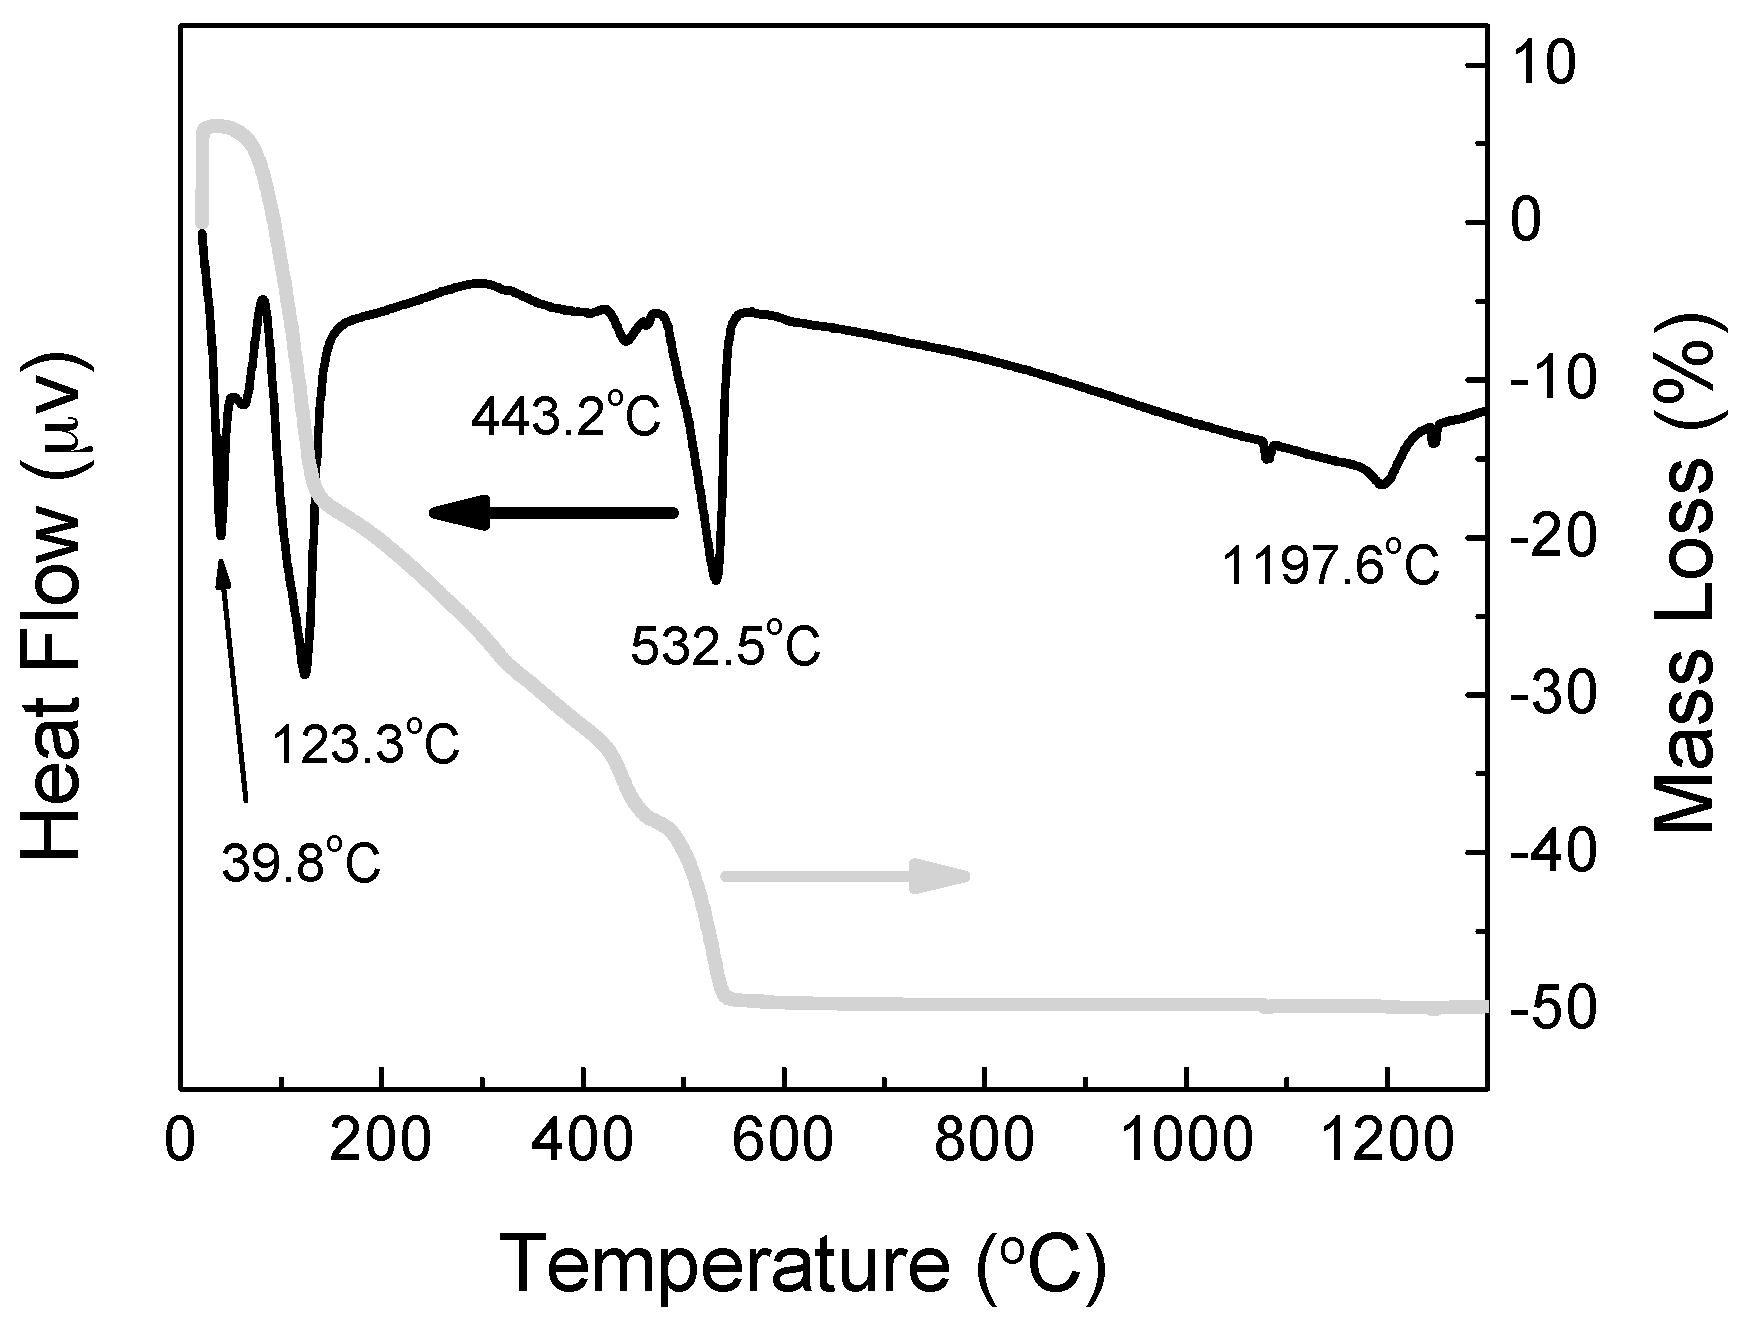
Differential Thermal Analysis (DTA) and thermogravimetry (TG) plots of the as-prepared powder are shown in
Figure 1. The DTA was employed to determine the temperature at which the as-prepared powder, amorphous calcium phosphate (ACP), transforms to crystalline HAp.
In the DTA curve of the dry gel (powder), the first endothermic peak appeared at 38.8 °C is due to the evaporation of the absorbed water (residual moisture evaporation) [
25]. The two endothermic peaks at 123.3 °C and 443.2 °C are attributed to elimination of crystalline water in un-reacted calcium nitrate tetra hydrate Ca(NO
3)
2·4H
2O and removal of NO
3− groups, as well as, to the condensation “dehydration” of hydrogen phosphate ions (HPO
42−) to form amorphous pyrophosphates (P
2O
74−), which are a component of the amorphous calcium phosphates that are formed during the processing of HAp synthesis [
26,
27,
28]. The endothermic peak at 532.5 °C is representative of the endothermic reaction indicating the crystallization of HAp. The last endothermic peak observed at 1197.6 °C may be attributed to the decomposition of the HAp [
29].
In the TG, the weight loss was complete at about 570 °C and three discrete weight-loss regions occurred as seen in
Figure 1. The first region at 44–172 °C with 25% weight loss corresponds to the elimination of adsorbed water. This process was indicated as endothermic peak at 38.8 °C and shoulder at 60 °C in the DTA diagram. The second weight loss region appear at 172–479 °C in the TG plot with a 18% weight loss which corresponds to the elimination of lattice water and was indicated as endothermic peak in the DTA diagram at 443 °C. The third weight loss observed in the TG diagram at 479–570 °C with a weight loss of 11% corresponds to the decomposition of the nitrate salts which is also indicated as an endothermic peak at 532 °C in the DTA curve.
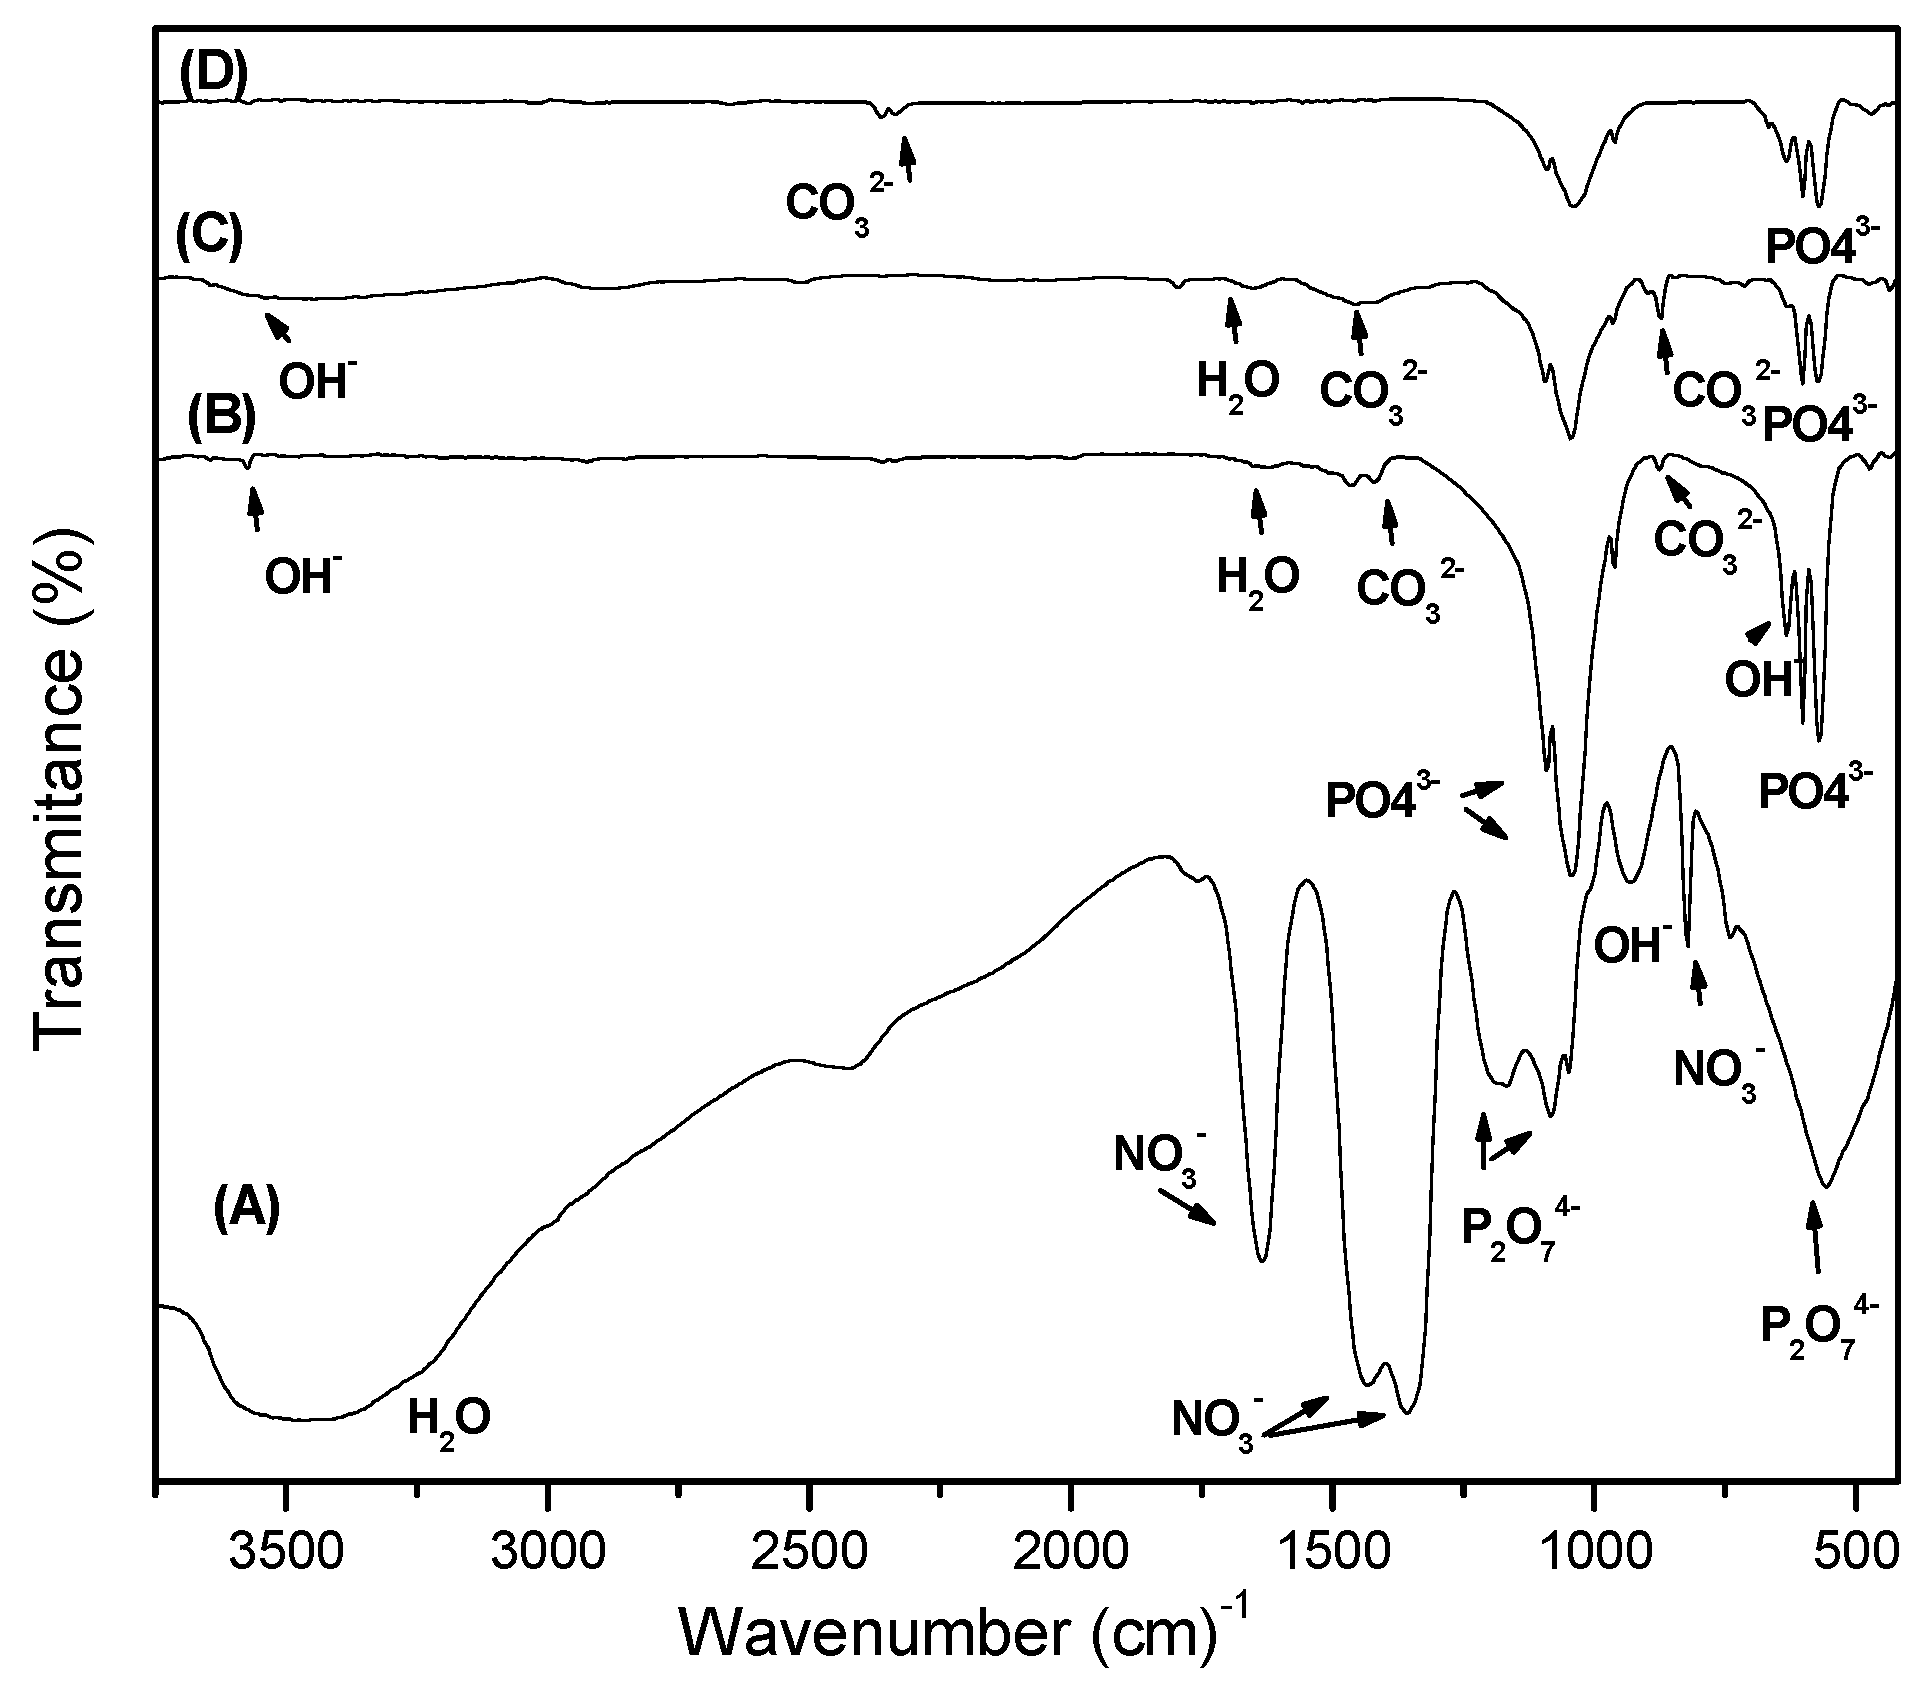
Fourier transform infrared spectroscopy (FTIR) is an analytical technique widely used to characterise the functional groups within the structure of biomaterials such as HAp, which is IR active. The FTIR spectra of the as-prepared sample S1 and thermally treated samples S6, S8 and S12 are shown in
Figure 2.
The main peaks observed are situated in the region of 900–1200 cm−1 which are due to the presence of P-O groups of HA. These peaks are present in all thermally treated samples. Theoretically, there are four vibrational modes present for phosphate ion ν1 (961 cm−1), ν2 (475–440 cm−1), ν3 (1190–976 cm−1) and ν4 (660–520 cm−1), all the four modes are IR active and are used to characterize apatite structure.
The FTIR spectrum of the as prepared sample shows a very poorly defined broadband in the region where bands due to phosphate ions in the HAp should be present (spectrum A in
Figure 2). In spectra of S1, the intense broad peak at 1342 cm
−1 and the sharp peaks at 825 cm
−1 and 1631 cm
−1 along with the small peaks of 1049 and 1766 cm
−1 are related to NO
3− bonds which come from the starting precursor. As the temperature increases, NO
3− could decompose into gaseous oxide of nitrogen and, hence, the related absorption bands disappear as the temperature increase [
30]. The peaks at 740, 1083, 1164 and 555 cm
−1 indicate the presence of P
2O
74− in the as prepared sample dried at 80 °C. These peaks also disappeared as temperature increased [
30]. The broad band at 3435 cm
−1 and the band at 914 cm
−1 assigned to OH
− stretching and bending of the lattice water both of which are weakened, as the powder was heated at 600 °C/2 h. All of these mentioned bands are indicatives of poorly crystalline or amorphous apatite structure.
The spectra of the S6, S8 and S12 samples thermally treated at 600, 800, 1200 °C/2 h, respectively exhibited a decrease in the intensity of OH− peaks and disappearance of NO3− and P2O74− bands indicating the transformation of amorphous HAp into crystalline form. This is confirmed by the appearance of new absorption bands at 520–1500 cm−1 assigned to PO43− groups, which are presents in the HAp.
The incorporation of carbonate is a common phenomenon during the formation of biological apatite in the human body. In the synthesized HAp, the carbonate substitution may result from CO
2 in the atmosphere, dissolved in the solutions used for the preparation of the HAp particles. The CO
32− can easily replace OH
− (A sites) and PO
43− (B sites) at 1500–1545 cm
−1 and 1420–1470 cm
−1, respectively to form carbonated HAp [
30].
In the spectrum of the 600 °C/2 h thermally treated sample S6 the two weak peaks at 1465, 1419 cm
−1 (ν
3) and a small shoulder observed at 875 cm
−1 indicate that the CO
32− groups were substituted for PO
4−3 groups, forming B-type carbonated apatite [
31] (spectrum B in
Figure 2). These carbonate bands appeared in the 800 °C/2 h thermally treated sample S8 at 1466 and 870 cm
−1 (spectrum C in
Figure 2).
In the Spectrum of the 1200 °C thermally treated sample S12 the new carbonate bands which appear at 2320–2348 cm
−1 (combination of ν
1 + ν
3), 1467–1412 and 878 cm
−1 are observed (spectrum D in
Figure 2). The decomposition of CaCO
3 is well known to occur at 580 °C or higher temperatures, so the CO
32− bands were expected to be absent in the spectra of the S6, S8 and S12 samples. However, the presence of the carbonate peaks is still evident in these spectra, which further proves the inclusion of CO
32− groups in the apatite structure. From the biological point of view, the presence of a small amount of carbonate in the HAp structure is an advantage and has similarity to the natural bone mineral which contain 4%–6% carbonate by weight [
31]. The carbonated HAp (CHAp) exhibit higher bioactivity than that of HAp. This is attributed to be due to the greater solubility of CHAp.
According to Landi et al., the fraction of crystalline phase (
XC) can be calculated through the equation below [
32]:
The average crystallite size was calculated from the broadening in the XRD pattern. According to the Scherrer’s equation [
33]:
Lc: Average crystallite size (nm).
K: Shape coefficient (value between 0.9 and 1.0).
λ: Wavelength of X-ray beam-Cu Kα radiation (λ = 0.15406 nm).
β: Full width at half maximum (FWHM) of HAp(211).
θ: Diffraction angle.
The diffraction peak corresponding to the (002) was chosen for calculation of the crystalline size, as it is relatively sharper than the other peaks.
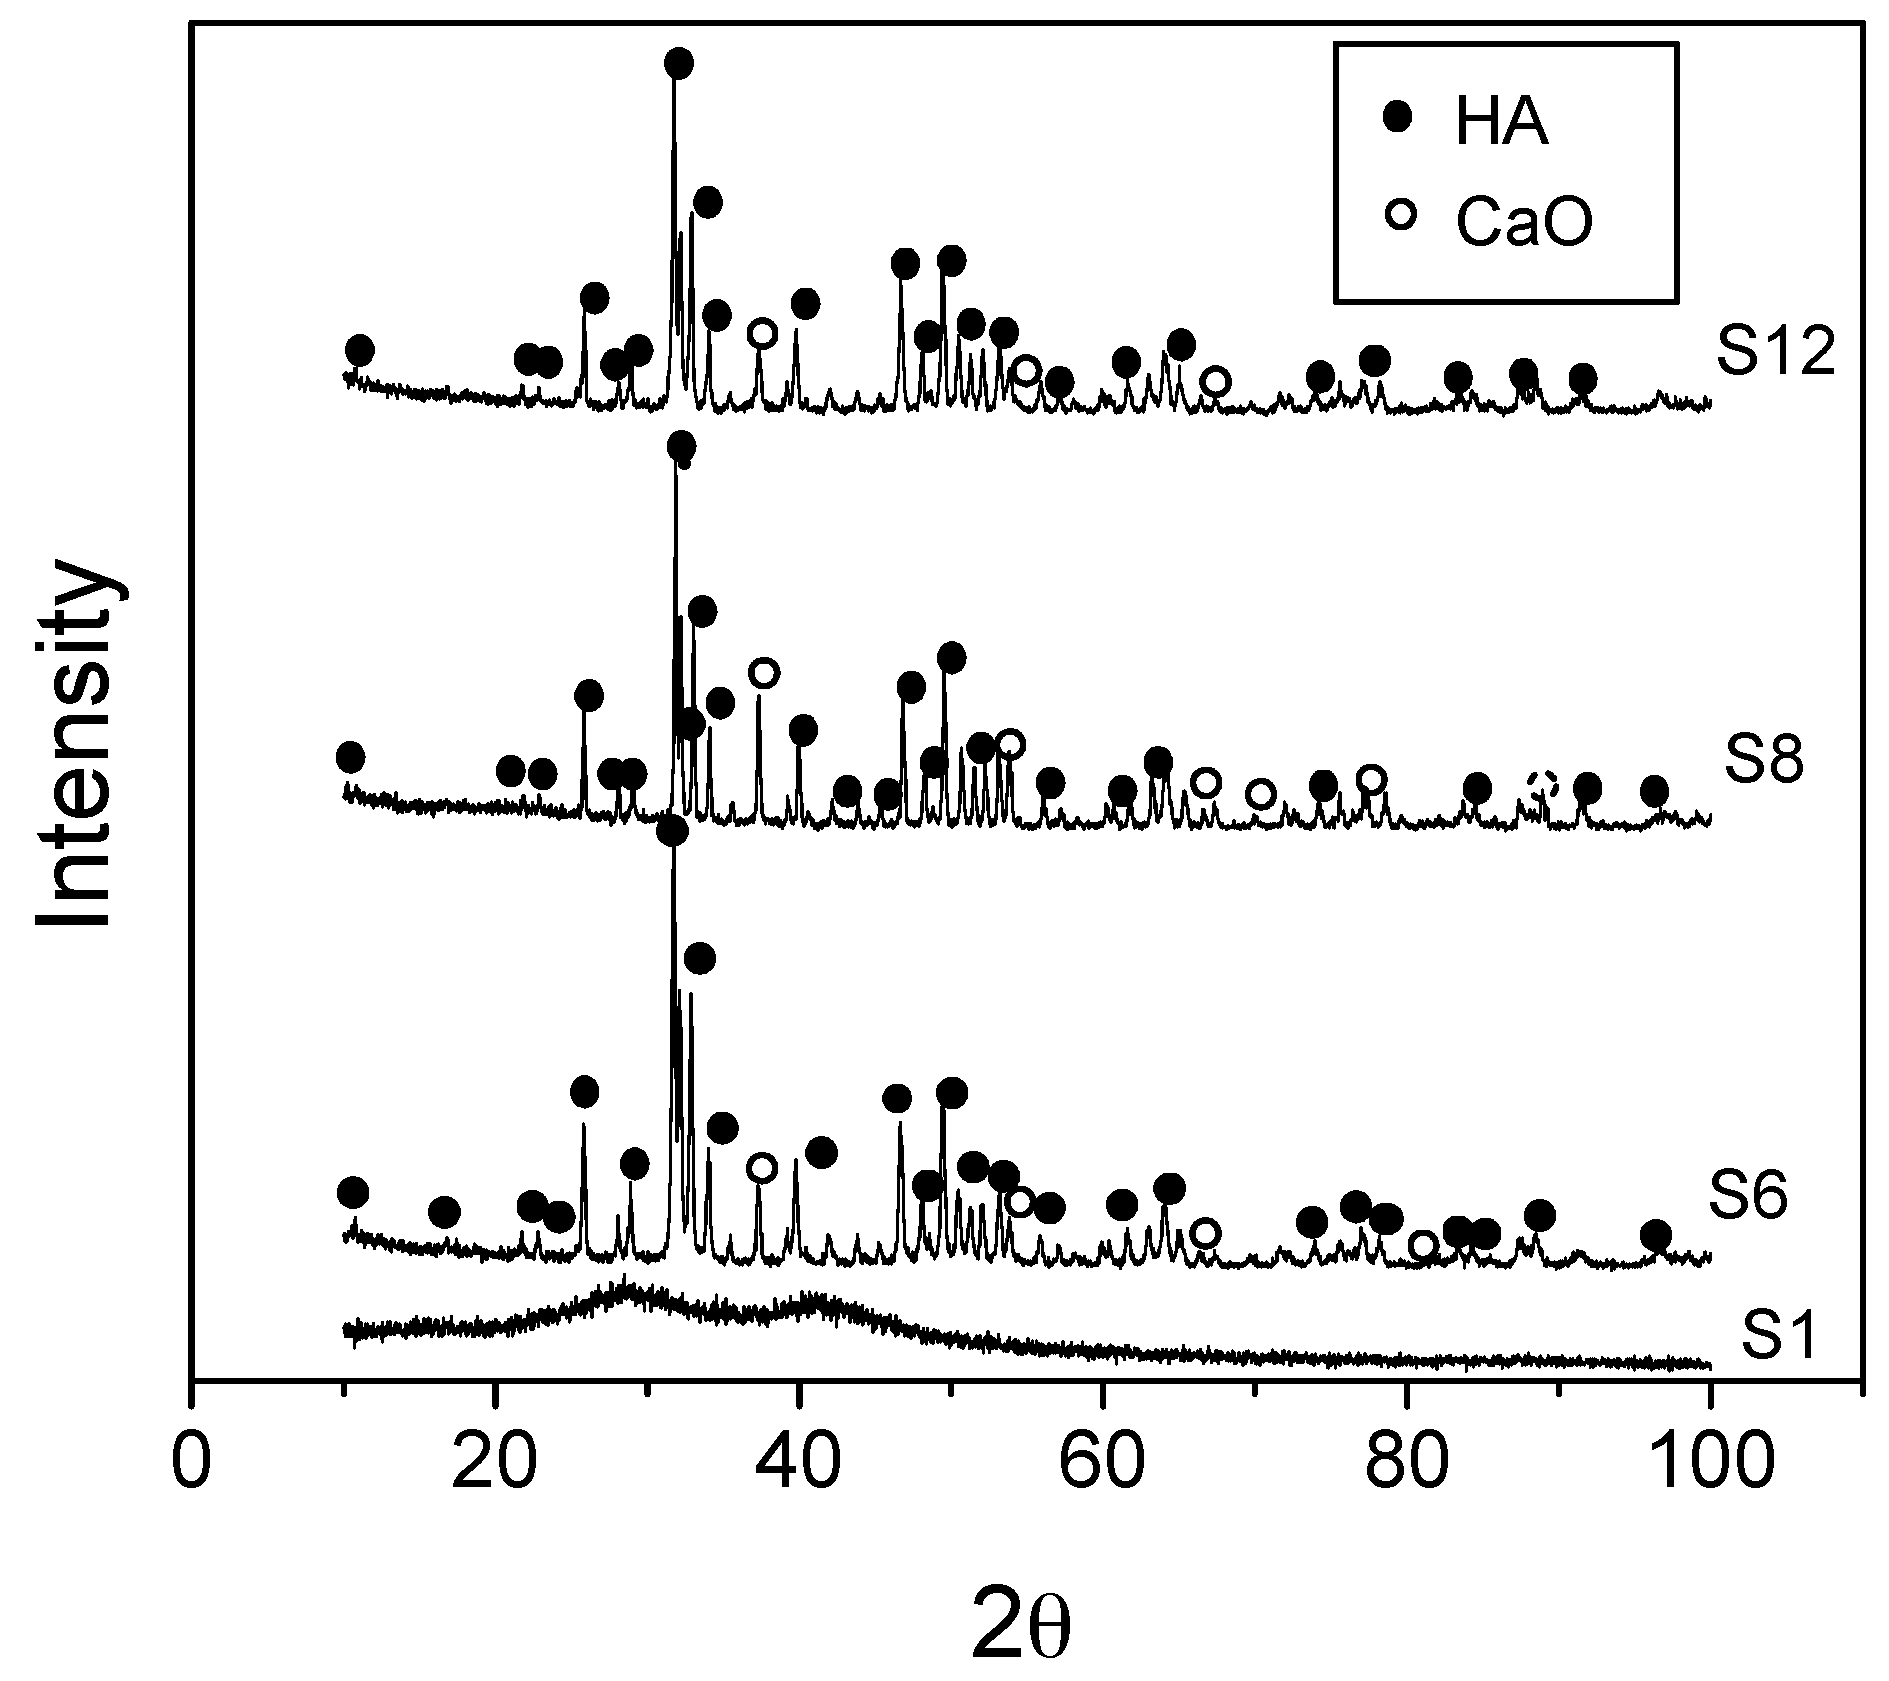
Figure 3 illustrates the XRD patterns of S1 aged gel, dried at 80 °C and of the S6, S8, and S12 samples respectively. One major peak appears around 31.81 2θ for S6, S8 and S12 samples, represent the characteristic peak of HAp apatite phase (JCPDS09-0432).
The XRD pattern of the as-prepared sample S1 is mainly amorphous, and there is no obvious diffraction peak observed (
Figure 3). In the case of the thermally treated samples, S6, S8 and S12, the increase of the temperature of the thermal treatment produces significant changes in the crystalline structure of the samples. These changes are reflected in the appearance of several peaks, which are ascribed to the diffraction peaks of the HAp phase. The XRD pattern of the thermally treated S6, S8 and S12 indicates the existence of calcium oxide as traces, together with HAp as main phase.
The presence of CaO is due to the remaining Ca(NO
3)
2, that can be directly transferred to CaO at high temperature [
10,
34]. The degree of crystallinity and calculated crystal size of the thermally treated samples can be seen in
Table 1. The degree of crystallinity of HAp increase as the temperature does from 600 to 800 °C (
Table 1), but then decrease for the sample treated at 1200 °C for 2 h. The decrease in crystallinity of the 1200 °C thermally treated sample (S12) is attributed to the decomposition of HAp at this temperature [
29]. For the samples S6 and S8, the increase of the crystal size is attributed to an increase of ion migrations favoured when the temperature is increased (
Table 1).
3.2. Characterization of the HAp Sol-Gel Coatings
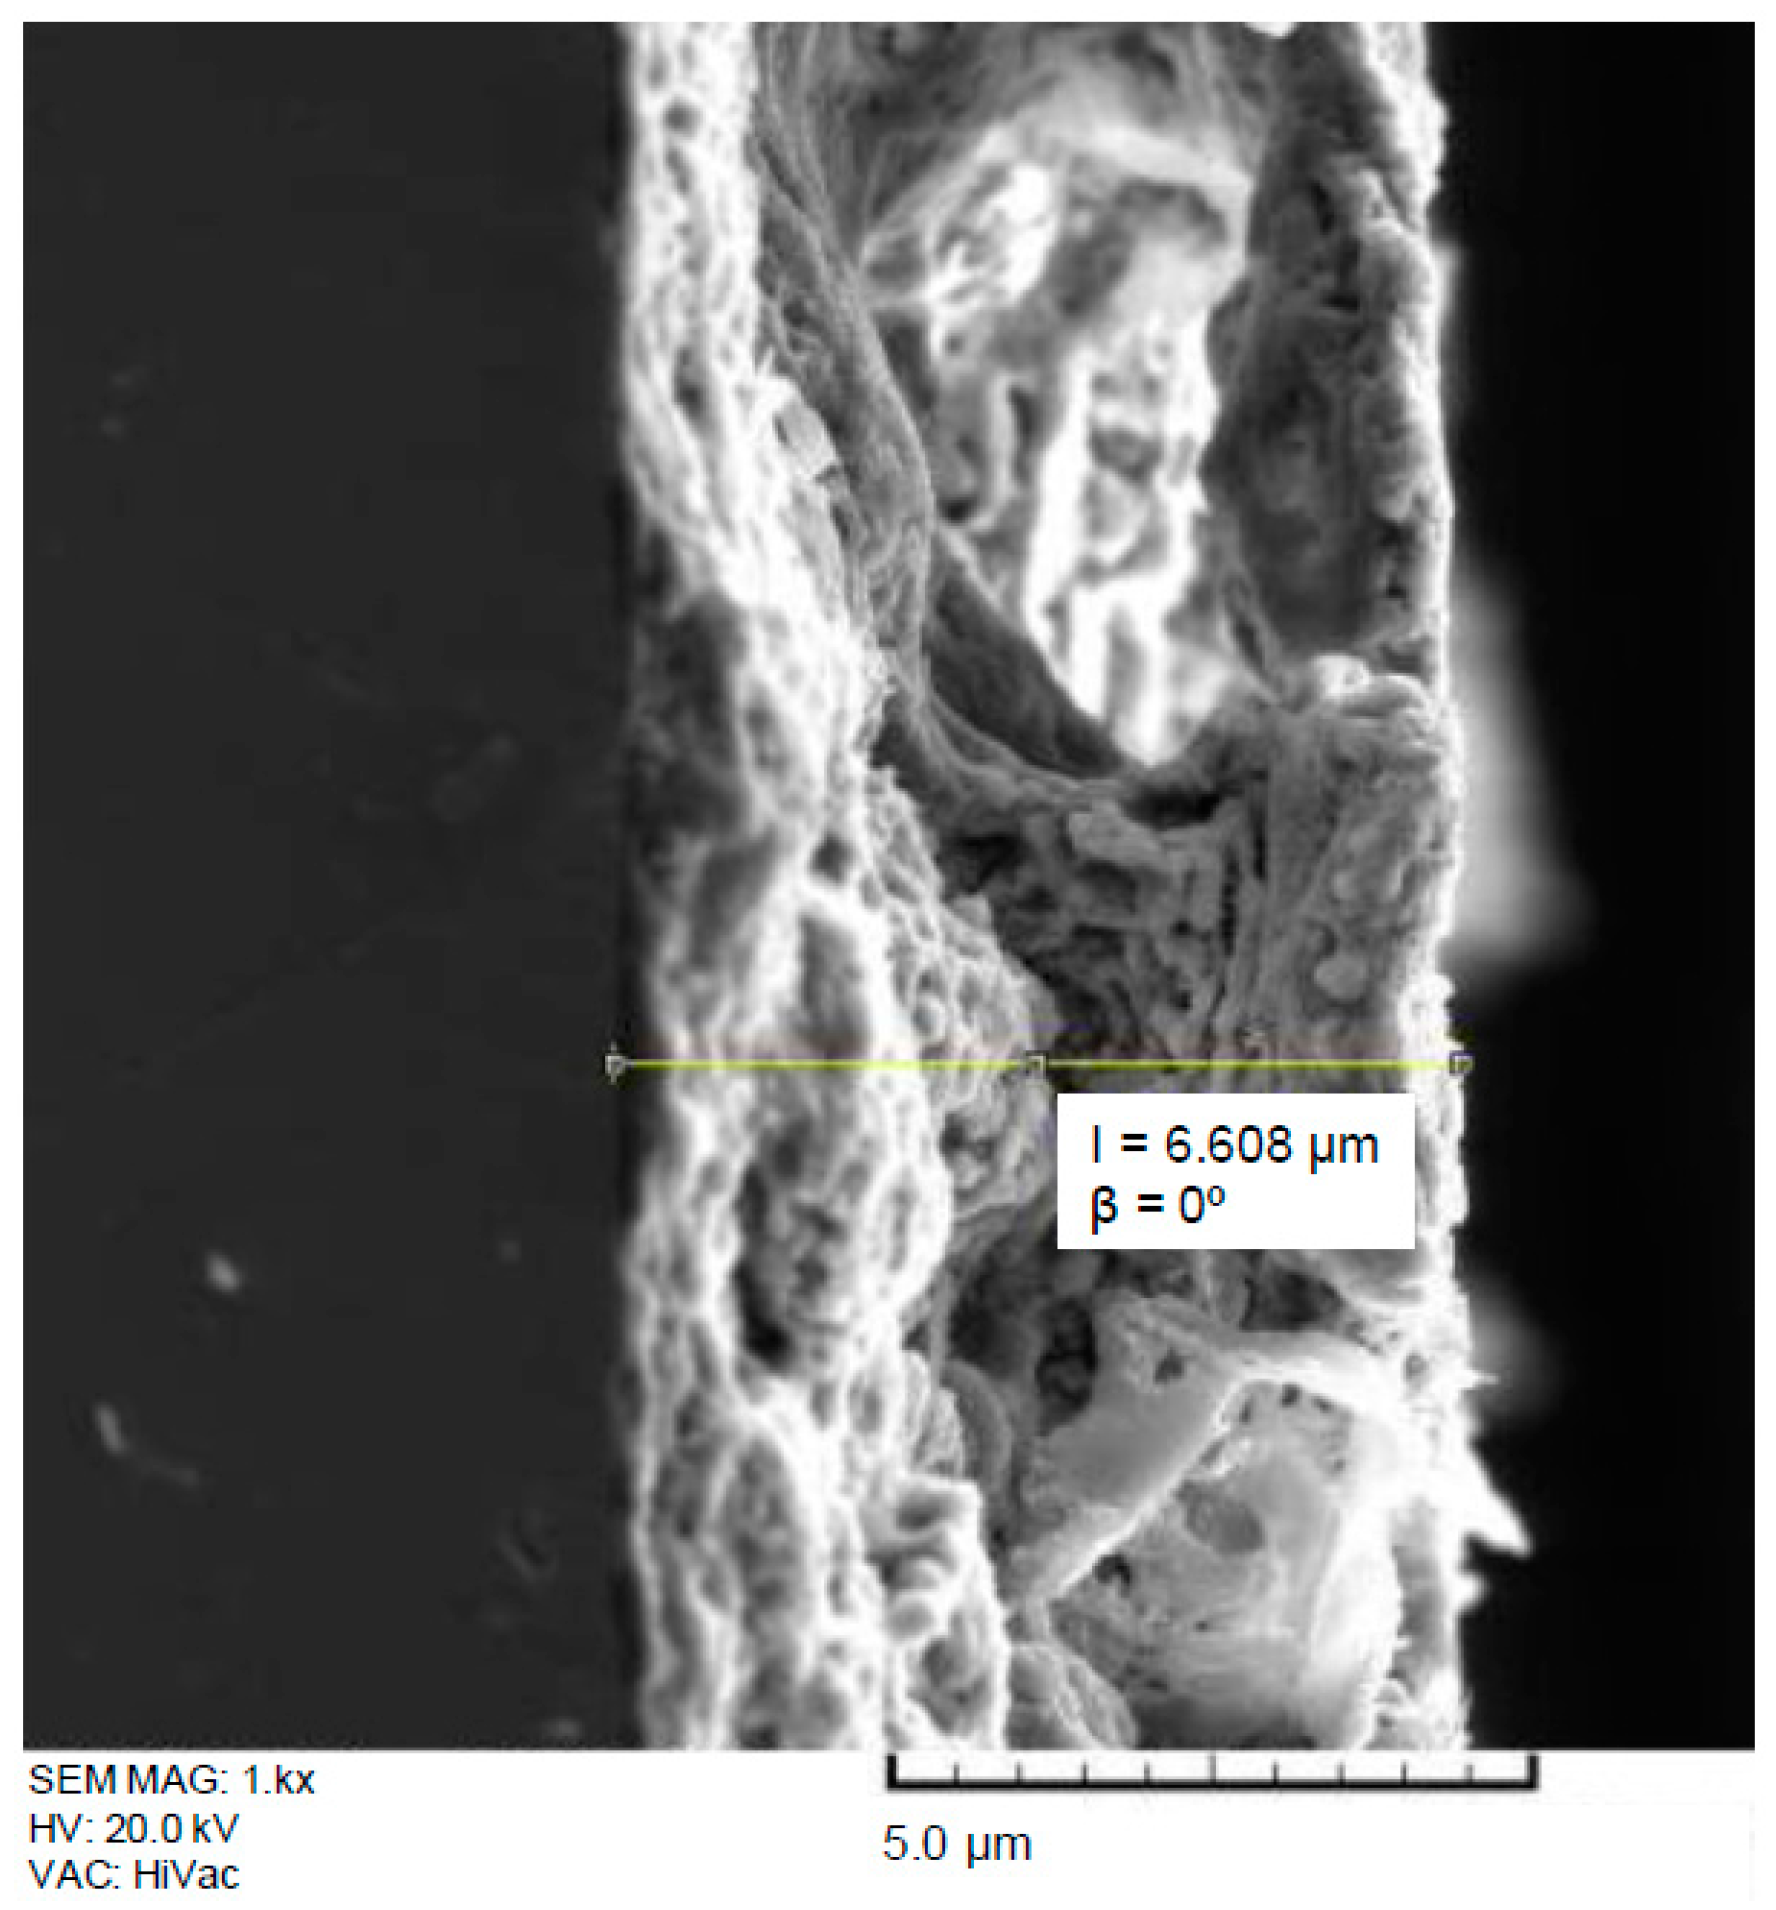
Table 2 shows the thickness values of the films deposited onto Ti6Al4V substrates measured with a stylus profiler. These results present a good correlation with those obtained by estimating the coating thickness from cross sectional SEM images (
Figure 4). To enhance the barrier properties of the coating it would be interesting to control the treatment parameters in order to increase the thickness of the resulting coatings. Nevertheless, it has been observed that the thicker coatings (i.e., those obtained for the high temperature process of 1200 °C) were more susceptible to the developments of cracks and lack of uniformity, which could be harmful from the point of view of the corrosion protection, if these cracks reach the metal substrate.
Table 3 shows the results obtained by applying the adhesion tests, according to ASTM F1044-05 Standard Method, for the five specimens of the samples S6 based on the HAp sol-gel-derived coatings deposited on Ti6Al4V alloy thermally treated at 600 °C during 2 h. The result of 29.0 MPa is consistent with that reported the ASTM standard for Ti6Al4V alloy coated with HAp, which raises the mean cohesive strength of 29.2 ± 4.8 MPa.
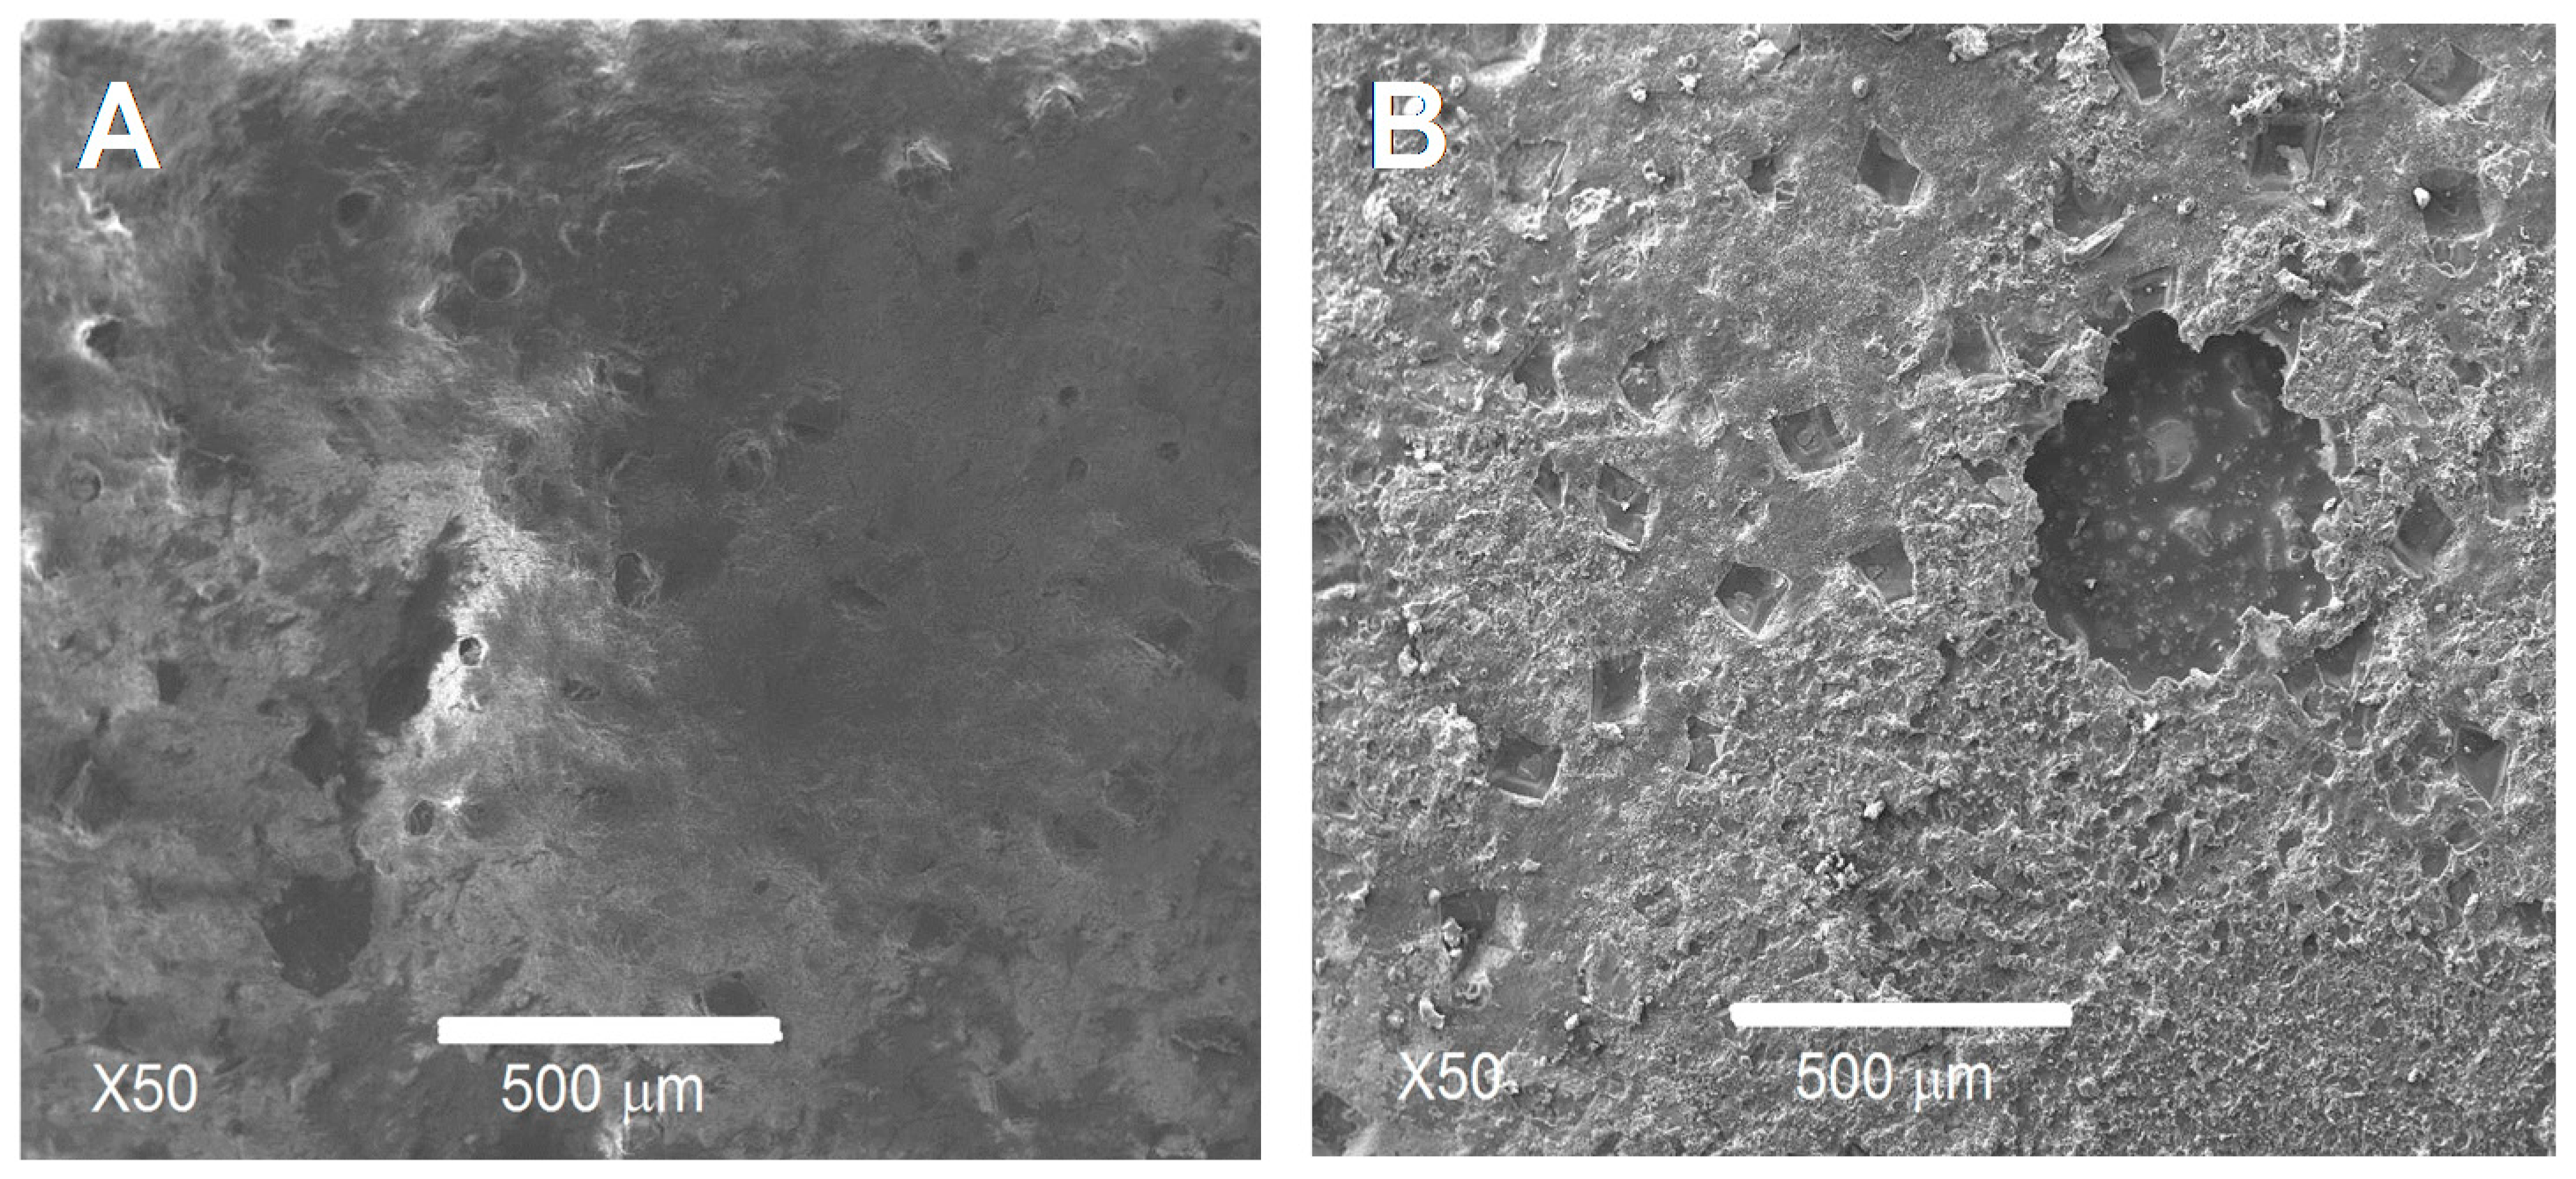
To determine where the break takes place, the surfaces of samples used in the adhesion tests were observed by SEM (
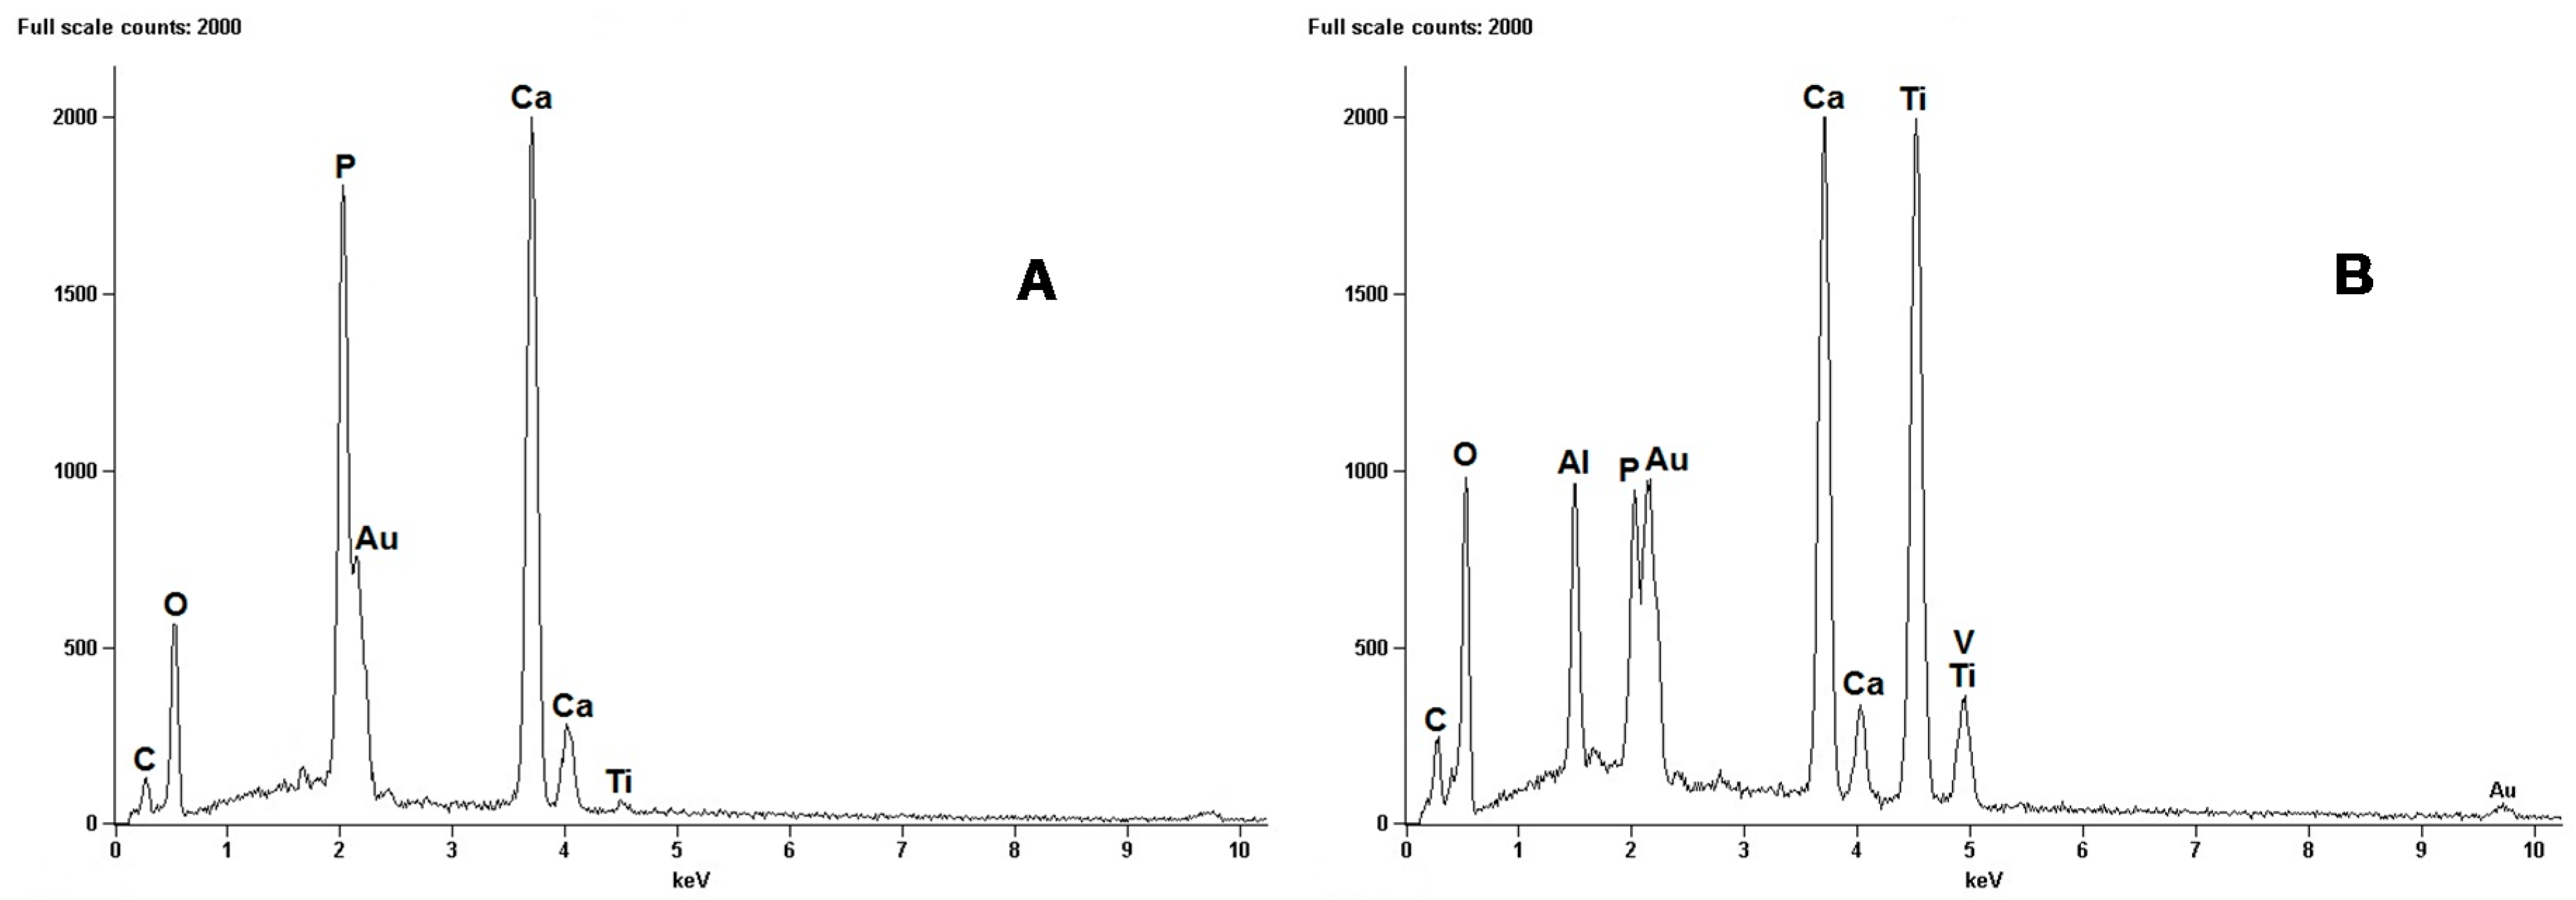
Figure 5). It was readily appreciated that the mechanical failure always occurred inside the HAp coating layer and only in a few points between the coating and the adhesive that joins both samples for the test. From these results, it was ensured that the resistance between the HAp coating and Ti6Al4V alloy substrate can reach values higher than those obtained. In order to confirm the above exposed, a global EDX analysis was made on each side of the samples used in the adhesion test, which are shown in the micrographs of
Figure 6.
EDX results showed the presence of HAp covering each side of the analysed samples after the adhesion test. These results allow affirming that the rupture occurs inside the coating layer in almost all the tested area and not at the coating/metallic substrate interface. This occurs due to the strong adhesion of the HAp layer onto the surface of the Ti6Al4V alloy. This high adhesion can be a result of a primary chemical bond, produced by the formation of Ca3(PO4)2 and CaTi2O5, generated during the thermal treatment of crystallization of HAp films. From these results we can say that the HAp coatings obtained by the sol-gel methodology here proposed, have enough adhesion to be used as coatings in metallic orthopaedic prosthesis.
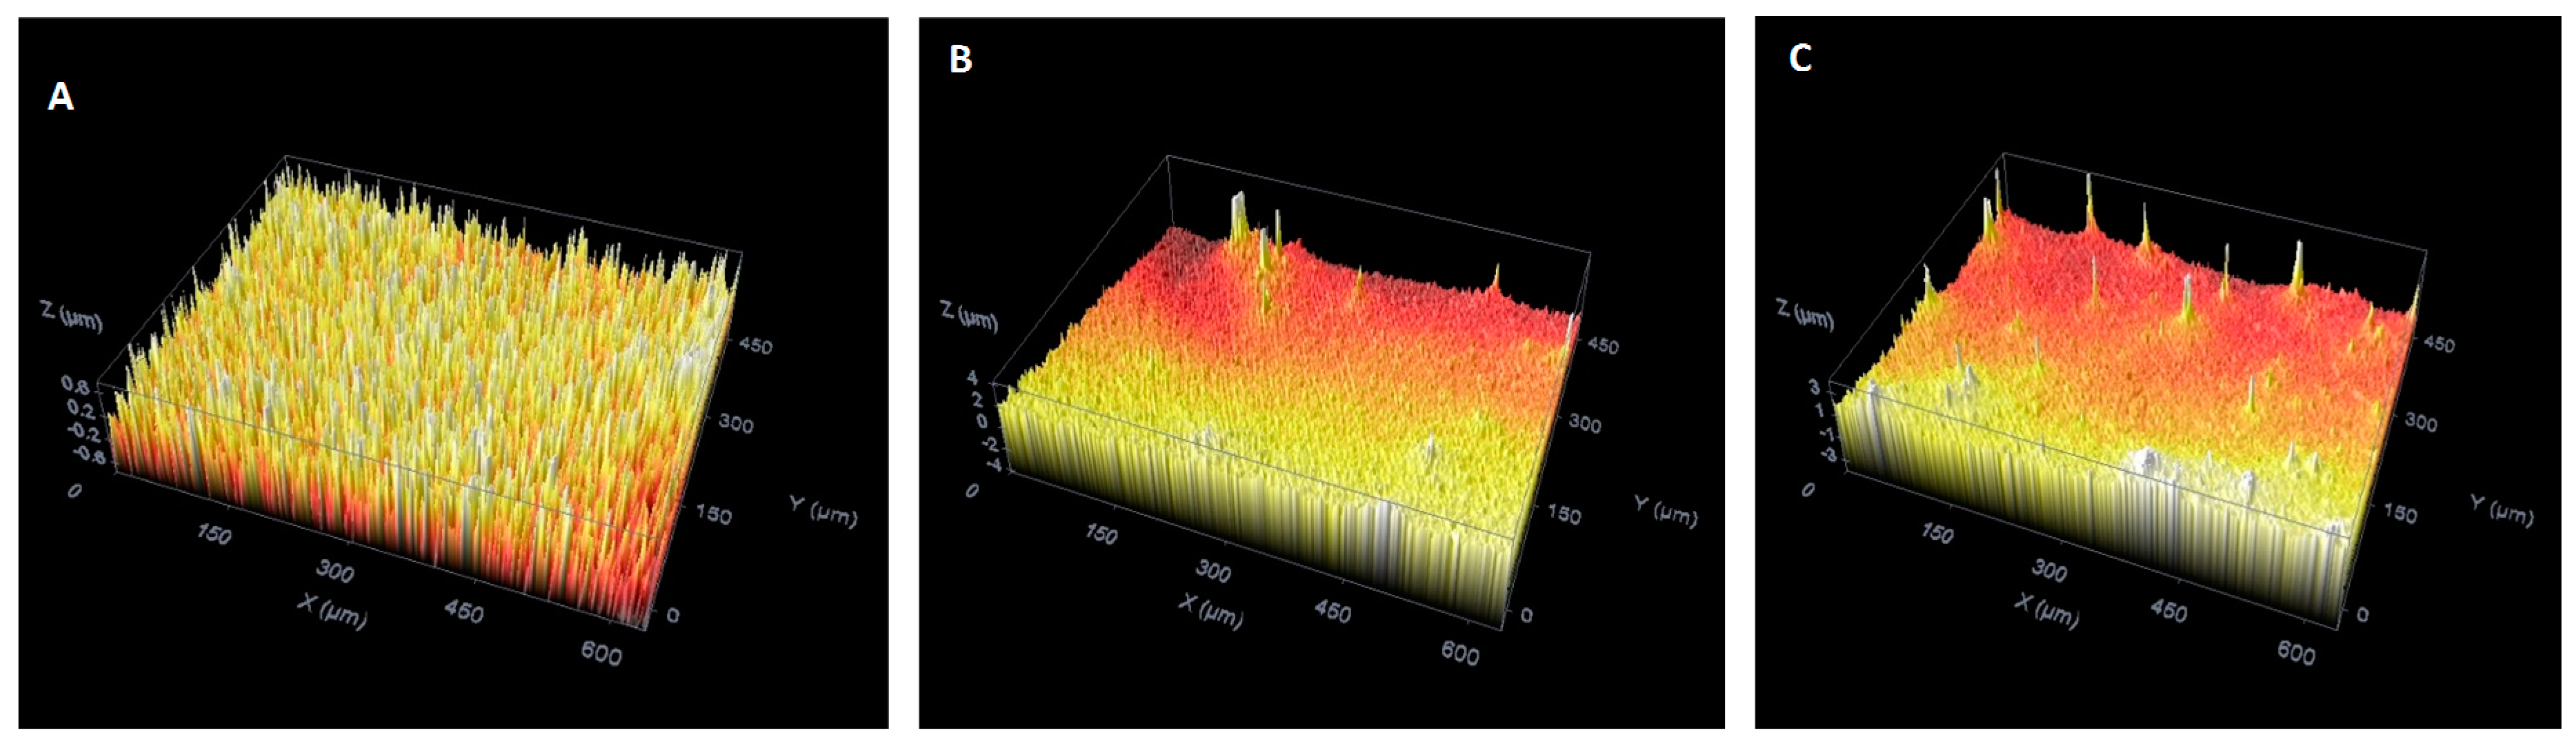
Confocal microscopy was applied to study the roughness and topography of the surface of the prepared films.
Figure 7 shows the topographic images taken of the uncoated Ti6Al4V surface (
Figure 7A) and the HAp coatings on Ti6Al4V thermally treated at 600 °C/2 h (
Figure 7B) and 800 °C/2 h (
Figure 7C), respectively.
The roughness of the film is a critical factor that affects the implant fixation period and the fixation strength with the body tissue. The roughness parameters that were obtained from 3D image analysis by means of confocal microscopy technique are summarized in
Table 4.
The Ra roughness value increases for the HAp coated samples thermally treated at 600 °C/2 h and 800 °C/2 h when compared to the uncoated Ti6Al4V sample (
Table 4). This could be due to the evaporation of solvents during thermal treatment.
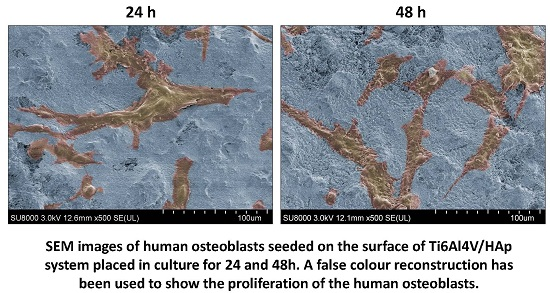
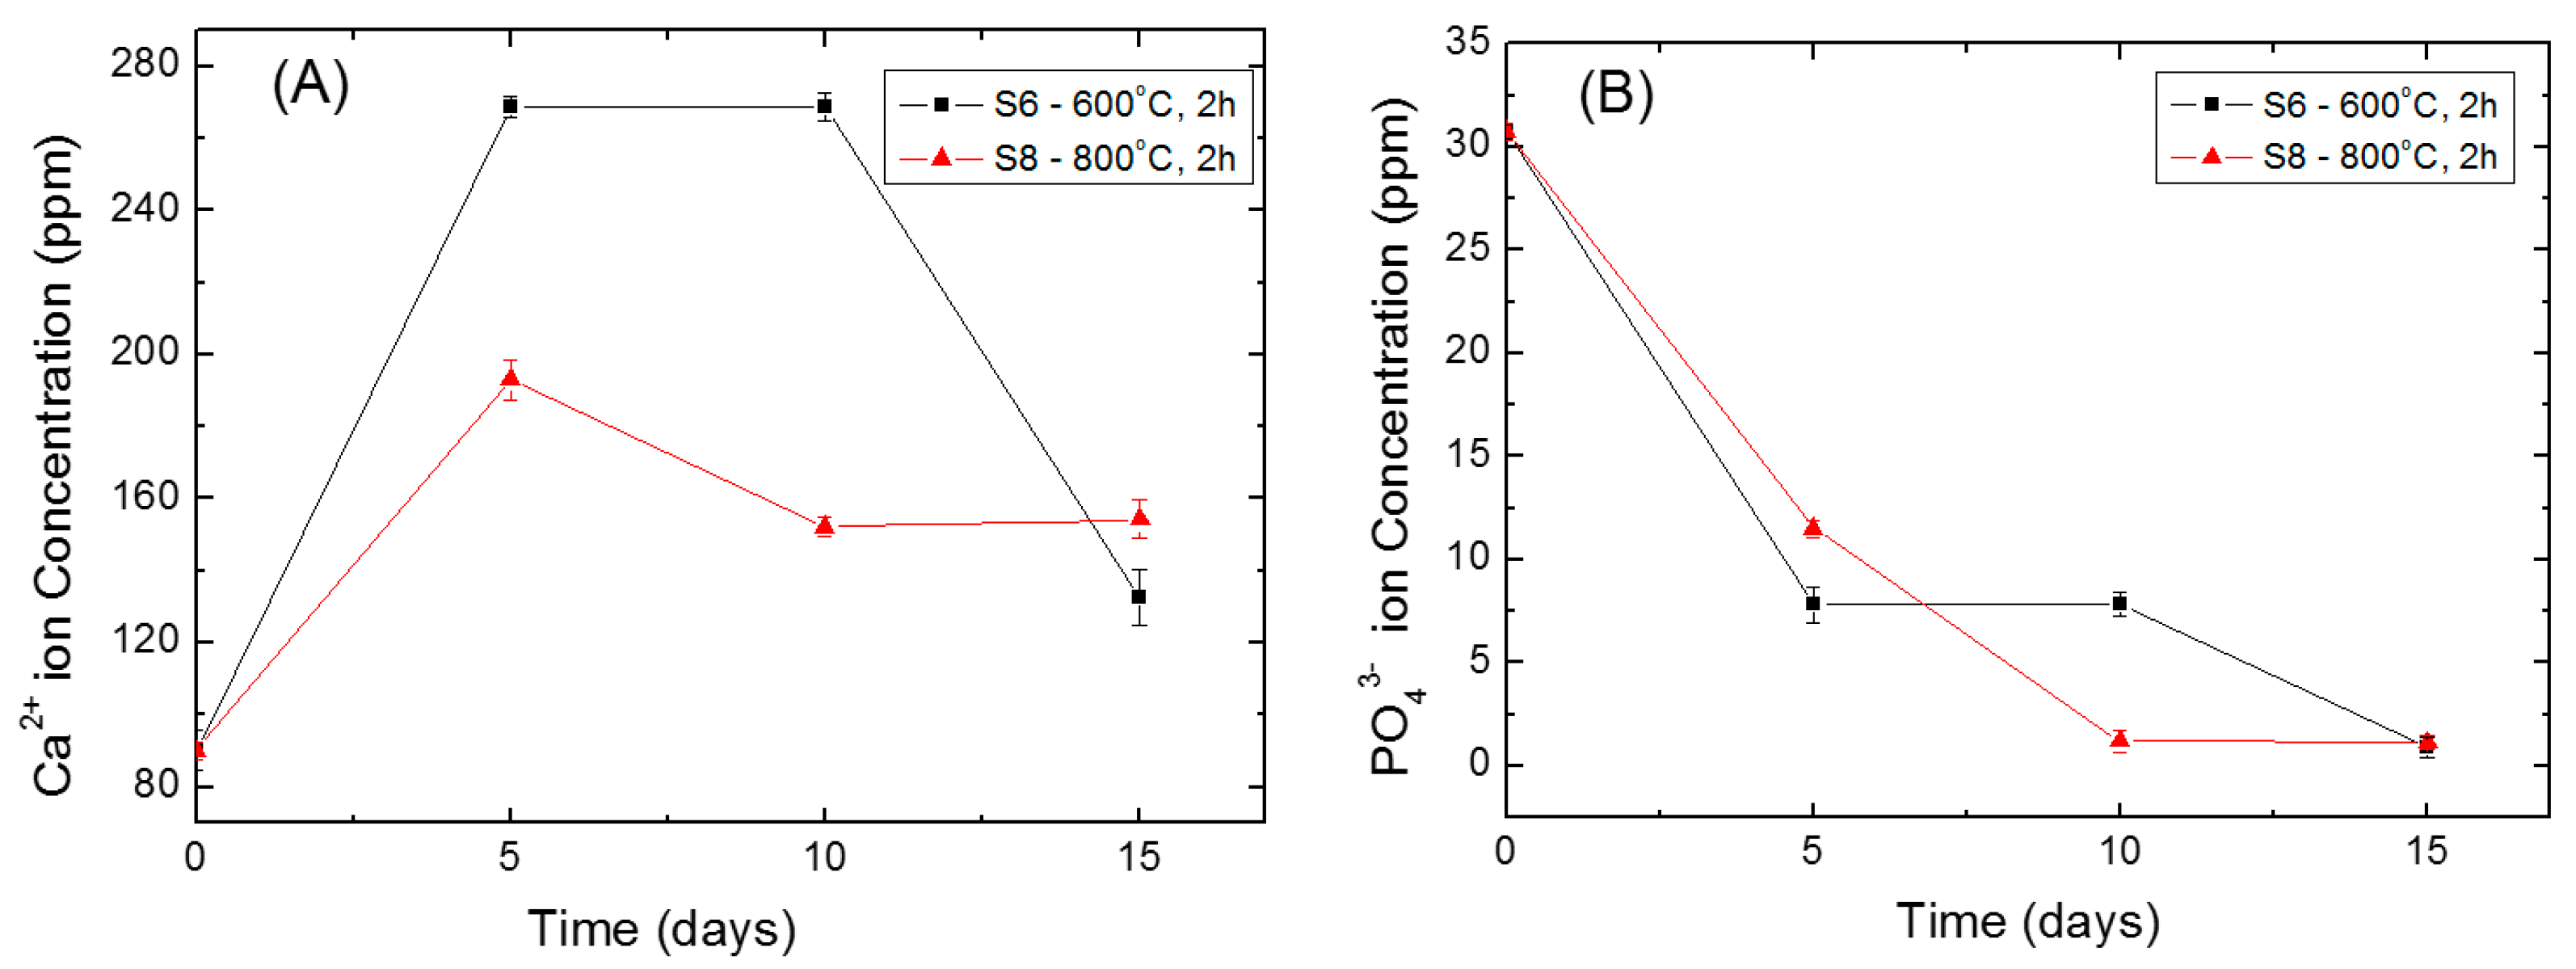
3.3. Bioactivity Assessments of the HAp-Coatings/Ti6Al4V System
The bioactivity of artificial materials can be attributed to the formation of biologically active bone-like apatite layer. This layer can be formed onto the surface of the sample upon immersion in Kokubo’s simulated body fluid [
35,
36,
37]. The concentration of Ca
2+ and PO
43− in SBF after immersion of the prepared samples is shown in
Figure 8.
An increase of the Ca
2+ concentration accompanied by a decrease of PO
43− in SBF is observed during the first 5 days (
Figure 8A,B). When the immersion time exceeds 5 days, the concentration of both ions decreases continuously. The increase in the concentration of Ca
2+ ions is due to its release from the samples into the SBF solution. This will accelerate the nucleation of apatite by increasing the ionic activity products of the apatite, i.e., make the solution more saturated with respect to the sample immersed in it. Once the apatite nuclei are formed, it will grow continuously by consuming the Ca
2+ and PO
43− ions from the solution. Thus, the concentration of both SBF components decreases with the time. This indicates that the HAp-coatings/Ti6Al4V thermally treated at 600 and 800 °C/2 h are bioactive.
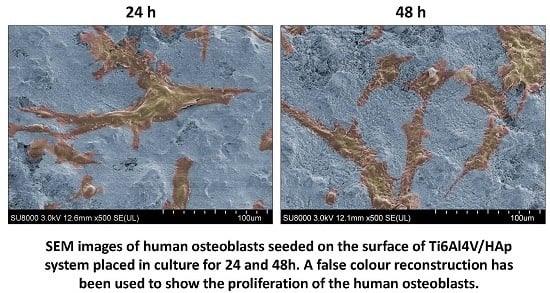
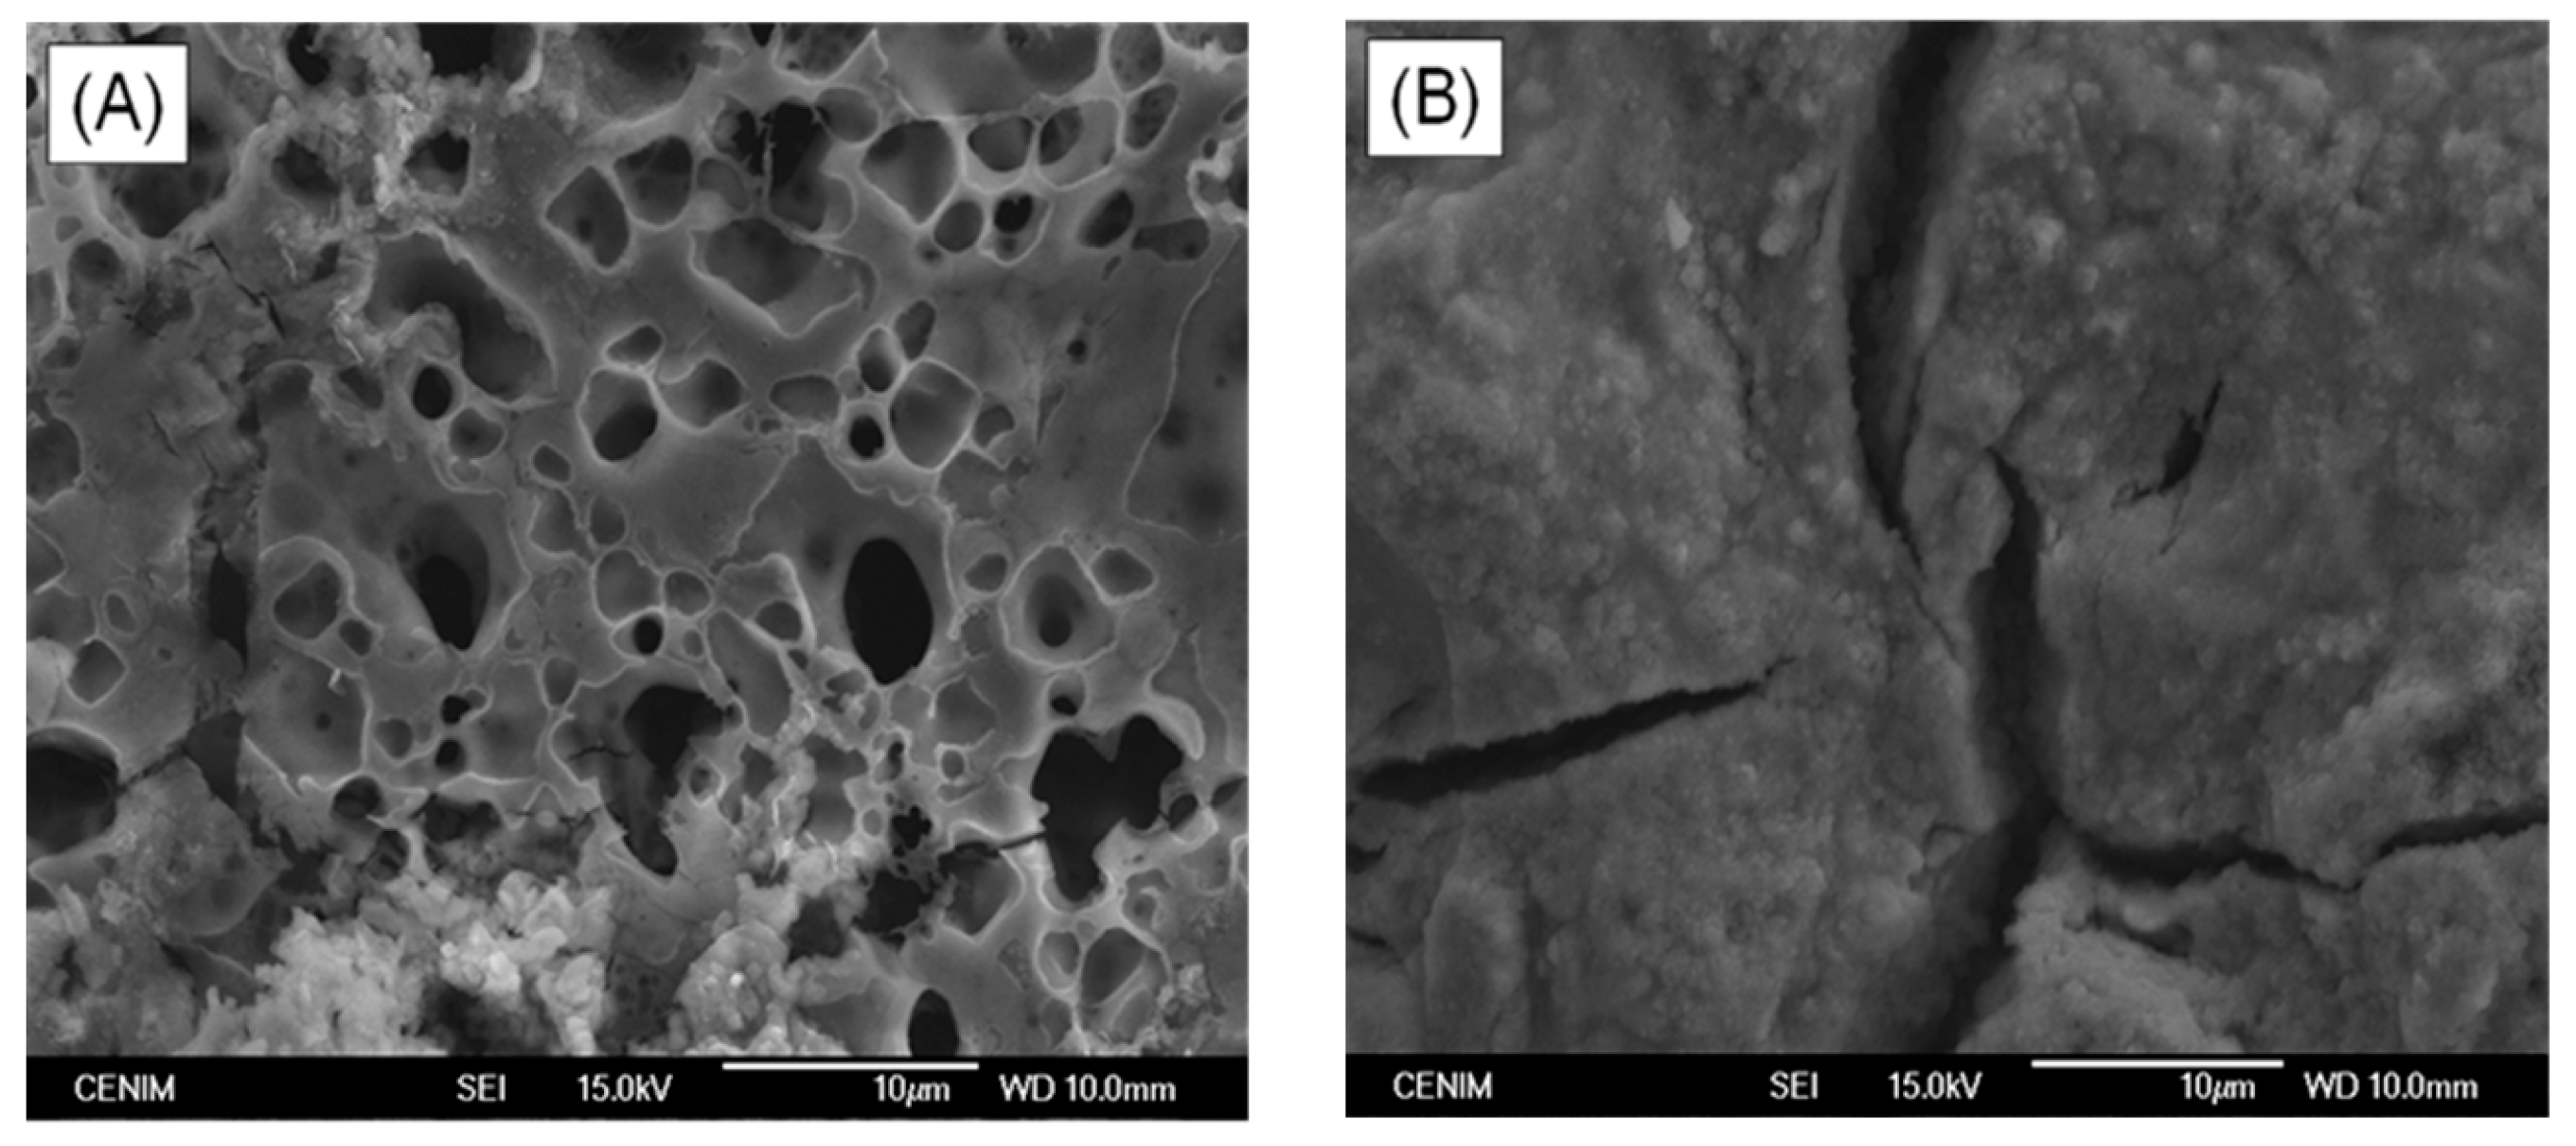
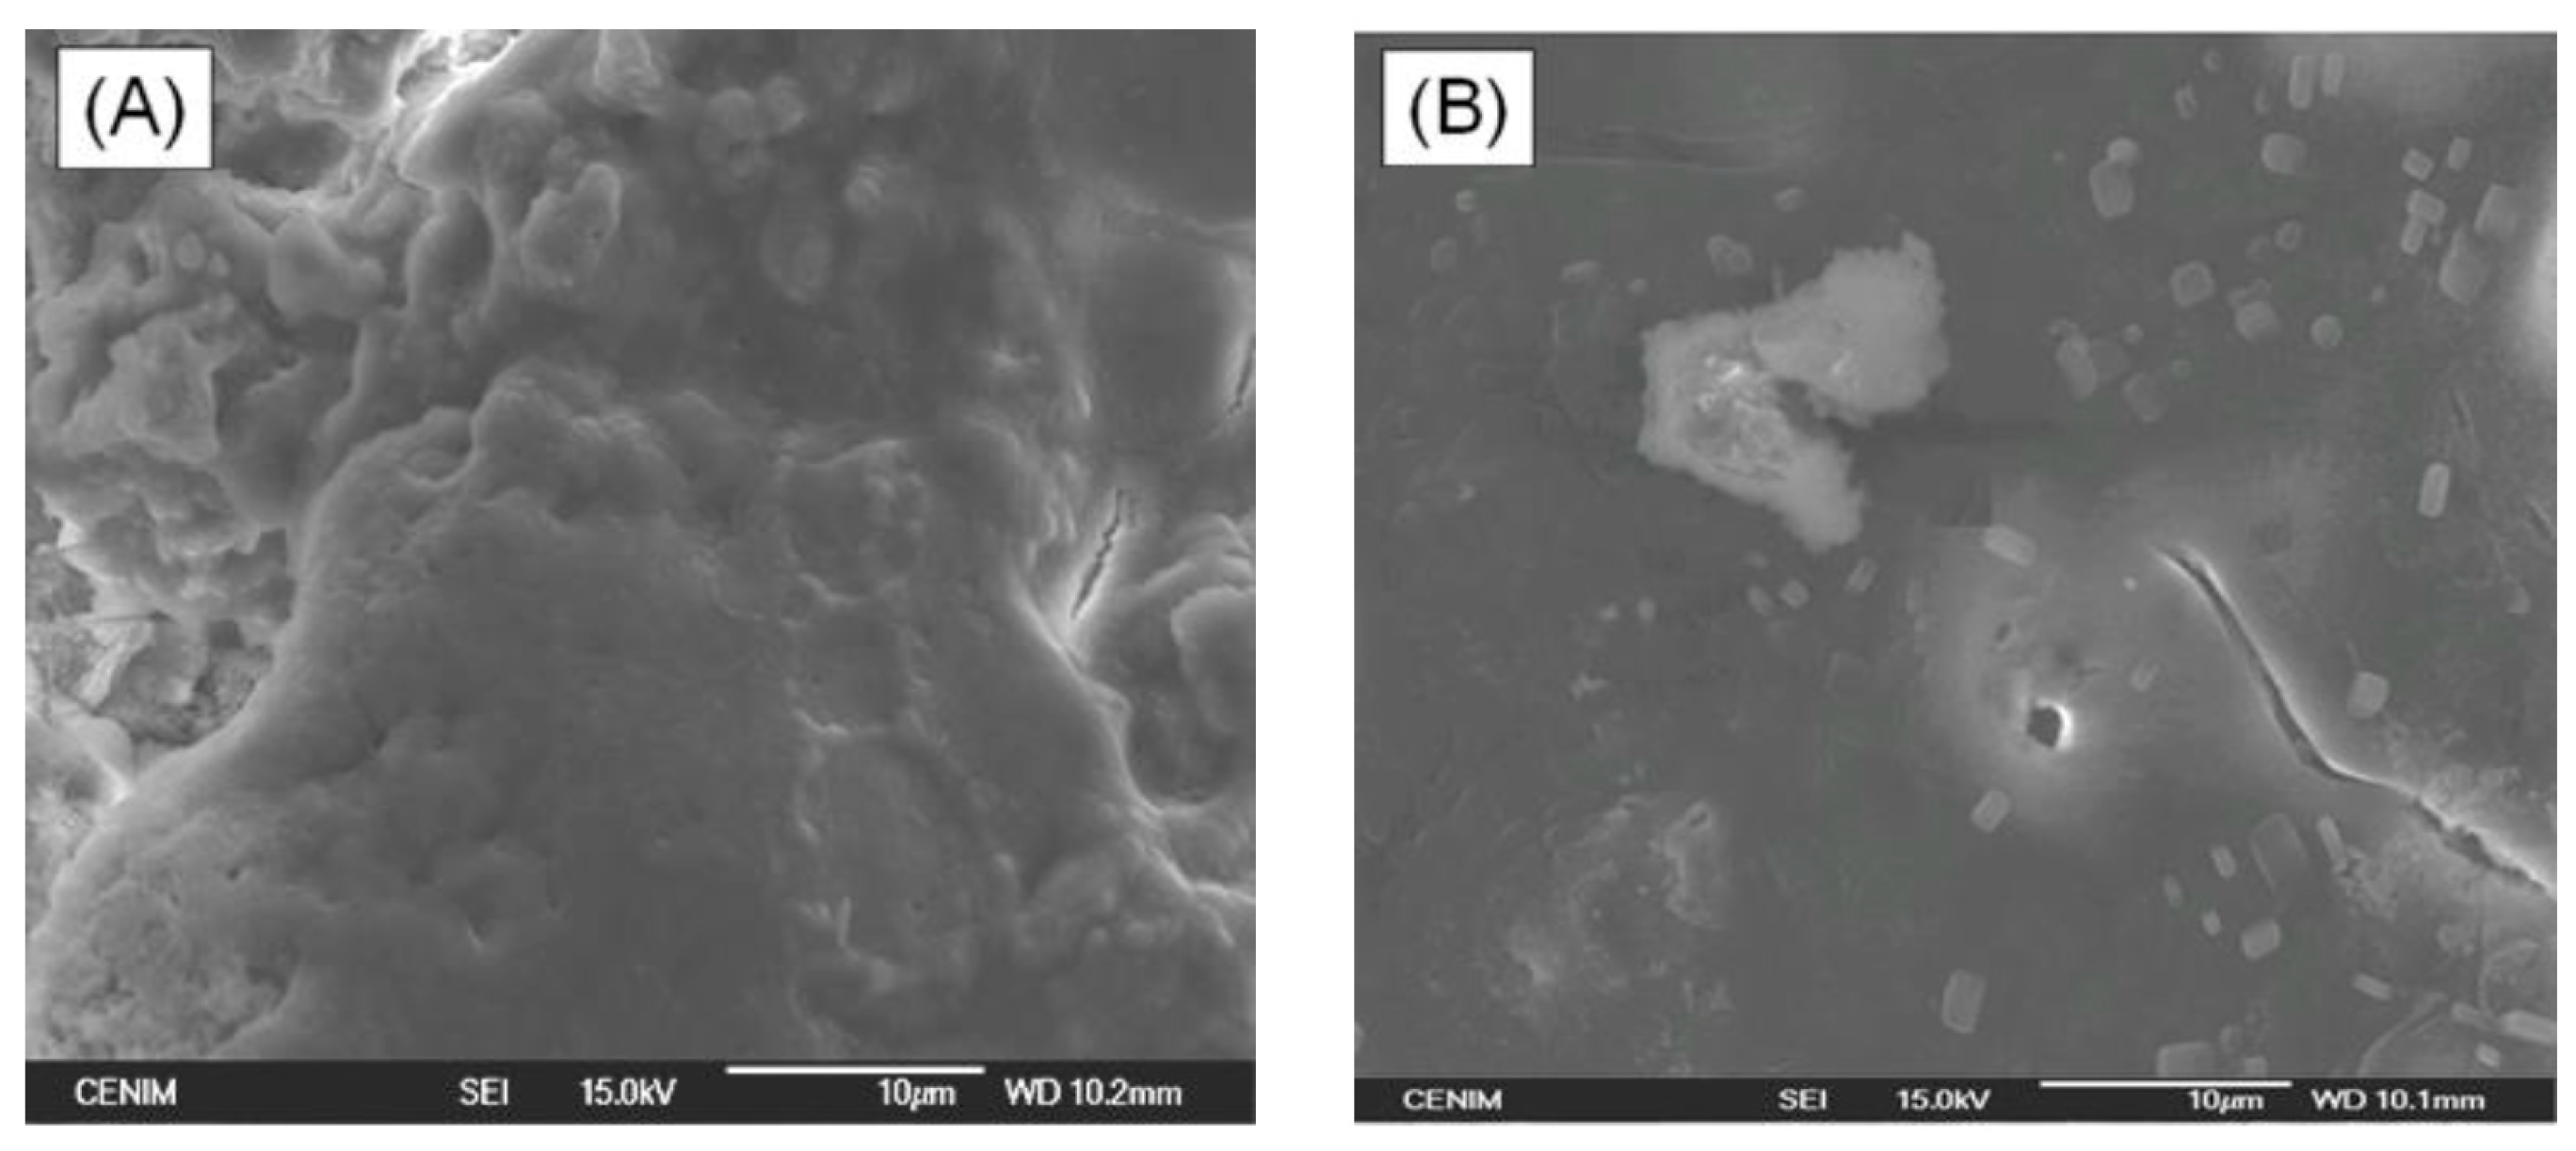
Studies of the surface morphology of selected specimens, before and after immersion in SBF, were carried out by SEM. SEM micrographs obtained for the HAp-coatings/Ti6Al4V system thermally treated at (A) 600 °C/2 h; (B) 800 °C/2 h before immersion in SBF are shown in
Figure 9. After 15 days of immersion in SBF the surface of both samples is covered with a bone-like apatite layer which proved that both samples are bioactive. The surface of the sample thermally treated at 600 °C/2 h is completely covered with these precipitations from SBF (
Figure 10A), while the surface of the sample thermally treated at 800 °C/2 h is not completely covered, as still some cracks are observed by SEM at the surface (
Figure 10B). Nevertheless, these cracks do not reach the metal surface. In this way, the HAp coating is able to act as a barrier against the aggressive SBF solution and to protect the Ti6Al4V alloy against corrosion.
3.5. Corrosion Behaviour
Electrochemical impedance spectroscopy (EIS) was used for evaluating the barrier properties of the HAp coatings and the corrosion behaviour of the HAp-coatings/Ti6Al4V systems.
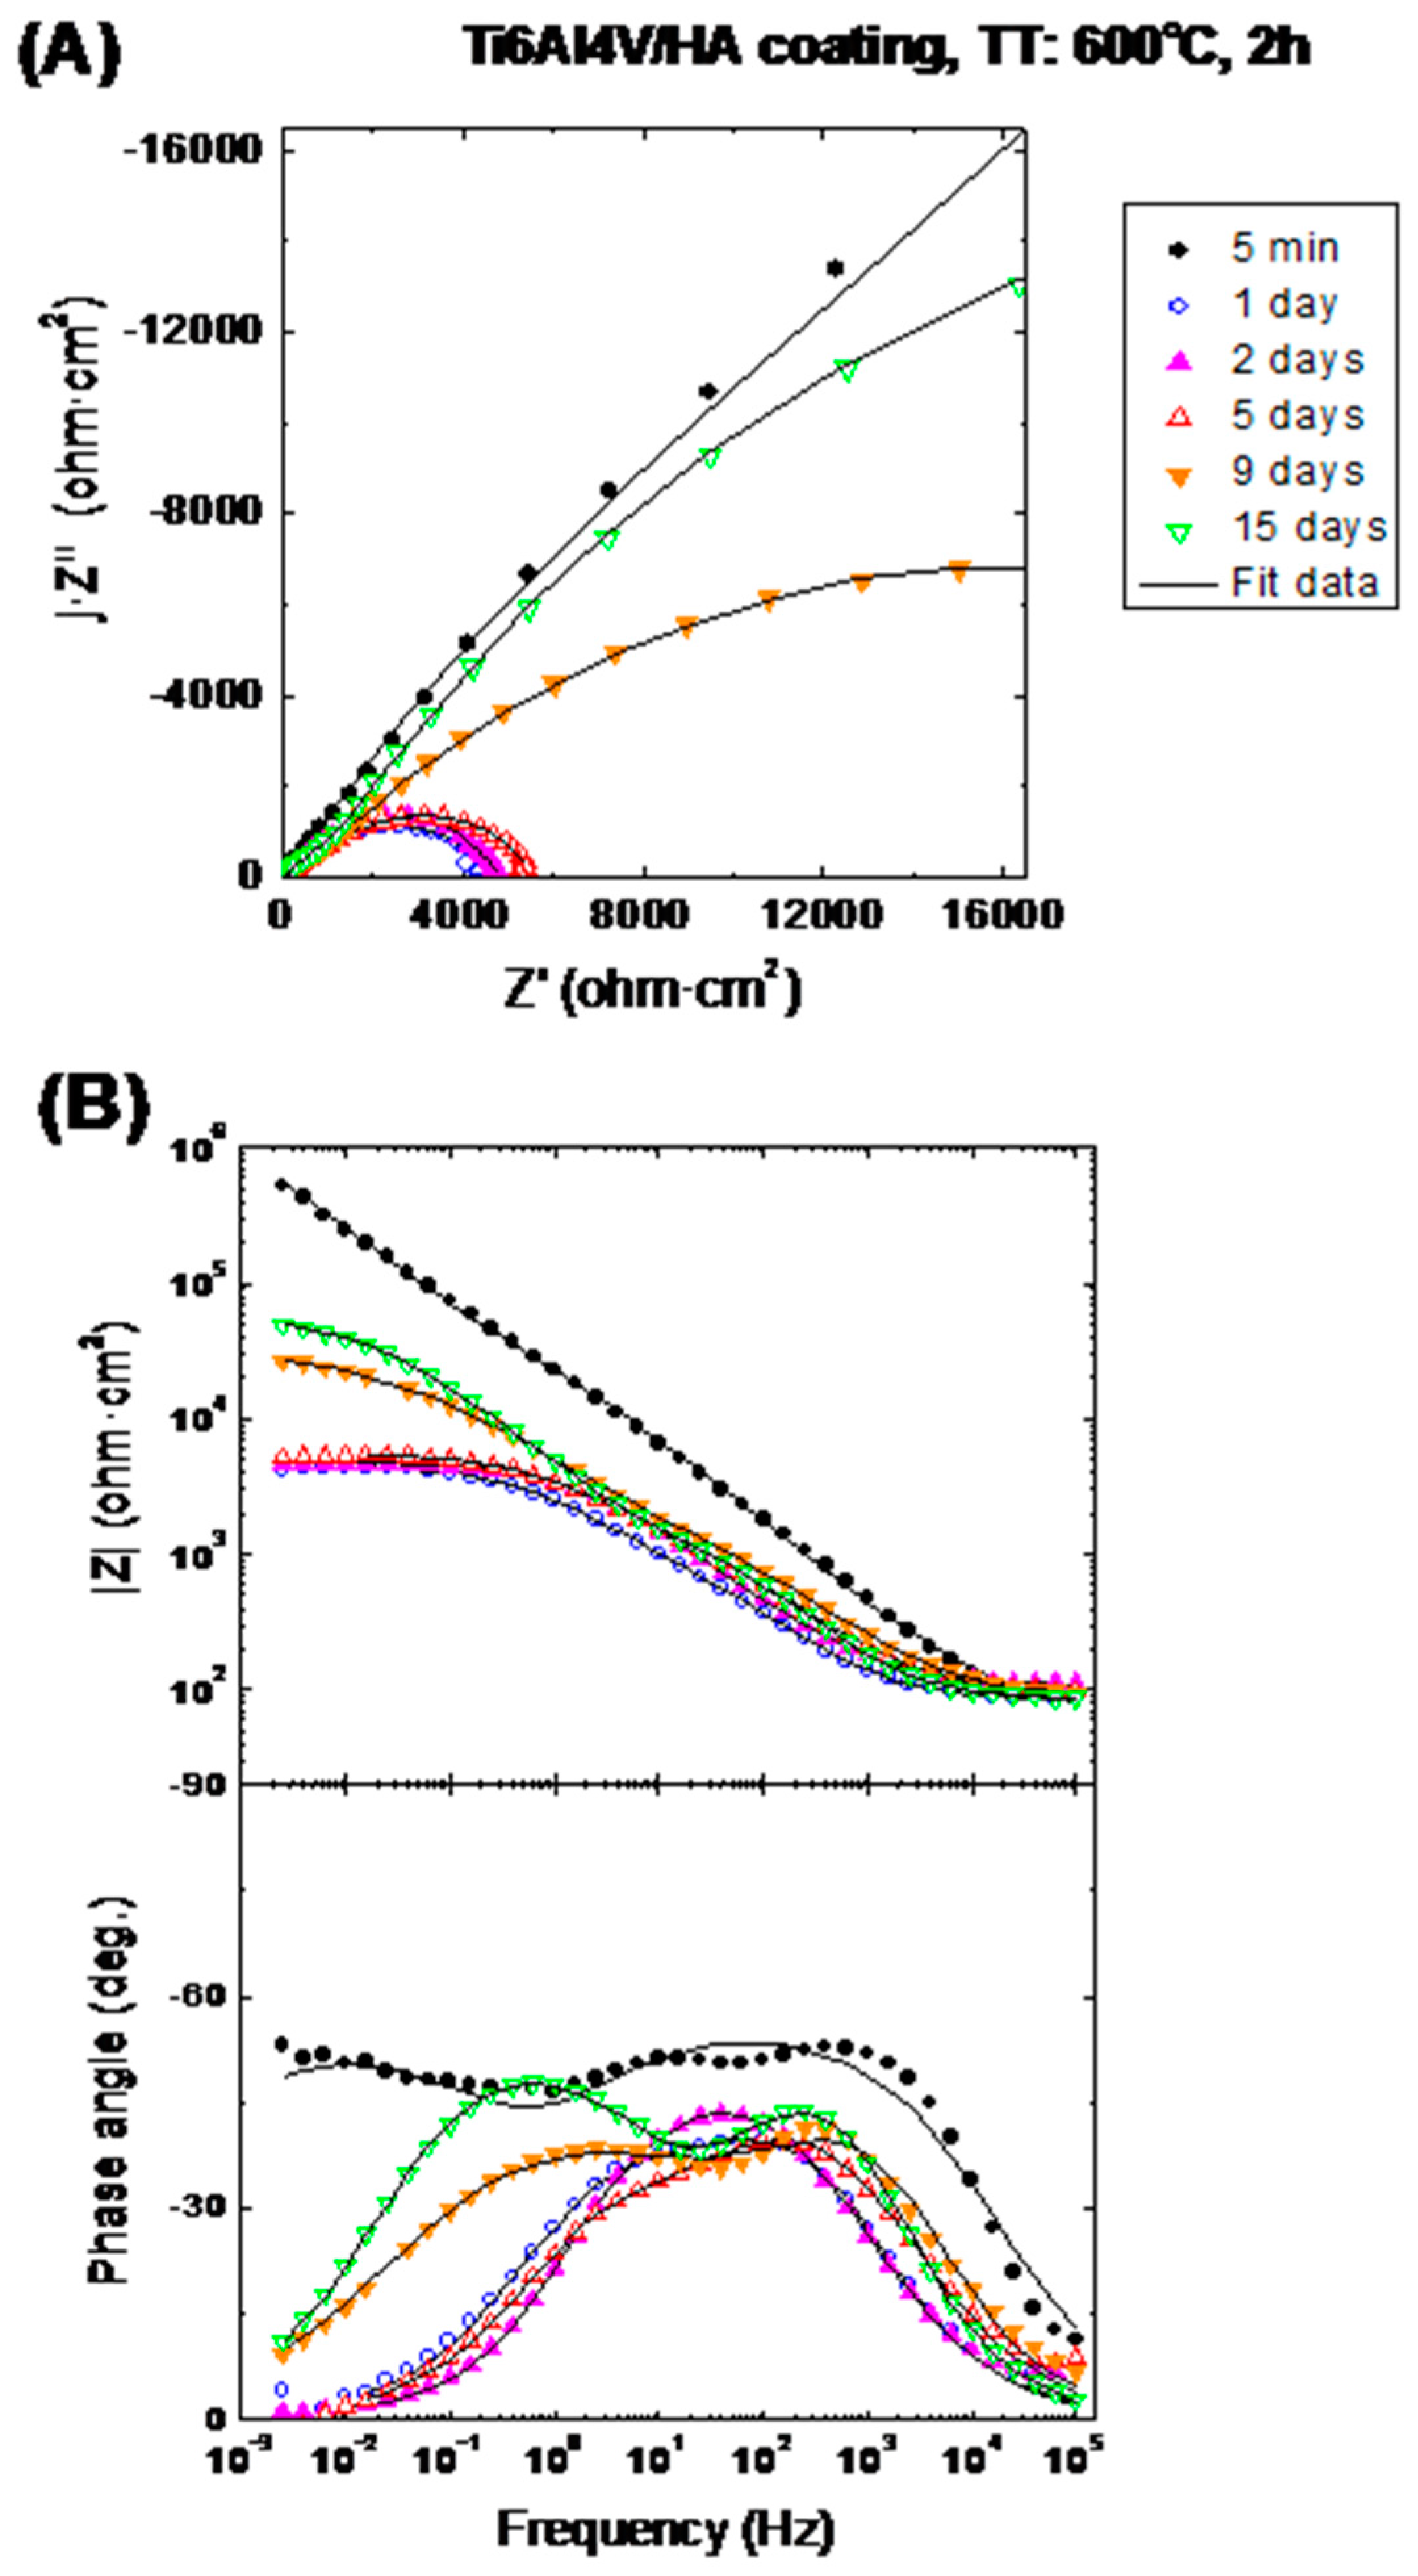
Figure 14 and
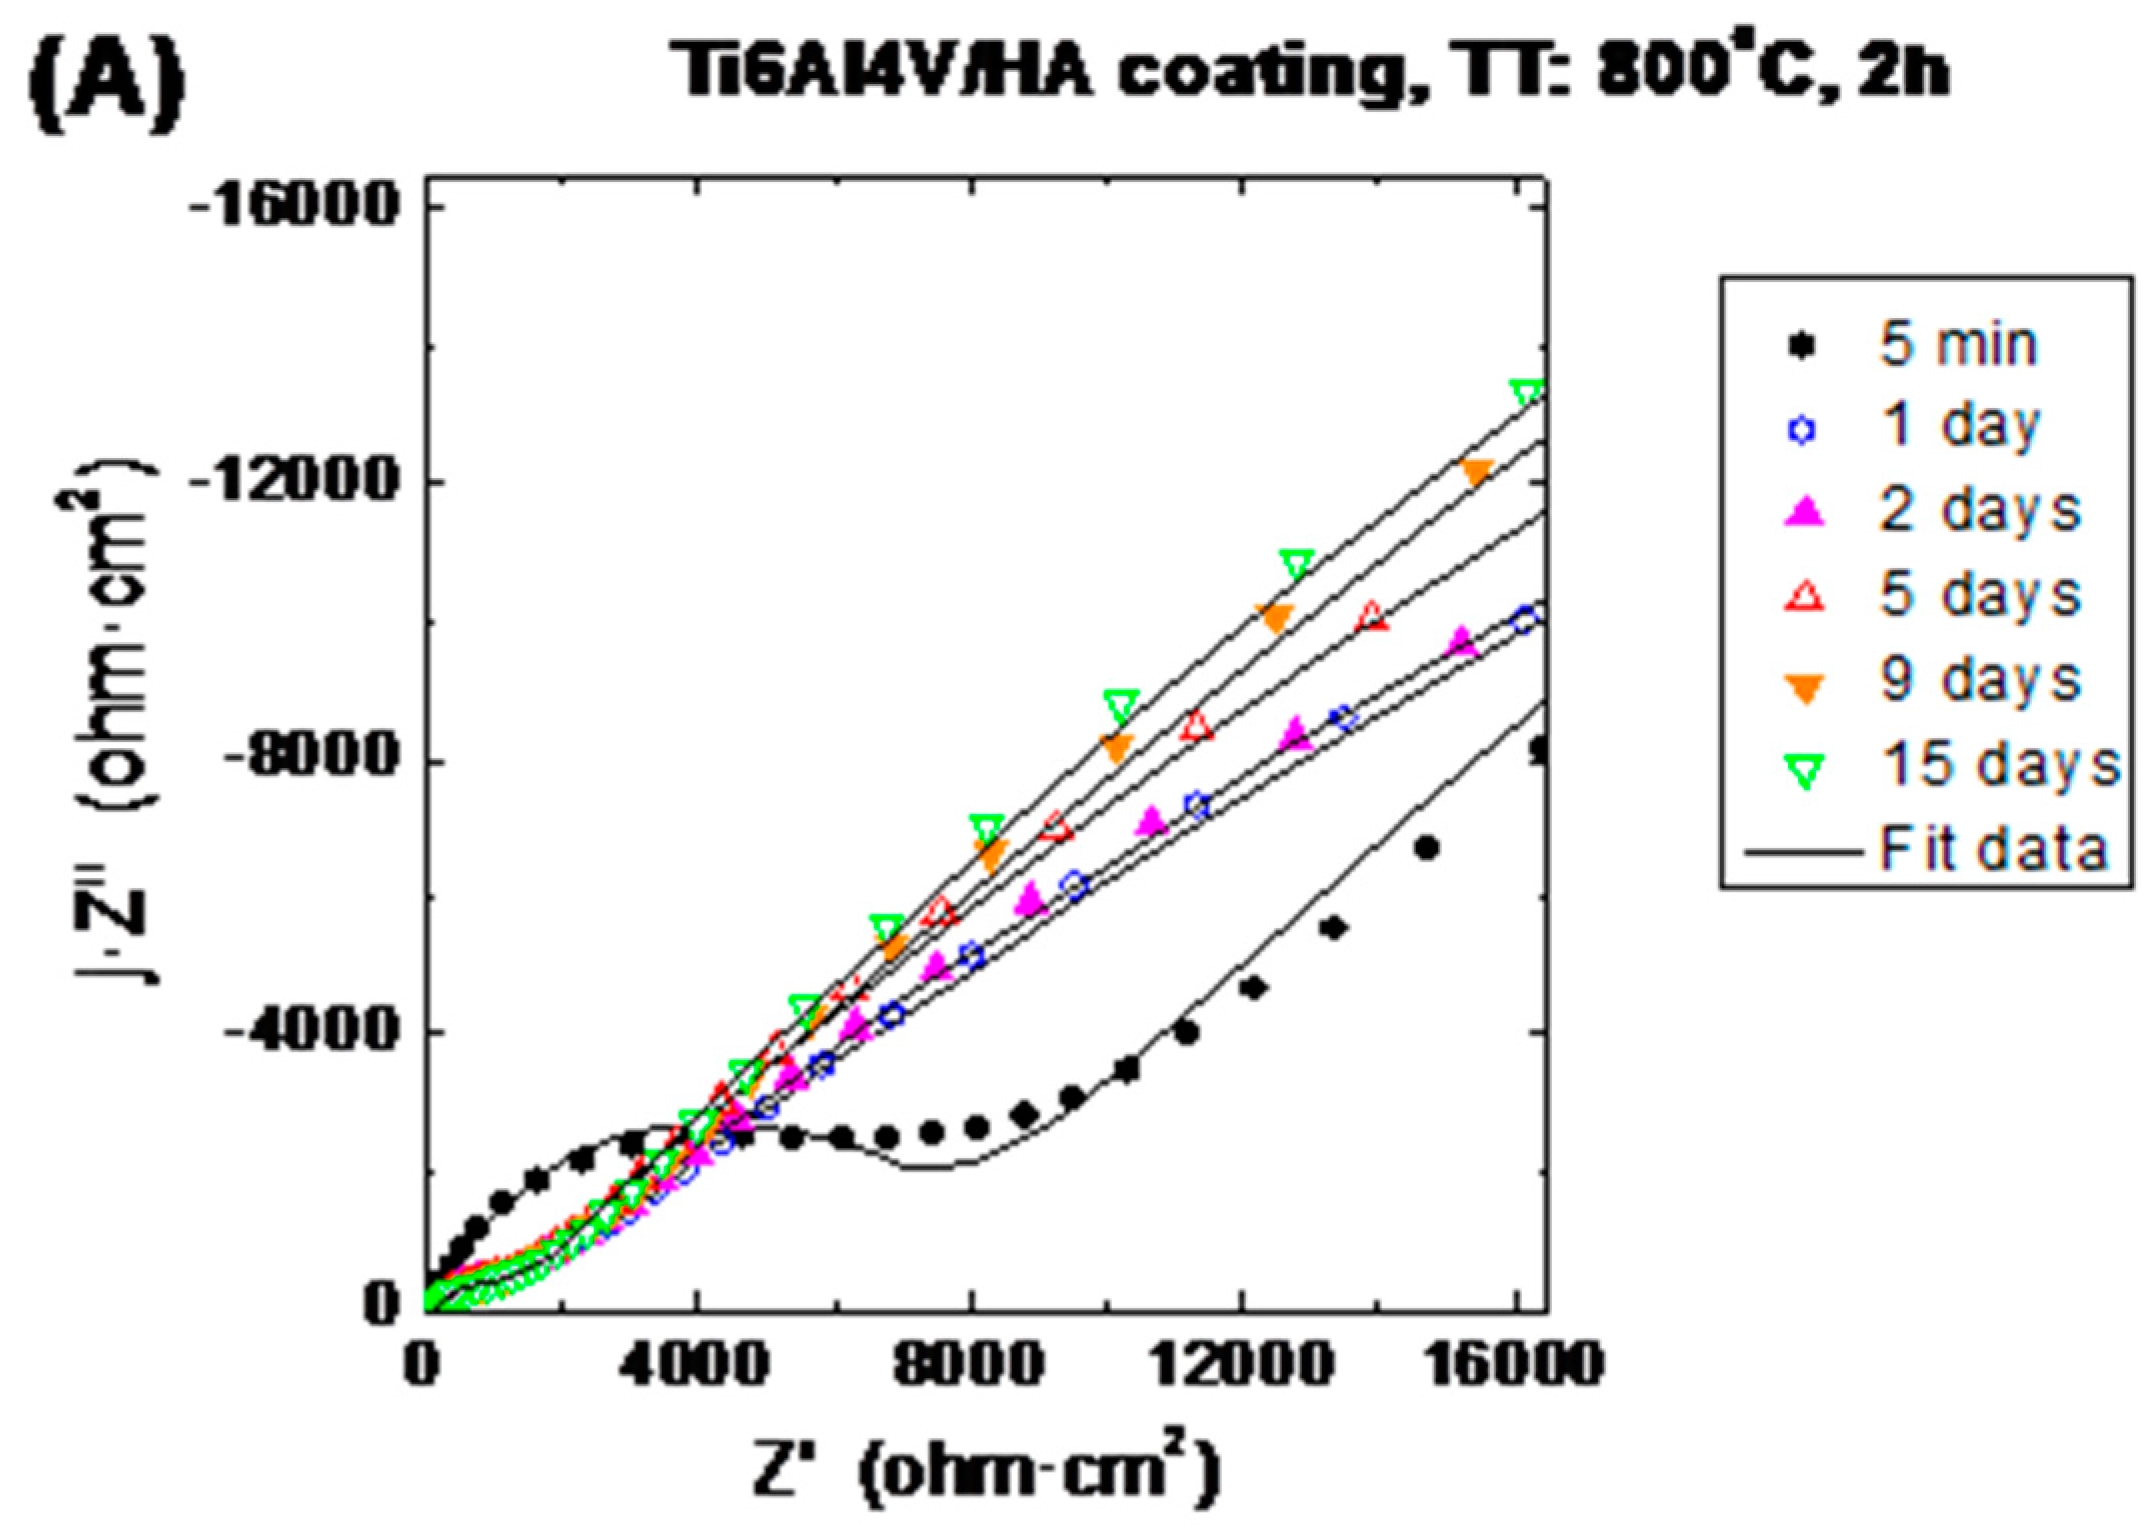
Figure 15 show the evolution of the impedance plots with the immersion time in SBF for the HAp-coatings/Ti6Al4V systems thermally treated at 600 °C/2 h and 800 °C/2 h, respectively.
Figure 14A and
Figure 15A show the impedance data represented as Nyquist plots, where the imaginary part (Z′′) of the impedance vector
Z(f) is represented in the complex plane against the real part (Z′) of this vector, with the frequency (f) as implicit variable [
38,
39].
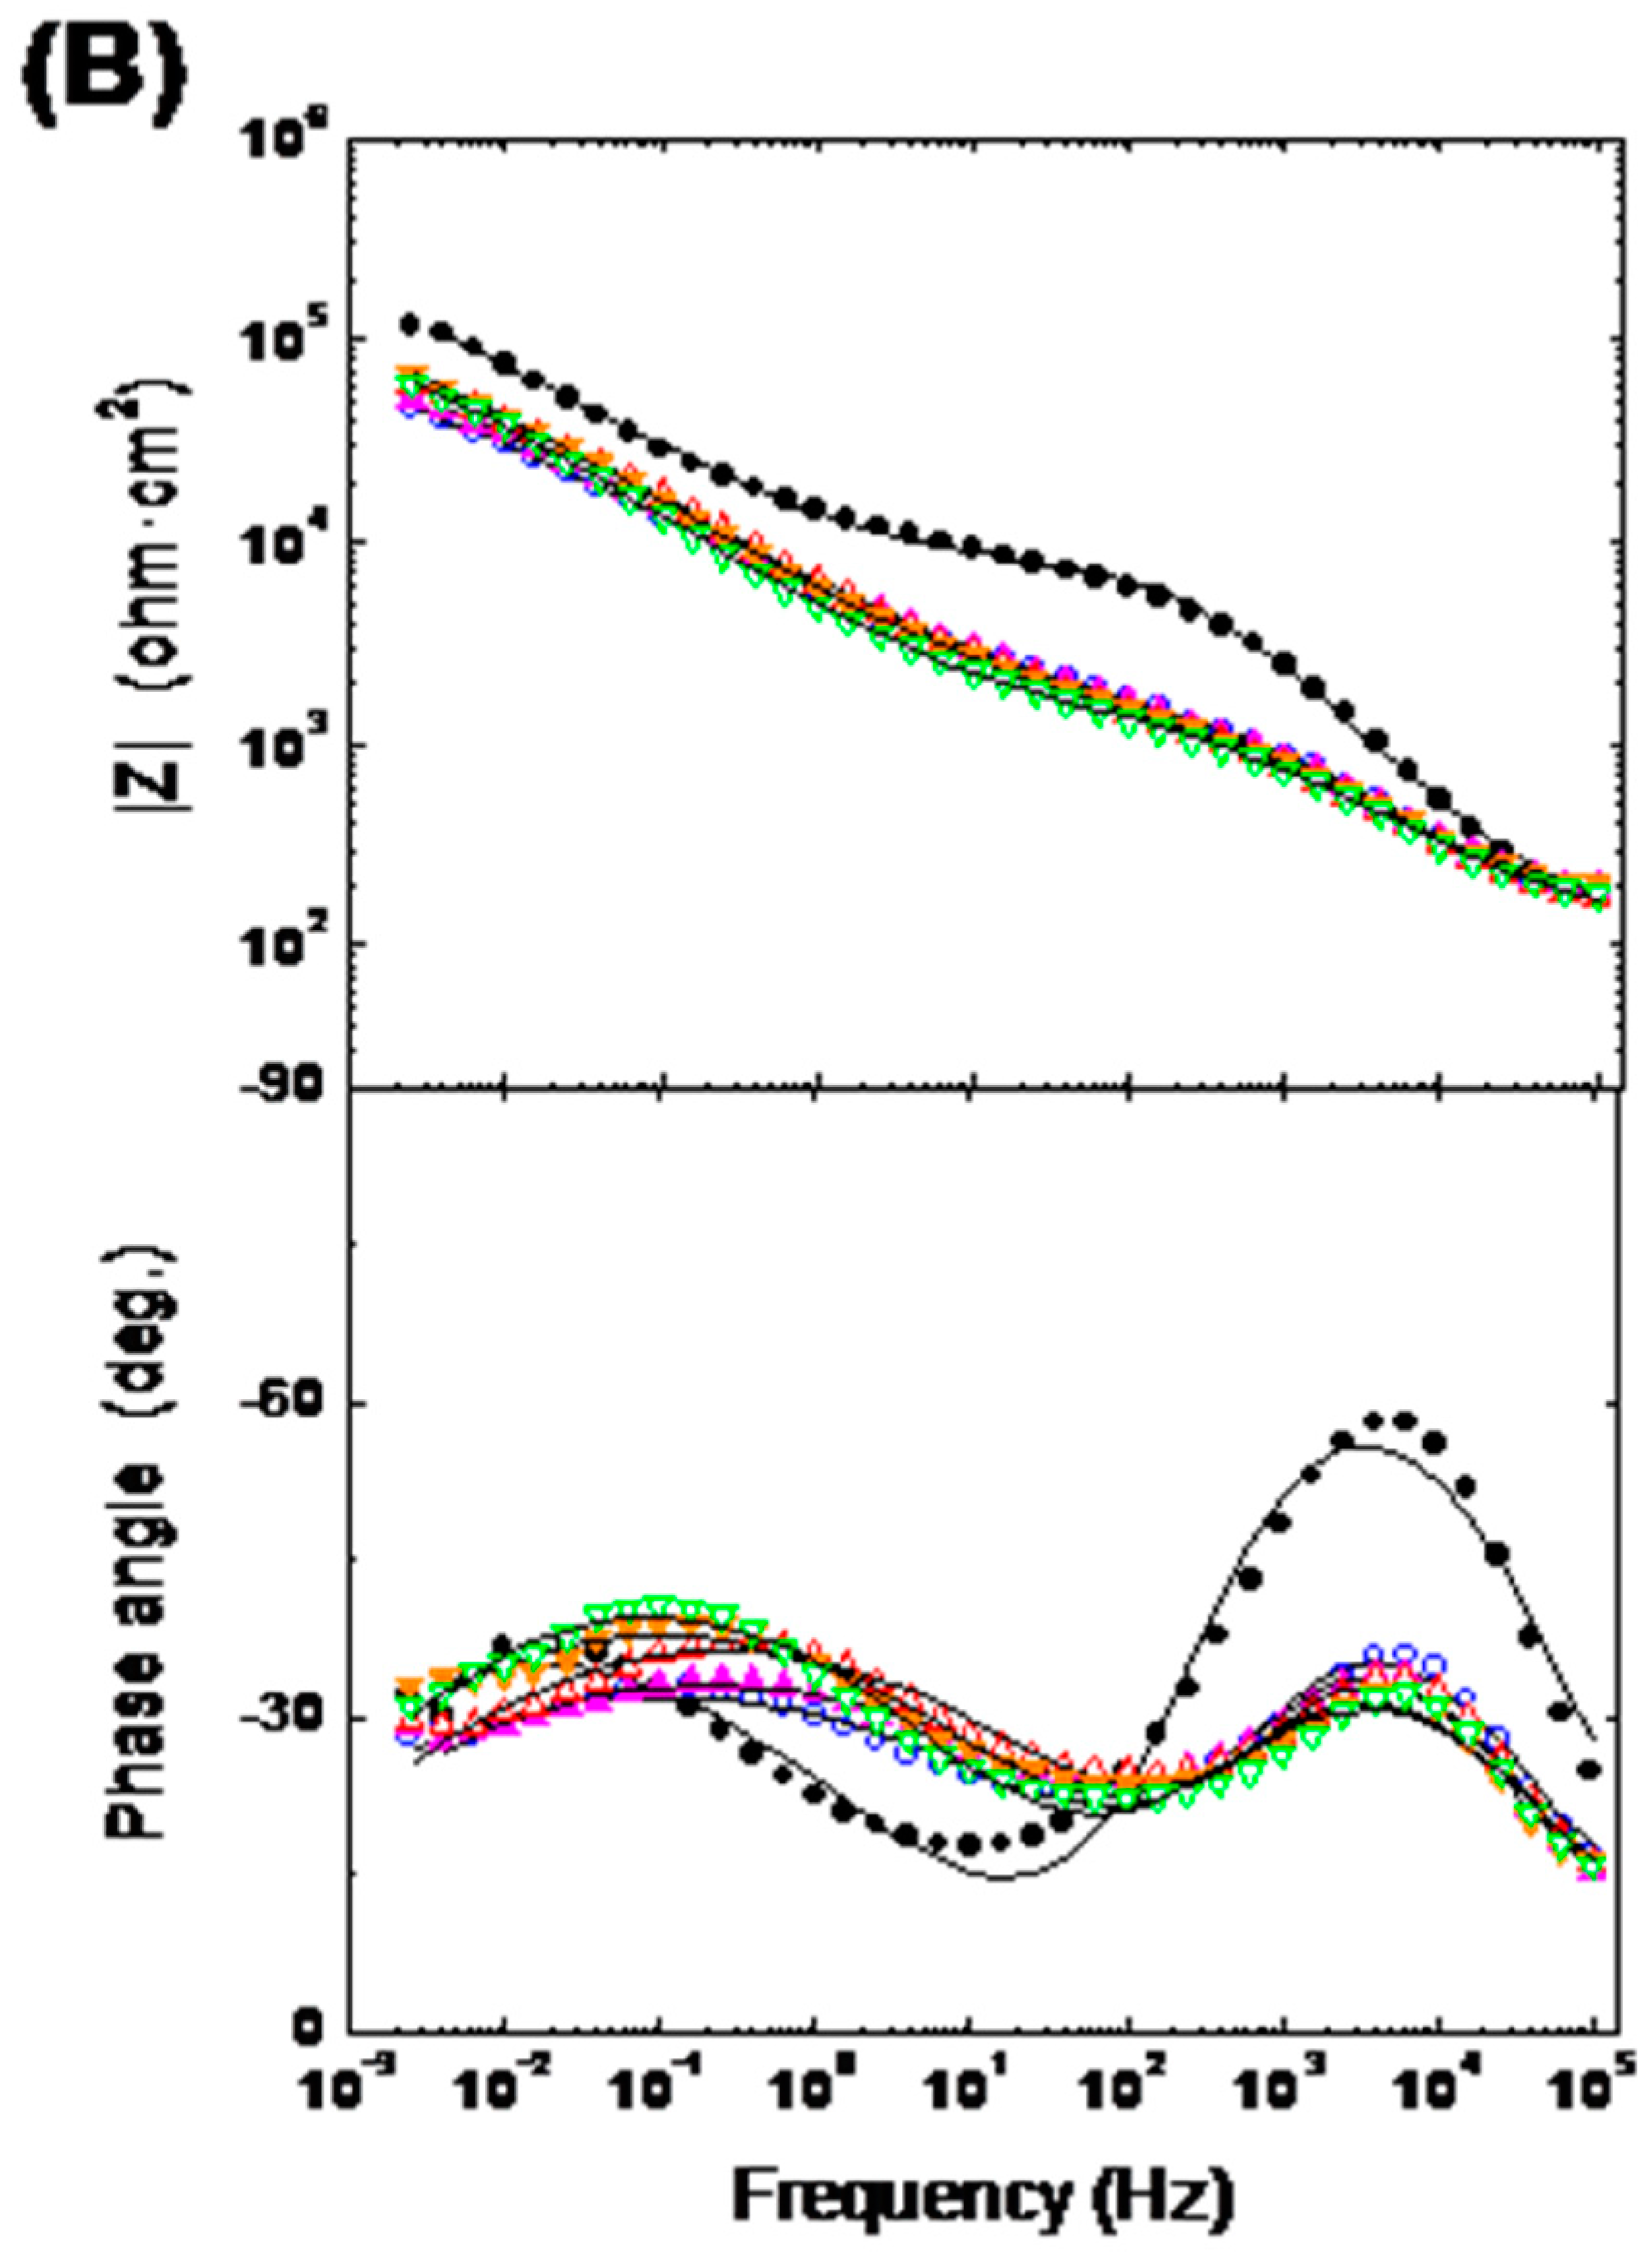
Figure 14B and
Figure 15B show the same impedance data in Bode representation. In the Bode diagrams the logarithm of the magnitude of the impedance vector (log |
Z|) and the phase angle (θ) are plotted against the logarithm of frequency (log f) of the applied sinusoidal electric voltage signals [
39].
Electrochemical techniques are well suited to monitor changes over time of the interface between metal surfaces and aqueous solutions [
39,
40,
41]. From EIS, information on the interface capacitance (thus oxide films, adsorption processes) and the interface resistance (charge transfer processes, dissolution of ions from metal alloys as for instance metallic implant materials) can be obtained [
16,
40,
41]. In addition, in the studies of coated metals, information about the protective nature of the coating can be also obtained [
42]. In this case, the coating capacitance provides information on the thickness and the degree of surface coverage [
43,
44,
45]. The coating capacitance value usually changes over the time in contact with aqueous solutions. The change depends on the barrier properties afforded by the coating against the ingress of water [
43,
44,
45]. Finally, the coating resistance provides information about the ionic resistance of coating systems immersed in aqueous solutions. The changes of the ionic resistance with the immersion time are due to the penetration of the electrolyte through the intrinsic porous of the coating [
43,
44,
45]. All these concepts can be extrapolated to the studies related with the corrosion behaviour of coated metallic implants in contact with the simulated body fluids.
3.5.1. Selection of the Electrical Equivalent Circuit
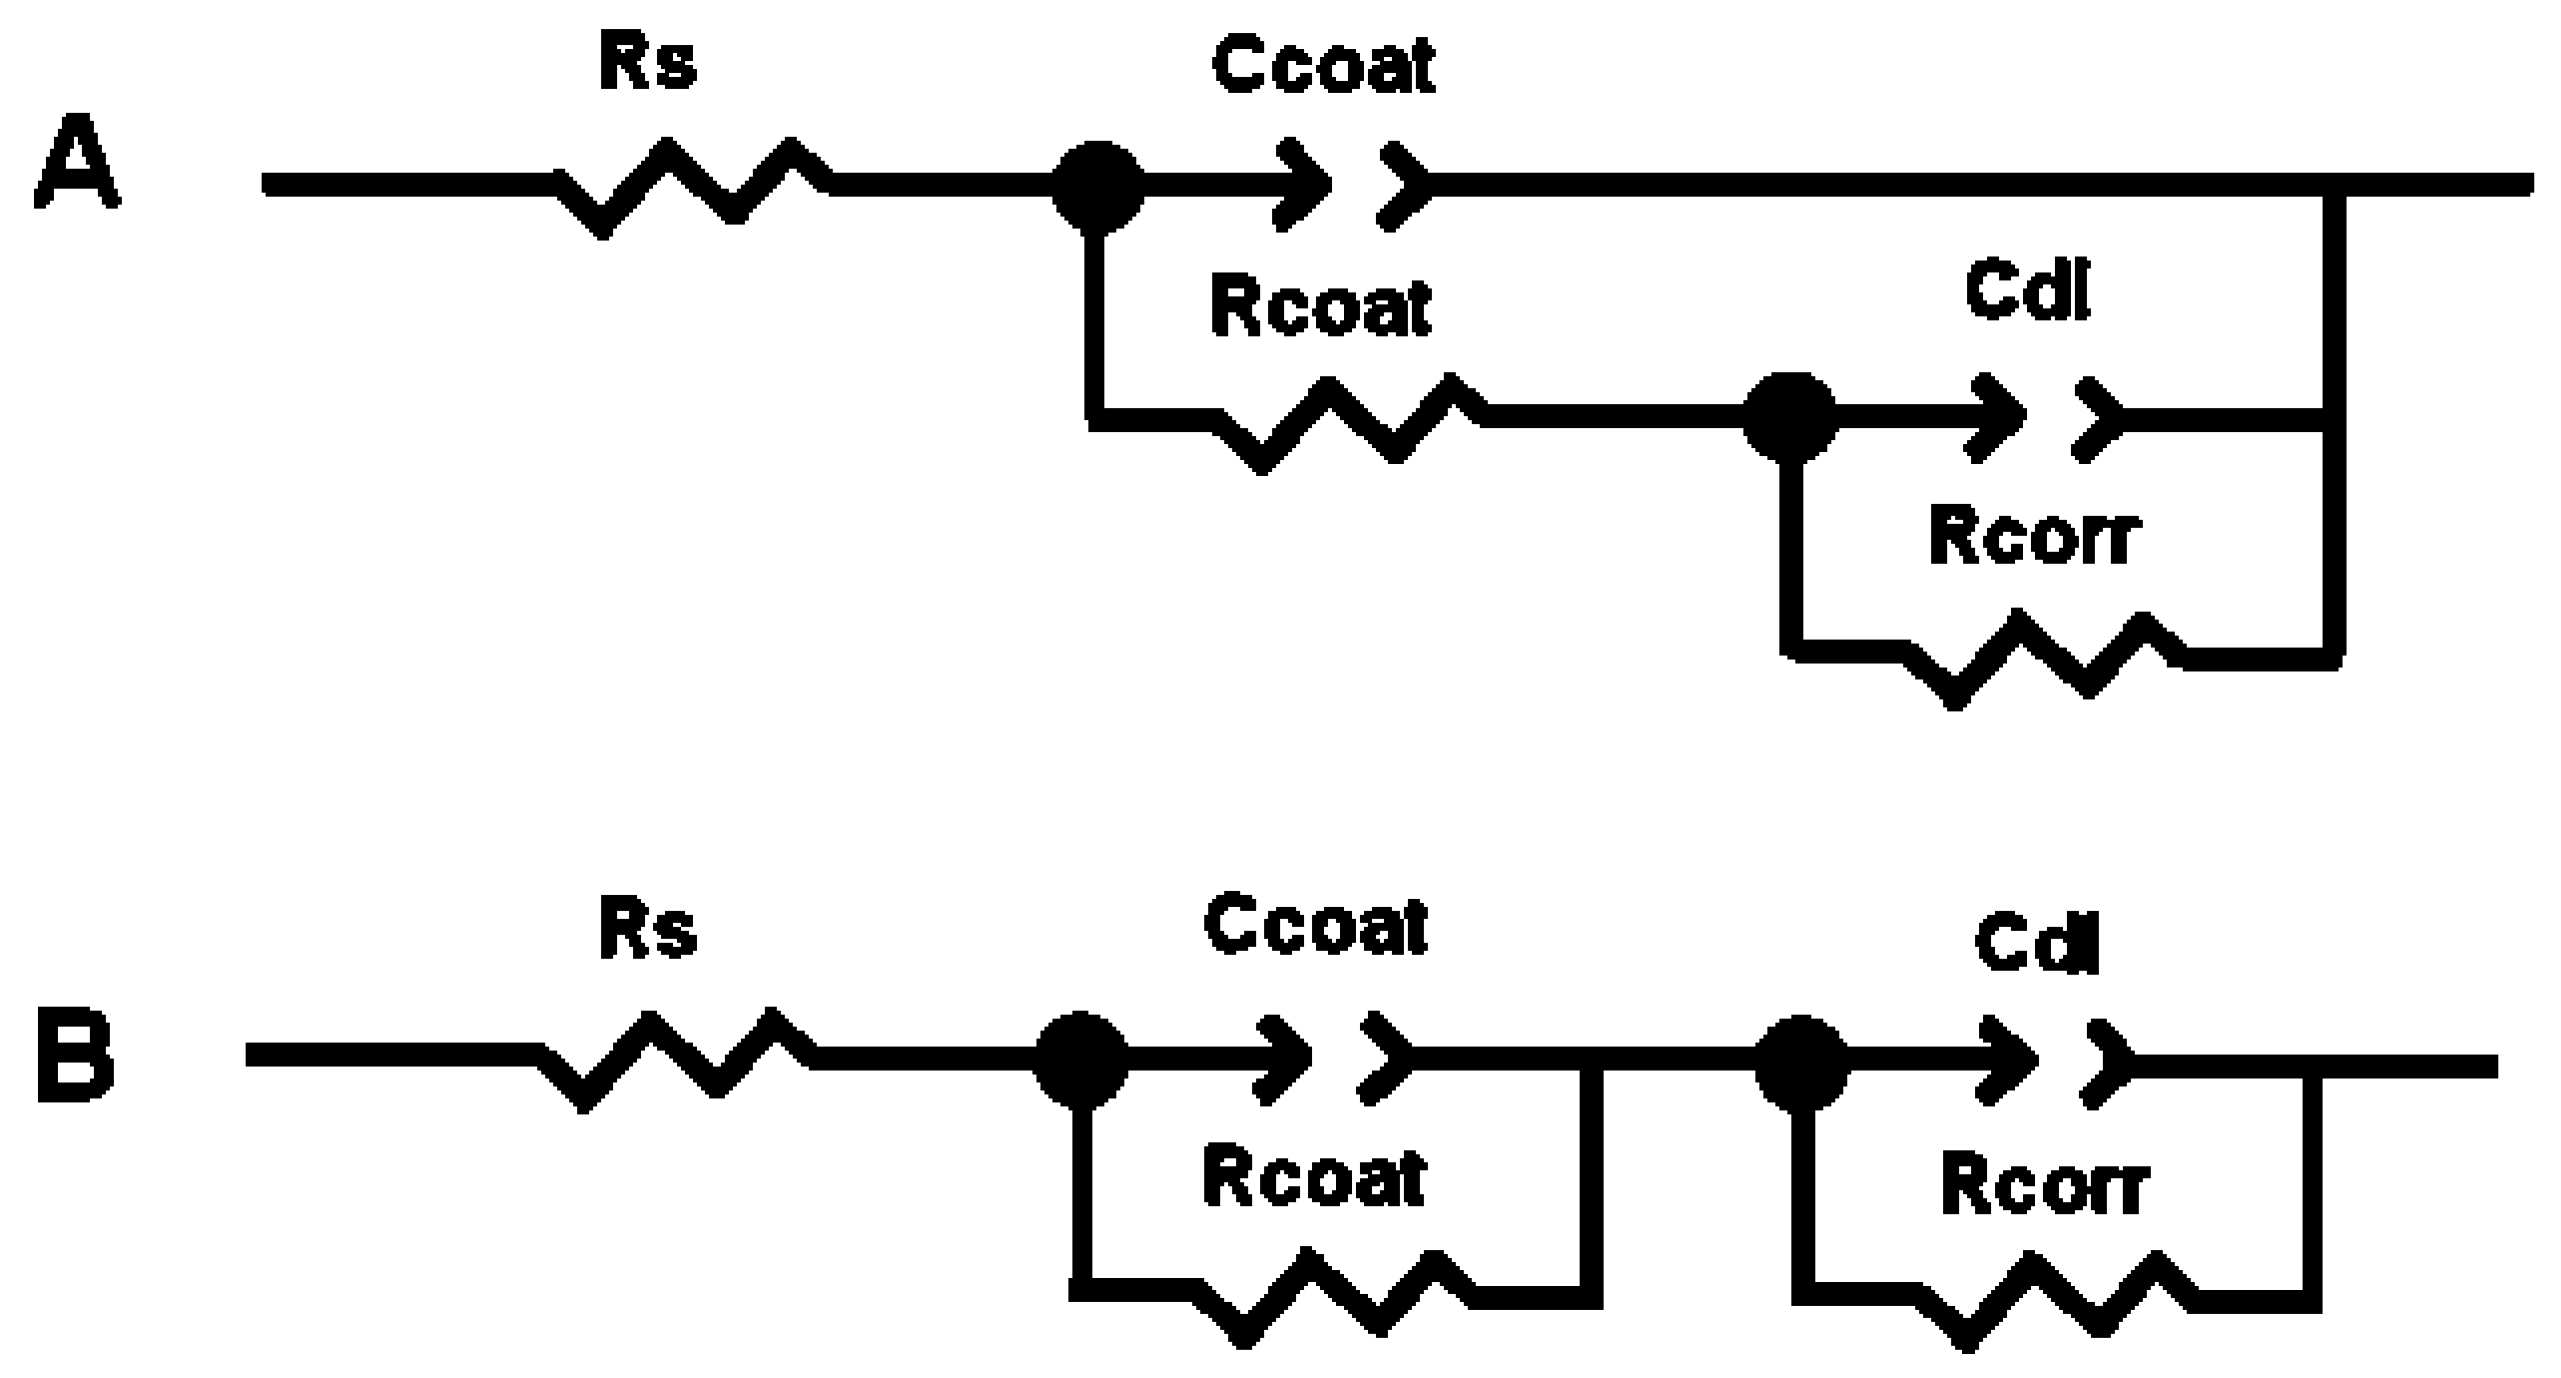
An interface undergoing an electrochemical reaction is typically analogous to an electronic circuit consisting of a specific combination of resistors and capacitors. Thus, the electrochemical system can be described in terms of its equivalent circuit. The experimental impedance data can be modelled using complex non-linear least-square (CNLS) fit analyses and suitable electrical equivalent circuits (EECs). Two equivalent circuits have been used for this study (
Figure 16).
The EEC showed in
Figure 16A has been successfully used in a lot of studies related with the corrosion protection behaviour of organic coatings on metal surfaces [
42,
43,
44,
45]. The EEC showed in
Figure 16B has been also used several times with providing also successful results [
16,
42]. Following the notation of the ZView commercial software, in both electrical equivalent circuits
Rs represents the solution resistance of the bulk electrolyte.
Ccoat is the coating capacitance. Because of inhomogeneities in the coating,
Ccoat has to be implemented as a Constant Phase Element (
CPEcoat).
Rcoat is the coating pore resistance.
Rcorr represents to the corrosion resistance of the metal substrate and
Cdl is the double layer capacitance at the metal/electrolyte interface, both at the base of pores and perforations of the coating. Due to inhomogeneities in the coating and metal surface, this capacitance has also to be implemented as a
CPEdl.
Mathematically, the
CPE’s impedance is given by the following equation [
46]:
where
j =
, ω is the angular frequency ω = 2π
f, and
f is the frequency in Hz. The
CPE is defined by two parameters,
CPE-
Y0 and
CPE-
n.
CPE-
Y0 is a fit parameter and the exponential factor
CPE-
n is related with a non-uniform current distribution due to the surface roughness or other distributed properties, and varies between 0 and 1. The
CPE reduces to a resistor for
CPE-
n = 0, to a Warburg element representing semi-infinite length diffusion phenomena for
CPE-
n = 0.5 and to an ideal capacitor for
CPE-
n = 1.
Good results have been obtained by applying the electrical equivalent circuit showed in
Figure 16A, to fit and simulate the experimental impedance plots obtained for the two systems studied in the present work, C6-HAp/Ti6Al4V and C8-HAp/Ti6Al4V (
Figure 14 and
Figure 15). However, simultaneous agreement between calculated and measured impedance spectra does not necessarily mean that the circuit model is a unique representation of the spectra. One cannot assume the uniqueness of a circuit model merely on the basis of a good fit observed experimental spectrum [
47].
Table 5 shows an example where the two equivalent circuits showed in
Figure 12 provide very similar fit results when they are applied to the C8-HAp/Ti6Al4V system, after 5 days of immersion in SBF.
Table 5 also shows the chi-square (χ
2) values obtained with both equivalent circuits. The χ
2 parameter gives an estimation of the quality of the fitting results to the experimental impedance spectra. In all the tested samples the quality of the fitting results was also very good, independently of the two electrical equivalent circuits used for obtaining the fits, because the χ
2 obtained values were lower than 10
−3. Nevertheless, the equivalent circuit showed in
Figure 16A gives as a result ambiguous values for the
CPEdl-
n parameter when it is applied to the system thermally treated at 600 °C/2 h. Thus, for 1 and 2 days of immersion in Kokubo solution, the calculated values for
CPEdl-
n are equal to 9.268 and 1.933 respectively (
Table 6). These results are very far from the range of values with a physical meaning (0.5 ≤
CPEdl-
n ≤ 1). In the case of the systems thermally treated at 600 °C/2 h, for 1 and 2 days of immersion in Kokubo solution, the relative error obtained for
CPEdl-
n values when applied to the equivalent circuit is also very bad (
Table 6). On the other hand, the equivalent circuit showed in
Figure 16B provides very successful fitting results for all the experimental impedance plots obtained in this study. Thus, this equivalent circuit was finally chosen for analysing all the impedance data.
3.5.2. Interpretation of the Impedance Spectra
Figure 14 and
Figure 15 show the evolution of the impedance plots as a function of the immersion time in Kokubo solution of the HAp-coatings/Ti6Al4V systems thermally treated at 600 °C/2 h and 800 °C/2 h. Both figures show also the obtained plots by fitting using the equivalent circuit showed in
Figure 16B. Initially, both samples exhibit very similar EIS behaviour. For short immersion time (5 min) the Nyquist plots draw very open arcs (
Figure 14A and
Figure 15A). At the beginning of the immersion test, both samples show also high impedance modulus for all the tested domain of frequencies, such it can be observed in the Bode representation of the logarithm of the impedance magnitude against the logarithm of the frequency (
Figure 14B and
Figure 15B). For this short immersion time both figures show that in the high frequencies range, the phase angle presents the highest values. High values of the phase angle at high frequencies are typically associated to barrier effects of coatings, which are due to their dielectric properties.
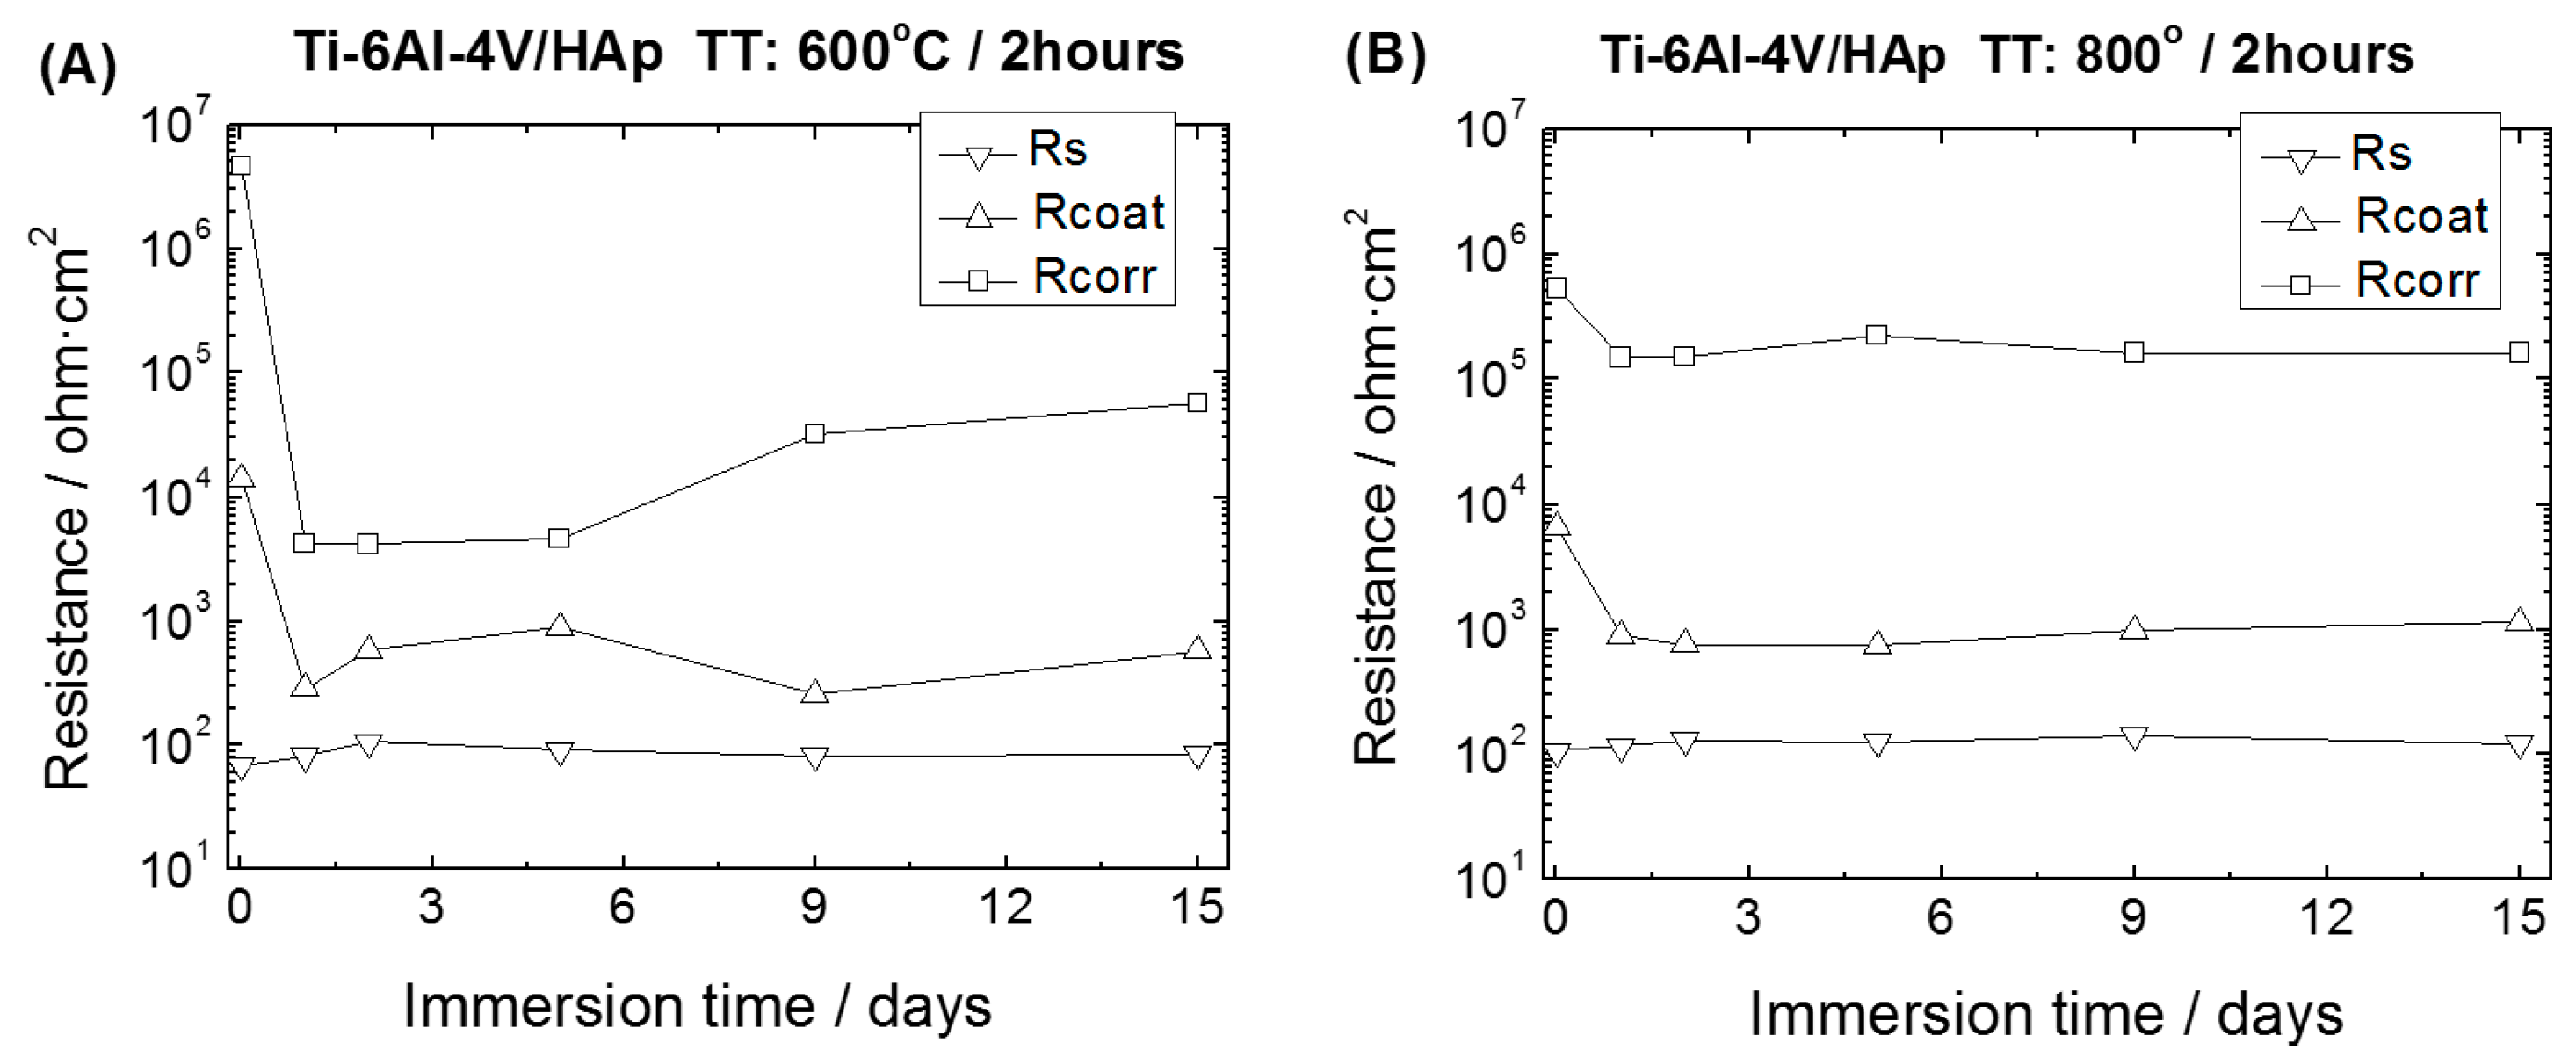
Figure 17 shows the obtained values of the resistances obtained by using the equivalent circuit showed in
Figure 16B. In both cases the
Rs values are similar and remain without significant changes along the immersion time. For the HAp-coatings/Ti6Al4V systems obtained at 600 °C/2 h, the
Rcoat values shown a slight decrease due to the electrolyte inwards within the first day of immersion. After the first day, the
Rcoat values showed small fluctuations, increasing slightly and then decreasing again after six days of immersion. These small fluctuations are associated with the changes observed in the
Rcorr values. In this case, the
Rcorr values are sensitive to the changes occurring at the Ti6Al4V alloy/SBF interface at the base of the porous. After the first hours of immersion, the
Rcorr value decreases considerably which indicates that the electrolyte reaches the Ti6Al4V surface, in several microareas, and the activity in these microareas is a dominant effect. In these microareas, according to the passivity theory, in aqueous solution have simultaneously both active and passive surfaces and undergo a continuous process of partial dissolution and repassivation.
Depending on the extent of the Ti6Al4Vsurface that is in direct contact with the SBF, this process will be more or less important and will dominate the impedance response. For the sample thermally treated at 600 °C/2 h, this continuous process of partial dissolution and repassivation seems to be dominant along the next 5 days of immersion giving as a result a constant value of 4 × 10
4 ohm·cm
2 within this period of time. After that, it is interesting to observe that the values of the
Rcorr parameter increase quickly and reach values closer to those observed at the beginning of the immersion tests (
Figure 17A). This behaviour can be due to the blocking of the pores by the formation of precipitates from the solution, which prevent further penetrations of the SBF impeding the growth of active microareas at the base of the HAp-coating pores.
For the HAp-coatings/Ti6Al4V systems obtained at 800 °C/2 h, the
Rcoat values showed a slight decrease due to the electrolyte inwards within the first day of immersion, attaining then a constant value of
Rcoat (
Figure 17B), which shows a good stability of the coating along the immersion time. This stability is also reflected in the
Rcorr values obtained, which follows the same trend. The
Rcorr slightly decreases upon exposure to the SBF and then remain almost constant along the immersion time (
Figure 17B). In this case, the slight decrease of both
Rcoat and
Rcorr values followed by a constant value within the immersion time (
Figure 17B), prove good stability and lower porosity of this coating when compared to the one obtained at 600 °C for 2 h. The high increase of the
Rcorr values observed in the samples coated at 600 °C/2 h is not here evidenced. Nevertheless, the evolution of the Nyquist plots with the immersion time shows a slow decrease of the diameter of the arcs and thus the
Rcorr values of these samples, evidencing a best behaviour against corrosion during all the immersion tests in an aggressive solution such as the SBF. The morphology of the coatings plays an important role in the different behaviour of these coatings. Moreover, in both cases, the penetration of the SBF is allowed, mainly in the upper part of the coating and thus the formation of HAp from the solution, which was one of the aims of this study. However, the kinetic of this process is different in both cases, as reflected in the impedance results obtained. The porosity of the coating obtained at 600 °C/2 h favours a rapid ingress of the electrolyte and allows that the formation of the HAp into this pores occurs in a bigger extent than in the coating obtained at 800 °C/2 h. However, on the other hand, due to this porosity the coating obtained at 600 °C/2 h shows a lesser barrier effect than the one provided for the coating obtained at 800 °C/2 h.
Table 6 shows the values obtained for the exponent n of the
CPEdl of the equivalent circuits A and B applying the CNLS fits of the ZView software to the impedance experimental plots of HAp-Coatings/Ti6Al4V systems. The
n values are directly related to the corrosion mechanisms.
CPEdl would represent the double layer capacitance of the metal/electrolyte interface at the base of pores and perforations of the coating. For the HAp-Coatings/Ti6Al4V samples thermally treated at 800 °C/2 h the
n values are situated into the 0.41–052 range (
Table 6). These values are closer to those typically ascribed to diffusion mechanisms (
n = 0.5), than to
n values attributed to the electrochemical double layer capacitance (
n = 1). From all the exposed above, it seems that the diffusion mechanisms though the pores and microcracks of the coating dominate on the activation processes and corrosion at the metal surface, preventing in this way the ion release from the metallic substrate to the SBF.


 ,
, 


