Dietary Interventions to Promote Healthy Eating among Office Workers: A Literature Review


Abstract
:1. Introduction
2. Methods
2.1. Inclusion Criteria
2.2. Data Sources/Literature Search
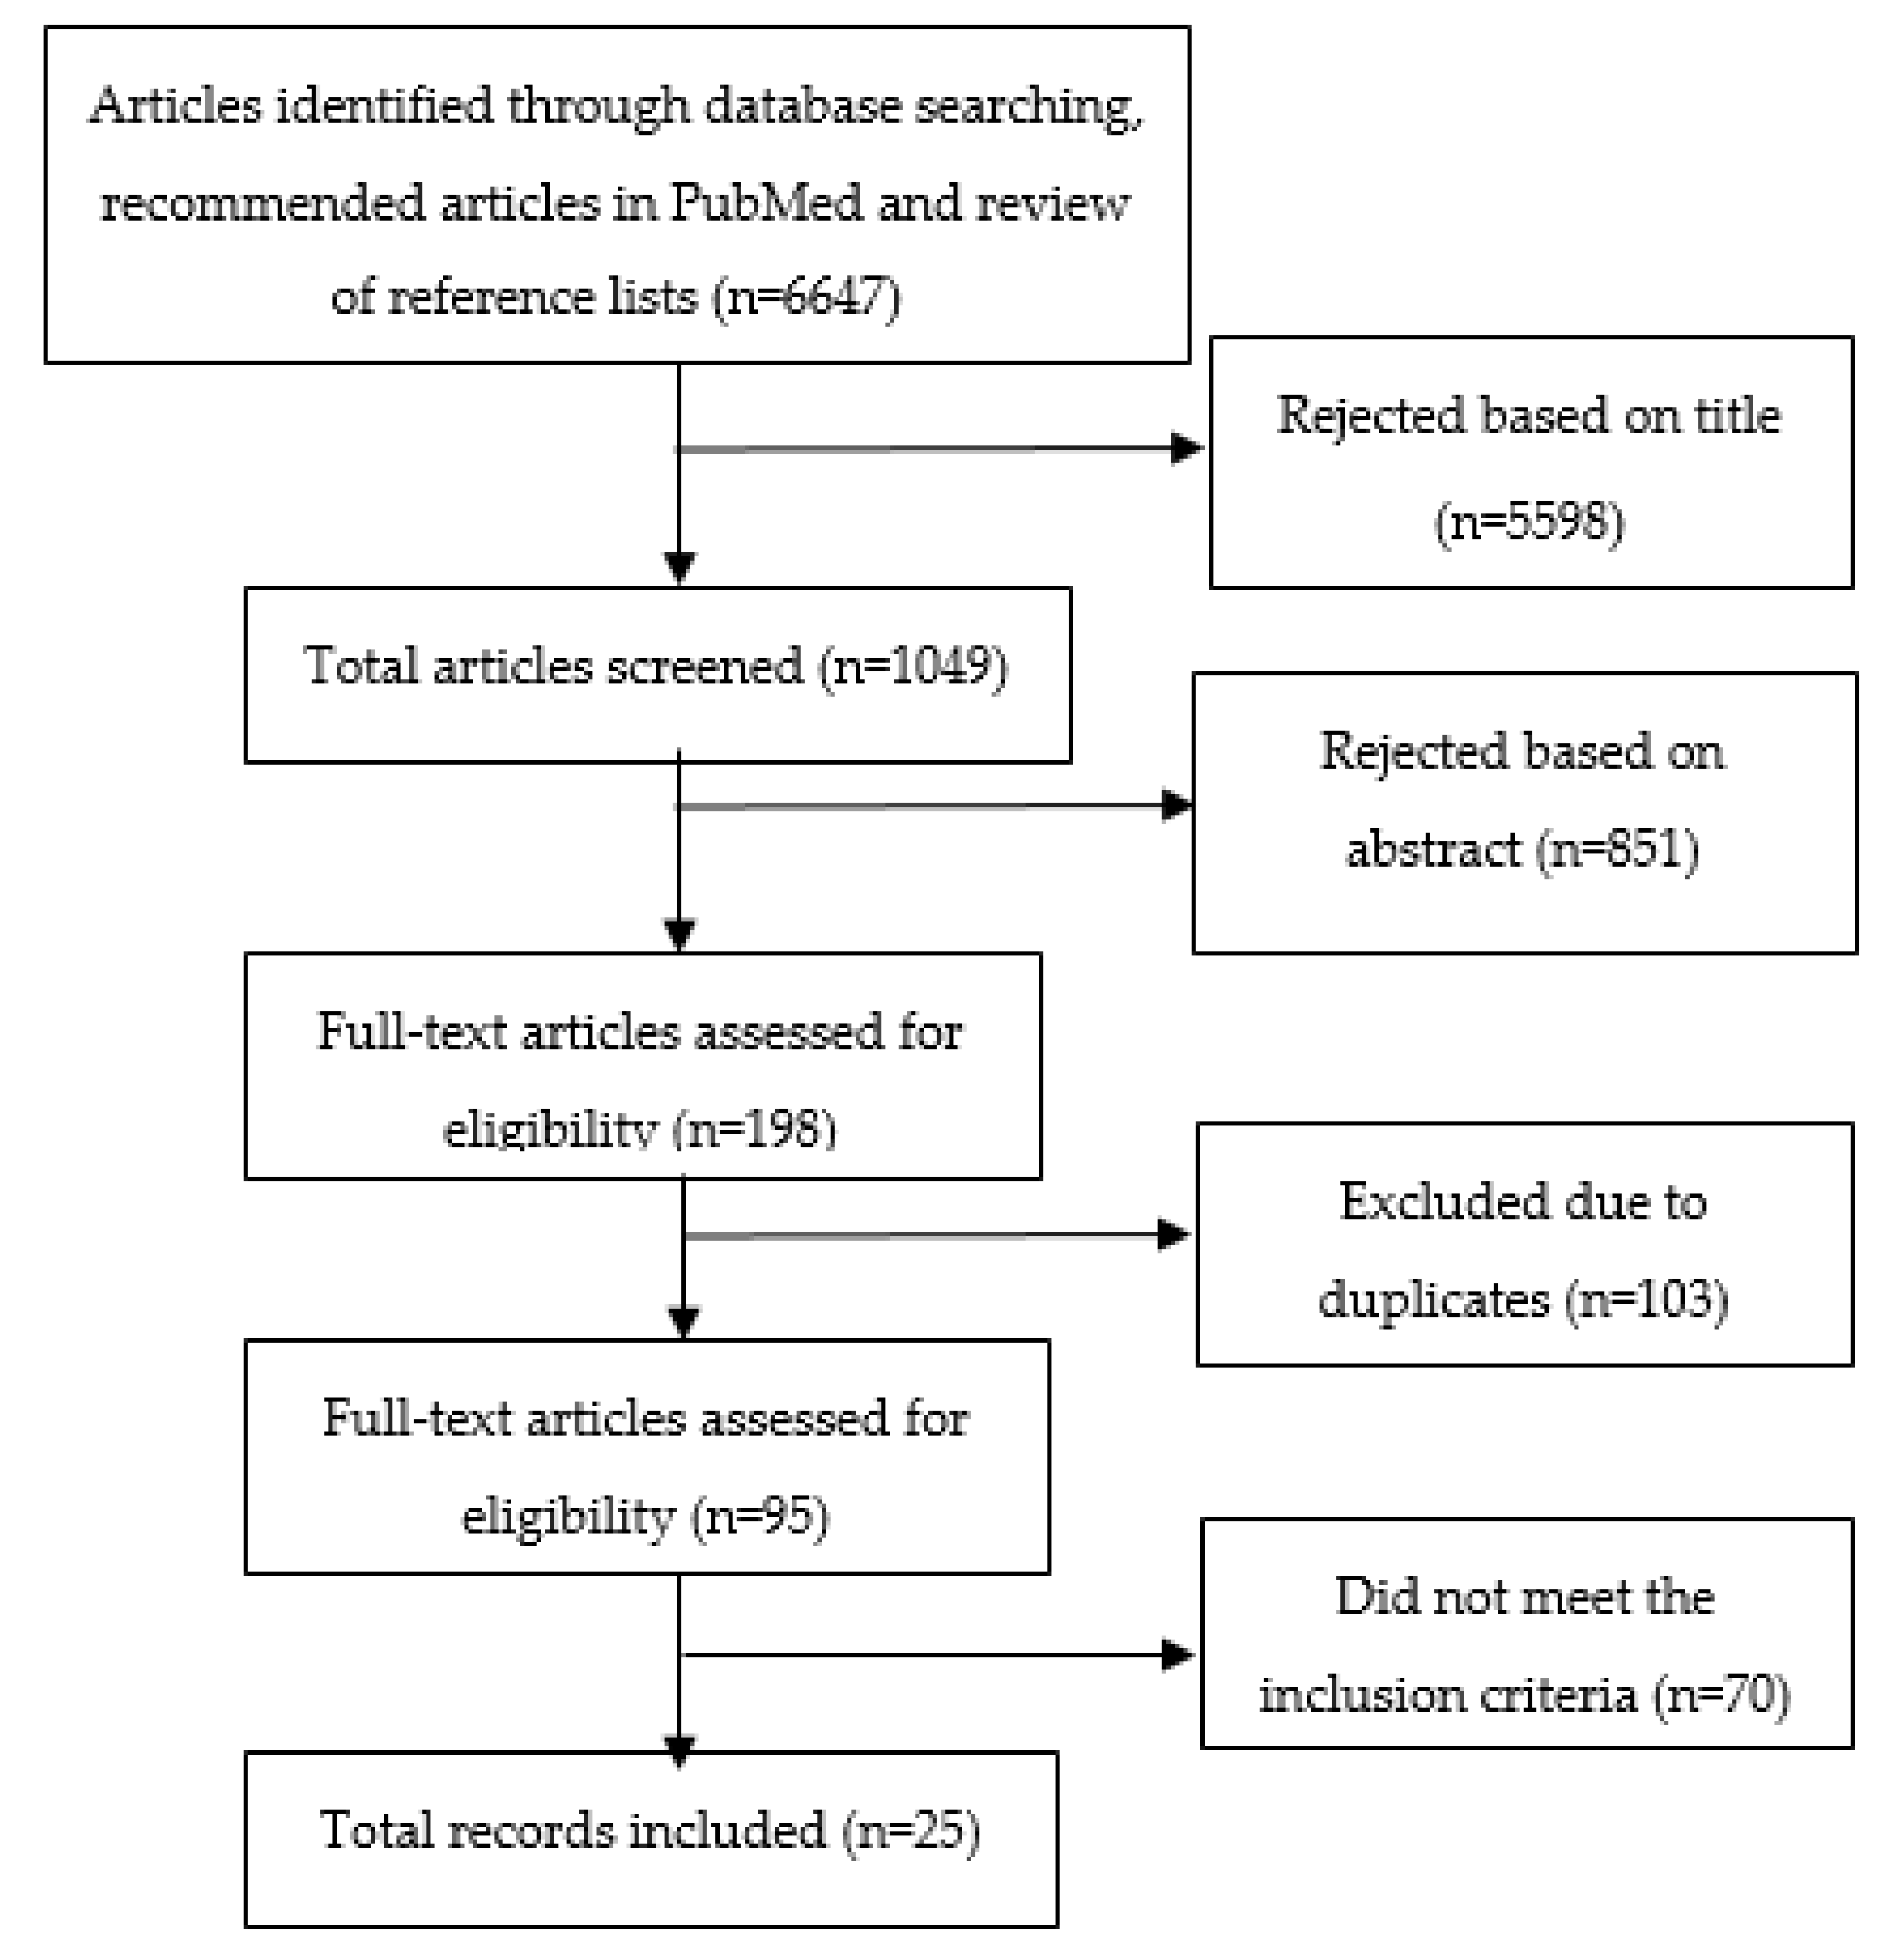
2.3. Search Outcome
2.4. Study Selection
2.5. Data Extraction/Data Collection Process
3. Results
3.1. Characteristics of Included Studies
3.2. Types of Interventions
3.2.1. Web-Based Interventions
3.2.2. Intervention Where Healthy Food Is Provided
3.2.3. Intervention Providing Information
3.2.4. Multicomponent Interventions
4. Discussion
4.1. Overall Findings
4.2. Behavior Change Theories
4.3. Web Based
4.4. Information
4.5. Strengths and Limitations
4.6. Future Research
5. Conclusions
Author Contributions
Funding
Conflicts of Interest
References
- WHO. Global Status Report on Noncommunicable Diseases; World Health Organization: Geneva, Switzerland, 2014. [Google Scholar]
- The World Bank (Labor Force, Total). Available online: https://data.worldbank.org/indicator/SL.TLF.TOTL.IN (accessed on 7 November 2020).
- Wolf, J.; Prüss-Ustün, A.; Ivanov, I.; Mudgal, S.; Corvalán, C.; Bos, R.; Neira, M. Preventing Disease through a Healthier and Safer Workplace; World Health Organization: Geneva, Switzerland, 2018. [Google Scholar]
- Arbetsmiljöverkets: The Work Environment. 2015. Available online: https://www.av.se/arbetsmiljoarbete-och-inspektioner/arbetsmiljostatistik-officiell-arbetsskadestatstik/arbetsmiljon-2015/?hl=arbetsmilj%C3%B6n%202015 (accessed on 17 June 2019).
- STATISTA: Total number of people employed in offices in Germany from 2016 to 2020. Available online: https://www.statista.com/statistics/1022874/number-of-individuals-employed-in-offices-in-germany/?fbclid=IwAR3-X1_w7sJGeHBzNnEXDtYYa6MYhx_npSHLc9sXernUXtsz70-_A-vmBHs#:~:text=Between%202016%20and%202019%2C%20the,(covid%2D19)%20crisis (accessed on 8 November 2020).
- Kim, H.J.; Hong, J.I.; Mok, H.J.; Lee, K.M. Effect of workplace-visiting nutrition education on anthropometric and clinical measures in male workers. Clin. Nutr. Res. 2012, 1, 49–57. [Google Scholar] [CrossRef] [PubMed]
- Dictionary, C.E. Definition of ‘office worker’. Available online: https://www.collinsdictionary.com/dictionary/english/office-worker (accessed on 17 June 2019).
- Dictionary, C.B.E. Definition of White-Collar. Available online: https://dictionary.cambridge.org/dictionary/english/white-collar?q=white-collar+ (accessed on 17 June 2019).
- Finnish Center for Pensions: Retirement Ages. Available online: https://www.etk.fi/en/work-and-pensions-abroad/international-comparisons/retirement-ages/ (accessed on 7 November 2020).
- Abood, D.A.; Black, D.R.; Feral, D. Nutrition Education Worksite Intervention for University Staff: Application of the Health Belief Model. J. Nutr. Educ. Behav. 2003, 35, 260–267. [Google Scholar] [CrossRef]
- Allan, J.; Querstret, D.; Banas, K.; de Bruin, M. Environmental interventions for altering eating behaviours of employees in the workplace: A systematic review. Obes. Rev. 2017, 18, 214–226. [Google Scholar] [CrossRef] [PubMed] [Green Version]
- Cook, R.F.; Hersch, R.K.; Schlossberg, D.; Leaf, S.L. A Web-based health promotion program for older workers: Randomized controlled trial. J. Med. Int. Res. 2015, 17, e82. [Google Scholar] [CrossRef] [PubMed]
- Sternfeld, B.; Block, C.; Quesenberry, C.P., Jr.; Block, T.J.; Husson, G.; Norris, J.C.; Nelson, M.; Block, G. Improving diet and physical activity with ALIVE: A worksite randomized trial. Am. J. Prev. Med. 2009, 36, 475–483. [Google Scholar] [CrossRef] [PubMed]
- Perez, A.P.; Phillips, M.M.; Cornell, C.E.; Mays, G.; Adams, B. Promoting dietary change among state health employees in Arkansas through a worksite wellness program: The Healthy Employee Lifestyle Program (HELP). Prev. Chronic Dis. 2009, 6, A123. [Google Scholar] [PubMed]
- Thomson, J.L.; Goodman, M.H.; Landry, A.S.; Donoghue, A.; Chandler, A.; Bilderback, R. Feasibility of Online Nutrition Education in the Workplace: Working toward Healthy Lifestyles. J. Nutr. Educ. Behav. 2018, 50, 868–875. [Google Scholar] [CrossRef] [Green Version]
- Mouttapa, M.; Robertson, T.P.; McEligot, A.J.; Weiss, J.W.; Hoolihan, L.; Ora, A.; Trinh, L. The Personal Nutrition Planner: A 5-week, computer-tailored intervention for women. J. Nutr. Educ. Behav. 2011, 43, 165–172. [Google Scholar] [CrossRef]
- Cook, R.F.; Billings, D.W.; Hersch, R.K.; Back, A.S.; Hendrickson, A. A field test of a web-based workplace health promotion program to improve dietary practices, reduce stress, and increase physical activity: Randomized controlled trial. J. Med. Int. Res. 2007, 9, e17. [Google Scholar] [CrossRef]
- Papadaki, A.; Scott, J.A. The Mediterranean eating in Scotland experience project: Evaluation of an Internet-based intervention promoting the Mediterranean diet. Br. J. Nutr. 2005, 94, 290–298. [Google Scholar] [CrossRef] [Green Version]
- Bennett, J.B.; Broome, K.M.; Schwab-Pilley, A.; Gilmore, P. A web-based approach to address cardiovascular risks in managers: Results of a randomized trial. J. Occup. Environ. Med. 2011, 53, 911–918. [Google Scholar] [CrossRef] [PubMed] [Green Version]
- Lassen, A.D.; Ernst, L.; Poulsen, S.; Andersen, K.K.; Hansen, G.L.; Biltoft-Jensen, A.; Tetens, I. Effectiveness of a Canteen Take Away concept in promoting healthy eating patterns among employees. Public Health Nutr. 2012, 15, 452–458. [Google Scholar] [CrossRef] [PubMed] [Green Version]
- Alinia, S.; Lassen, A.D.; Krogholm, K.S.; Christensen, T.; Hels, O.H.; Tetens, I. A workplace feasibility study of the effect of a minimal fruit intervention on fruit intake. Public Health Nutr. 2011, 14, 1382–1387. [Google Scholar] [CrossRef] [PubMed] [Green Version]
- Inoue, H.; Sasaki, R.; Aiso, I.; Kuwano, T. Short-term intake of a Japanese-style healthy lunch menu contributes to prevention and/or improvement in metabolic syndrome among middle-aged men: A non-randomized controlled trial. Lipids Health Dis. 2014, 13, 57. [Google Scholar] [CrossRef] [PubMed] [Green Version]
- Vyth, E.L.; Steenhuis, I.H.; Heymans, M.W.; Roodenburg, A.J.; Brug, J.; Seidell, J.C. Influence of placement of a nutrition logo on cafeteria menu items on lunchtime food Choices at Dutch work sites. J. Am. Diet. Assoc. 2011, 111, 131–136. [Google Scholar] [CrossRef]
- Engbers, L.H.; van Poppel, M.N.; Chin, A.P.M.; van Mechelen, W. The effects of a controlled worksite environmental intervention on determinants of dietary behavior and self-reported fruit, vegetable and fat intake. BMC Public Health 2006, 6, 253. [Google Scholar] [CrossRef] [Green Version]
- Salinardi, T.C.; Batra, P.; Roberts, S.B.; Urban, L.E.; Robinson, L.M.; Pittas, A.G.; Lichtenstein, A.H.; Deckersbach, T.; Saltzman, E.; Das, S.K. Lifestyle intervention reduces body weight and improves cardiometabolic risk factors in worksites. Am. J. Clin. Nutr. 2013, 97, 667–676. [Google Scholar] [CrossRef] [Green Version]
- Allen, J.C.; Lewis, J.B.; Tagliaferro, A.R. Cost-effectiveness of health risk reduction after lifestyle education in the small workplace. Prev. Chronic Dis. 2012, 9, E96. [Google Scholar] [CrossRef] [Green Version]
- Nisbeth, O.; Klausen, K.; Andersen, L.B. Effectiveness of counselling over 1 year on changes in lifestyle and coronary heart disease risk factors. Patient Educ. Couns. 2000, 40, 121–131. [Google Scholar] [CrossRef]
- Addley, K.; Boyd, S.; Kerr, R.; McQuillan, P.; Houdmont, J.; McCrory, M. The impact of two workplace-based health risk appraisal interventions on employee lifestyle parameters, mental health and work ability: Results of a randomized controlled trial. Health Educ. Res. 2014, 29, 247–258. [Google Scholar] [CrossRef] [Green Version]
- Horan, K.A.; Taylor, M.B. Mindfulness and self-compassion as tools in health behavior change: An evaluation of a workplace intervention pilot study. J. Context. Behav. Sci. 2018, 8, 8–16. [Google Scholar] [CrossRef]
- Engbers, L.H.; van Poppel, M.N.; van Mechelen, W. Modest effects of a controlled worksite environmental intervention on cardiovascular risk in office workers. Prev. Med. 2007, 44, 356–362. [Google Scholar] [CrossRef] [PubMed]
- Steenhuis, I.; Van Assema, P.; Van Breukelen, G.; Glanz, K.; Kok, G.; De Vries, H. The impact of educational and environmental interventions in Dutch worksite cafeterias. Health Promot. Int. 2004, 19, 335–343. [Google Scholar] [CrossRef] [PubMed]
- Hutchinson, A.D.; Howlett, G.; Wilson, C.J.F.; Sciences, N. Increasing employees’ fruit consumption through access and peer support at work. Food Nutr. Sci. 2013, 4, 88. [Google Scholar] [CrossRef]
- Maruyama, C.; Kimura, M.; Okumura, H.; Hayashi, K.; Arao, T. Effect of a worksite-based intervention program on metabolic parameters in middle-aged male white-collar workers: A randomized controlled trial. Prev. Med. 2010, 51, 11–17. [Google Scholar] [CrossRef]
- Sorensen, G.; Stoddard, A.; Peterson, K.; Cohen, N.; Hunt, M.K.; Stein, E.; Palombo, R.; Lederman, R. Increasing fruit and vegetable consumption through worksites and families in the treatwell 5-a-day study. Am. J. Public Health 1999, 89, 54–60. [Google Scholar] [CrossRef] [Green Version]
- Lachat, C.K.; Verstraeten, R.; De Meulenaer, B.; Menten, J.; Huybregts, L.F.; Van Camp, J.; Roberfroid, D.; Kolsteren, P.W. Availability of free fruits and vegetables at canteen lunch improves lunch and daily nutritional profiles: A randomised controlled trial. Br. J. Nutr. 2009, 102, 1030–1037. [Google Scholar] [CrossRef]
- Backman, D.; Gonzaga, G.; Sugerman, S.; Francis, D.; Cook, S. Effect of fresh fruit availability at worksites on the fruit and vegetable consumption of low-wage employees. J. Nutr. Educ. Behav. 2011, 43, S113–S121. [Google Scholar] [CrossRef]
- Summer, S.K.; Schiller, E.L.; Marr, E.R.; Thompson, D.I. A weight control and nutrition education program for insurance company employees. J. Nutr. Educ. 1986, 18, S60–S62. [Google Scholar] [CrossRef]
- Briley, M.E.; Montgomery, D.H.; Blewett, J. Worksite nutrition education can lower total cholesterol levels and promote weight loss among police department employees. J. Am. Diet. Assoc. 1992, 92, 1382–1384. [Google Scholar]
- Aldana, S.G.; Greenlaw, R.L.; Diehl, H.A.; Salberg, A.; Merrill, R.M.; Ohmine, S.; Thomas, C. Effects of an intensive diet and physical activity modification program on the health risks of adults. J. Am. Diet. Assoc. 2005, 105, 371–381. [Google Scholar] [CrossRef] [PubMed]
- Spahn, J.M.; Reeves, R.S.; Keim, K.S.; Laquatra, I.; Kellogg, M.; Jortberg, B.; Clark, N.A. State of the Evidence Regarding Behavior Change Theories and Strategies in Nutrition Counseling to Facilitate Health and Food Behavior Change. J. Am. Diet. Assoc. 2010, 110, 879–891. [Google Scholar] [CrossRef] [PubMed]
- Long, B.J.; Calfas, K.J.; Wooten, W.; Sallis, J.F.; Patrick, K.; Goldstein, M.; Marcus, B.H.; Schwenk, T.L.; Chenoweth, J.; Carter, R.; et al. A multisite field test of the acceptability of physical activity counseling in primary care: Project PACE. Am. J. Prev. Med. 1996, 12, 73–81. [Google Scholar] [CrossRef]
- Proper, K.; van Mechelen, W. Effectiveness and Economic Impact of Worksite Interventions to Promote Physical Activity and Healthy Diet; World Health Organization: Geneva, Switzerland, 2008. [Google Scholar]
- Hlobil, H.; Uegaki, K.; Staal, J.B.; de Bruyne, M.C.; Smid, T.; van Mechelen, W. Substantial sick-leave costs savings due to a graded activity intervention for workers with non-specific sub-acute low back pain. Eur. Spine J. 2007, 16, 919–924. [Google Scholar] [CrossRef] [Green Version]
- Heymans, M.W.; de Vet, H.C.; Bongers, P.M.; Knol, D.L.; Koes, B.W.; van Mechelen, W. The effectiveness of high-intensity versus low-intensity back schools in an occupational setting: A pragmatic randomized controlled trial. Spine 2006, 31, 1075–1082. [Google Scholar] [CrossRef]
- Bandura, A.; Bandura, A.J.P.H. Social Foundations of Thought and Action: A Cognitive Social Theory; Prentice-Hall, Inc.: Englewood Cliffs, NY, USA, 1986. [Google Scholar]
- Prochaska, J.O.; Norcross, J.C.; DiClemente, C. Changing for Good: A Revolutionary Six-Stage Program for Overcoming Bad Habits and Moving your Life Positively Forward; Harper Collins: New York, NY, USA, 1994. [Google Scholar]
- Vries, H.D.; Backbier, E.; Kok, G.; Dijkstra, M. The Impact of Social Influences in the Context of Attitude, Self-Efficacy, Intention, and Previous Behavior as Predictors of Smoking Onset1. J. Appl. Soc. Psychol. 1995, 25, 237–257. [Google Scholar] [CrossRef]
- Hochbaum, G.M. Public Participation in Medical Screening Programs: A Socio-Psychological Study; US Department of Health, Education, and Welfare, Public Health Service, Bureau of State Services, Division of Special Health Services, Tuberculosis Program: Washington, DC, USA, 1958. [Google Scholar]
- Maes, L.; Van Cauwenberghe, E.; Van Lippevelde, W.; Spittaels, H.; De Pauw, E.; Oppert, J.M.; Van Lenthe, F.J.; Brug, J.; De Bourdeaudhuij, I. Effectiveness of workplace interventions in Europe promoting healthy eating: A systematic review. Eur. J. Public Health 2012, 22, 677–683. [Google Scholar] [CrossRef] [Green Version]
- Geaney, F.; Kelly, C.; Greiner, B.A.; Harrington, J.M.; Perry, I.J.; Beirne, P. The effectiveness of workplace dietary modification interventions: A systematic review. Prev. Med. 2013, 57, 438–447. [Google Scholar] [CrossRef]


| Author (Year) | Location/Type of Work | Design/Duration | Population/Groups | Intervention/Theory | Incentive | Outcomes | Results |
|---|---|---|---|---|---|---|---|
| WEB-BASED (Educational Interventions) | |||||||
| Cook et al. (2015) [12] | USA. Employees in offices of a technology company | Randomized Controlled Trial(RCT) 3months | Total n= 278 Intervention Group (IG) n= 138 Control Group (CG) n= 140 | Web-based Health Promotion Program(HPP) for older adults (HealthyPast50) Provision of information/educational materials Social Cognitive Theory (SCT) | United States Dollar (USD) 50 to participate plus a USD 500 raffle drawing | 1.Diet 2. Exercise 3. Stress 4. Aging beliefs 5. Tobacco use | IG vs. CG: Diet: IG showed significant improvement on dietary behavioral change self-efficacy (p = 0.048) and planning healthy eating (p = 0.03) Exercise: IG showed significant improvement in mild exercise (p = 0.01) Stress, Aging beliefs, Tobacco use: No difference Analysis when non-users were excluded (used the program less than 30 min in total): IG showed significant improvement in: Diet: Eating practices (p = 0.03) Exercise: Exercise self-efficacy (p = 0.03), exercise planning (p = 0.03) Aging beliefs: improved (p = 0.01) |
| Sternfeld et al. (2009) [13] | USA. Employees in the administrative offices of a healthcare Organization | RCT 16 weeks | Total n= 787 IG n= 351 CG n= 436 | ALIVE: An e-mail program, which offered: -Individually tailored small-step goals -A personal homepage with tips -Educational materials -Tracking and simulation tools 3 paths (1) Increasing Physical Activity (PA) (2) Increasing Fruits and Vegetables (F&V) (3) Decreasing fats and sugar | No monetary incentive, but those who completed the assessment received feedback regarding their current diet and physical activity | Changes in: 1. Diet 2. PA | The whole IG (3 paths) vs. CG: IG performed significantly better than CG Diet: Significant increase was observed in: - F&V consumption by 0.18 cup-equivalents/day (p = 0.03) Significant decreases were observed in: - Saturated fat consumption by 0.95 g/day (p = 0.01) - Trans-fat consumption by 0.29 g/day (p = 0.02) PA: Significant increases were observed in: - Moderate Physical Activity (MPA) by 28.0 min/week. (p = 0.0002) - Vigorous Physical Activity (VPA) by 12.5 min/week. (p = 0.03) - Walking by 21.5 min/week. (p = 0.0003) Significant decrease was observed in: - Sedentary behavior by 59.8 min/week (p = 0.05) The largest changes were in those who did not meet behavioral recommendations at baseline (increase of 55.4 min/week. of MPA and decrease of 1.15 g/day of trans fats) relative to the CG The improvements in diet and PA tended to maintain in the intervention group 4 months after the intervention ended |
| Perez et al. (2009) [14] | USA. State Health and Human services employees | Pre-post design 1 year | Total n= 1017 No control group | Web-based worksite wellness incentive program The Healthy Employee Lifestyle Program (HELP) Behavior change through 3 main approaches: (1) Providing an overall wellness report with tips for improving health (2) Rewarding health behaviors with points redeemable for incentives (3) Providing education and peer support. Transtheoritical Model of Behavior Change (TMBC) | Rewards for reporting health behaviors (e.g., t-shirts, water bottles, and up to 3 days of paid leave.) | 1. F&V consumption 2. PA 3. Smoking 4. Age-appropriate health screenings 5. Weight management | Within IG: between baseline and follow-up (No control group) Diet: - More participants reported eating 3 or more F&V/day (p = 0.03) - Participants progressed in stages of readiness to change for eating 5 or more F&V/day (p = 0.002) and for eating a low-fat diet (p = 0.04) |
| Thomson et al. (2018) [15] | USA. Federal workplace researchers and support staff (laboratory, field and office) | Pretest-posttest 12 weeks | Total n= 22 No control group | “Nutrition 4 Weight Loss Program” Online nutrition education program for weight loss in the workplace Provision of information, educational materials, provision of eating plan | Access to the program was the only incentive for participants. | 1. Anthropo-metric measurements body composition, blood pressure (BP), and skin carotenoid level (biomarker for F&V intake) 2. Feasibility components | Within IG: between baseline and follow-up (No control group) Anthropometric measurements: Significant decreases were observed in: -Diastolic Blood Pressure(DBP) (mean 3.6 mm Hg) (p = 0.01) -Weight (mean 1.8 kg) (p = 0.02) -Body Mass Index (BMI) (mean 0.6 kg/m2) (p = 0.01) -Body Fat Percentage (BFP) (mean 1.6%) (p = 0.003) -Visceral fat level (mean 0.7 cm2) (p = 0.02) Feasibility components: The program components reported to be the most liked were the class videos (64%) and the nutrition consultation (50%) whereas the least liked and used component was the food diary (14%) |
| Mouttapa et al. (2011) [16] | USA. Employees from two Southern California Universities | RCT 5 weeks and 2-month follow-up self-report assessments | Total n= 261 IG n= 118 CG n= 143 | Personal Nutrition Planner (PNP), an online nutrition intervention tool, which calculate participants’ BMI, estimate energy expenditure and provide them with nutrition information IG: They registered on the site, completed the PNP and indicated if they wanted to receive weekly e-mail reminders (goals, steps and additional information). CG: They completed all the assessments like the IG. They were not provided with any health-related information, but they would receive access to the PNP after the study was completed. SCT | 1.Dietary intake frequencies 2. Weight loss 3. Opinions regarding intervention | IG vs. CG: IG performed significantly better than CG Dietary intake: Increase in weekly dairy intake from nearly 9 times per week (pretest) to nearly 11 times (2 months posttest) (p < 0.05) Weight loss: Among participants who wanted to lose weight, weight loss in the IG was significantly higher than that of the CG. (p < 0.05) Opinions regarding the PNP intervention: On a scale of 1–5, mean ratings of the PNP program characteristics ranged from 3–4. | |
| Cook et al. (2007) [17] | USA. Employees in offices of a Human resources company | RCT 3 months | Total n = 419 IG n= 209 CG n = 210 | Comparison of a multimedia Web-based program with printed materials IG: Web-based program with information and guidance on the major health promotion and wellness topics of stress, nutrition/weight management, and fitness/PA CG: Printed materials covering the same health topics as the Web-based program (but not necessarily the same content) SCT, TMBC | USD 50/survey and a USD 500 raffle prize | 1. Dietary measures 2. Stress Management 3. PA 4. Body Weight (BW) | IG (Web-based group) vs. CG: (printed materials) Dietary measures: Significant positive effects on attitudes Toward a Healthful Diet and Dietary Stage of Change in the IG BW: No significant differential change in weight between the two groups. Although both groups reported weight loss. (IG: p = 0.04, CG: p = 0.02) Stress Management: No differences between the two groups PA: No differences between the two groups Within IG (Web-based group) Significant positive effects regarding the number of times the subject accessed the program about measures of: -Dietary Self-Efficacy (p = 0.003) -Attitudes Toward a Healthful Diet (p = 0.045) -Dietary Stage of Change (p = 0.005) |
| Papadaki et al. (2005) [18] | Scotland. Universities of Glasgow and Glasgow Caledonian/ Female university workers | Quasi-experimental 6 months | Total n= 72 Dietary analyses: IG n= 53 CG n= 19 Analysis of biomarkers: IG n= 46 CG n= 16 | Provision of internet education via an innovative Mediterranean Eating Website IG: Tailored dietary and psychosocial feedback and Internet nutrition education CG: Minimal dietary feedback and general healthy-eating brochures Precaution Adoption Process Model (PAPM), TMBC | 1.Diet 2. Clinical and anthropometric measurements | IG vs. CG: Diet: Intake of nuts, fruits and seeds was significantly - increased by 34,9 g/day (p = 0.022) in the IG - decreased by 23.2 g/day (p = 0.022) in the CG Intake of dairy products was significantly - decreased by 4.1 g/day (p = 0.033) in the IG - increased by 42.3 g/day (p = 0.033) in the CG Intake of cereals - decreased by 15.6 g/day (p = 0.059) in the IG - increased by 14.3 g/day (p = 0.059) in the CG Clinical and anthropometric measurements: No significant differences. However, IG showed a significantly higher increase in HDL-cholesterol compared with CG (0.22 mmol/l vs. 0.06 mmol/l) (p = 0.036) as well as a higher decrease in the ratio of total: High-Density Lipoprotein-cholesterol (HDL) (−0.44 vs. −0.04) (p = 0.008) Within IG: between baseline and follow-up Increases in intake of: - Vegetables by 0.5 servings/day - Fruits by 0.4 servings/day - Legumes increased from 15.9 g/day to 30.6 g/day -Monounsaturated Fatty Acids (MUFA): saturated fatty acid (SFA) ratio increased from mean 1.49 to 1.79 | |
| Bennett et al. (2011) [19] | USA. Managers from eight organizations | RCT 6 months | Total n = 109 IG n = 47 CG n =62 | The Internet-based program ExecuPrev™, trained managers to modify attitudes and behaviors, and built motivation to be healthy and effective leaders. IG: Health education (on diet, exercise, and stress) and leadership development exercises to enhance perceived career benefit of participating (lessons, webinars, additional links and interactive multi-media lessons). CG: No program | 1.Diet 2. Exercise 3. Mental health 4. Biometric measurements | IG vs. CG: IG performed significantly better than CG Diet: Significant improvements in dietary attitudes and dietary self-efficacy (p = 0.00) Exercise: Marginally significant improvements in frequency (p = 0.07) Mental health: Significantly fewer distress symptoms (p = 0.01) Biometric Changes: Women: Significant reduction in WC for the IG compared with CG (p = 0.02). IG lost about 1.26 inches more from their waists than CG. | |
| Author (Year) | Location/Type of Work | Design/Duration | Population/Groups | Intervention/Theory | Incentive | Outcomes | Results |
|---|---|---|---|---|---|---|---|
| Provision of Healthy Food (Environmental Interventions) | |||||||
| Lassen et al. (2012) [20] | Denmark. Financial worksite | Intervention without a control group (CG) 7 weeks | Total n= 27 Participants served as their own control by comparing nutritional intake on days receiving Canteen Take Away (CTA) meals with days not receiving CTA | Provision of a free CTA, a healthy ready-to-heat meal (10 different meals) on two weekdays for employees as well as for their families | Employees were paid for time off work to receive instruction and to complete the dietary interviews. | The effectiveness of a CTA concept in promoting healthy eating habits among employees | CTA days vs. non-CTA days: (No control group) CTA consumption showed nutritional benefits Intake of F&V was on average 129 g higher on CTA days (p = 0.002) Most of the difference in Fruits and Vegetables (F&V) intake was accounted for by an increase of vegetable intake by 109 g, equaling about 1 serving. Average energy density on CTA days (excluding beverages) was 77 kJ/100 g lower than the non-CTA days. (p = 0.01) Energy percentage of protein was on average 2.7% higher (p < 0.001) |
| Alinia et al. (2011) [21] | Denmark. Workplaces with mainly white-collar workers | Non-Randomized Controlled Trial (RCT) 5 months | Total n= 124 Intervention Group (IG) n= 68 CG n= 56 Total sites = 8 Intervention (I) sites n= 5 Control (C) sites n= 3 | IG: Fruit basket with free fruits (mainly apples, pears, oranges and bananas) CG: No fruit basket | 1. Fruit consumption | IG vs. CG: Fruit intake: Significantly increased in IG (p = 0.021) Within IG: Between baseline and follow-up Dietary intake: mean daily fruit consumption increased significantly by 112 g (p = 0.002) mean daily dietary fiber consumption increased significantly by 3 g (p = 0.007) mean daily added sugar consumption significant decreased by 10,7g (p = 0.019) | |
| Inoue et al. (2014) [22] | Japan/ Office workers in the city hall with mostly low levels of Physical Activity (PA) | Non-RCT 3 months | Total n= 35 IG n= 28 CG n= 7 Participants were able to self-select the control or intervention group. | Provision of a Japanese-style healthy lunch at the workplace cafeteria to provide balanced nutrition and sufficient vegetable consumption IG: Japanese-style healthy lunch. 2 subgroups (1) Intake frequency less than 50 meals out of the total 61 meals (<50/61) (2) Intake frequency more than 50 meals out of the total 61 meals (>50/61) CG: Consumed their habitual lunches without restriction | 1. Dietary intake 2.Blood parameters 3.Anthropometric data | Within IG: between baseline and follow-up Dietary intake: IG (< 50 out of 61 meals): Energy and carbohydrate intake significantly decreased (energy: 2554 ± 392 kcal vs. 2104 ± 393 kcal, p = 0.042; carbohydrate: 359.6 ± 85.2 g vs. 295.8 ± 45.3 g). IG (> 50 out of 61 meals): Total dietary fiber and total vegetables significantly increased (total dietary fiber: 15.3 ± 5.2 g vs. 30.4 ± 20.9 g, p = 0.047; total vegetables: 292.4 ± 146.6 g vs.411.1 ± 155.9 g, p = 0.035). Blood parameters: IG (<50 out of 61 meals):Plasma active ghrelin and desacyl ghrelin levels significantly increased (active ghrelin: 1.4 ± 2.0 fmol/mL vs. 3.8 ± 3.9 fmol/mL, p = 0.008; desacyl ghrelin: 41.6 ± 49.0 fmol/mL vs. 101.4 ± 89.3 fmol/mL IG (>50/6150 out of 61 meals):T-Chol, Low Density Lipoprotein (LDL), levels significantly decreased (T-Chol: 211 ± 27 mg/dL vs. 199 ± 22 mg/dL, p = 0.006; LDL: 127 ± 31 mg/dL vs. 116 ± 25 mg/dL, p = 0.010) and plasma active ghrelin and desacyl ghrelin levels significantly increased (active ghrelin: 1.9 ± 5.9 fmol/mL vs. 5.3 ± 8.4 fmol/mL, p = 0.001; desacyl ghrelin: 77.4 ± 135.4 fmol/mL vs. 115.7 ± 180.7 fmol/mL). Anthropometric data: IG (<50 out of 61 meals): Diastolic Blood Pressure (DBP) significantly decreased (90.5 ± 11.9 vs. 86.3 ± 11.4, p = 0.000). IG (>50 out of 61 meals): Body Fat Percentage (BFP), Systolic Blood Pressure (SBP), DBP significantly decreased (BFP: 23.8 ± 3.5 vs. 22.7 ± 3.6, p = 0.019; SBP: 137.5 ± 15.0 vs. 131.9 ± 16.9, p = 0.023; DBP: 88.4 ± 10.6 vs. 80.8 ± 8.7, p = 0.000). The results grew more pronounced as intake of Japanese-style healthy lunches increased in frequency Within CG: between baseline and follow-up Dietary intake: The “other vegetable” intake significantly decreased (240.1 g ± 128.5 g vs. 96.4 g ± 64.7 g, p = 0.015). Blood parameters: Hemoglobin A1c (HbA1C) levels had significantly increased (4.99% ± 0.29% versus 5.13% ± 0.21%, p < 0.05) Anthropometric data: No significant differences | |
| Author (Year) | Location/Type of Work | Design/Duration | Population/Groups | Intervention/Theory | Incentive | Outcomes | Results |
|---|---|---|---|---|---|---|---|
| Provision of Information (Educational or Environmental Interventions) | |||||||
| Vyth et al. (2011) [23] | Netherlands. Office workers with mainly sedentary jobs, worksite cafeterias | Randomized Controlled Trial (RCT) 3-week was repeated 3 times during the 9-week research period | Total n= 368 Intervention Group (IG) n= 232 Control Group (CG) n= 136 Total cafeterias = 25 Intervention (I) cafeterias n = 13 Control (C) cafeterias n = 12 | IG: Healthy options added and labelled CG: Same menu without the logo Theory of Planned Behavior (TPB) | 1. Sales data: sandwiches, soups, fried snack foods, fruit, salads 2. Behavior determinants | IG vs. CG: Sales data: Fruit sales were significantly higher in the IG (p = 0.001). This effect represents 1 c fruit per 50 employees per week. This change continued during the post-intervention period Behavior determinants: No significant differences | |
| Engbers et al. (2006) [24] | Netherlands. Two companies with office workers | Controlled Longitudinal Trial (CLT) 12 months | Total n= 432 IG n = 191 CG n = 241 Total sites = 2 I sites n= 1 C sites n= 1 | The FoodSteps intervention Food part: Placement of informational sheets near food products, to stimulate healthier food choices at company’s canteen Physical Activity (PA) part: (i.e., stimulating stair-use) ASE model: Attitude-social influence- (self-)efficacy model’ | 1.Psychosocial determinants of behavior in: 1. Fruit and Vegetables (F&V) consumption 2. Fat consumption | IG vs. CG: Psychosocial determinants of behavior in: F&V consumption: No effects were found Fat consumption: At 3 months a significant positive effect was found on the perceived social support from colleagues regarding eating less fat in the IG, but at 12 months the attitude and self-efficacy towards eating less fat became less positive. Self-efficacy towards eating less fat at work decreased significantly in the IG. This effect was also found at 12 months. | |
| Abood et al. (2003) [10] | USA. Administrative staff at a university | Pretest-posttest 8 weeks | Total n= 53 IG n= 28 CG n= 25 | Theory-based, worksite-tailored nutrition education program IG: Eight 1-h weekly educational sessions. CG: Subjects did not receive any form of intervention. They received an abbreviated version of the nutrition education intervention 1-month post intervention. Health Belief Model (HBM) | 1. Health beliefs and nutrition knowledge 2. Dietary behaviors | IG vs. CG: Health beliefs and nutrition knowledge: Significantly improvements in perceived benefits of healthy nutrition practices and nutrition knowledge related to cardiovascular disease and cancer in the IG. (p < 0.001) There was also an association between nutrition knowledge and higher fiber intake (p < 0.005) and between nutrition knowledge and consuming a lower energy percentage of total fat and saturated fat (p < 0.005) Dietary behavior: Participants significantly reduced (each p < 0.001) Total calories: by approximately 840 kcal/day Fat intake: by 45 g/day Saturated fat: by 18 mg/day Cholesterol intake: by 158 mg/day, | |
| Salinardi et al. (2013) [25] | USA. Worksites office-based companies | RCT 12 months | Total n = 133 IG n= 94 CG n =39 Total sites = 4 I sites n= 2 C sites n= 2 | Weight loss and maintenance program (6 months each) IG: nineteen 1-h long education sessions, health and nutrition education program open to all employees (newsletters on healthy eating and seminars) and a 6-months structured maintenance program was also offered to employees who completed the weight-loss program CG: no intervention Social Ecological Model (SEM) | 1.Body weight 2. Cardio-metabolic risk factors | IG vs. CG: There were significant improvements in the IG Cardiometabolic risk factors: Fasting total cholesterol, glucose, Systolic Blood Pressure (SBP) and Diastolic Blood Pressure (DBP) were significantly improved (p ≤ 0.02 for each) Body weight: The weight loss in kg in IG (−8.0 ± 0.7;) was significantly different from the CG (weight gain +0.9 ± 0.5 kg) p < 0.001) after 12 months. | |
| Allen et al. (2012) [26] | USA. Employees of the University of New Hampshire | Semi-RCT 12 months | Total n= 55 IG n= 26 CG n= 29 | Comparison of health risk factors of employees who received health risk screening plus lifestyle education (IG) with those who received screening plus minimal information (CG). IG: monthly education sessions and pedometers CG: no intervention | 1.Anthropometric Body Mass Index (BMI), Waist Circumference (WC), Body Fat Percentage (BFP) 2.Clinical measures: Low-Density Lipoprotein, (LDL), total cholesterol (T-Chol) | IG vs. CG: Clinical measures: At 12 months, LDL (p = 0.01), T-Chol (p = 0.01) and several metabolic syndrome markers (p = 0.002) were significantly lower in the IG than in the CG (LDL: 110.9 mg/dL vs. 126.7 mg/dL and T-Chol: 183.4 mg/dL vs. 198.6 mg/dL) Within groups: between baseline and follow-up Anthropometric: CG: Waist Circumference (WC) increased (37.1 to 38.9 inch), (p < 0.05) | |
| Nisbeth et al. (2000) [27] | Denmark. White collar workers employees in a computer company | RCT 1 year | Total n= 74 IG n = 48 CG n = 26 | Counselling on diet, exercise and smoking and its effect on Coronary heart disease (CHD) risk factors IG: divided into3 subgroups: 1. Exercise group (EG) aerobic exercise 3 times/week 2. Diet group (DG) reduce intake of saturated fat and increase fish products 3. Smokers group (SG) quit smoking The subjects could participate in more than one intervention CG: No intervention | 1.Lifestyle changes 2. CHD risk factors | All 3 IG groups vs. CG: Significant differences in favor of the IG: Lifestyle changes: The fitness level (aerobic power) increased (p < 0.01) CHD risk factors: BW and BMI decreased (p < 0.05) DG vs. CG: Compared to the CG beneficial changes were found in BW, total cholesterol, LDL, Triglycerides and LDL/High-Density Lipoprotein (HDL) ratio. SG vs. CG: Compared to the control group changes were found in total cholesterol, LDL and LDL/HDL ratio. Within IG: between baseline and follow-up EG: Aerobic power increased from 37.0 to 40.5 mL min−1 kg−1 (p < 0.01) DG: HDL increased from 1.12 to 1.27 mmol L−1 (p < 0.01), Tr decreased from 2.10 to 1.50 mmol l-1 (p < 0.05) and LDL/HDL ratio decreased from 3.86 to 3.32 (p < 0.05). SG: HDL increased from 1.10 to 1.23 mmol L−1 (p < 0.01), LDL/HDL ratio decreased from 3.43 to 2.97 (p < 0.05), DBP increased from 75 to 78 mmHg (p < 0.05) and aerobic power increased from 2.96 to 3.07 L min−1 (p < 0.05). | |
| Addley et al. (2014) [28] | UK. Department of Finance and Personnel (DFP) within the Northern Ireland Civil Service (NICS) | RCT 12 months | Total n= 132 IG n = 84 CG n = 48 | IG: divided into 2 subgroups: Groups A: Health risk appraisals (HRA) augmented with health promotion and education activities Group B: HRA only CG: Group C | 1. Lifestyle parameters (BMI, alcohol, PA) 2. Mental health 3. Work ability 4. Self-perceived health behavior change (healthy diet) | IG vs. CG: Lifestyle parameters (BMI, alcohol, PA), Mental health and Work ability: No effect Self-perceived health behavior change (healthy diet): Groups A and B were more likely to report making a lifestyle change in comparison with the CG. Within IG (Group A vs. Group B) Group A was considerably more likely to report a change compared with Group B | |
| Horan et al. (2018) [29] | USA. University Employees | Pretest-Posttest 10 weeks | Total n= 24 No control group | 10-week session groups - Weekly meetings of didactic psycho education (30 min) and group exercise (30 min) - Weekly workbook activities (goal setting, nutrition, physical activity etc.) - Optional individual health coaching sessions | Participants submitted a United States Dollar (USD) 100 deposit, which was returned based on participation and completion of program requirements | 1. Dietary intake 2. Anthropometric data 3. Physical fitness 4. Mindfulness and self-compassion | Within IG: between baseline and follow-up (No control group) Dietary intake: Fat consumption significantly decreased (p = 0.019) and mindful eating increased (p = 0.001) Anthropometric data: Abdominal circumference significantly decreased (p = 0.01), and thigh circumference significantly increased (p < 0.001). Physical fitness: Muscular endurance (crunches and push-ups) (p = 0.015, p = 0.008), leisure time PA (p = 0.034) and mindful exercise increased (p < 0.001), and physical well-being improved (p = 0.005). Mindfulness and self-compassion: Self-compassion (p < 0.001) and well-being (p = 0.003) improved |
| Kim et al. (2012) [6] | Korea. Office workers with abnormal findings | Before-after 4 months | Total n= 75 male workers | Workplace-visiting nutrition education program Anthropometric and clinical measurements Consulting of examination results Nutrition education Assessment | 1.Anthropometric data 2.Clinical measures | Within IG: between baseline and follow-up (No control group) Anthropometric data: BMI was significantly reduced from 25.7 kg/m2 to 25.4 kg/m2 (p < 0.05) Clinical measures: Significant decrease in: - Fasting blood sugar: from 100.5 mg/dL to 97.0 mg/dL (p < 0.01) - T-Chol: from 211.3 mg/dL to 204.4 mg/dL (p < 0.05) - LDL: from 131.1 mg/dL to 123.6 mg/dL (p < 0.05) | |
| Author (Year) | Location/Type of Work | Design/Duration | Population/Groups | Intervention/Theory | Incentive | Outcomes | Results |
|---|---|---|---|---|---|---|---|
| Multicomponent | |||||||
| Engbers et al. (2007) [30] | Netherlands. Two companies with office workers | Controlled Cluster Trial (CCT) 12 months | Total n= 452 Intervention Group (IG) n = 205 Control Group (CG) n = 247 Total sites = 2 Intervention (I) sites n= 1 Control (C) sites n= 1 | ‘Food’-part: to stimulate healthier food choices by means of product information in the canteen ‘Steps’-part: focused on stimulating stair use by means of motivational prompts in staircases and on elevator doors. | 1. Biological cardiovascular risk indicators | IG vs. CG: Significant differences in favor of the IG: - Total cholesterol for women decreased by 0.35 mmol/L (p = 0.001) -High-Density Lipoprotein (HDL) for men increased by 0.10 mmol/L(p < 0.001) - The total cholesterol (T-Chol)–HDL ratio for the total group decreased by 0.45 mmol/L (p < 0.001) A difference in change in Systolic Blood Pressure (SBP) was found in favor of the CG (~4 mm Hg), due to an increase in the IG. Both groups: showed a decrease in all body composition values | |
| Steenhuis et al. (2004) [31] | Netherlands. Companies and governmental organizations with mainly white-collar workers, worksite cafeterias | Randomized Controlled Trial (RCT) (companies were randomized) 6 months | Total n= 1013 IG n = 798 CG n = 215 Total work site cafeterias n= 17 | 4 conditions: (1). Educational Program (EP) (information about healthy nutrition) (2). Food supply Program (FSP) (increased availability of low fat products and fruits and vegetables) + EP (3). Labeling Program (LP) (low-fat products were labeled) + EP (4). No Program (NP) | People could obtain the self-help manual for free by filling out a coupon that was included in the brochures. | 1. Sales data: low-fat milk, butter, meat, cheese products and desert 2. Food intake | LP vs. EP: Sales data: In the LP sales of low-fat desserts were increased (p < 0.01) LP vs. NP: Sales data: In the LP sales of low-fat desserts were increased (p < 0.05) Food intake: Total fat intake was decreased for respondents who believed they ate a high-fat diet (p = 0.04). |
| Hutchinson et al. (2013) [32] | Australia. Utility company | Non-randomized Observational Study (NROS) 4 weeks | Total n= 75 IG n= 54 CG n= 21 Total work sites n= 3 | Group A: Provision of free fruit Group B: Free fruit and peer education/modelling condition Group C: Control group | Peer educators (Employees) received a small financial reimbursement for their time | 1. Dietary intake (consumption of fruits and high fat snacks at work and home) | Dietary intake: Fruits: Fruit consumption significantly increased at work (p = 0.04) A vs. B: fruit consumption in Group B was greater than that in Group A B vs. C: fruit consumption in Group B was greater than that in Group C It was more successful among those who were not meeting the recommendations (2 weeks post-intervention the change was not maintained p = 0.76) High fat snacks A vs. C: Group A decreased the number of high fat snacks consumed pre- to post-intervention and Group C increased high fat snack consumption B vs. C: Group B decreased the number of high fat snacks consumed pre- to post-intervention and Group C increased high fat snack consumption. Fat consumption was decreased to a greater extent in those who were not already eating two serves of fruit per day. Only Group B managed to maintain this change (p = 0.05). |
| Maruyama et al. (2010) [33] | Japan. Office workers of the Nichirei Group Corporation with MetS risk factors | RCT 4 months | Total n= 101 IG n = 52 CG n = 49 | LiSM10! program composed of individual structured counseling sessions, social and environmental approaches. Individual counseling: Monthly individual contact with a dietitian and a physical trainer. Goal setting: After baseline assessment, the participants attended an individual goal and action planning session and they reviewed their plans with counselors | 1. Diet 2. Physical Activity (PA) 3. Metabolic parameters | IG vs. CG: Significant differences in favor of the IG: Diet: Intake of habitual food group significantly changed (recommended food consumption increased and consumption of foods to avoid decreased) (p = 0.00). PA: No difference between the two groups in the number of steps Metabolic parameters: Body Weight (BW), Body Mass Index (BMI), fasting plasma glucose, insulin, aspartate aminotransferase (p < 0.05), homeostasis model assessment of insulin resistance changes (HOMA-IR) significantly improved (p < 0.01) | |
| Sorensen et al. (1999) [34] | USA. White collar workers in community health centers | RCT 19.5 months | Total n= 1306 (22 worksites) | 3 intervention groups: (1). Minimal intervention (CG) (2). A worksite intervention (3). A worksite plus family intervention Social Ecological Model (SEM) | 1. Diet (Fruit and Vegetables (F&V), fat, fiber consumption) | Within all groups: between baseline and follow-up Diet: F&V intake increased by: 7% in the worksite intervention group (approx. 0,2 servings) 19% in the worksite-plus-family group (approx. 0,5 servings) 0% in the control group (1 vs. 2 vs. 3) 1 vs. 2: The difference between the worksite intervention and the CG is not statistically significant (p = 0.47) 1 vs. 3: The increase in the worksite plus family group is significantly greater than that in the CG (p = 0.02). These changes reflect an increase of half a serving compared to the CG (p = 0.018) 2 vs. 3: The overall difference in F&V intake among the intervention groups is statistically significant (p = 0.05) | |
Publisher’s Note: MDPI stays neutral with regard to jurisdictional claims in published maps and institutional affiliations. |
© 2020 by the authors. Licensee MDPI, Basel, Switzerland. This article is an open access article distributed under the terms and conditions of the Creative Commons Attribution (CC BY) license (http://creativecommons.org/licenses/by/4.0/).
Share and Cite
Glympi, A.; Chasioti, A.; Bälter, K. Dietary Interventions to Promote Healthy Eating among Office Workers: A Literature Review. Nutrients 2020, 12, 3754. https://doi.org/10.3390/nu12123754
Glympi A, Chasioti A, Bälter K. Dietary Interventions to Promote Healthy Eating among Office Workers: A Literature Review. Nutrients. 2020; 12(12):3754. https://doi.org/10.3390/nu12123754
Chicago/Turabian StyleGlympi, Alkyoni, Amalia Chasioti, and Katarina Bälter. 2020. "Dietary Interventions to Promote Healthy Eating among Office Workers: A Literature Review" Nutrients 12, no. 12: 3754. https://doi.org/10.3390/nu12123754