
Dynamic Wetting Properties of Silica-Poly (Acrylic Acid) Superhydrophilic Coatings
 ,
, 
 ,
,
Abstract
:1. Introduction
2. Experimental Section
2.1. Materials and Chemicals
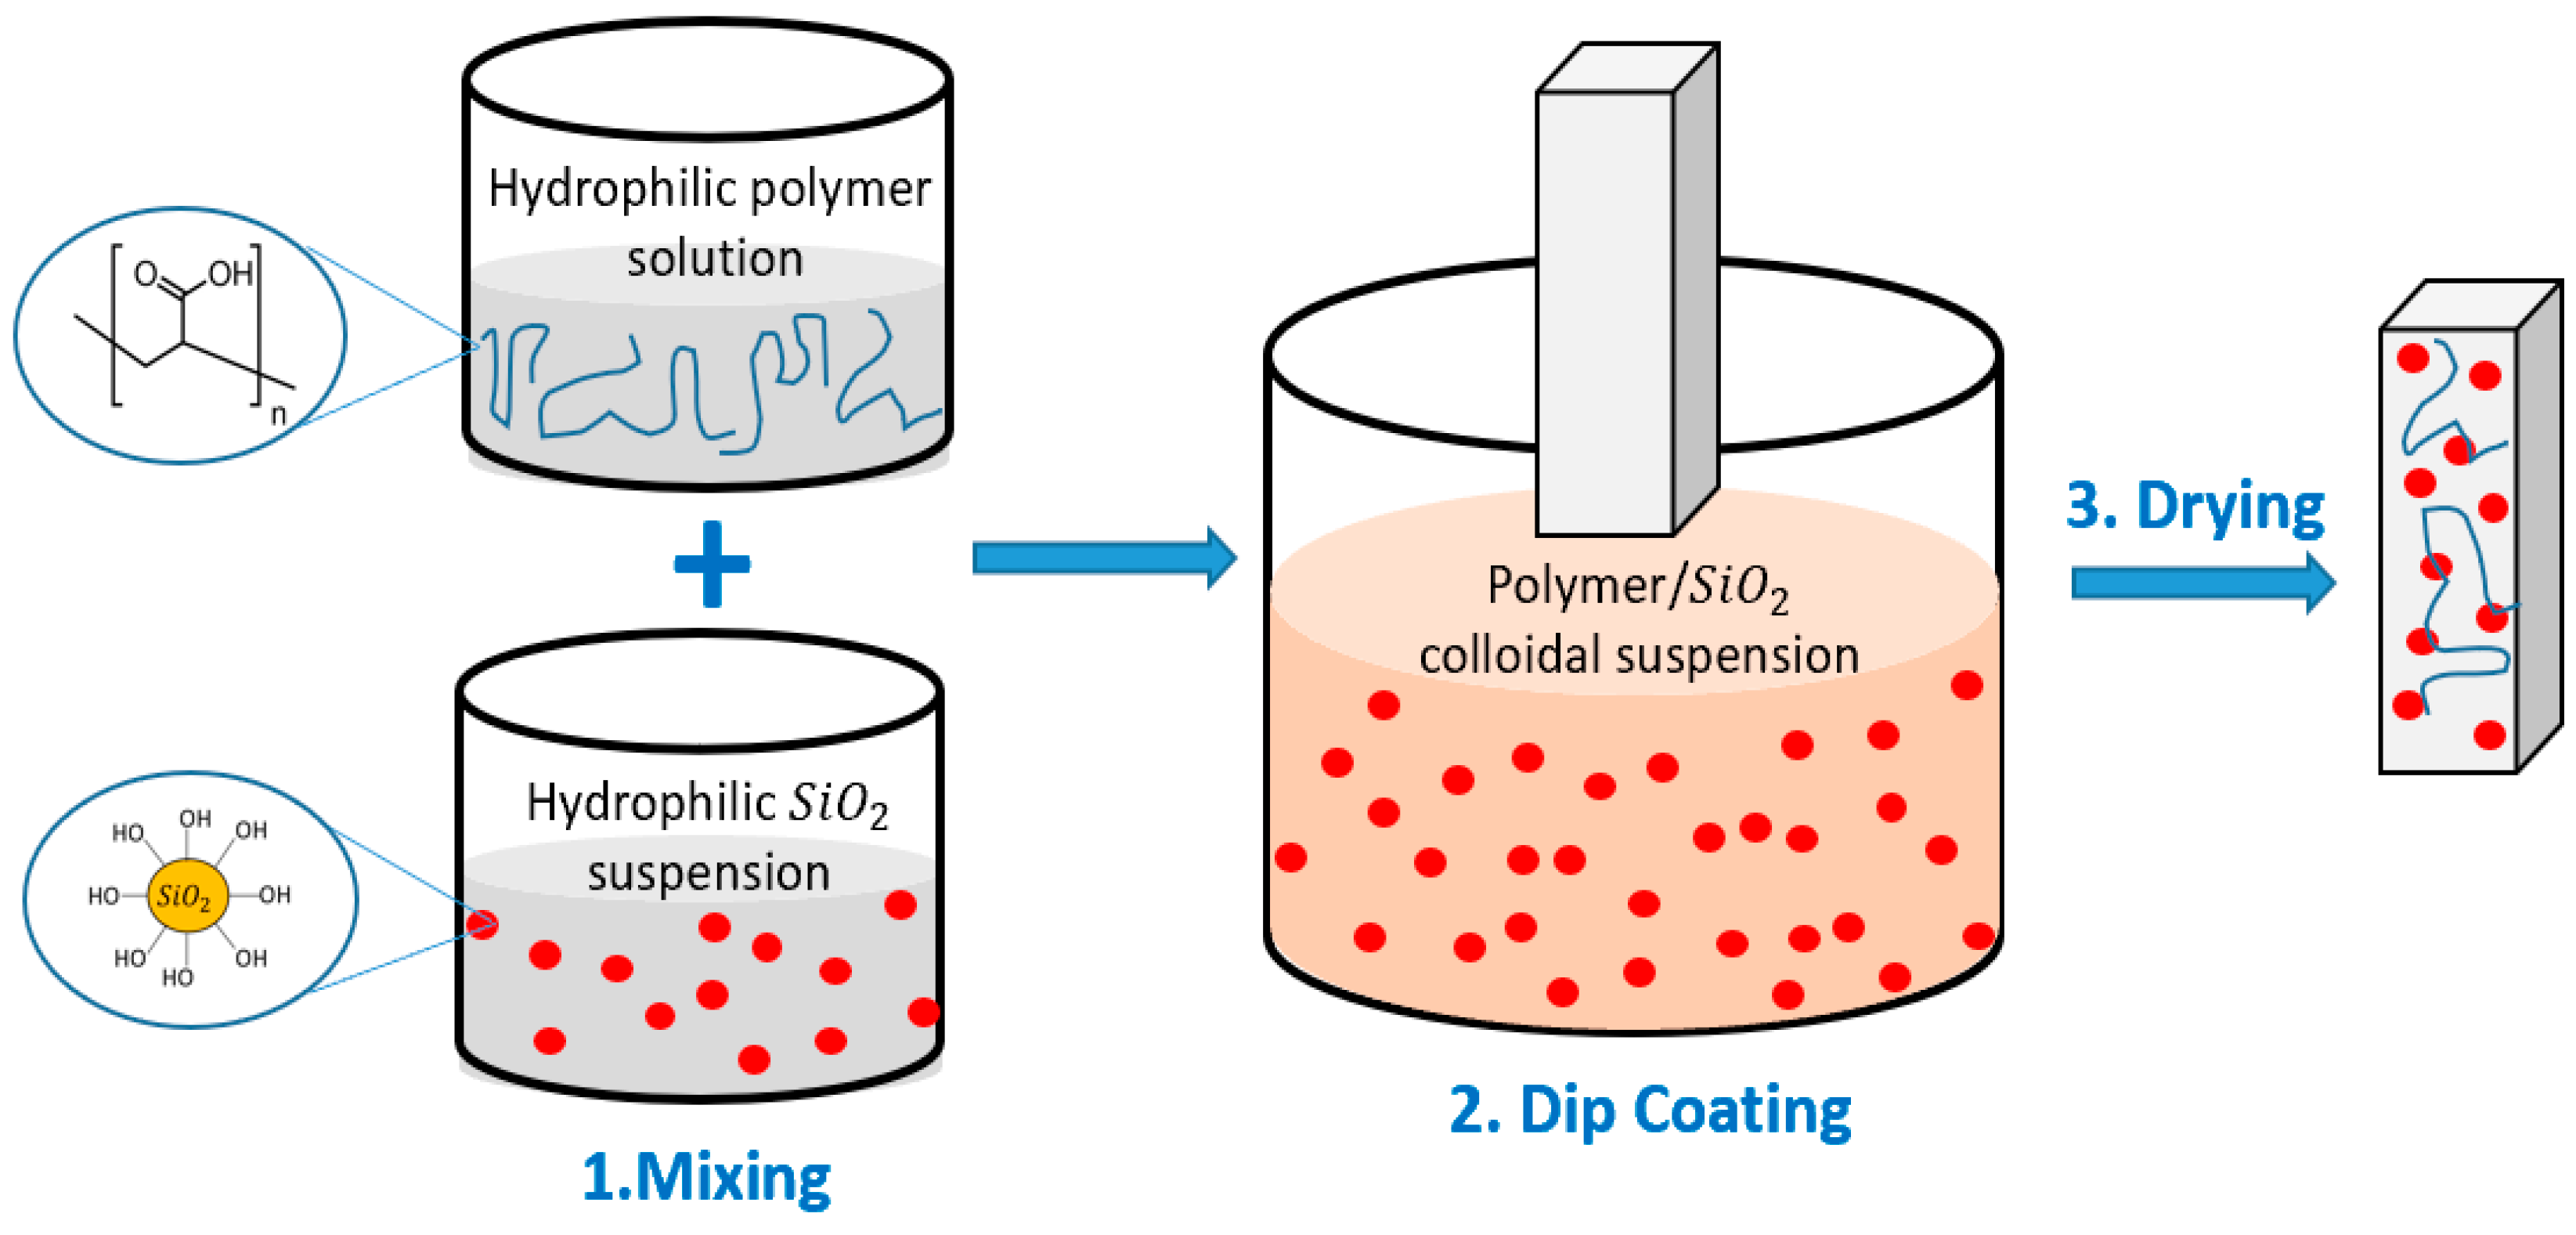
2.2. Preparation of Coatings
2.3. Characterization
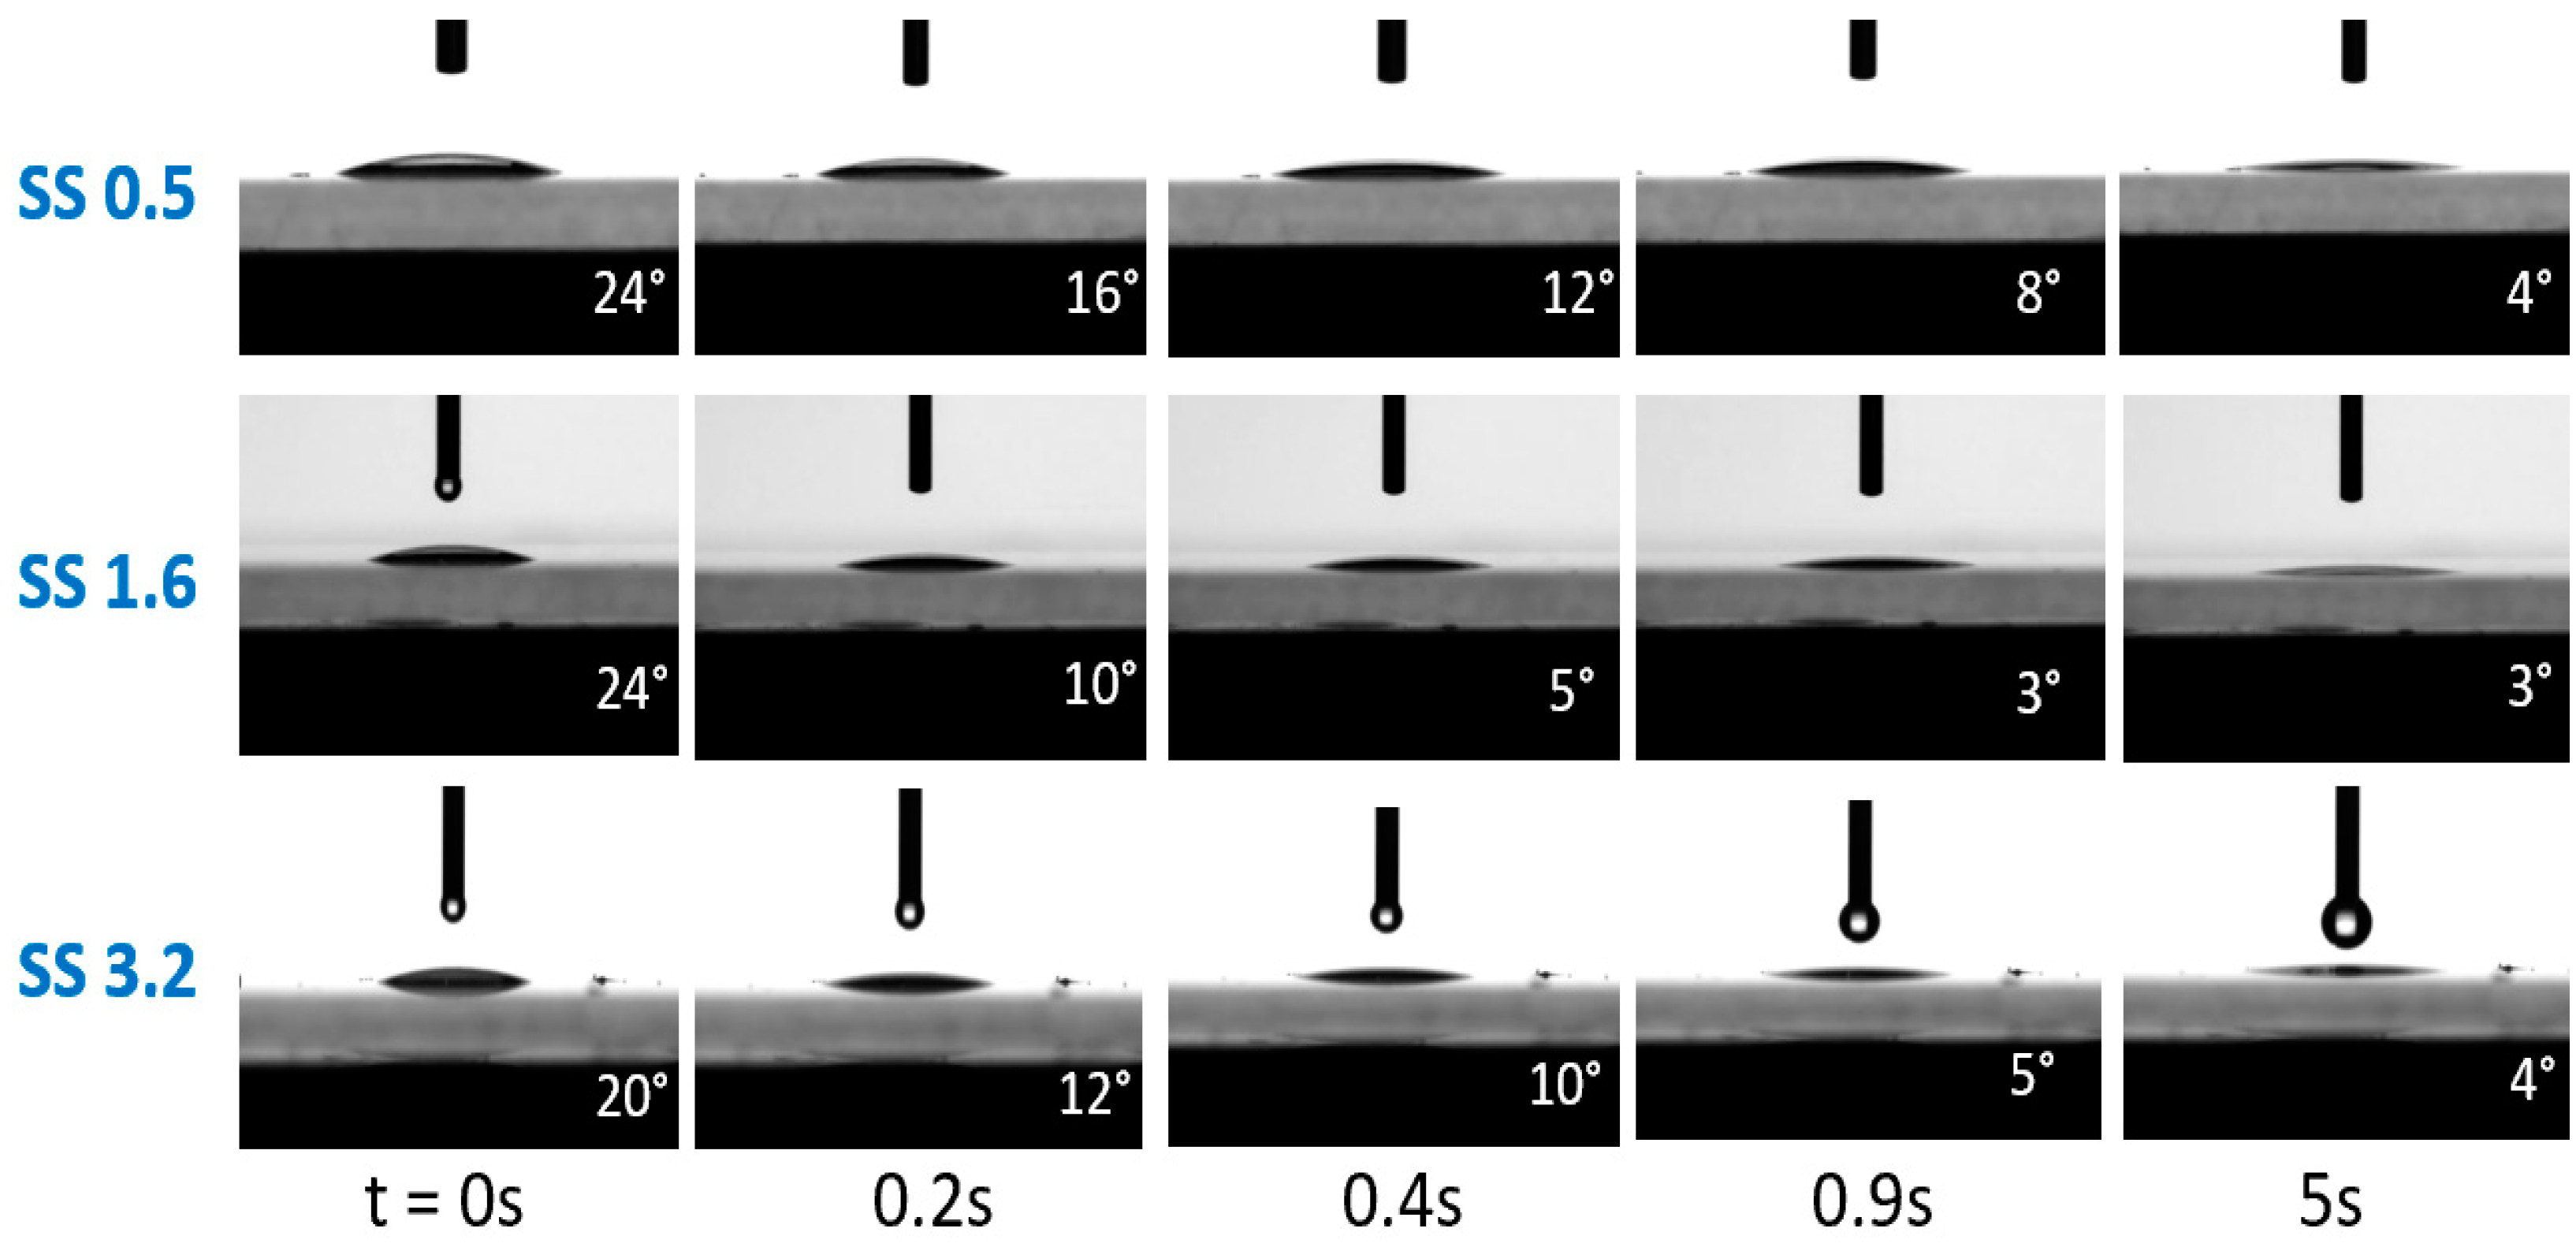
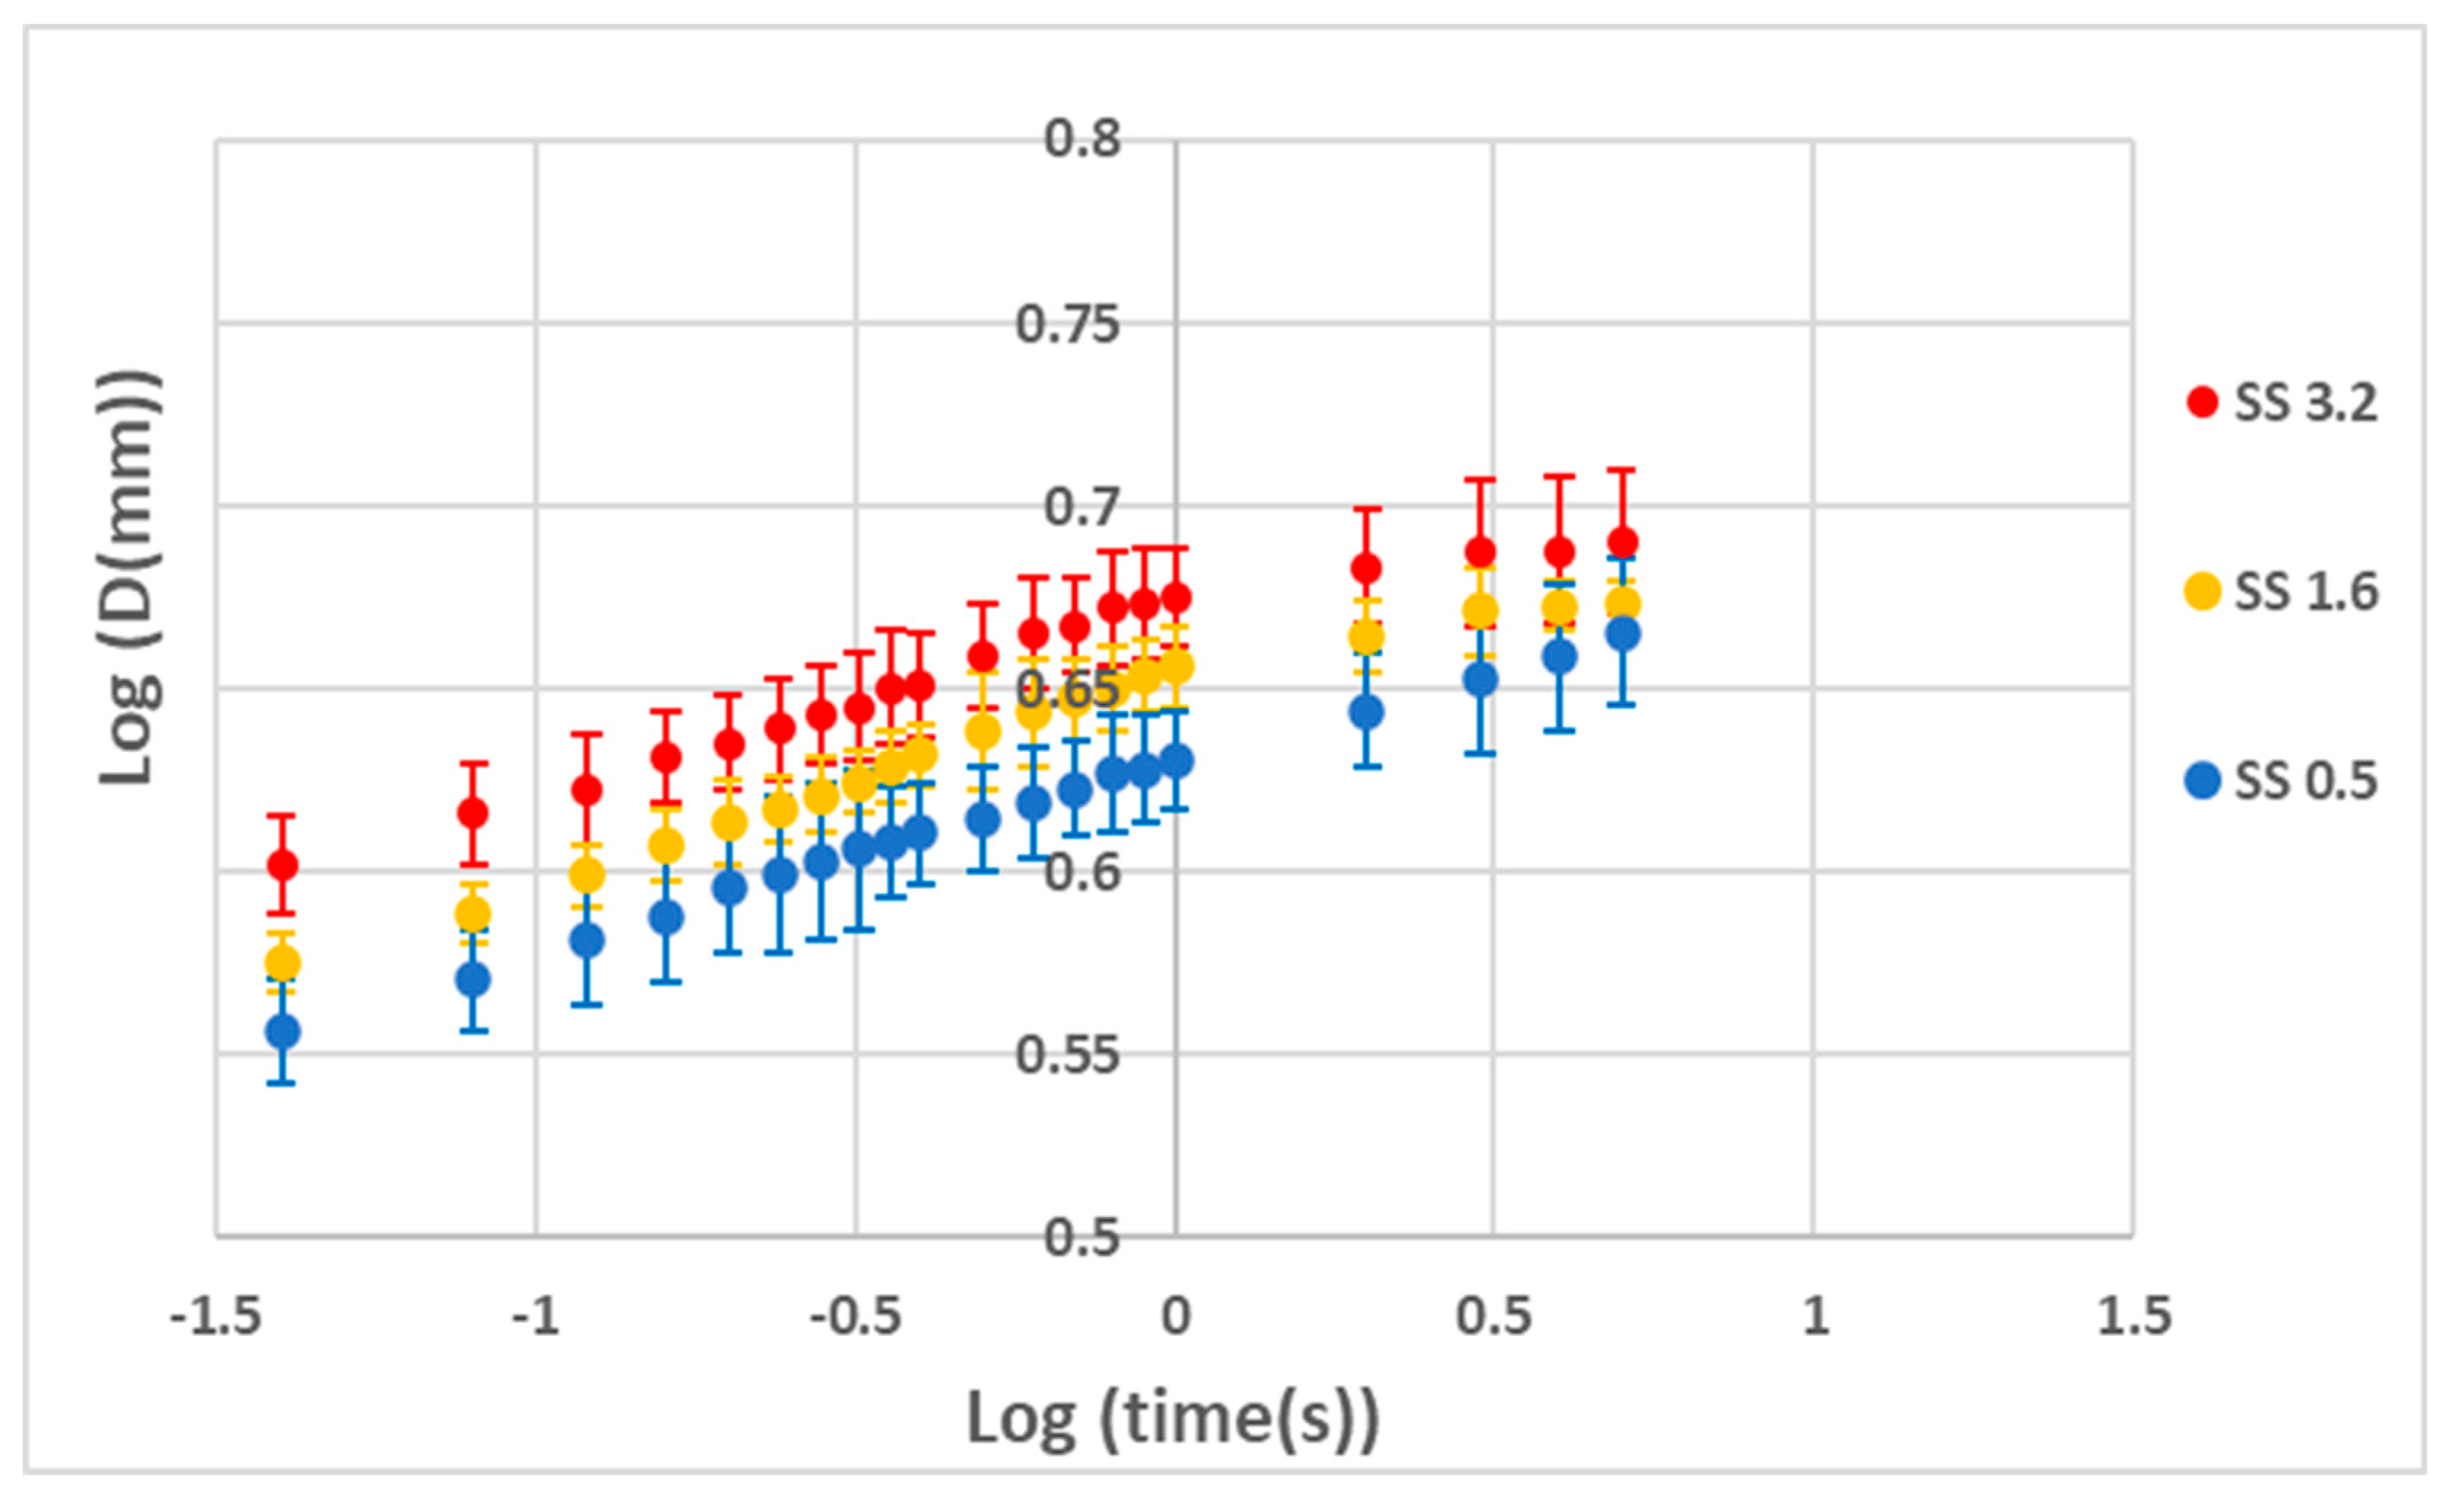
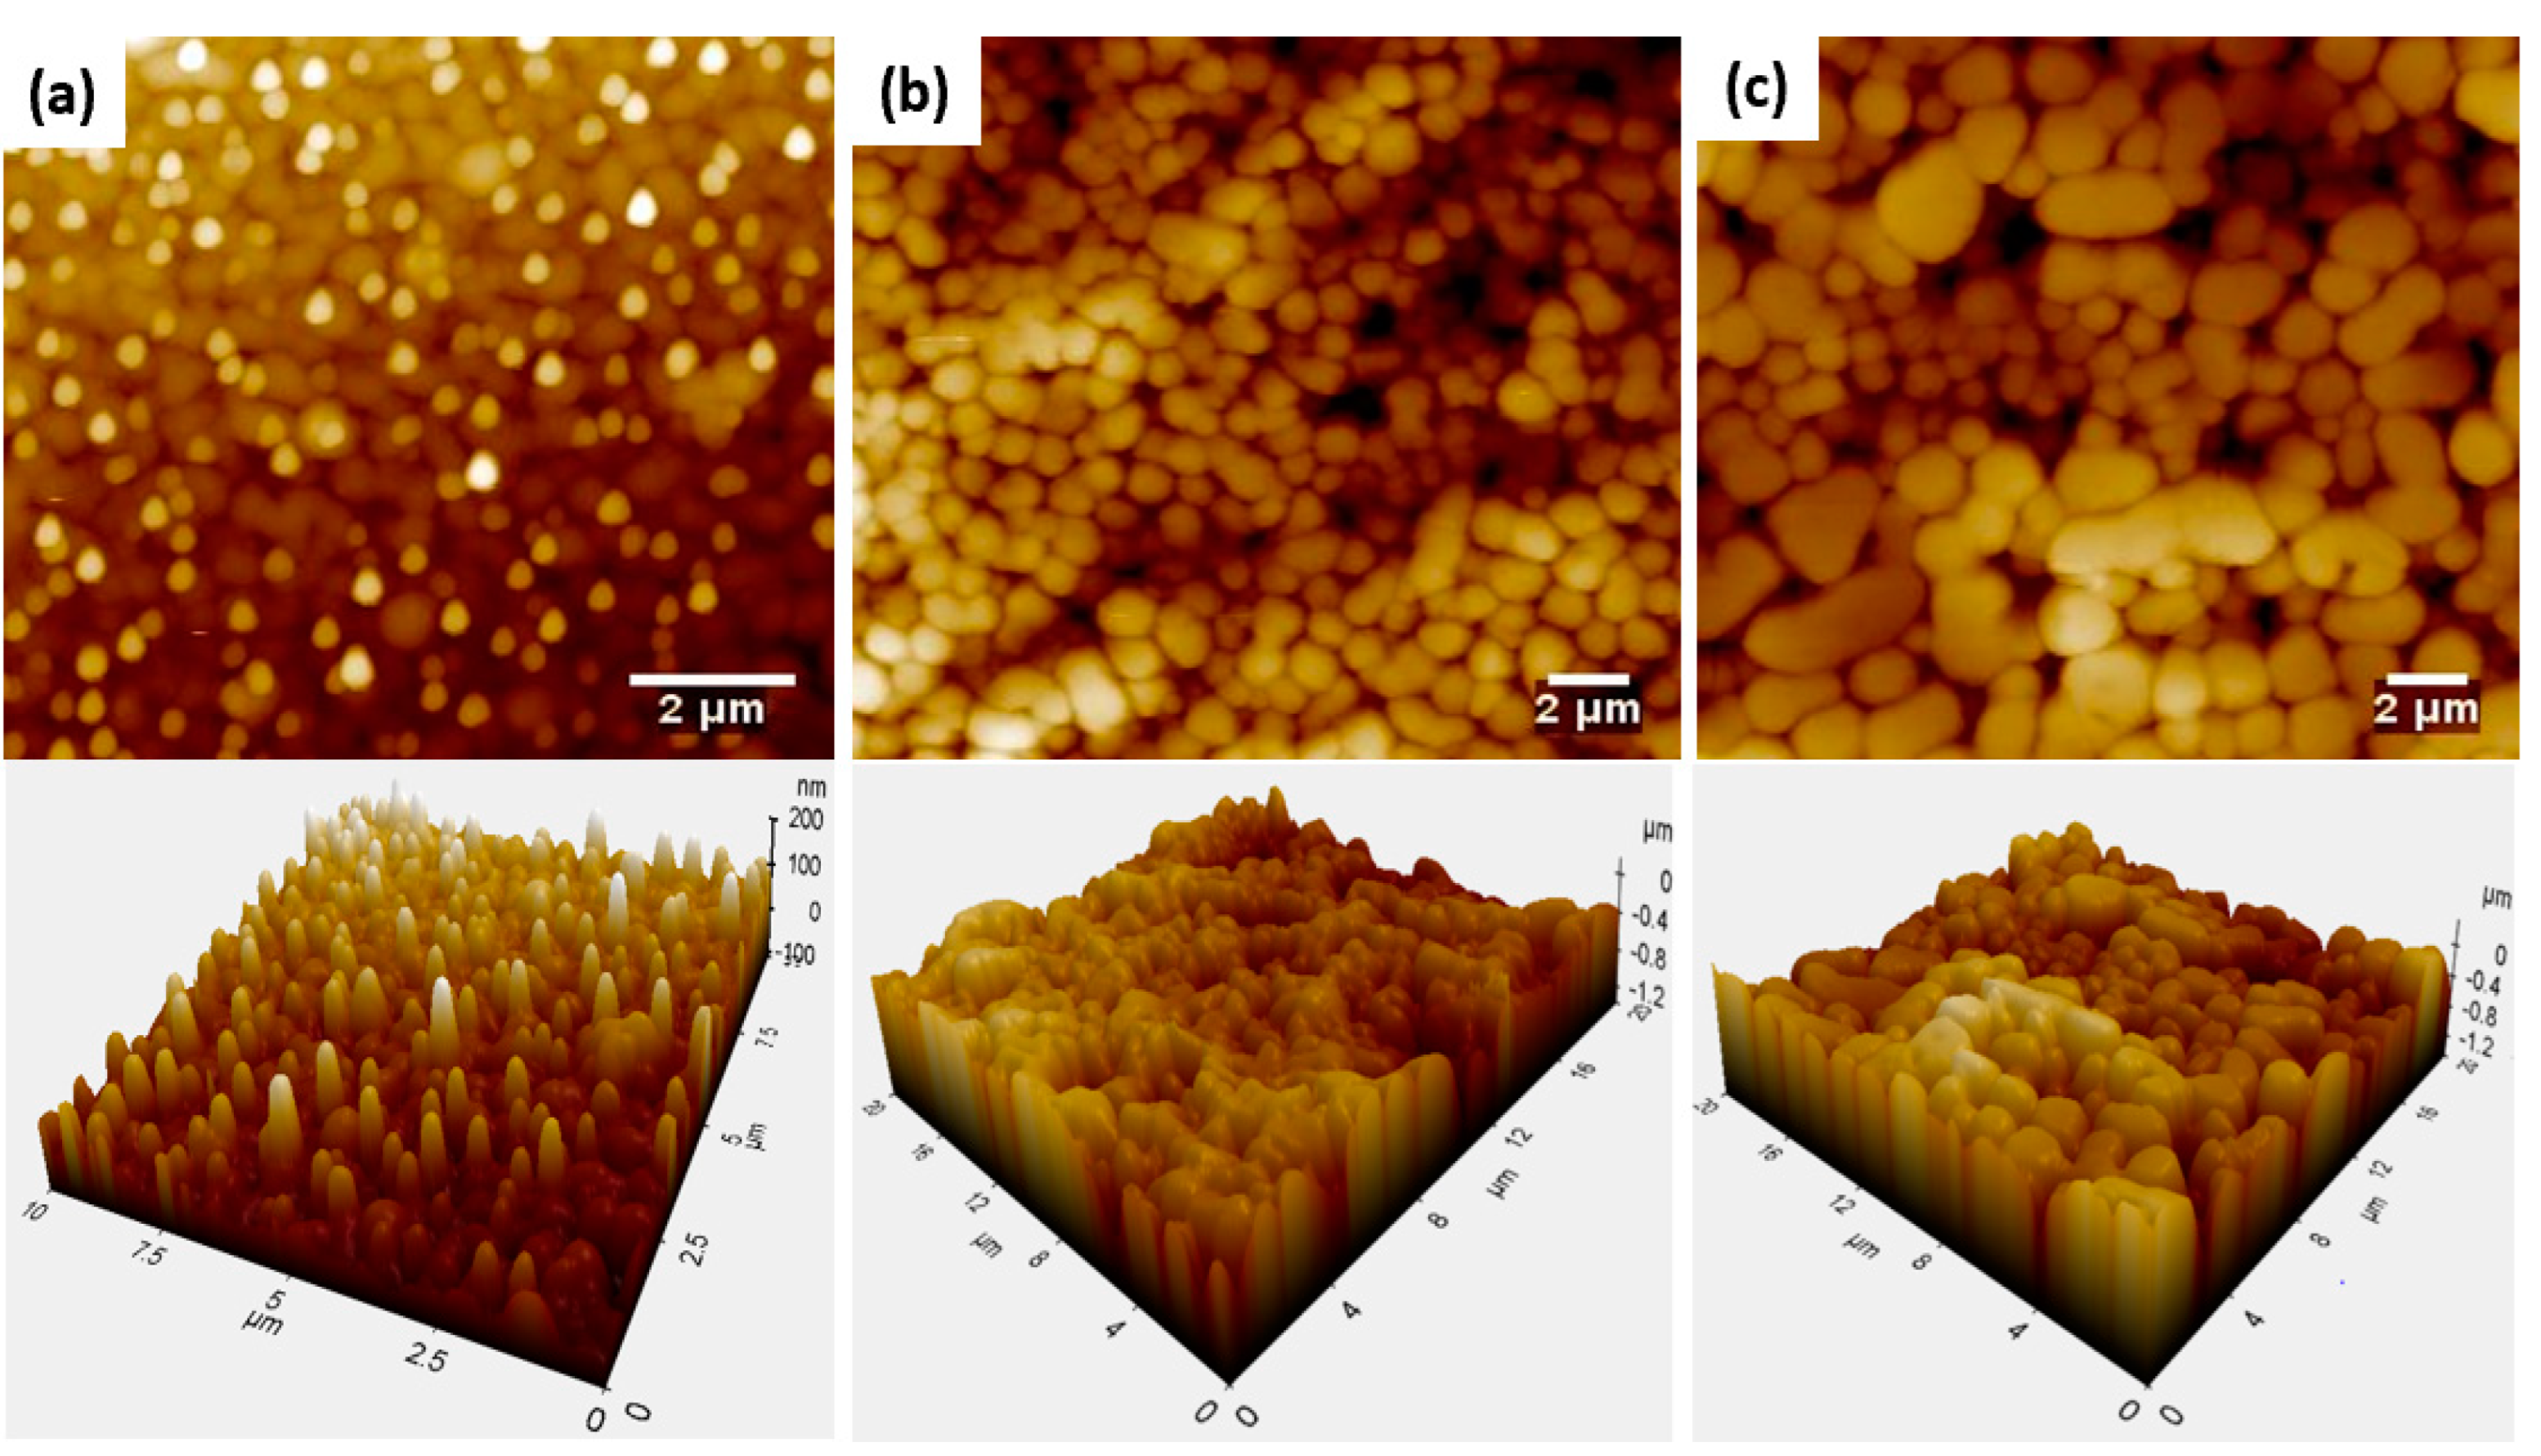
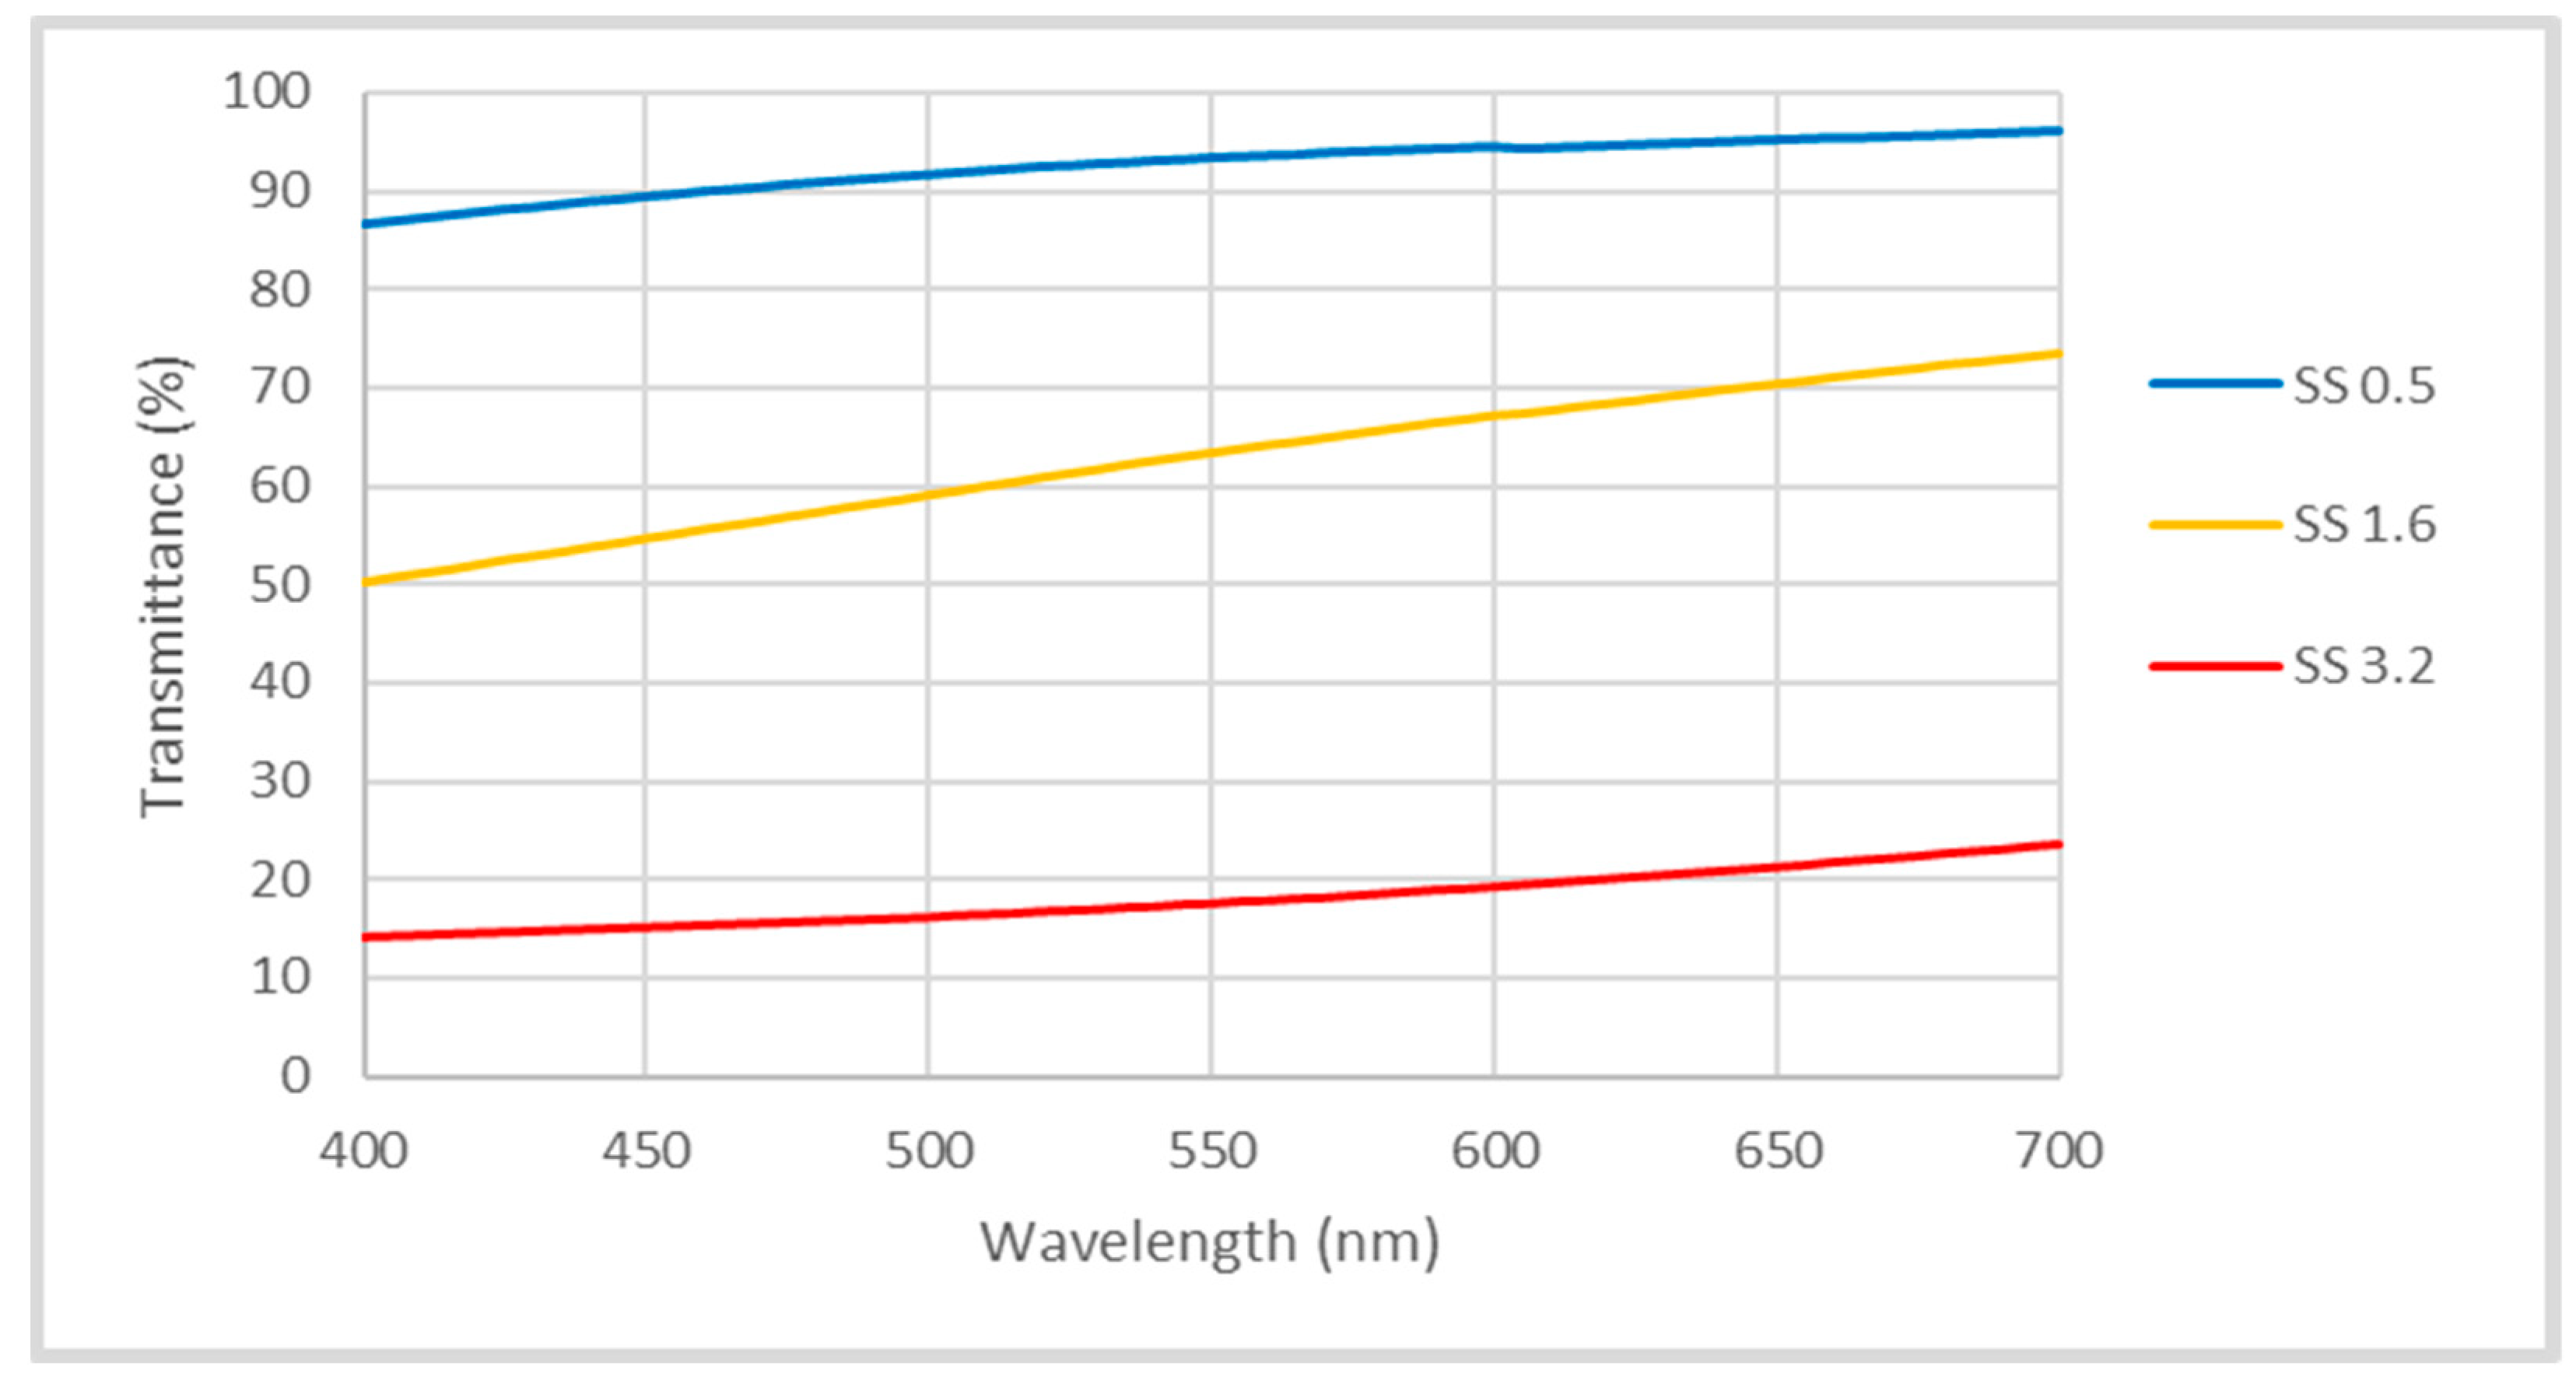
3. Results and Discussion
Performance Analysis of the Coatings
4. Conclusions
Supplementary Materials
Author Contributions
Funding
Institutional Review Board Statement
Informed Consent Statement
Data Availability Statement
Acknowledgments
Conflicts of Interest
References
- Wang, Y.; Zhang, B.; Dodiuk, H.; Kenig, S.; Barry, C.; Ratto, J.; Mead, J.; Jia, Z.; Turkoglu, S.; Zhang, J. Effect of Protein Adsorption on Air Plastron Behavior of a Superhydrophobic Surface. ACS Appl. Mater. Interfaces 2021, 13, 58096–58103. [Google Scholar] [CrossRef] [PubMed]
- Wang, Y.; Zhang, J.; Dodiuk, H.; Kenig, S.; Ratto, J.A.; Barry, C.; Turkoglu, S.; Mead, J. The effect of superhydrophobic coating composition on the topography and ice adhesion. Cold Reg. Sci. Technol. 2022, 201, 103623. [Google Scholar] [CrossRef]
- Zheng, K.; Zhang, J.; Dodiuk, H.; Kenig, S.; Barry, C.; Sun, H.; Mead, J. Effect of Superhydrophobic Composite Coatings on Drag Reduction in Laminar Flow. ACS Appl. Polym. Mater. 2020, 2, 1614–1622. [Google Scholar] [CrossRef]
- Polakiewicz, A.; Dodiuk, H.; Kenig, S. Super-hydrophilic coatings based on silica nanoparticles. J. Adhes. Sci. Technol. 2014, 28, 466–478. [Google Scholar] [CrossRef]
- Drelich, J.; Chibowski, E.; Meng, D.D.; Terpilowski, K. Hydrophilic and superhydrophilic surfaces and materials. Soft Matter. 2011, 7, 9804–9828. [Google Scholar] [CrossRef]
- Hossain, M.N.; Lee, S.-J.; Kim, C.-L. Fabrication of TiO2–KH550–PEG Super-Hydrophilic Coating on Glass Surface without UV/Plasma Treatment for Self-Cleaning and Anti-Fogging Applications. Materials 2022, 15, 3292. [Google Scholar] [CrossRef] [PubMed]
- Dong, H.; Ye, P.; Zhong, M.; Pietrasik, J.; Drumright, R.; Matyjaszewski, K. Superhydrophilic Surfaces via Polymer− SiO2 Nanocomposites. Langmuir 2010, 26, 15567–15573. [Google Scholar] [CrossRef] [PubMed]
- Liao, Z.; Wu, G.; Lee, D.; Yang, S. Ultrastable underwater anti-oil fouling coatings from spray assemblies of polyelectrolyte grafted silica nanochains. ACS Appl. Mater. Interfaces 2019, 11, 13642–13651. [Google Scholar] [CrossRef]
- Kaya, A.S.T.; Cengiz, U. Fabrication and application of superhydrophilic antifog surface by sol-gel method. Prog. Org. Coat. 2019, 126, 75–82. [Google Scholar] [CrossRef]
- Cebeci, F.Ç.; Wu, Z.; Zhai, L.; Cohen, R.E.; Rubner, M.F. Nanoporosity-driven superhydrophilicity: A means to create multifunctional antifogging coatings. Langmuir 2006, 22, 2856–2862. [Google Scholar] [CrossRef]
- Chiao, Y.-H.; Chen, S.-T.; Sivakumar, M.; Ang, M.B.M.Y.; Patra, T.; Almodovar, J.; Wickramasinghe, S.R.; Hung, W.-S.; Lai, J.-Y. Zwitterionic polymer brush grafted on polyvinylidene difluoride membrane promoting enhanced ultrafiltration performance with augmented antifouling property. Polymers 2020, 12, 1303. [Google Scholar] [CrossRef] [PubMed]
- Nundy, S.; Ghosh, A.; Mallick, T.K. Hydrophilic and superhydrophilic self-cleaning coatings by morphologically varying ZnO microstructures for photovoltaic and glazing applications. ACS Omega 2020, 5, 1033–1039. [Google Scholar] [CrossRef] [Green Version]
- Anandan, S.; Narasinga Rao, T.; Sathish, M.; Rangappa, D.; Honma, I.; Miyauchi, M. Superhydrophilic graphene-loaded TiO2 thin film for self-cleaning applications. ACS Appl. Mater. Interfaces 2013, 5, 207–212. [Google Scholar] [CrossRef]
- Wang, Z.; Espín, L.; Bates, F.S.; Kumar, S.; Macosko, C.W. Water droplet spreading and imbibition on superhydrophilic poly (butylene terephthalate) melt-blown fiber mats. Chem. Eng. Sci. 2016, 146, 104–114. [Google Scholar] [CrossRef] [Green Version]
- Leger, L.; Joanny, J. Liquid spreading. Rep. Prog. Phys. 1992, 55, 431. [Google Scholar] [CrossRef]
- De Coninck, J.; de Ruijter, M.J.; Voué, M. Dynamics of wetting. Curr. Opin. Colloid Interface Sci. 2001, 6, 49–53. [Google Scholar] [CrossRef]
- Zhu, Y.; Liu, J.; Hu, Y.; Yang, D.-Q.; Sacher, E. Dynamic behaviours and drying processes of water droplets impacting on superhydrophilic surfaces. Surf. Eng. 2021, 37, 1301–1307. [Google Scholar] [CrossRef]
- Courbin, L.; Bird, J.C.; Reyssat, M.; Stone, H. Dynamics of wetting: From inertial spreading to viscous imbibition. J. Phys. Condens. Matter 2009, 21, 464127. [Google Scholar] [CrossRef] [Green Version]
- De Ruijter, M.J.; De Coninck, J.; Oshanin, G. Droplet spreading: Partial wetting regime revisited. Langmuir 1999, 15, 2209–2216. [Google Scholar] [CrossRef] [Green Version]
- Kumar, G.; Prabhu, K.N. Review of non-reactive and reactive wetting of liquids on surfaces. Adv. Colloid Interface Sci. 2007, 133, 61–89. [Google Scholar] [CrossRef]
- Bonn, D.; Eggers, J.; Indekeu, J.; Meunier, J.; Rolley, E. Wetting and spreading. Rev. Mod. Phys. 2009, 81, 739. [Google Scholar] [CrossRef]
- Karim, A.M.; Fujii, K.; Kavehpour, H.P. Contact line dynamics of gravity driven spreading of liquids. Fluid Dyn. Res. 2021, 53, 035503. [Google Scholar] [CrossRef]
- Cazabat, A.; Gerdes, S.; Valignat, M.; Villette, S. Dynamics of wetting: From theory to experiment. Interface Sci. 1997, 5, 129–139. [Google Scholar] [CrossRef]
- Kim, S.J.; Moon, M.-W.; Lee, K.-R.; Lee, D.-Y.; Chang, Y.S.; Kim, H.-Y. Liquid spreading on superhydrophilic micropillar arrays. J. Fluid Mech. 2011, 680, 477–487. [Google Scholar] [CrossRef] [Green Version]
- Zorba, V.; Chen, X.; Mao, S.S. Superhydrophilic TiO2 surface without photocatalytic activation. Appl. Phys. Lett. 2010, 96, 093702. [Google Scholar] [CrossRef]
- Tanner, L. The spreading of silicone oil drops on horizontal surfaces. J. Phys. D Appl. Phys. 1979, 12, 1473. [Google Scholar] [CrossRef]
- Seveno, D.; Vaillant, A.; Rioboo, R.; Adao, H.; Conti, J.; De Coninck, J. Dynamics of wetting revisited. Langmuir 2009, 25, 13034–13044. [Google Scholar] [CrossRef]
- Bahners, T.; Prager, L.; Gutmann, J.S. Wetting dynamics on superhydrophilic surfaces prepared by photonic microfolding. Langmuir 2014, 30, 3127–3131. [Google Scholar] [CrossRef]
- Marmur, A. Equilibrium and spreading of liquids on solid surfaces. Adv. Colloid Interface Sci. 1983, 19, 75–102. [Google Scholar] [CrossRef]
- Levinson, P.; Cazabat, A.; Stuart, M.C.; Heslot, F.; Nicolet, S. The spreading of macroscopic droplets. Rev. Phys. Appl. 1988, 23, 1009–1016. [Google Scholar] [CrossRef]
- Weiss, P. Wetting, spreading and adhesion, J.F. Padday, ed., academic, London, 1978, 498 pp. Price: $48.90. J. Polym. Sci. Polym. Lett. Ed. 1979, 17, 463–464. [Google Scholar] [CrossRef]
- McHale, G.; Shirtcliffe, N.; Aqil, S.; Perry, C.; Newton, M. Topography driven spreading. Phys. Rev. Lett. 2004, 93, 036102. [Google Scholar] [CrossRef] [PubMed]
- Xu, L.; Fan, H.; Yang, C.; Huang, W.M. Contact line mobility in liquid droplet spreading on rough surface. J. Colloid Interface Sci. 2008, 323, 126–132. [Google Scholar] [CrossRef] [PubMed]
- Herminghaus, S. Wetting, spreading, and adsorption on randomly rough surfaces. Eur. Phys. J. E 2012, 35, 1–10. [Google Scholar] [CrossRef] [Green Version]
- Rosenholm, J.B. Liquid spreading on solid surfaces and penetration into porous matrices: Coated and uncoated papers. Adv. Colloid Interface Sci. 2015, 220, 8–53. [Google Scholar] [CrossRef]
- Quéré, D. Wetting and Roughness. Annu. Rev. Mater. Res. 2008, 38, 71–99. [Google Scholar] [CrossRef]
- De Castro, L.D.C.; Larocca, N.M.; Pessan, L.A. Towards the development of superhydrophilic SiO2-based nanoporous coatings: Concentration and particle size effect. Thin Solid Film. 2018, 651, 138–144. [Google Scholar] [CrossRef]
- Kong, T.F.; Shen, X.; Marcos; Yang, C. Lab-on-chip microfluidic impedance measurement for laminar flow ratio sensing and differential conductivity difference detection. Appl. Phys. Lett. 2017, 110, 233501. [Google Scholar] [CrossRef]
- Extrand, C.; Moon, S.I.; Hall, P.; Schmidt, D. Superwetting of structured surfaces. Langmuir 2007, 23, 8882–8890. [Google Scholar] [CrossRef]
- Turkoglu, S.; Zhang, J.; Dodiuk, H.; Kenig, S.; Ratto, J.A.; Mead, J. Wetting Characteristics of Nanosilica-Poly (acrylic acid) Transparent Anti-Fog Coatings. Polymers 2022, 14, 4663. [Google Scholar] [CrossRef]
- Blake, T.; De Coninck, J. The influence of solid–liquid interactions on dynamic wetting. Adv. Colloid Interface Sci. 2002, 96, 21–36. [Google Scholar] [CrossRef] [PubMed]
- Modaressi, H.; Garnier, G. Mechanism of wetting and absorption of water droplets on sized paper: Effects of chemical and physical heterogeneity. Langmuir 2002, 18, 642–649. [Google Scholar] [CrossRef]
- Garnier, G.; Bertin, M.; Smrckova, M. Wetting dynamics of alkyl ketene dimer on cellulosic model surfaces. Langmuir 1999, 15, 7863–7869. [Google Scholar] [CrossRef]
- Hupfeld, T.; Laurens, G.; Merabia, S.; Barcikowski, S.; Gökce, B.; Amans, D. Dynamics of laser-induced cavitation bubbles at a solid–liquid interface in high viscosity and high capillary number regimes. J. Appl. Phys. 2020, 127, 044306. [Google Scholar] [CrossRef]
- Camenzind, A.; Schweizer, T.; Sztucki, M.; Pratsinis, S.E. Structure & strength of silica-PDMS nanocomposites. Polymer 2010, 51, 1796–1804. [Google Scholar]
- Olhero, S.; Ferreira, J. Influence of particle size distribution on rheology and particle packing of silica-based suspensions. Powder Technol. 2004, 139, 69–75. [Google Scholar] [CrossRef]
- Sebastian, D.; Yao, C.-W.; Lian, I. Abrasion resistance of superhydrophobic coatings on aluminum using PDMS/SiO2. Coatings 2018, 8, 414. [Google Scholar] [CrossRef] [Green Version]
- Piscitelli, F.; Chiariello, A.; Dabkowski, D.; Corraro, G.; Marra, F.; Di Palma, L. Superhydrophobic coatings as anti-icing systems for small aircraft. Aerospace 2020, 7, 2. [Google Scholar] [CrossRef] [Green Version]
- Wiącek, A.E. Changes in wetting properties of silica surface treated with DPPC in the presence of phospholipase A2 enzyme. Appl. Surf. Sci. 2010, 256, 7672–7677. [Google Scholar] [CrossRef]
- Wang, Y.; Hansen, C.J.; Wu, C.-C.; Robinette, E.J.; Peterson, A.M. Effect of surface wettability on the interfacial adhesion of a thermosetting elastomer on glass. RSC Adv. 2021, 11, 31142–31151. [Google Scholar] [CrossRef]
- Joung, Y.-H.; Choi, W.S.; Shin, Y.; Lee, M.; Kim, H.; Song, W. Characterization of a novel super-hydrophilic coating film as a function of different spin coating speeds. J. Korean Phys. Soc. 2013, 63, 246–250. [Google Scholar] [CrossRef]
- Milionis, A.; Loth, E.; Bayer, I.S. Recent advances in the mechanical durability of superhydrophobic materials. Adv. Colloid Interface Sci. 2016, 229, 57–79. [Google Scholar] [CrossRef] [PubMed]


| Sample Set | % wt. of Silica in Dry Coating | % vol. of Silica in Dry Coating | Particle to Binder (PB) Ratio | % wt. of Silica in Suspension |
|---|---|---|---|---|
| SS 0.5 | 95 | 91 | 19:1 | 0.5 |
| SS 1.6 | 95 | 91 | 19:1 | 1.6 |
| SS 3.2 | 95 | 91 | 19:1 | 3.2 |
| Sample Set | % wt. of Silica in Suspension | Power Law Index |
|---|---|---|
| SS 0.5 | 0.5 | 0.051 |
| SS 1.6 | 1.6 | 0.050 |
| SS 3.2 | 3.2 | 0.045 |
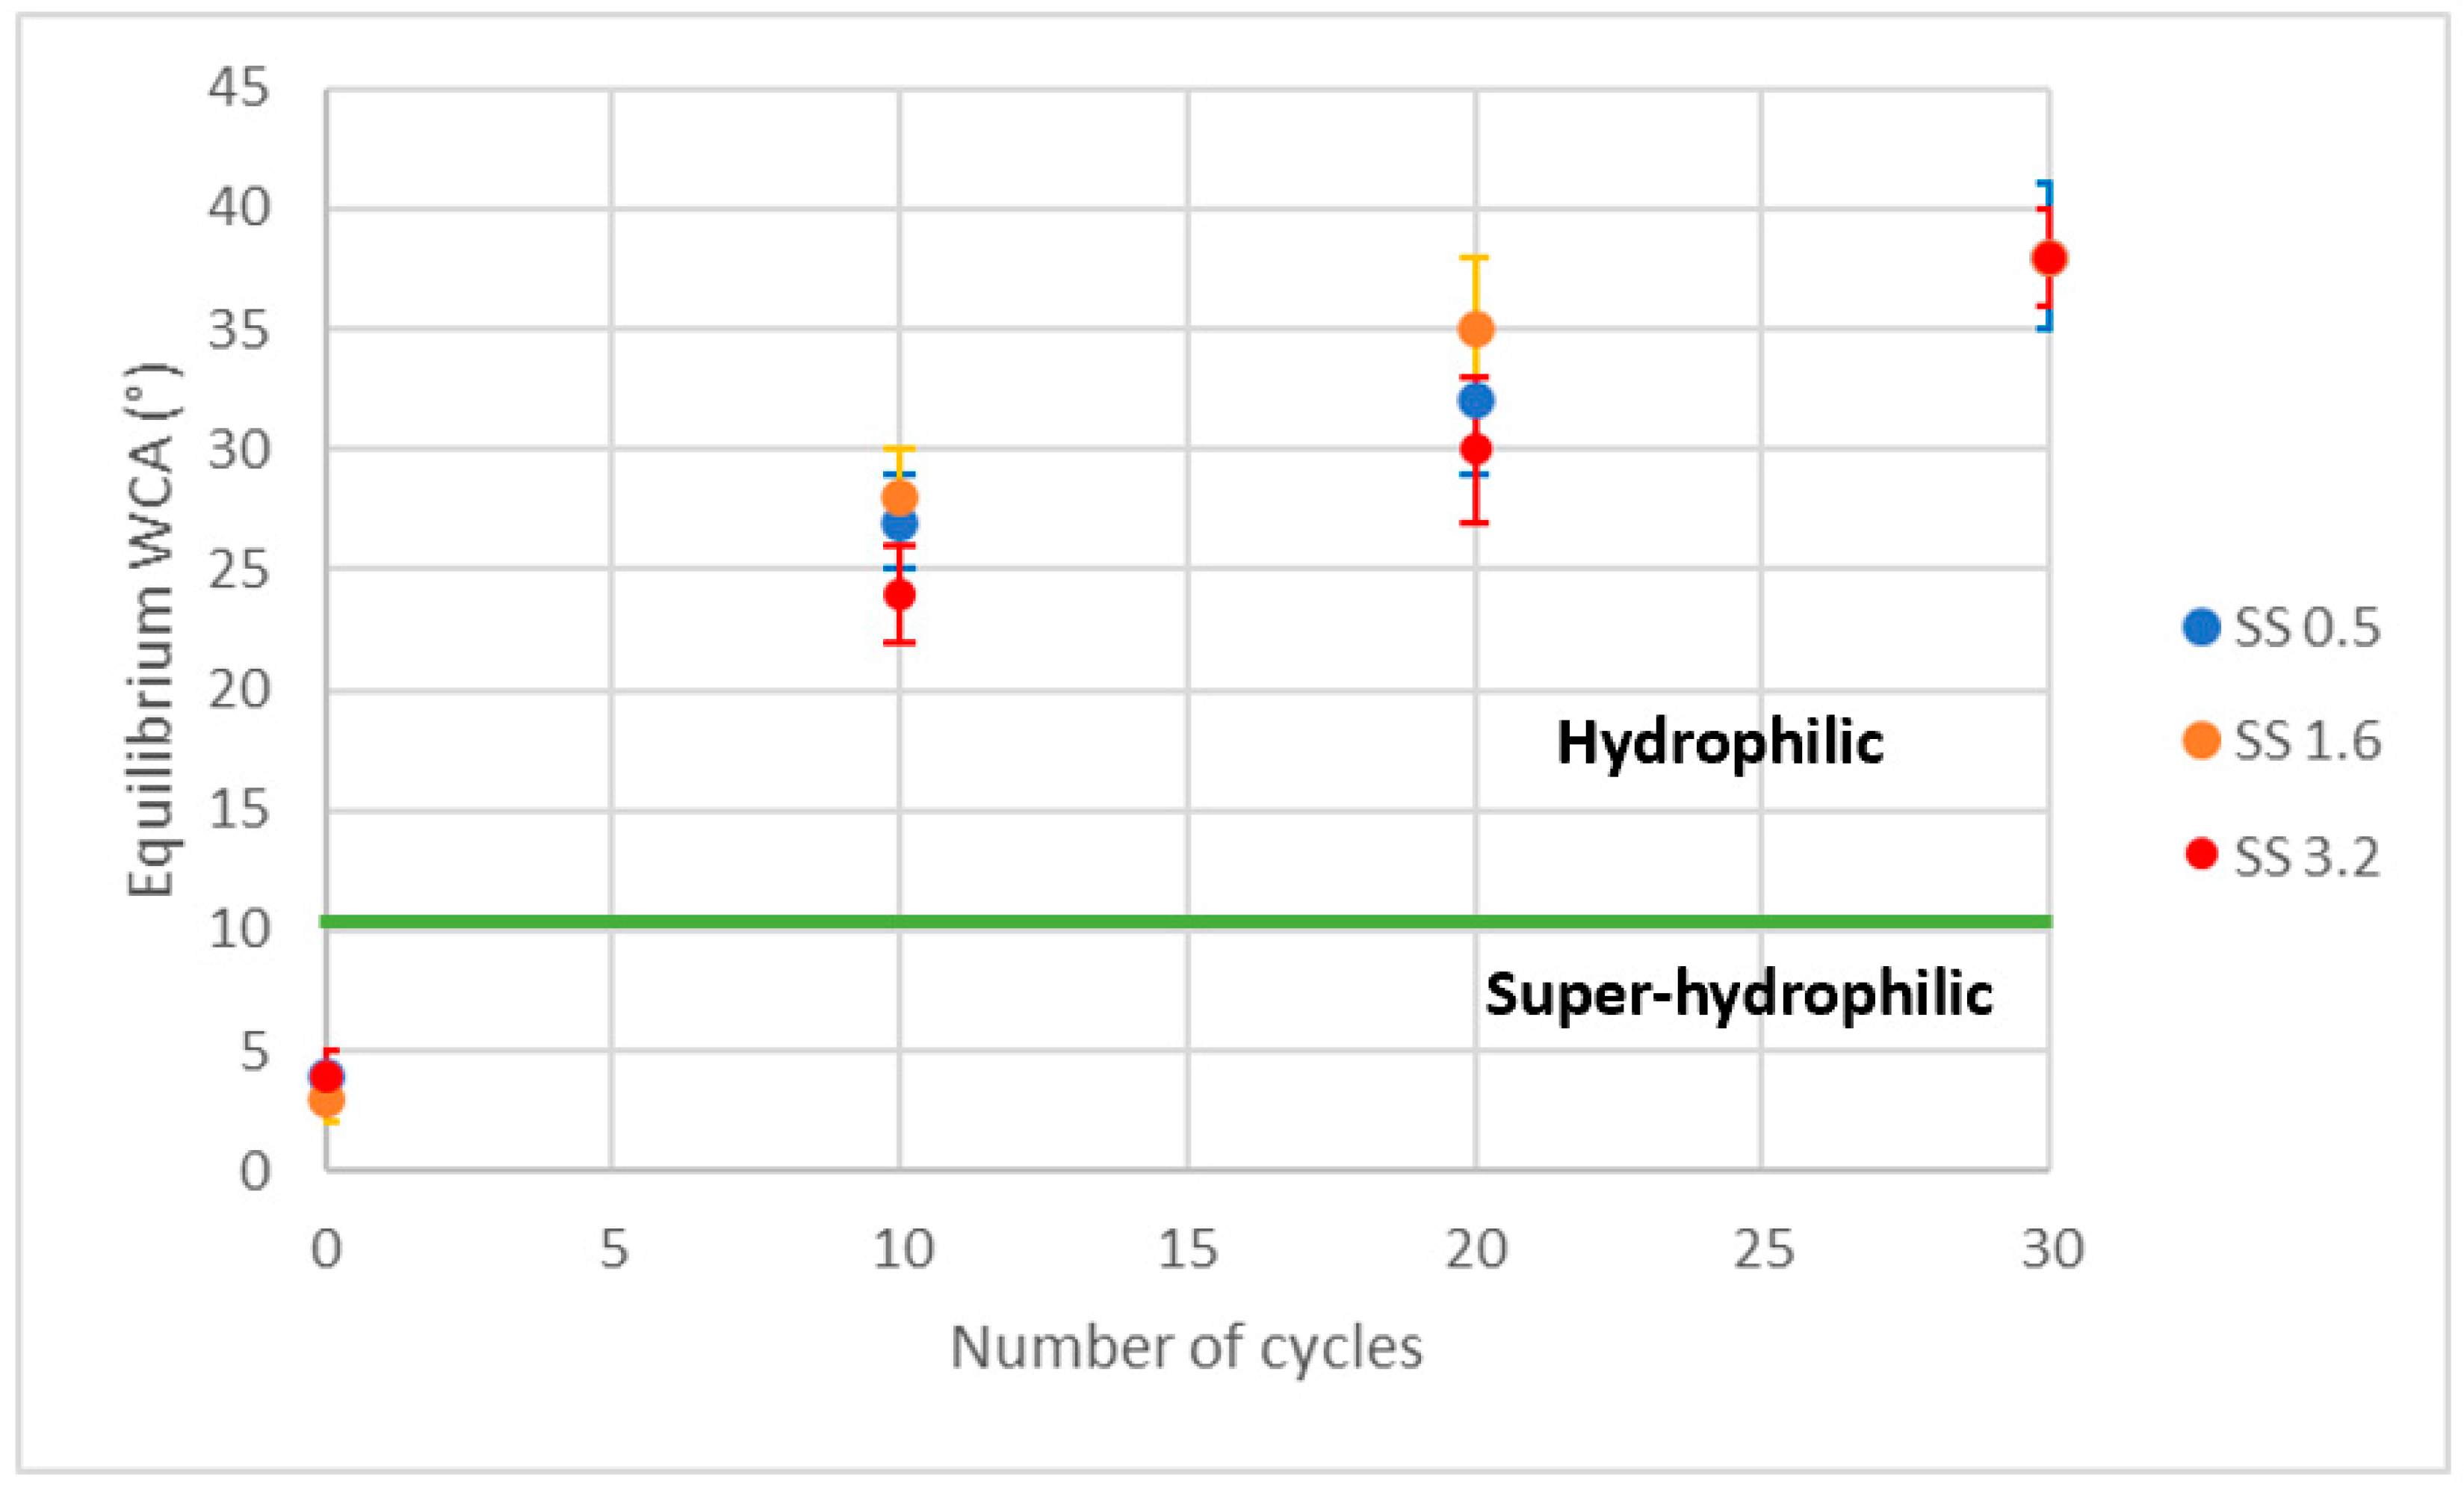
| % wt. of Silica in Suspension | 0.5 | 1.6 | 3.2 |
|---|---|---|---|
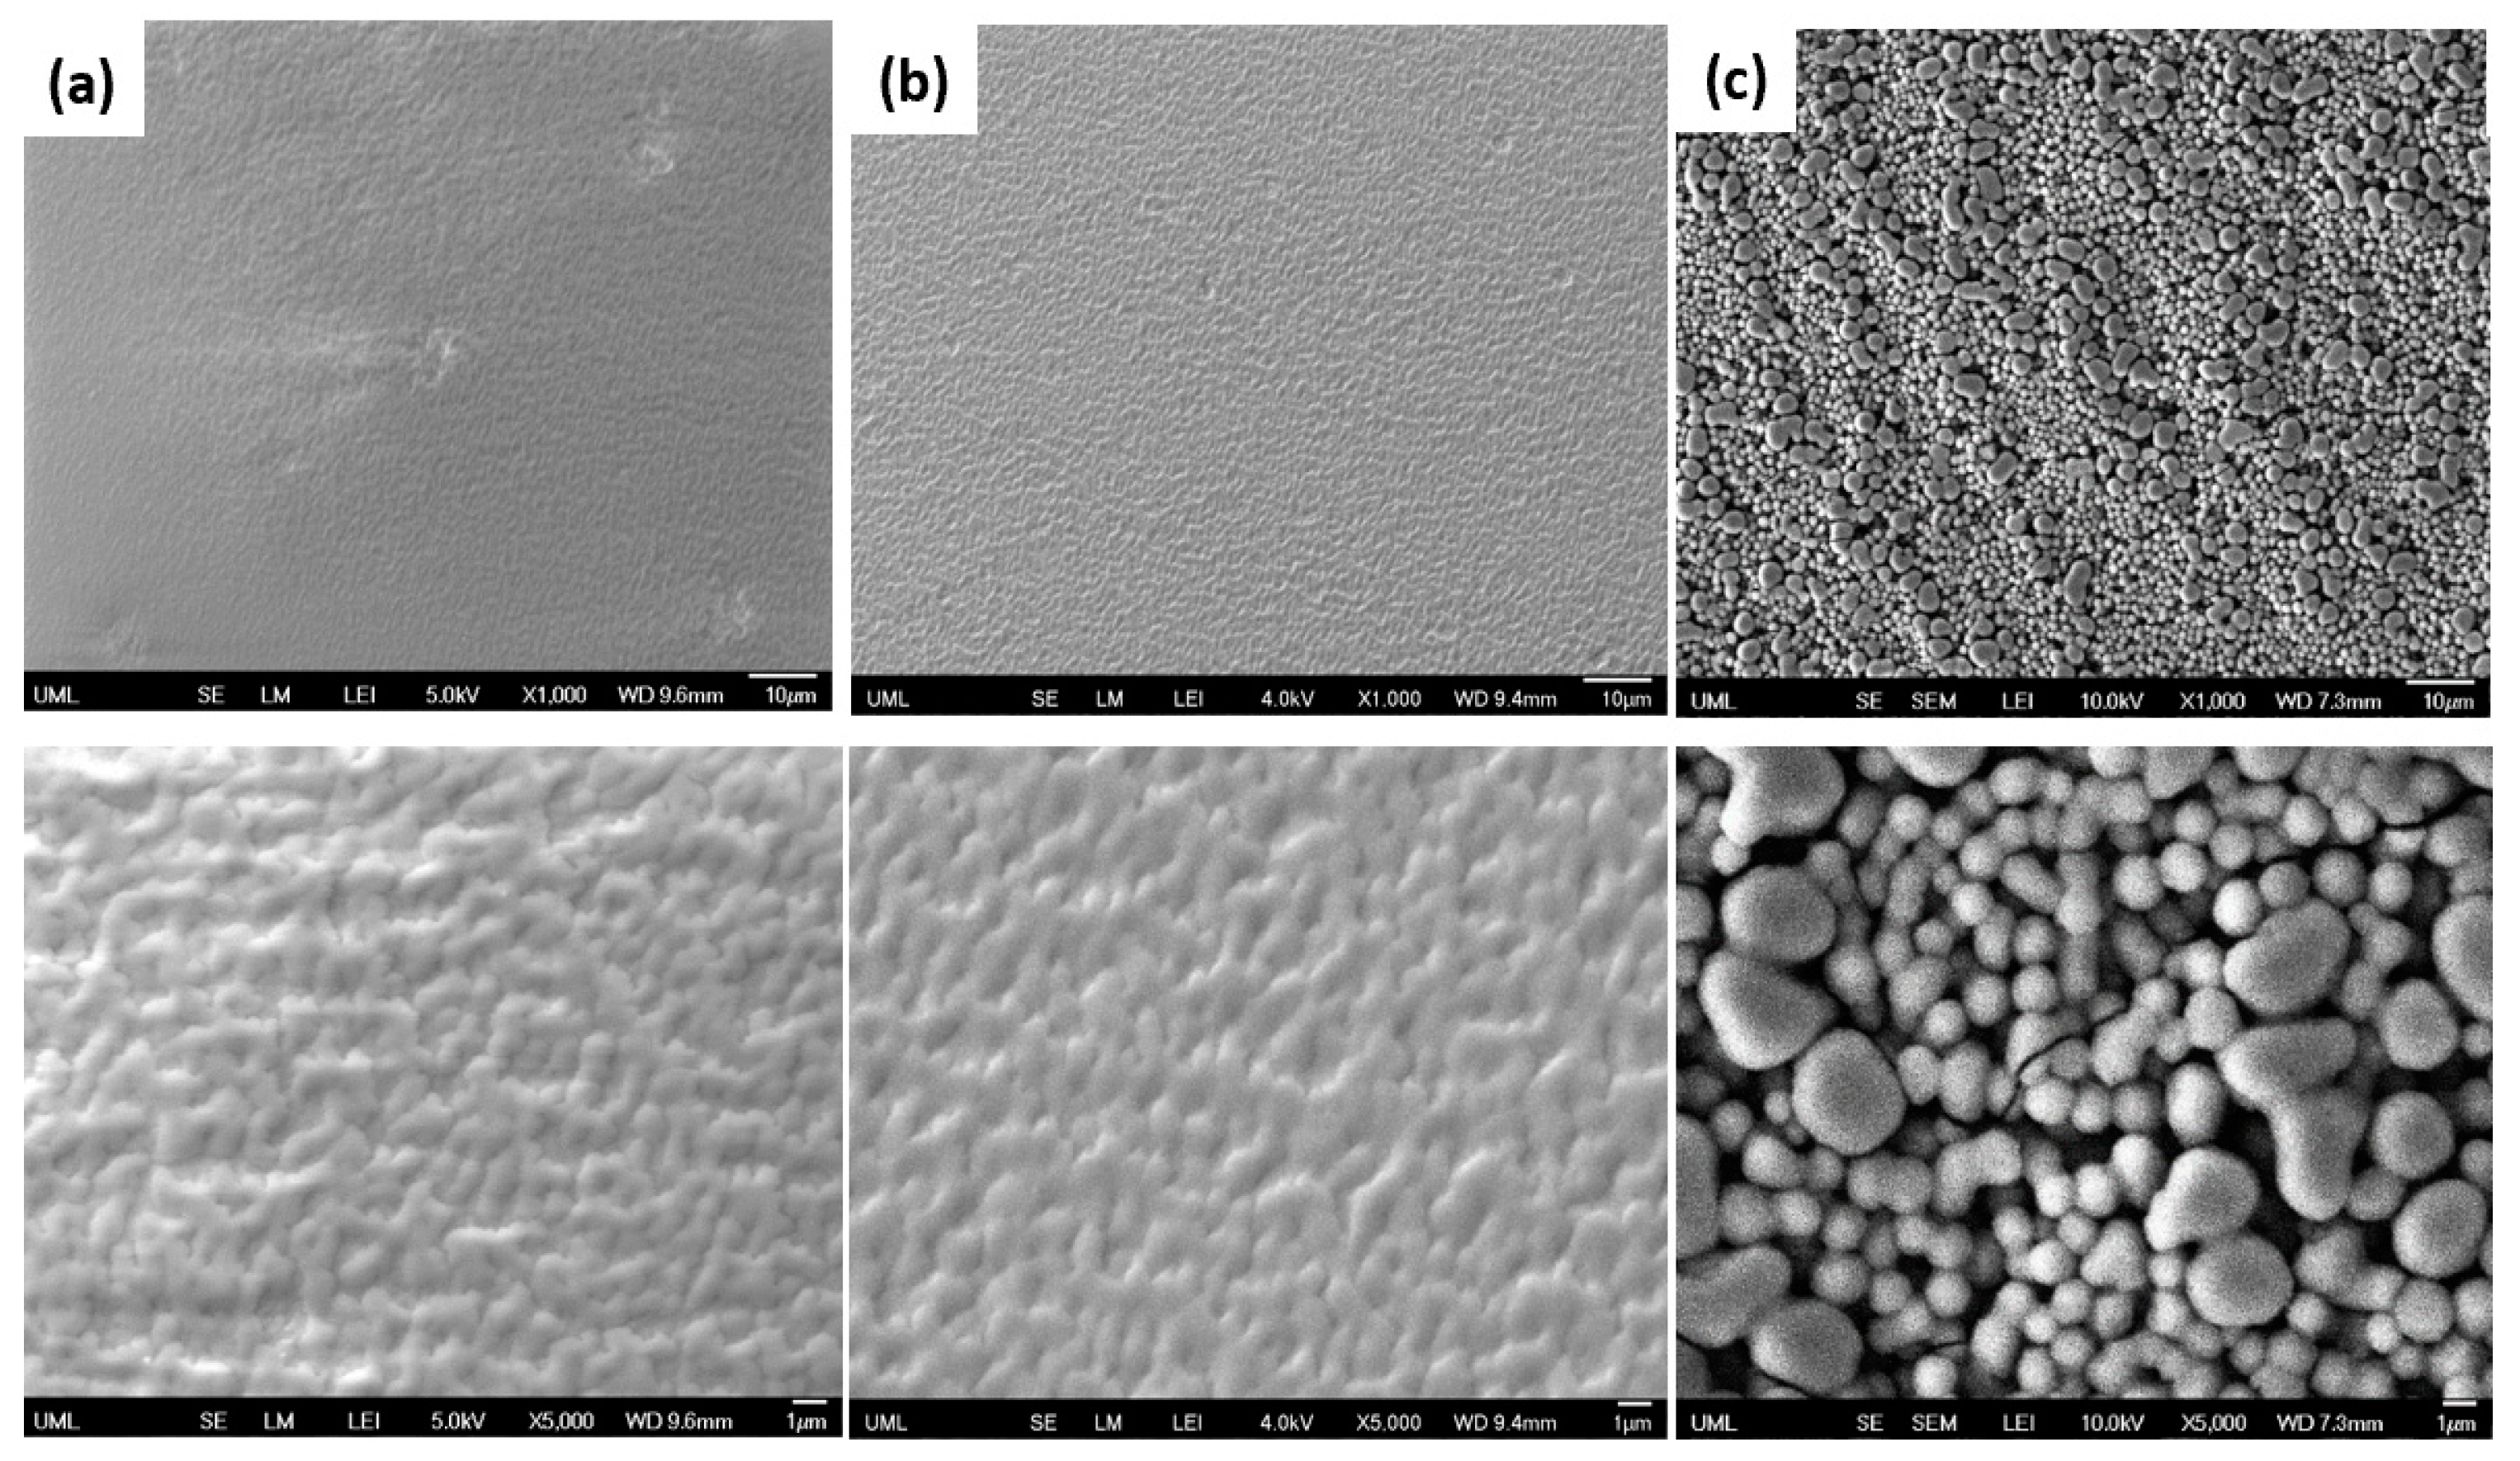
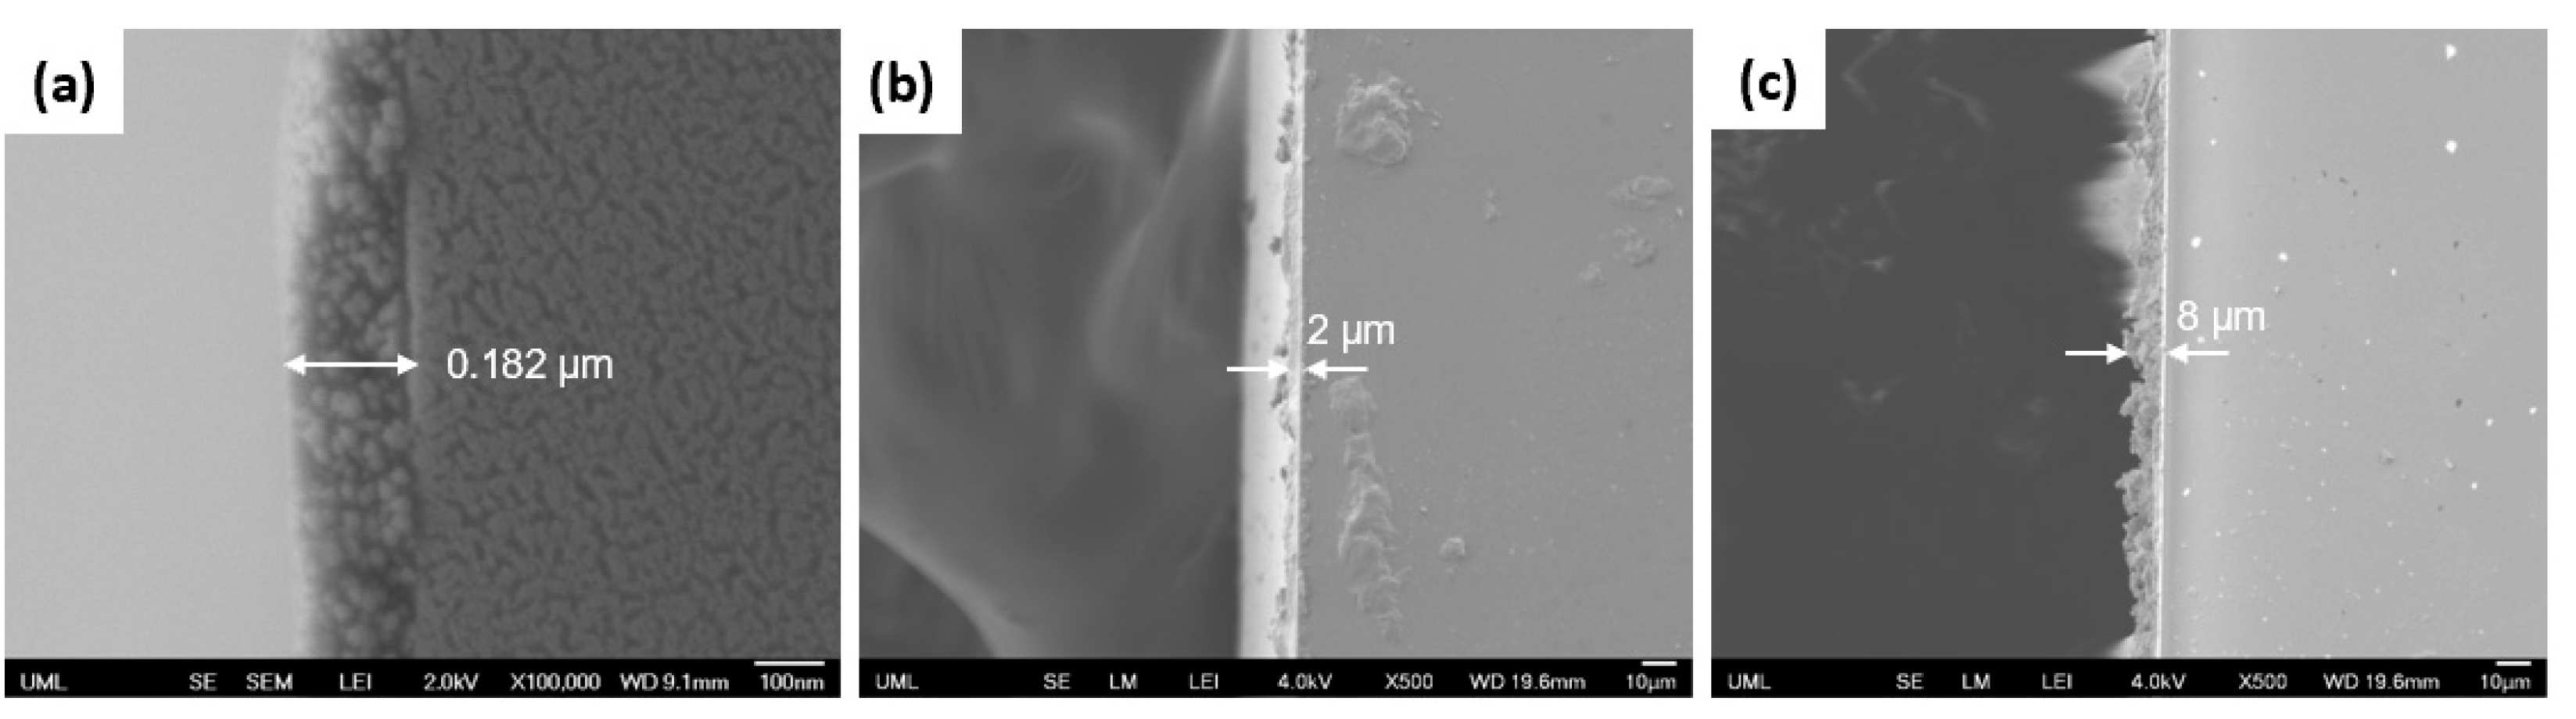
| Asperity size (μm) | 0.60 ± 0.18 | 1.16 ± 0.17 | 1.69 ± 0.86 |
| % wt. of Silica in Suspension | Roughness Factor (r) | (nm) | (nm) |
|---|---|---|---|
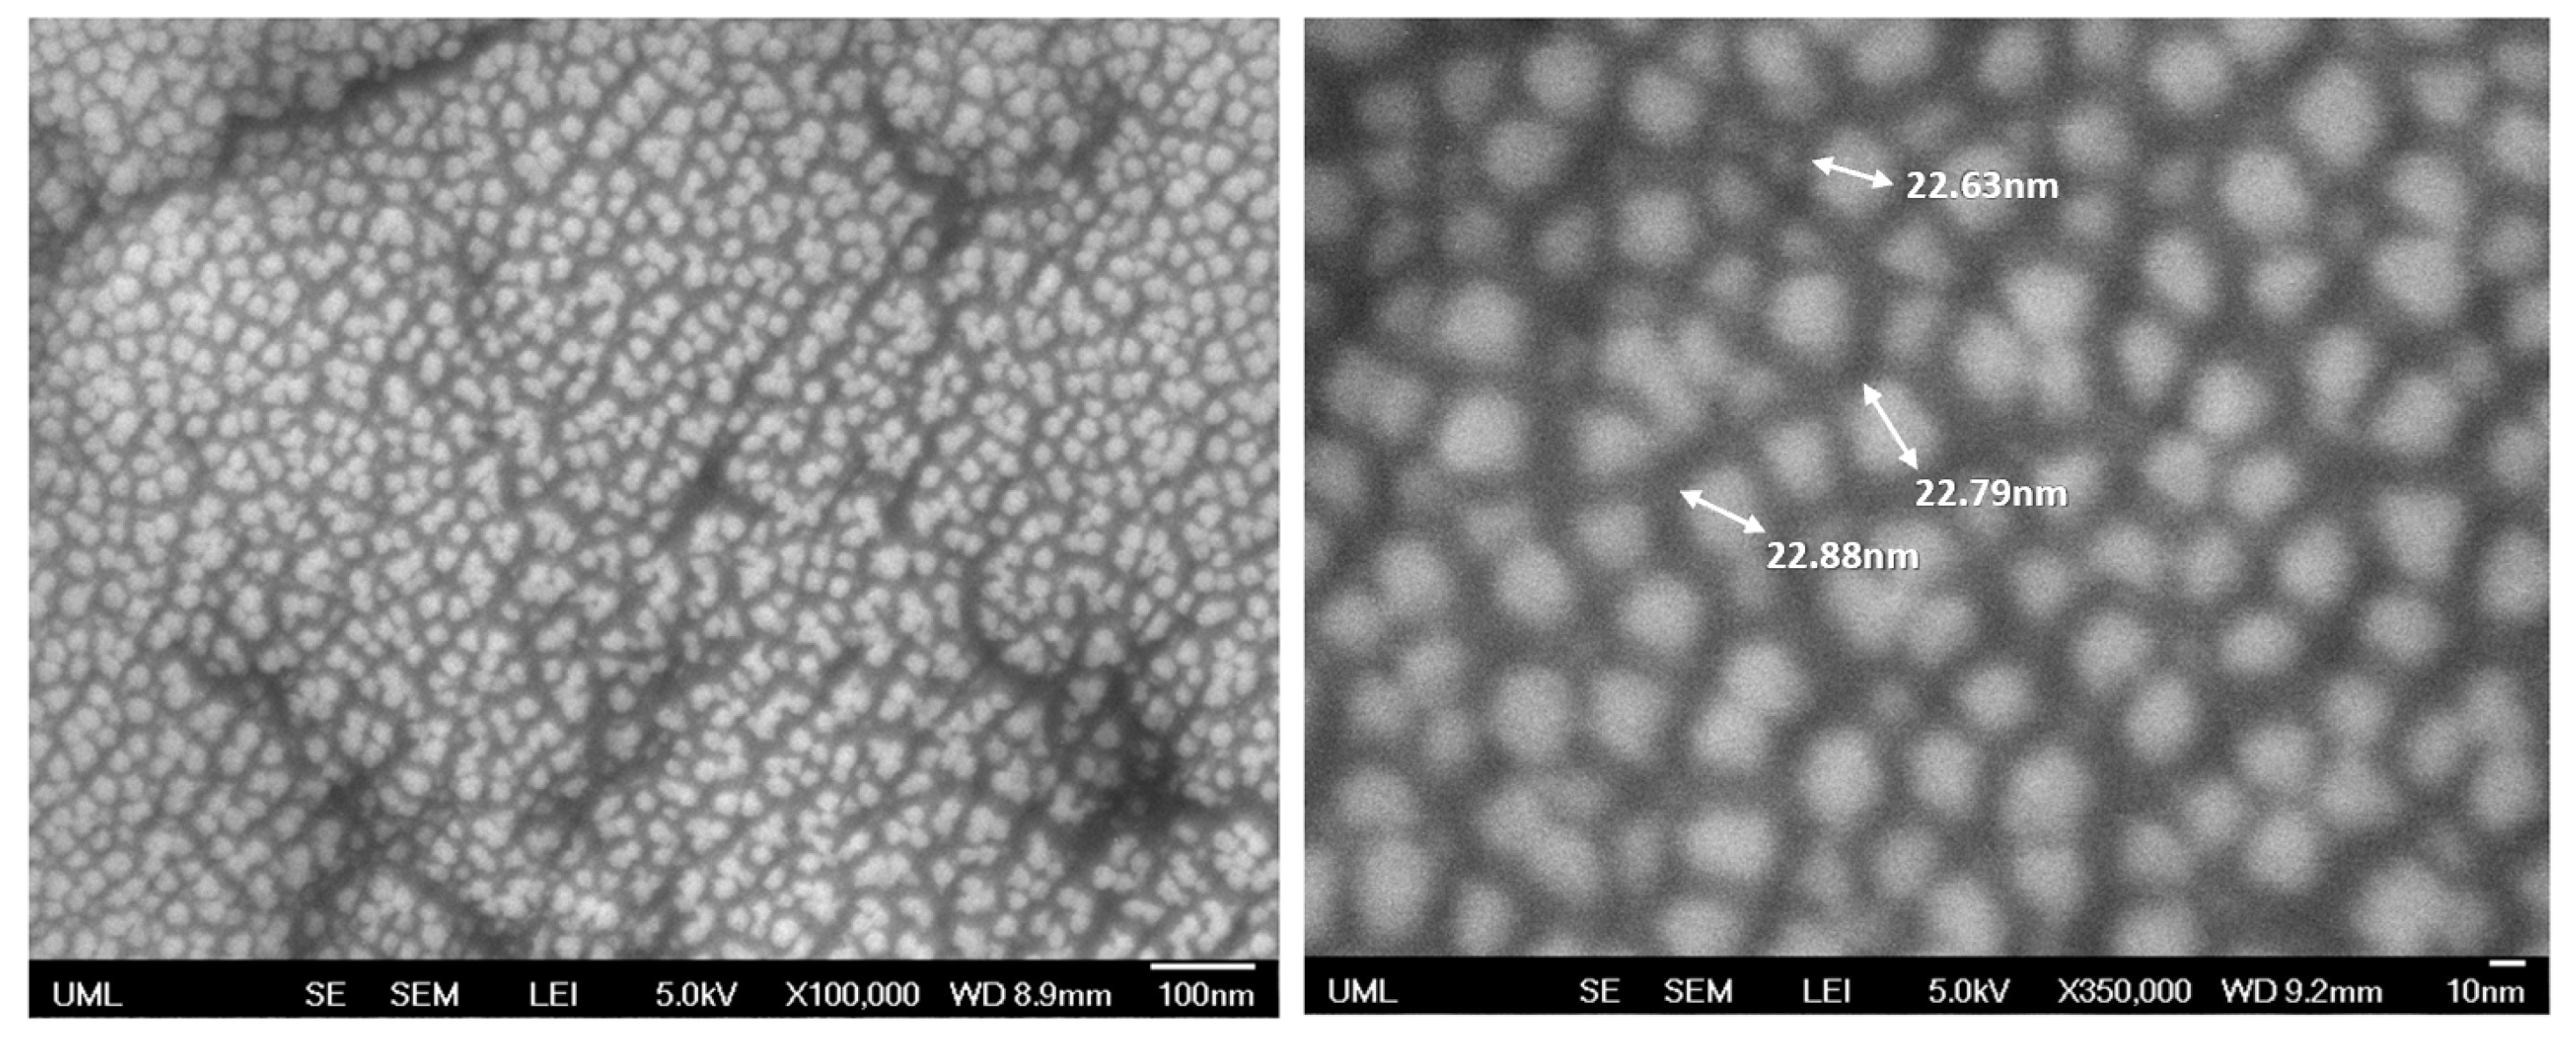
| 0.5 | 1.03 | 48 ± 5 | 58 ± 3 |
| 1.6 | 1.21 | 223 ± 2 | 169 ± 2 |
| 3.2 | 1.24 | 244 ± 5 | 189± 4 |
| Sample Set | Adhesion |
|---|---|
| SS 0.5 | 4B-3B |
| SS 1.6 | 4B-3B |
| SS 3.2 | 4B-3B |
Disclaimer/Publisher’s Note: The statements, opinions and data contained in all publications are solely those of the individual author(s) and contributor(s) and not of MDPI and/or the editor(s). MDPI and/or the editor(s) disclaim responsibility for any injury to people or property resulting from any ideas, methods, instructions or products referred to in the content. |
© 2023 by the authors. Licensee MDPI, Basel, Switzerland. This article is an open access article distributed under the terms and conditions of the Creative Commons Attribution (CC BY) license (https://creativecommons.org/licenses/by/4.0/).
Share and Cite
Turkoglu, S.; Zhang, J.; Dodiuk, H.; Kenig, S.; Ratto, J.A.; Mead, J. Dynamic Wetting Properties of Silica-Poly (Acrylic Acid) Superhydrophilic Coatings. Polymers 2023, 15, 1242. https://doi.org/10.3390/polym15051242
Turkoglu S, Zhang J, Dodiuk H, Kenig S, Ratto JA, Mead J. Dynamic Wetting Properties of Silica-Poly (Acrylic Acid) Superhydrophilic Coatings. Polymers. 2023; 15(5):1242. https://doi.org/10.3390/polym15051242
Chicago/Turabian StyleTurkoglu, Sevil, Jinde Zhang, Hanna Dodiuk, Samuel Kenig, Jo Ann Ratto, and Joey Mead. 2023. "Dynamic Wetting Properties of Silica-Poly (Acrylic Acid) Superhydrophilic Coatings" Polymers 15, no. 5: 1242. https://doi.org/10.3390/polym15051242