Article

Applicability of Information Theory to the Quantification of Responses to Anthropogenic Noise by Southeast Alaskan Humpback Whales

1
SETI Institute, Center for the Study of Life in the Universe, 515 N. Whisman Road, Mountain View, CA 94043, USA
2
Population Health and Reproduction, School of Veterinary Medicine, UC Davis, One Shields Avenue, Davis, CA 95616, USA
3
Ecology Graduate Group, University of California, Davis, CA 95616, USA
4
Department of Astrophysical Sciences, 122 Peyton Hall, Princeton University Princeton, NJ, 08544, USA
5
SRI Consulting, 4300 Bohannon Drive, Suite 200, Menlo Park, CA 94025, USA
*
Author to whom correspondence should be addressed.
Entropy 2008, 10(2), 33-46; https://doi.org/10.3390/entropy-e10020033
Submission received: 28 November 2007 / Revised: 21 April 2008 / Accepted: 21 April 2008 / Published: 14 May 2008

Abstract

:
We assess the effectiveness of applying information theory to the characterization and quantification of the affects of anthropogenic vessel noise on humpback whale (Megaptera novaeangliae) vocal behavior in and around Glacier Bay, Alaska. Vessel noise has the potential to interfere with the complex vocal behavior of these humpback whales which could have direct consequences on their feeding behavior and thus ultimately on their health and reproduction. Humpback whale feeding calls recorded during conditions of high vessel-generated noise and lower levels of background noise are compared for differences in acoustic structure, use, and organization using information theoretic measures. We apply information theory in a self-referential manner (i.e., orders of entropy) to quantify the changes in signaling behavior. We then compare this with the reduction in channel capacity due to noise in Glacier Bay itself treating it as a (Gaussian) noisy channel. We find that high vessel noise is associated with an increase in the rate and repetitiveness of sequential use of feeding call types in our averaged sample of humpback whale vocalizations, indicating that vessel noise may be modifying the patterns of use of feeding calls by the endangered humpback whales in Southeast Alaska. The information theoretic approach suggested herein can make a reliable quantitative measure of such relationships and may also be adapted for wider application to many species where environmental noise is thought to be a problem.
MSC2000 Codes:
94A17 - Measures of information, entropy; 92D50 - Animal behavior
PACS Codes:
89.70.Cf - Entropy and other measures of information; 43.80.Nd - Effects of noise on animals and associated behavior, protective mechanisms; 43.50.Rq - Environmental noise, measurement, analysis, statistical characteristics

1. Introduction

The effect of anthropogenic activities on wildlife health and reproduction has gained increasing attention in recent years [1]. Studies of this kind are important because as greater numbers of humans pervade an increasing variety and number of habitats, the effects of human behavior and its associated technology on wildlife, particularly endangered and threatened species, will need to be systematically assessed. Some effects can be quite apparent such as those that directly influence wildlife health and reproduction. Other effects, however, may be subtler, indirectly affecting population dynamics by interfering with the ability of individuals within populations to effectively forage, communicate or socialize.
Endangered humpback whales (Megaptera novaeangliae) feed during spring through fall in southeastern Alaska. Previous research indicates that some whales move away from preferred feeding areas when disturbed by vessels [2, 3]. Repeated disturbances could be detrimental to Alaskan humpbacks, which must feed during the summer months to sustain them throughout their 3000-mile migration to and from their winter breeding grounds in the Hawaiian Islands. Little is known, however, about the specific effects of vessel noise on humpback whale vocal communication in Alaskan waters. Vessel noise has the potential to interfere with the complex vocal behavior of humpback whales, and thus could indirectly affect their population dynamics. Humpbacks produce a wide variety of vocalizations in many social contexts, which include the famous mating “songs” in their winter breeding grounds [4,5,6,7,8,9,10] as well as specialized “feeding calls” in their summer feeding grounds [11,12,13,14] that could serve as long-range assembly calls [2], likely coordinates group-feeding behavior and/or manipulate their prey (small schooling fish, [32]). Singing humpbacks are also known to modify their vocal behavior as a direct consequence of the vocal behavior of other humpbacks [5, 8, 15], most readily evidenced in the convergence of song acoustic structure among populations of males across each breeding season. Thus anthropogenic interference with vocal communication among these social whales could have direct consequences on their feeding behavior as well as other social behaviors and thus ultimately on their health and reproduction.
Animals have the potential to modify their vocalizations in response to noise in two important ways: (1) the acoustic structure (including frequency shifts) of their calls and (2) the use of their calls (including repetition). For the former strategy, humpback whales could modify their vocalizations by changing the amplitude or duration [16,17,18] or by increasing the spectral frequency of their calls beyond the range of noise in their environment [19, 20]. For the latter strategy, humpback whales could increase their overall rate of calling (repetition rate) and/or increase the repetitiveness of call usage in individual sequences or bouts of calls. The information rate of repetitive call usage can be quantitatively measured using an “entropic orders” application [21,22,23], one of the tools developed from information theory [24], which was initially designed to efficiently encode information for transfer across telephone lines. The equations for the information entropy applied in this self-referential way (i.e., an “auto-correlation” approach [23]) are given in Equations 1 through 4. The zero-order entropy is:
H 0 = log 2 N
where N is the number of different signal types. The first-order entropy is:
H 1 = i N p ( i ) log 2 p ( i )
where p ( i ) is the probability of occurrence of signal i (approximated by the frequency of occurrence of i signals divided by the total number of signals). If the probability is completely random (i.e., a uniform distribution) then p ( i ) = 1 / N and then H 1 = H 0 . The second-order entropy is given by:
H 2 = i , j N p ( i ) p i ( j ) log 2 p i ( j )
where pi(j) is the conditional probability, (i.e. the dependence of the second signal j’s frequency of occurrence (approximating the probability) given the preceding signal i has occurred). If the two events are completely independent, than p ( i ) p i ( j ) = p ( i ) p ( j ) and it can be shown that then H 2 = H 1 . Similarly, the nth-order information entropy is:
H n = i , j , k , ... n N p ( i , j , k , ... , n 1 ) p i , j , k , ... n 1 ( n ) log 2 p i , j , k , ... n 1 ( n )
where n is the largest string size of grouped signals (i.e., an n -1 length Markov chain), and N is the total number of signals in that data set. As before, when H n H n 1 then H n is the highest order approximation of the information entropy required to sufficiently characterize that communication system (in most normal communication systems).
A zero-order entropy (i.e., the zero-order approximation to the Shannon entropy) measures the number of bits that comprise a particular repertoire of signals, representing the diversity of a repertoire. The first-order (approximation to the) entropy measures any decrease in the number of bits in the communication system by taking into account the relative frequency of use of calls in a repertoire. The second-order (approximation to the) entropy measures the decrease in number of bits in the overall entropy of the signaling system by taking into account the amount of dependency (conditional probabilities) that exists between any two call types (i.e., di-gram structure in human languages) within sequences of calls in a repertoire. Any decrease in the entropy of a signaling system is measurable at the nth-order structural level using the nth-order approximation to the entropy, where n is an integer [21,22,23,24,25]. Repetitiveness (and other additional n-gram structure) in call usage is evident if entropic values substantially drop with increasing order, thereby producing a higher negative slope when entropic values are regressed against their orders (the “entropic slope”; see [21, 23]). Decreasing entropy with higher order is a direct quantification, then, of less “freedom of choice” (conditional probabilistic independence) of signals from each other. Such increasing signal dependence assures increased error recovery of signals as well [26].
To quantify how humpback whales may modify their vocal behavior in response to noise, we used recordings collected by Glacier Bay National Park Service biologists over the past 10 years on humpback whale vocalizations and associated noise from Glacier Bay and Icy Strait. We examined, using these quantitative techniques, the acoustic structure and patterns of use [27, 21, 22, 28, 29] of humpback whale feeding calls from various locations, each subjected to appreciable levels of intermittent vessel noise. We then computed the information transmission rate decrease with increased noise—treating Glacier Bay itself as a noisy channel (and assuming that the vessel noise is Gaussian)—in order to then compare this decrease in channel capacity with our measured decrease in humpback whale information transmission rates as measured for the zero, first, and second-order entropies during both low background noise and high vessel noise. (We were limited to the second-order entropy due to our limited sample size; e.g., [21]).

2. Materials and Methods for Humpback Whale Signal Collection

Over 50 hours of vocal recordings across 5 years of study of about 100 humpback whales were collected from individuals inhabiting Glacier Bay and Icy Strait by Glacier Bay National Park and Preserve biologists. Humpback whale sounds were opportunistically recorded on Sony analog or digital audiocassette recorders (flat frequency response from 20 Hz to 20 kHz and 20 Hz to 22 kHz ± 1 dB, respectively) during population monitoring surveys. The hydrophones used had a flat response from 20 Hz to 20 kHz. Photographs of individually identified whales usually accompanied each observation, as did field notes describing the recording conditions. Recording sessions typically lasted 20-60 minutes and were only made when the recording vessel was within 50 to 150 m of the whales, with a hydrophone at a depth of 9 to 18 m. These vocal recordings were later digitized onto minidisks and then to a laptop computer using Cool Edit Pro software (sampling rate: 44.1 kHz).
Acoustic files were filtered for background noise using standard parametric filtering in Cool Edit Pro software and calls identified as “feeding calls” were cued for subsequent digital analysis (total number of calls = 296, total number of pods = 7, and total years recorded = 5 years from 1991 to 1996). Figure 1A shows a representative spectrogram of a typical feeding call sequence. Feeding calls are stereotypical and rhythmic and may contain both individual signature information and acoustic features that maximize a herding effect on prey [11, 13]. The feeding calls were analyzed by digitally extracting 60 sequential frequency, time, and amplitude measurements across the duration of each call in a calling bout (sampling rate: 44.1 kHz; 1024-point FFT with a Hamming filter) using Cool Edit Pro software and customized Macro Express macros [27, 29]. A calling bout or sequence was defined by feeding calls that occurred within 5 seconds of each other. Calling bouts were typically punctuated by silences of 90 seconds before the next bout began and it was unknown whether the call sequences produced were from a single whale or multiple whales. The number of 60 measurements was chosen to represent each call sufficiently to capture any acoustic differences in calls between noise conditions. After call digitization, analysis and measurement were completed, several subsequent calculations were conducted. Summary acoustic variables defining various call spectral, temporal, and amplitude parameters (e.g., minimum frequency, maximum frequency, mean frequency, frequency range, max/min frequency, mean/min frequency, duration, inter-signal interval, peak amplitude, frequency and location of the peak amplitude, start slope, middle slope, end slope, coefficient of frequency modulation, jitter factor, and frequency variability index, (as defined in [28])) were calculated from these measurements. These parameters were analyzed with respect to noise condition (‘high vessel noise’ vs. ‘low background noise’). In addition, k-means cluster analysis was conducted on these acoustic parameters to classify feeding calls into discrete types, as shown in Figure 1B [27]. Classification of feeding calls into types was conducted solely to use information theory to assess any changes in call repetitiveness under conditions of noise in comparison to control conditions (no noise). Therefore we are not suggesting that feeding call types as classified in this study necessarily have any social meaning to the whales (in the same way that human language phoenems do not, in general, represent actual words). Quantitative analyses were also conducted on the spectral and amplitudinal features of noise for comparison to the acoustic structure and use of humpback feeding calls on a random subset of 30 minutes of noise for each noise condition to generate a spectral profile of each noise condition (profile generated in Cool Edit Pro). Figure 1C shows representative spectrograms and spectral profiles for noise conditions recorded at the same time as the humpback whale feeding calls—in between bouts. High vessel noise conditions were defined as the presence of vessel noise greater than 90 dB re: 1 μPa (distance from the noise source varied from 50 m to 1000 m) on the recorded tape (Figure 1C). Noise level was measured at the hydrophone and not at the whale, but still serves as an index for the whale’s noise exposure at the time the recording was made. Distance to noise source was estimated visually (siting passing vessles). Mixed effects linear regression was conducted with 21 summary acoustic parameters as outcomes, noise condition as the dependent variable, and “year” and “pod ID” within “year” as a nested random effect or repeated measure. “Pod ID” was included to account for any acoustic variation due to pod differences in acoustic behavior, and “year” to account for any variation due to time between recordings. In addition, Shannon entropies were calculated [21,22,23] on the usage of feeding call types within sequences classified by noise conditions. Monte Carlo simulated probabilities (iterations = 1000, using “@RISK” [23]) were generated from the usage of call types within sequences from high vessel noise and low background noise conditions to determine whether the differences found in the original data set, with respect to noise conditions, could be considered significantly different using a two-sample heteroscedastic t-test [30, 23].
Figure 1. (A) Spectrogram of a bout or sequence of feeding calls, (B) representative spectrograms of six of the seven statistically discrete feeding call types; and (C) representative spectrograms and spectral profiles of noise under high vessel noise and low noise conditions. Spectral profiles were generated in Cool Edit Pro software from randomly selected subsets for a total of 30 minutes of noise from each condition. All fundamental frequencies are under or near 516 Hz where the the high noise is above 90dB. Harmonics would therefore also be masked by high noise above about 800 Hz. Note: measurements were not calibrated for equipment sensitivity.
Entropy 10 00033 g001

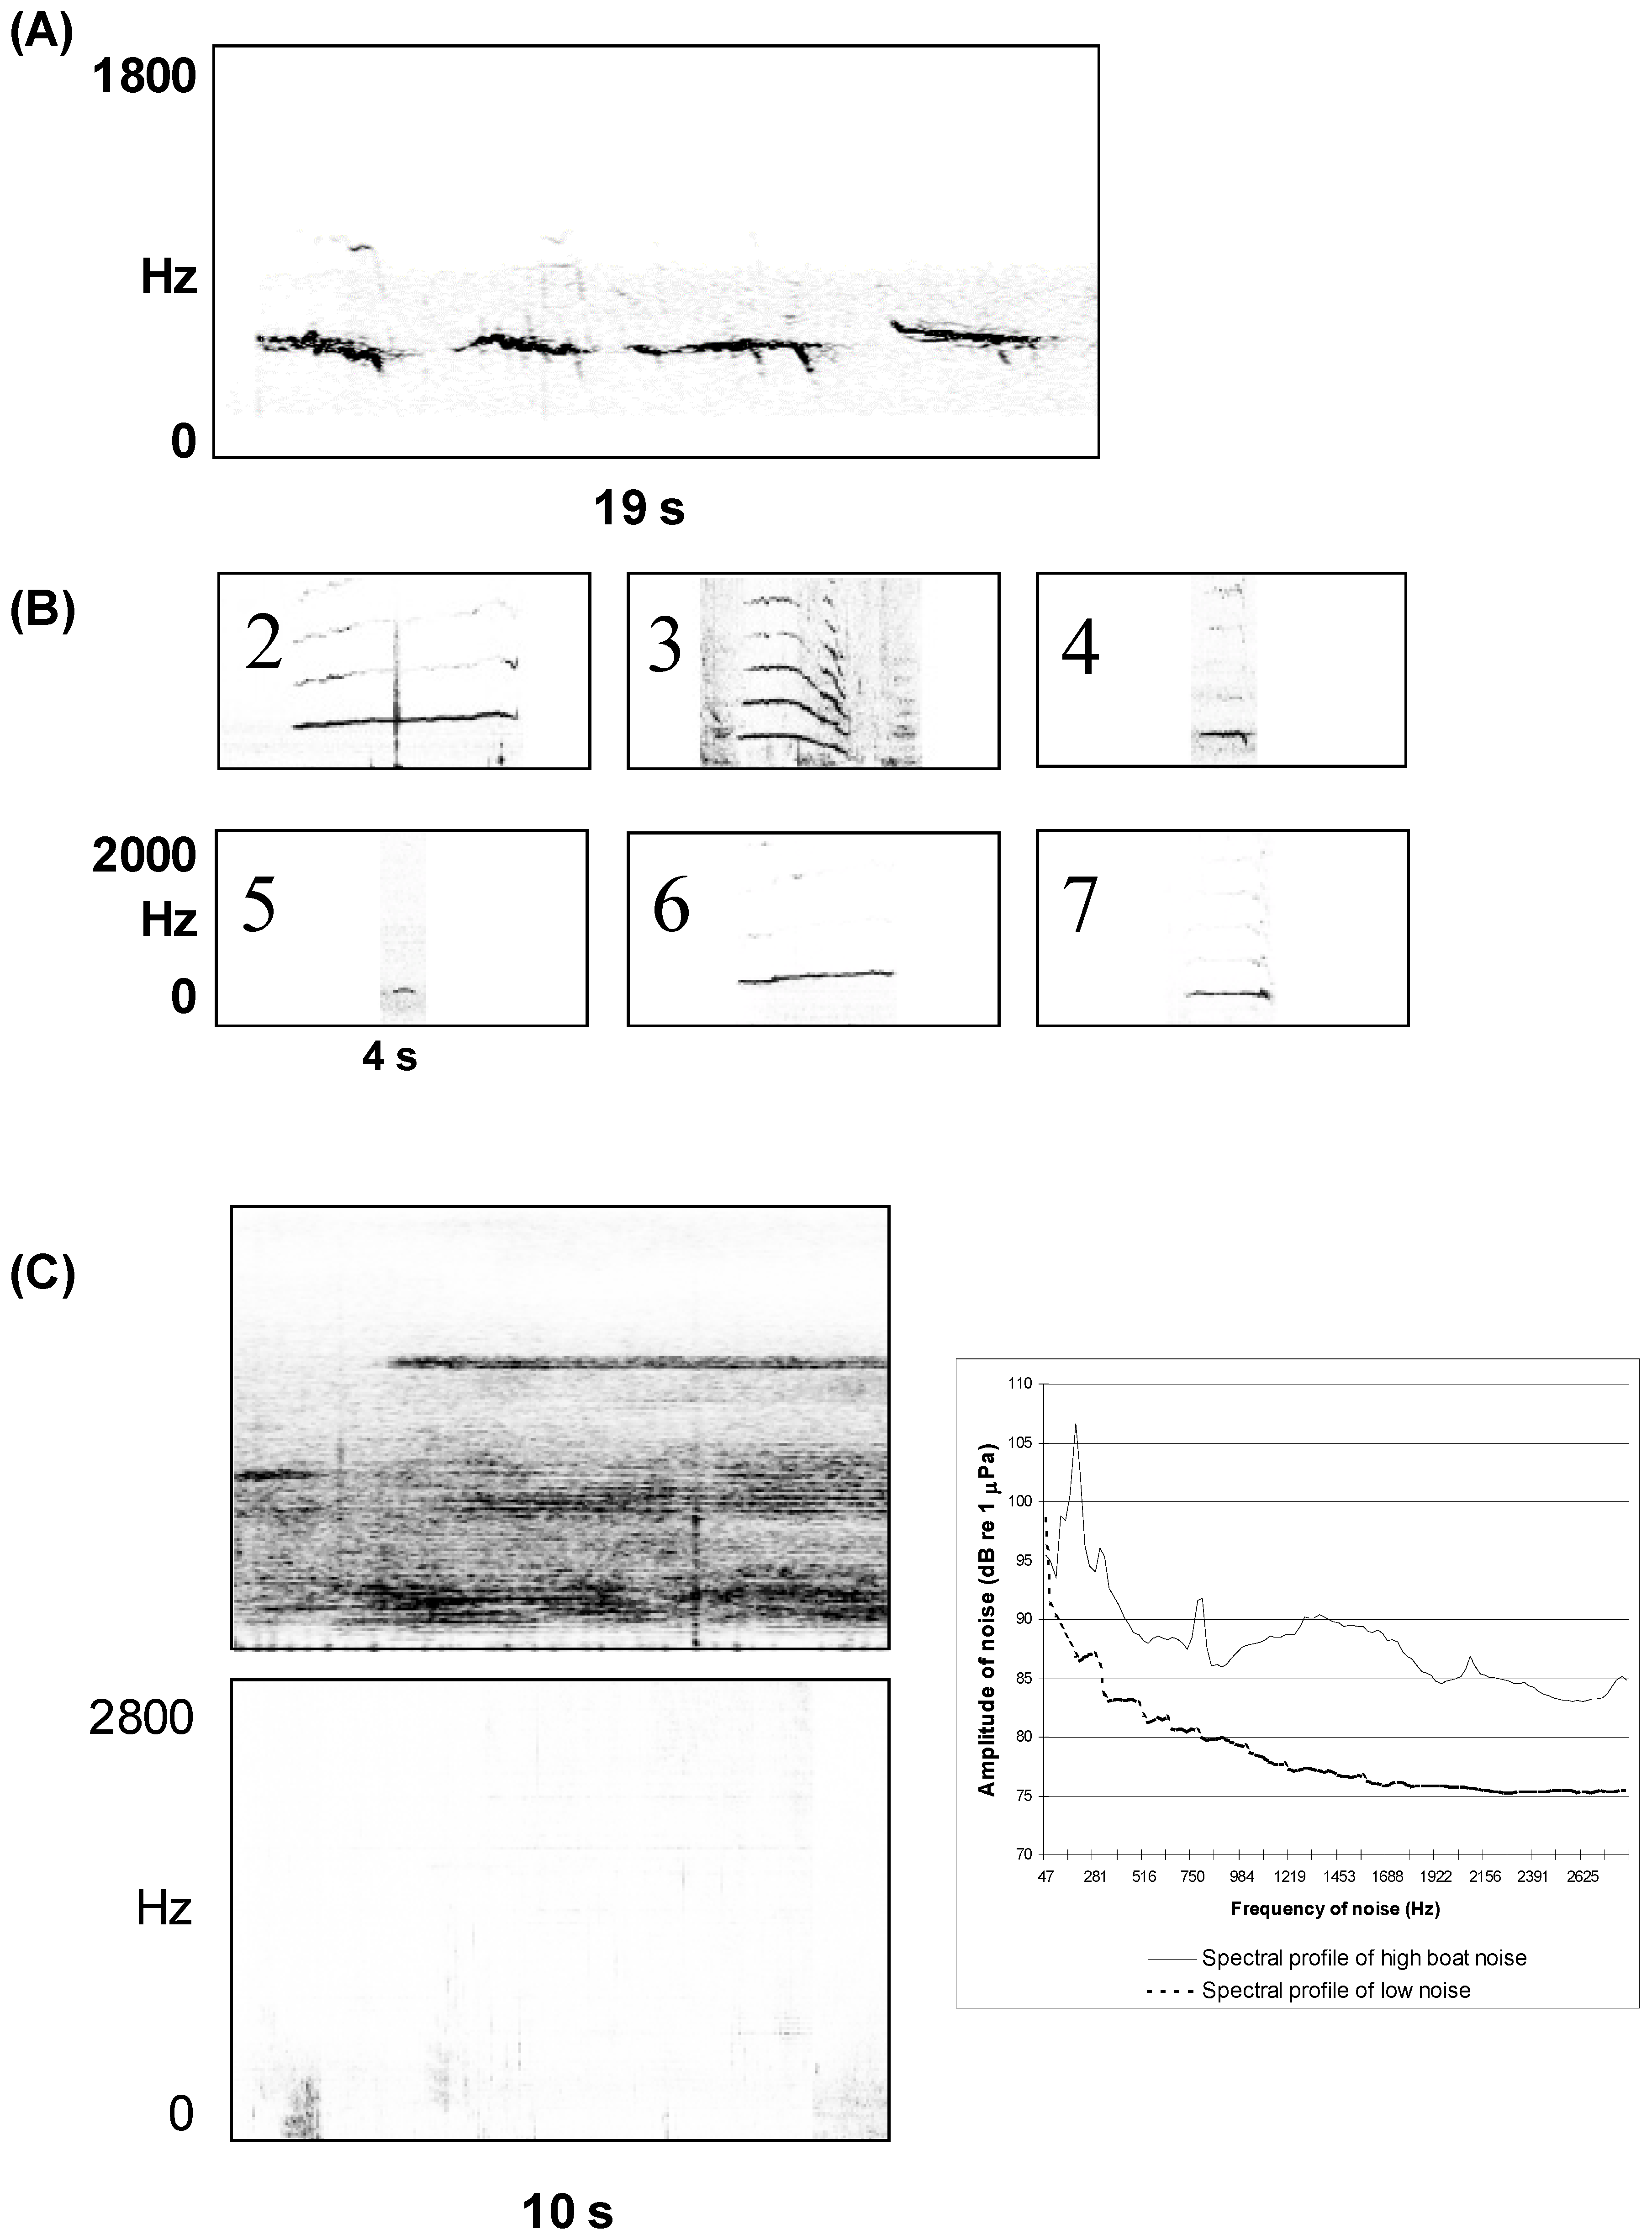
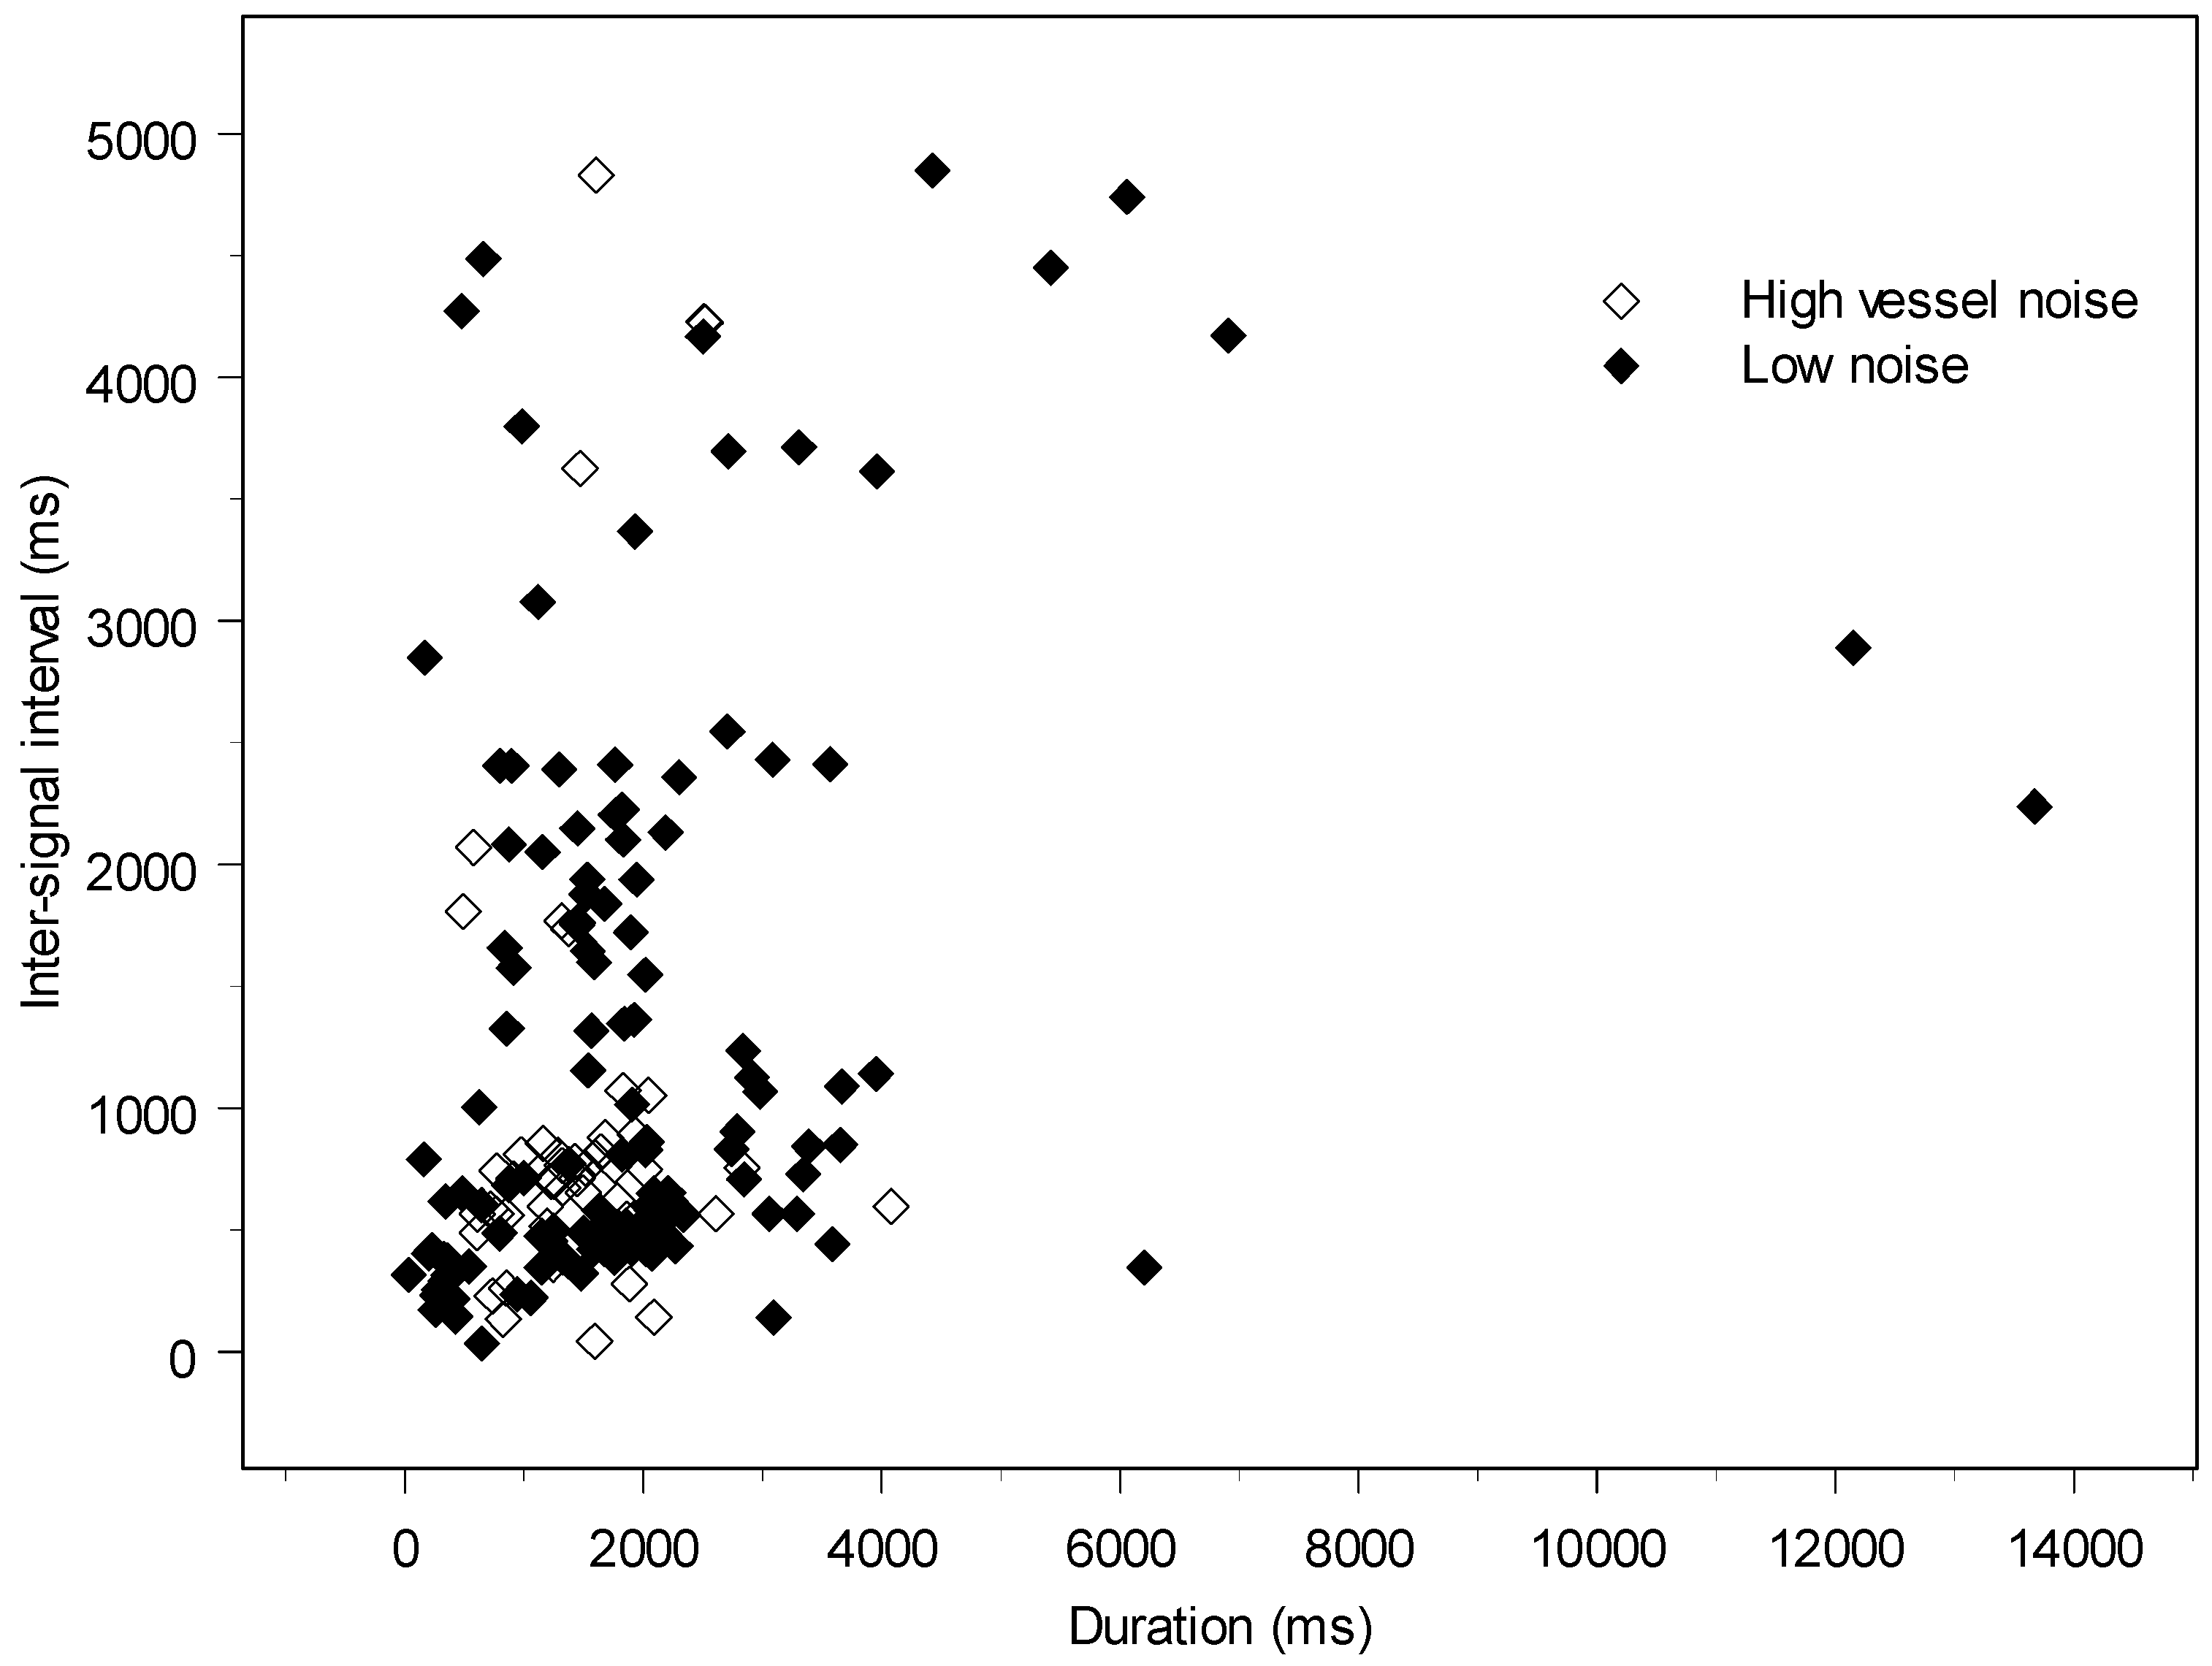
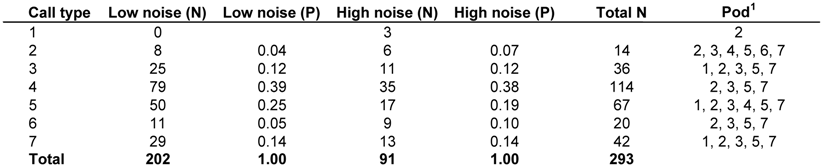
3. Quantifying Humpback Whale Vocal Responses to Boat Noise

To address the first hypothesis—that these humpback whales changed the acoustic structure of their vocalizations in response to increased vessel noise—we examined whether the acoustic structure of humpback whale feeding calls differed under these two noise conditions. The analysis of noise condition for 21 acoustic parameters revealed that none of the 19 variables representing spectral parameters (e.g., minimum frequency, mean frequency, frequency at peak amplitude) and only one of the variables representing temporal features, (inter-signal interval), significantly differed between the two average noise conditions we used in this study. Inter-signal interval was significantly shorter—repetition rate was higher—(Two-Sample Kolmogorov-Smirnov Test: ks = 0.206, N = 183, p = 0.034) under conditions of high vessel noise (1031 ± 21 ms) than under conditions of low background noise (1248 ± 9 ms; see Figure 2). These data would suggest, on a preliminary basis, that humpback whales do not modify the actual acoustic structure of their feeding calls in response to high vessel noise conditions, although they do appear to vocalize at a significantly faster rate.
Figure 2. Scatterplot of inter-signal interval and duration of feeding calls produced under high vessel noise (open diamond) and low noise (filled diamond) conditions.
Entropy 10 00033 g002
To address the second hypothesis—that humpback whales change the temporal use of their signals in response to increased vessel noise—we evaluated whether humpback whales modify their patterns of use of different feeding call types depending on noise conditions. K-means cluster analysis on the 20 acoustic variables revealed that humpbacks produce seven statistically discrete feeding call types (Figure 1). Note that call type 1 was omitted from this figure and the rest of the analyses because it was produced by only one pod three times. An internal validation of these categories using cross-validation discriminant analyses (leave-one-out) revealed that on average 95% (ranging from 89-98%) of the calls were correctly classified to their call type following this procedure.
Table 1 presents the frequency and probability of use for each call type by noise condition. Table 2 represents the entropic values at each of the three entropic orders measured ( n = 0 , 1 , 2 ). Feeding call usage at the zero-order entropy, denoting repertoire diversity, did not differ between noise conditions. Feeding call usage at the first-order entropy, or the relative frequency-of-use distribution of call types, however, showed some difference between noise conditions (Table 1 and Table 2), with a greater difference (drop) from zero-order entropy to first-order entropy for high vessel noise (0.53) than low background noise (0.43) conditions (Table 2). This means that although the diversity of the repertoire was similar, the frequency of use of call types was somewhat more redundant under high vessel noise vs. low background noise conditions. In addition, the dependency between calls used in sequences or bouts of calls (the second-order entropy) showed a marked difference between noise conditions (Table 2). Calling behavior was more repetitive under conditions of high vessel noise than low background noise conditions, indicated by the larger difference (drop) from first-order entropy to second-order entropy under high vessel noise conditions (0.52) than low noise conditions (0.15). That is, calling bouts were more likely to consist of repetitive two-call sequences under high vessel noise than low noise conditions. Under low background noise conditions, sequences of calls appeared to be more randomly determined. The entropic slope [23] of calls under high vessel noise conditions reflects this change in call type usage (Table 2). Figure 3 shows the transitional probabilities of all two-call sequences (used to evaluate the second-order entropy) for low background and high vessel noise conditions. This figure demonstrates that call usage was more repetitive (with other increased inter-signal dependencies) under high vessel noise conditions, indicated by the higher occurrence of conditional probabilities greater than 30% under high vessel noise conditions than low background noise conditions.
Table 1. Frequency (N) and probability (P) of use of seven feeding call types by humpback whales under conditions of high vessel noise and low noise.
Entropy 10 00033 i001
1 indicates the identity of pods producing each call type
Table 2. Entropic measures of feeding call usage by humpback whales under conditions of high vessel noise and low noise.
Entropy 10 00033 i002
1 The entropic slope is a regression of the entropies against their order
Table 3. Monte Carlo simulation (with two-sample heteroscedastic t-test) of two entropic measures on feeding call usage by humpback whales under conditions of high vessel noise and low noise.
Entropy 10 00033 i003
Figure 3. Probability tree of two-call sequences (related to Markovian first-order or Shannon second-order entropy) for feeding call usage under conditions of (A) low noise and (B) high vessel noise. Note: probabilities less than 0.30 are not shown to illustrate the higher repetitiveness under high vessel noise conditions. Five additional transitional probabilities of < 0.30 existed for the low noise condition and two additional transitional probabilities existed for the high vessel noise condition. This diagram demonstrates that humpback whale feeding calls have higher-order structure (similar to syntax in human speech) where signal probabilities are more conditionally dependent on each other under higher noise conditions.
Entropy 10 00033 g003
To validate that the entropic values were significantly different (given that there is only a single value for each entropic parameter per noise condition in the analyses of the information entropy), Monte Carlo simulations were conducted in which data sets with the same frequency-of-occurrence distribution weights, but randomly sampled, were generated using what is referred to as a “bootstrap” method [31, 23]. The results show that the second-order and entropic-slope differences are indeed significant (see Table 3). These results suggest that if humpback whales are limited in modifying the spectral structure of their feeding calls, they may be able to compensate by modifying their patterns of use of feeding calls in response to vessel noise, becoming more repetitive in their sequences of call usage, for example, in order to ensure that the message is accurately received by other humpback whales, or prey, or both). The whales therefore emitted a few repetitive call sequences rather than using the entire repertoire uniformly when creating these call sequences. However, they did not simply limit themselves to a few call types (e.g., call type 6 and call type 3), but when they used more than one call in a bout, they were more likely to transition between a few specific call types. This pattern is similar to the patterns of communication we observe in our own species under noisy conditions [26], where speech becomes not only louder but also highly repetitive under extreme conditions. It may be noted that decreasing proximity between whales to improve vocal signal-to-noise would not have been expected to be very effective given the high level of noise and its efficient propagation in water.

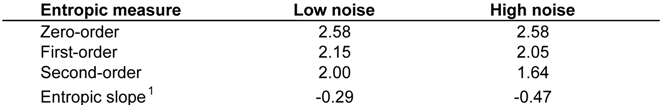
4. Calculating Effects of Boat Noise on the Channel Capacity of Glacier Bay

While there is a decrease in information transmission rate with increased vessel noise measured in our humpback whale data set, it would be of interest to estimate how much the channel capacity of the medium of transmission itself (Glacier Bay) is decreased due to this level of vessel noise. One might examine the vessel noise conditions arising in Glacier Bay then by treating Glacier Bay itself as a noisy transmission channel. To calculate the difference in channel capacity of the high vessel noise and the low background noise (in which the humpback whale feeding calls were recorded), let the signal bandwidth be W cycles per second, and let us assume that the noise sources we measured can be characterized as Gaussian, with a cutoff at W cycles per second. (Significant differences can occur if the noise is not Gaussian—and boat engines are generally not so—but we use this formulation to approximate the type of noise with the recognition that the exact specification of the vessel noise type can usually also be derived in a straightforward manner under more exact conditions of, e.g., water temperature, salinity, depth, and so on.) For an average vessel noise power per sample of N v , the channel capacity, in bits per second, is [24, 26]:
C = W   log 2 ( 1 + P N v )
where P is the average power per sample. The number of binary digits transmitted per second is, S log 2 d , where S is the number of signals transmitted per second (about 0.25 in the case of humpback whale feeding calls; e.g., Figure 1A) and d is the total number of different signal types in the communication system (i.e., seven). With S = 2 W being the Nyquist frequency response limit, the channel capacity, in bits transmitted per second, can thus be re-written as [26]:
C = S log 2 1 + P N v
Equation 6 states that for a message consisting of S signals being transmitted per second (from the humpback whales), at a signal power P mixed with Gaussian noise of power N v (from boat engines), no more than C bits per second can be reliably transmitted. This is the maximum channel capacity, then, for this communication channel—that is, no faster (reliable) data rate than C bits per second is possible at this signal-to-noise ratio.
When the presence of increased (Gaussian) noise of power N v in a signal of power P causes the channel capacity C to drop, a signaler aware of this noise might be expected to respond, in part, by lowering the information transmission rate (through repetition of signals, for example), although changing frequencies out of the noise range, and increasing the amplitudes of signals are also responses that might be expected to overcome noise in the environment [23]. Lowering the information transmission rate directly improves message error recovery, as well [26] and thus can have significant survival value in the case where signals are essential to coordinating feeding, or other essential activities.
To quantify the change in the channel capacity as a result of increased noise in a manner independent of the coefficient in Equation 6, we took the ratio of the fraction for high vessel noise that we measured: ( P / N v ) H N = 1.053, (see Figure 1C), and then compared it with the fraction for low background noise channel capacity, ( P / N v ) L N = 1.696, giving the ratio:
C H N C L N = 1 + ( P N v ) H N 1 + ( P N v ) L N = 0.62
Equation 7, then, states that the ratio of high-to-low-noise channel capacities (average of our entire sample)—is 62%. In other words, for the boat noise (high noise) measured, compared with the ambient background (low noise), the channel capacity is (on average) reduced by more than one-third.

5. Comparing Channel Capacity with Humpback Whale Signal Transmission Rate

From Table 2 we find that the zero-order entropies in both the high vessel noise (HN) and low background noise (LN) cases are identical: H 0 H N = H 0 L N = 2.58 . This means that no signal type was dropped as a result of vessel noise. The first-order information entropies for the high and low noise cases were found to be: H 1 H N = 2.05 , and H 1 L N = 2.15 , respectively, giving a ratio of H 1 H N / H 1 L N = 0.95 implying that the frequency distribution of the signals is not changed by much in the presence of noise (i.e., if there is more repetition, for example, it is uniformly distributed throughout all signal types). The second-order entropies for the high and low noise data were measured to be: H 2 H N = 1.64 , and H 2 L N = 2.00 , respectively, giving a ratio of H 2 H N / H 2 L N = 0.82 . This means that the average conditional entropy component of the humpback feeding calls may have been significantly adjusted as a result of boat noise (the simpliest second-order entropy adjustment being repetition).
Table 3 shows the results of a t-test, (using Monte Carlo simulations of the values recorded and listed in Table 1) showing that the average second order entropy under high noise conditions is statistically significantly different from the second-order entropy measured under low noise (ambient) conditions (see also [23]). One can also calculate an “entropic slope,” which is a linear regression of the value of the information entropy against their entropic order integer [21, 23]. We obtained a linear fit for the case of high and low noise to be, H ( s l o p e ) H N = 0.47 , and H ( s l o p e ) L N = 0.29 , respectively (Table 3). The ratio of the sum of these entropies, H 1 , 2 = H 1 + H 2 for high and low noise, respectively, was then: H 1 , 2 H N / H 1 , 2 L N = 3.69 / 4.15 = 0.89. The average of the humpback whale vocalizations, therefore, decreased in (joint) information transmission rate to only 89% of the non-noisy level. This can be compared to a decrease in channel capacity, due to boat noise itself, during those vocalizations to 62%, giving a ratio of 0.89 / 0.62 = 1.44.
Thus in a comparison of the average of many instances of humpback whale vocalizations during quiescent periods and during periods of boat noise, we found that the humpback whales decreased their transmission rate in the presence of vessel noise significantly, but not by enough to assure that all the messages are received—they would need to have decreased their transmission rate by another 27% to be assured of this. It may be that humpback whales can compensate in other ways—vocalizing at a higher frequency than the boat noise, for example (e.g., [28]). It may also be that the humpback whales can recognize portions of a given signal enough not to have to receive the whole signal. While the humpbacks could have decreased the number of signal choices by exclusion of some signals and repetition of others—thereby making the reception of these signals (error recovery) more certain—this did not, on average, occur since the first-order entropy does not change significantly (Table 1). This indicates that the necessity for increased error recovery may be accomplished, in large part, by decreasing the information entropy within the message being transmitted itself by modification of two-signal (or higher) structure.
While our data set was an average of many vessel noise events and many humpback whale vocalization bouts—we nevertheless hope that the approach outlined herein may find application to specific (identified individual) cases in the near future and proves to be an effective approach toward quantifying changes due to vessel noise in the feeding behavior of humpback whales and perhaps other species as well. Near-term goals are better characterization of the boat noise, better constraints on individual circumstances (distance to noise, etc.), and sufficient additional signals to be able to extend the characterization of entropy to orders higher than two.

6. Conclusions

We have introduced a quantitative tool, based on information theory, that can characterize and quantify the response of humpback whales to environmental boat noise. Although we have used a signal data set of opportunistic recording taken over the span of more than a decade, the quantitative trend of average humpback signaling is in the direction of decreased information transmission rates when in the presence of boat noise occurring during this time. Specific investigation using such information theoretic measures, as demonstrated here, should be able to significantly contribute to determining the effects of vessel noise on the efficacy and adaptability of humpback whale vocal communication, as well as the consequences of these changes in vocal behavior (or lack thereof) on their population dynamics. This approach may also be extended to the evaluation of the effects of noise on the efficacy of communication systems in wildlife populations in general, with applicability to a number of threatened and endangered species.

Acknowledgments

Our special thanks to Christine Gabriele of the National Park Service in Glacier Bay, Alaska for recording the data and sharing it with us for this investigation. We thank the referees, Dr. Jack Semura of the Physics Department of Portland State University and Dr. Fred Sharpe of the Alaska Whale Foundation, for their helpful comments. We would also like to thank Jon Jenkins and Pieter Folkins for helpful discussions. This research was performed in a humane manner and was approved by the animal care and use committee of the Glacier Bay National Park Service. This research was funded by a special grant from the SETI Institute. Correspondence concerning this article should be directed to Dr. Laurance R. Doyle, SETI Institute, 515 N. Whisman Road, Mountain View, CA 94043, [email protected].

References

  1. Richardson, J. W. Marine Mammals and Noise; Academic Press: New York, NY, 1998. [Google Scholar]
  2. Baker, C. S.; Herman, L. M. Behavioral Responses of Summering Humpback Whales to Vessel Traffic: Experimental and Opportunistic Observations; U.S. National Park Service, Alaska Regional Office: Anchorage, AK, 1989; p. 50. [Google Scholar]
  3. Borggaard, D.; Lien, J.; Stevick, P. Assessing the Effects of Industrial Activity on Large Cetaceans in Trinity Bay, Newfoundland (1992-1995). Aquatic Mammals 1999, 25, 149–161. [Google Scholar]
  4. Cerchio, S. Cultural Evolution and Geographic Variation in the Songs of Humpback Whales in the Eastern North Pacific; University of California: Santa Cruz, CA, 1993. [Google Scholar]
  5. Cerchio, S.; Jacobsen, J. K.; Norris, T.F. Temporal and geographical variation in songs of humpback whales, Megaptera novaeangliae: Synchronous Change in Hawaiian and Mexican Breeding Assemblages. Animal Behaviour 2001, 62, 313–329. [Google Scholar] [CrossRef]
  6. Frankel, A. S.; Clark, C. W.; Herman, L. M.; Gabriele, C. M. Spatial distribution, habitat utilization, and social interactions of humpback whales, Megaptera Novaeangliae, Off Hawai'i, Determined Using Acoustic and Visual Techniques. Canadian Journal of Zoology 1995, 73, 1134–1146. [Google Scholar] [CrossRef]
  7. Hafner, G. W.; Hamilton, C. L.; Steiner, W. W.; Thompson, T. J.; Winn, H. E. Signature Information in the Song of the Humpback Whale Megaptera-Novaeangliae. Journal of the Acoustical Society of America 1979, 66, 1–6. [Google Scholar] [CrossRef]
  8. Helweg, D. A.; Cato, D. H.; Jenkins, P. F.; Garrigue, C.; McCauley, R. D. Geographic Variation in South Pacific Humpback Whale Songs. Behaviour 1998, 135, 1–27. [Google Scholar] [CrossRef]
  9. Helweg, D. A.; Herman, L. M.; Yamamoto, S.; Forestelsl, P. H. Comparison of Songs of Humpback Whales Megaptera-Novaeangliae Recorded in Japan Hawaii and Mexico During the Winter of 1989. Scientific Reports of Cetacean Research 1990, 1–20. [Google Scholar]
  10. Payne, R. S.; McVay, S. Songs of Humpback Whales. Science 1971, 173, 585–597. [Google Scholar] [CrossRef] [PubMed]
  11. Baker, C. S. The Population Structure and Social Organization of Humpback Whales (Megaptera novaeangliae) in the Central and Eastern North Pacific; University of Hawaii: Honolulu, HI, 1985. [Google Scholar]
  12. Cerchio, S. Bioacoustic Analysis of Humpback Whale Vocalizations Recorded off the Aleutian Islands, Alaska. In Aleutian Island Marine Mammal Survey 1994; Southwest Fisheries Science Center, NMFS, NOAA: Aleutian Islands, 1996. [Google Scholar]
  13. Cerchio, S.; Dahlheim, M. Variation in Feeding Vocalizations of Humpback Whales Megaptera Novaeangliae from Southeast Alaska. Bioacoustics 2001, 11, 277–295. [Google Scholar] [CrossRef]
  14. Thompson, P. O.; Cummings, W. C.; Ha, S. J. Sounds, Source Levels, and Associated Behavior of Humpback Whales, Southeast Alaska. Journal of the Acoustical Society of America 1986, 80, 735–740. [Google Scholar] [CrossRef] [PubMed]
  15. Payne, K.; Payne, R. Large Scale Changes Over 19 Years in Songs of Humpback Whales in Bermuda. Z. Tierpsychologie 1985, 68, 89–114. [Google Scholar] [CrossRef]
  16. Fristrup, K. M.; Hatch, L. T.; Clark, C. W. Variation in Humpback Whale (Megaptera Novaeangliae) Song Length in Relation to Low-Frequency Sound Broadcasts. Journal of the Acoustical Society of America 2003, 113, 3411–3424. [Google Scholar] [CrossRef] [PubMed]
  17. Miller, P.J.O.; Biassoni, N.; Samuels, A.; Tyack, P.L. Whale Songs Lengthen in Response to Sonar. Nature 2000, 405, 903. [Google Scholar] [CrossRef] [PubMed]
  18. Norris, T. F. Effects of Boat Noise on the Singing Behavior of Humpabck Whales; San Jose State University: San Jose, CA, 1995. [Google Scholar]
  19. Rabin, L.; McCowan, B.; Hooper, S. L.; Owings, D. Anthropogenic Noise and its Effect on Animal Communication: An Interface Between Comparative Psychology and Conservation Biology. International Journal of Comparative Psychology 2003, 16, 172–192. [Google Scholar]
  20. Slabbekoorn, H.; Peet, M. Birds Sing at a Higher Pitch in Urban Noise. Nature 2003, 424, 267. [Google Scholar] [CrossRef] [PubMed]
  21. McCowan, B.; Hanser, S. F.; Doyle, L. R. Quantitative Tools for Comparing Animal Communication Systems: Information Theory Applied to Bottlenose Dolphin Whistle Repertoires. Animal Behaviour 1999, 57, 409–419. [Google Scholar] [CrossRef] [PubMed]
  22. McCowan, B.; Doyle, L. R.; Hanser, S. F. Using Information Theory to Assess the Diversity, Complexity and Development of Communicative Repertoires. Journal of Comparative Psychology 2002, 116, 166–172. [Google Scholar] [CrossRef] [PubMed]
  23. McCowan, B.; Doyle, L. R.; Hanser, S. F.; Kaufman, A.; Burgess, C. Detection and Estimation of Complexity in Nonhuman Animal Communication. In Animal Communications; MIT Press: Cambridge, MA, 2008. (in press) [Google Scholar]
  24. Shannon, C. E.; Weaver, W. The Mathematical Theory of Communication; University of Illinois Press: Urban, IL, 1949. [Google Scholar]
  25. Chatfield, C.; Lemon, R. Analyzing Sequences of Behavioral Events. Journal of Theoretical Biology 1970, 29, 427–445. [Google Scholar] [CrossRef]
  26. Pierce, J.R. An Introduction to Information Theory; Dover Publications: New York, 1980. [Google Scholar]
  27. McCowan, B. A New Quantitative Technique for Categorizing Whistles Using Simulated Signals and Whistles from Captive Bottlenose Dolphins (Delphindae Tursiops Truncatus). Ethology 1995, 100, 177–193. [Google Scholar] [CrossRef]
  28. McCowan, B.; Hooper, S. L. Individual Acoustic Variation in Belding's Ground Squirrel Alarm Chirps in the High Sierra Nevada. Journal of the Acoustical Society of America 2002, 111, 1157–1160. [Google Scholar] [CrossRef] [PubMed]
  29. McCowan, B.; Reiss, D. The Fallacy of 'Signature Whistles' in Bottlenose Dolphins: a Comparative Perspective of Signature Information' in Animal Vocalizations. Animal Behaviour 2001, 62, 1151–1162. [Google Scholar] [CrossRef]
  30. Law, A. M.; Kelton, W. D. Simulation Modeling and Analysis; McGraw-Hill: Boston, MA, 2000. [Google Scholar]
  31. Efron, B.; Tibshirani, R. J. An Introduction to the Bootstrap; CRC Press: Boca Raton, FL, 1998. [Google Scholar]
  32. Sharpe, F.A. Social Foraging of the Southeast Alaskan Humpback Whale, Megaptera novaeangliae. Ph.D. Thesis, Simon Fraser University, Burnaby, British Columbia, Canada.

