Sound Symbolism in Basic Vocabulary

1
Department of Linguistics, Max Planck Institute for Evolutionary Anthropology, Deutscher Platz 6, 04103 Leipzig, Germany
2
Faculty of Archaeology, Leiden University, P.O. Box 9515, 2300 RA Leiden, The Netherlands
3
Department of Psychology, University of California, Los Angeles, CA 90024–1563, USA
4
Department of Anthropology, Northern Illinois University, DeKalb, IL 60115, USA
*
Author to whom correspondence should be addressed.
Entropy 2010, 12(4), 844-858; https://doi.org/10.3390/e12040844
Submission received: 23 December 2009
/
Revised: 2 April 2010
/
Accepted: 7 April 2010
/
Published: 9 April 2010
(This article belongs to the Special Issue Complexity of Human Language and Cognition)
Abstract
:The relationship between meanings of words and their sound shapes is to a large extent arbitrary, but it is well known that languages exhibit sound symbolism effects violating arbitrariness. Evidence for sound symbolism is typically anecdotal, however. Here we present a systematic approach. Using a selection of basic vocabulary in nearly one half of the world’s languages we find commonalities among sound shapes for words referring to same concepts. These are interpreted as due to sound symbolism. Studying the effects of sound symbolism cross-linguistically is of key importance for the understanding of language evolution.
PACS Codes:
89. Other areas of applied and interdisciplinary physics1. Introduction
As noted by John Ohala [1], much of the literature on sound symbolism which attempts to make cross-linguistic generalizations is of an anecdotal character. In this paper we present a systematic investigation of the words for a small but consistent set of concepts in a database [2] that includes almost half of the world’s languages as defined in [3]. Also using [3] for reference, the sample is certain to be representative of the world’s linguistic diversity, because 118 out of 121 families and 52 out of 123 isolates and unclassified languages are included. Although our database also includes many pidgins, creoles, and mixed languages, these are not used in the present study because they are ambiguous with respect to how they should be classified. The concepts in question represent a 40-item subset of the list of 100 (relatively) culture-neutral items of [4]. These items were selected not for their susceptibility to sound symbolism but rather for their phonological stability across time: specifically, they were identified in [5] as the concepts for which the words were most similar phonologically in languages known to be related by common descent. The database is therefore unbiased with respect to sound symbolism, because it was developed for the purpose of producing automated language classifications [6,7] and for investigating other issues of a historical linguistic nature, including the identification of linguistic homelands [8] and the calculation of dates for the break-up of proto-languages using a technique similar to glottochronology. Consequently, it provides an opportunity to make a pilot study of sound symbolism in basic vocabulary, which is to our knowledge the first of its kind.
The concepts on the 40-item subset of the Swadesh list which we use are: blood, bone, breast, come, die, dog, drink, ear, eye, fire, fish, full, hand, hear, horn, I, knee, leaf, liver, louse, mountain, name, new, night, nose, one, path, person, see, skin, star, stone, sun, tongue, tooth, tree, two, water, we, you (sg). When languages that are unrelated both in terms of genealogical relations and areal influence are compared words referring to the same concepts are not expected to be more similar than words referring to different concepts. According to [5], however, even in languages in different families located more than 10,000 km apart, the words for the same concept are slightly more similar to each other than are the words for different concepts. The authors mentioned universal tendencies such as sound symbolism as a possible explanation for this similarity, but they did not go further in trying to identify specific sounds involved in sound symbolism or the effects of this phenomenon on the typical shapes of words.
There are two additional possible explanations for the similarity. One is that it is due to certain widespread loanwords and the other is that all or most of the world’s languages are related and still retain traces of this relatedness. The first possibility can be ruled out because we have tested the effect of eliminating widespread loanwords from our database and we only found a negligible decrease in the phonological similarities observed (this result is reported here for the first time). As for the second possibility, we cannot rule out the possibility that a proto-World language may have existed since, as is well known, languages can be proven to be related but not proven to be unrelated. We can, however, offer two lines of evidence, in Section 3 and Section 5 below, that indirectly rule out the possibility that inheritance explains the effects that we interpret as sound symbolic
The aim of this paper is to take a few steps more towards the characterization of the sound symbolic effects that we had registered earlier. Given the small sample of words studied—a list of a mere 40 items—we cannot address many of the more specific questions in the literature. Examples are whether the vowel i tends to connote ‘smallness’ [9,10] or not [11] or whether certain semantic classes of words, such as animal names [12], are more or less likely to exhibit sound symbolism; these questions cannot be answered with the present data because our sample does not include the concept small and includes only two animal concepts. But we can test whether sound symbolism permeates basic vocabulary to such an extent that the distribution of sounds in such words reveals phonetically motivated clusters, we can test whether words referring to related concepts tend to have related sound shapes, and we may also inquire into whether typical shapes of words may be constructed which are interpretable as being sound symbolically motivated. After some background information in Section 2, these questions are answered in the affirmative in Section 3, Section 4 and Section 5 below.
2. General Properties of Sounds and Words
First we explain how sounds are represented in the database of the Automated Similarity Judgment Program (ASJP). In the transcription of wordlists of individual languages a simplified system is used, as described in [6]. The symbols in this system are listed and briefly described in Table 1 and Table 2.

| ASJP symbol | Description |
|---|---|
| p | voiceless bilabial stop and fricative |
| b | voiced bilabial stop and fricative |
| m | bilabial nasal |
| f | voiceless labiodental fricative |
| v | voiced labiodental fricative |
| 8 | voiceless and voiced dental fricative |
| 4 | dental nasal |
| t | voiceless alveolar stop |
| d | voiced alveolar stop |
| s | voiceless alveolar fricative |
| z | voiced alveolar fricative |
| c | voiceless and voiced alveolar affricate |
| n | voiceless and voiced alveolar nasal |
| S | voiceless postalveolar fricative |
| Z | voiced postalveolar fricative |
| C | voiceless palato-alveolar affricate |
| j | voiced palato-alveolar affricate |
| T | voiceless and voiced palatal stop |
| 5 | palatal nasal |
| k | voiceless velar stop |
| g | voiced velar stop |
| x | voiceless and voiced velar fricative |
| N | velar nasal |
| q | voiceless uvular stop |
| G | voiced uvular stop |
| X | voiceless and voiced uvular fricative, voiceless and voiced pharyngeal fricative |
| 7 | voiceless glottal stop |
| h | voiceless and voiced glottal fricative |
| l | voiced alveolar lateral approximate |
| L | all other laterals |
| w | voiced bilabial-velar approximant |
| y | palatal approximant |
| r | voiced apico-alveolar trill and all varieties of “r-sounds” |
| ! | all varieties of “click-sounds” |
| ASJP symbol | Description |
|---|---|
| i | high front vowel, rounded and unrounded |
| e | mid front vowel, rounded and unrounded |
| E | low front vowel, rounded and unrounded |
| 3 | high and mid central vowel, rounded and unrounded |
| a | low central vowel, unrounded |
| u | high back vowel, rounded and unrounded |
| o | mid and low back vowel, rounded and unrounded |
In addition to the 34 consonant and seven vowel symbols there are symbols to indicate glottalization and nasalization, as well as modifiers that indicate when a sequence of two or three consonant symbols is to be interpreted as a single phoneme. These additional symbols in the ASJP transcription system are disregarded for the present purposes. In practice this means, for example, that an aspirated stop such as ph is treated as a sequence of p and h, where each of these sounds is treated as occupying a particular position in a given word.
Often the source for a given language exhibits more than one word for a given item on the meaning list. Two or more words are listed when there are either pronunciation variants or true synonyms (completely distinct words sharing the same meaning), and such cases are not distinguished in the database. The inclusion of pronunciation variants in the present study would introduce associations between the sounds caused by variants of the same word rather than by independent occurrences of similar sounds in different words. Consequently, if two or more words are listed for an item, only the first one is used.
All statistics to be presented in what follows are first averaged across lists within each family as defined in [13] and then averaged across families. Otherwise, the results could reflect mainly the idiosyncratic properties of a few large families. All families, which are supposedly independent, are weighted equally in the analyses.
Not surprisingly, some of the 41 symbols generally occur much more frequently than others in words. The average relative frequencies of the symbols across all words are presented in Table 3, which is constructed as follows. The relative frequency of a given symbol in the word for a particular concept in a single list is equal to the number of times the symbol occurs in the word, divided by the total number of symbols in the word. This quantity is averaged first across lists within each family, then across families, and finally across concepts, to produce the overall average relative frequency of the symbol. The table presents the symbols in order of frequency.
Table 3.
Overall average relative frequencies of ASJP symbols. The table is ordered by frequency in descending order.
| Symbol | Freq. (%) | Symbol | Freq. (%) | Symbol | Freq. (%) | |
|---|---|---|---|---|---|---|
| a | 15.42 | l | 2.36 | L | 0.45 | |
| i | 10.52 | y | 2.27 | v | 0.42 | |
| o | 6.62 | 3 | 2.21 | f | 0.42 | |
| u | 6.25 | b | 1.95 | 5 | 0.30 | |
| n | 6.04 | d | 1.84 | z | 0.23 | |
| e | 5.96 | 7 | 1.57 | j | 0.21 | |
| k | 5.20 | g | 1.39 | X | 0.17 | |
| m | 4.61 | C | 1.14 | 8 | 0.12 | |
| t | 4.38 | c | 0.94 | T | 0.12 | |
| r | 2.73 | S | 0.92 | Z | 0.11 | |
| h | 2.70 | N | 0.83 | ! | 0.11 | |
| p | 2.53 | x | 0.79 | G | 0.03 | |
| w | 2.49 | E | 0.75 | 4 | 0.002 | |
| s | 2.45 | q | 0.47 |
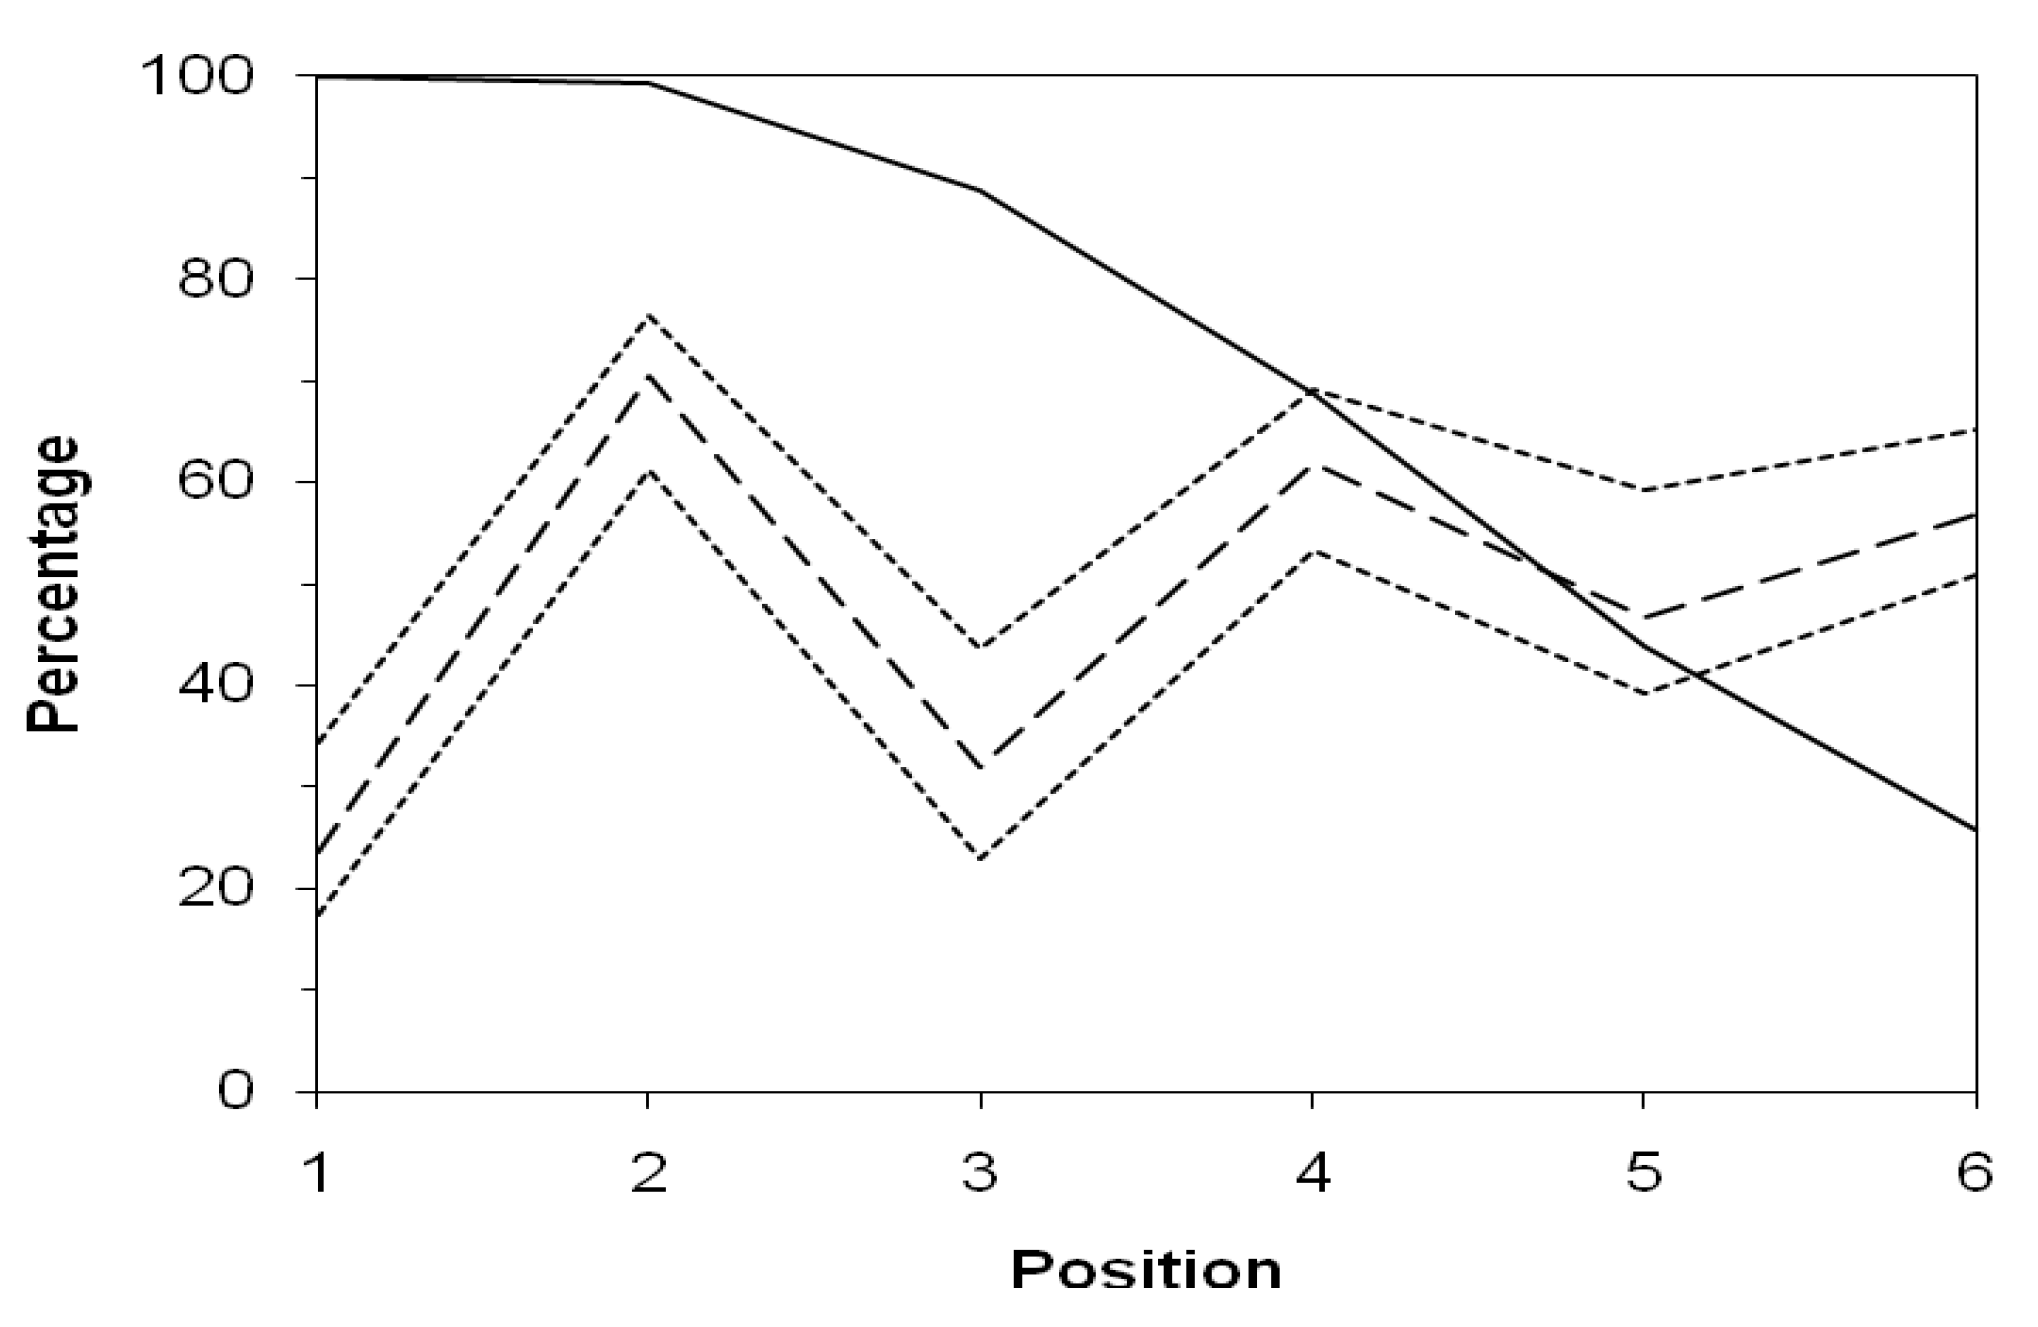
The relative frequencies of the symbols can vary widely from their average depending upon their position in the word. Typically the first symbol in a word is a consonant and the second a vowel, with consonants and vowels alternating thereafter. This pattern is a well-known cross-linguistic tendency that has even been elevated to a theoretical principle of phonology, cf. [14]. It is demonstrated in the present data by the dashed line in Figure 1, which shows the mean percentage of vowels, averaged across the 40 concepts, at each of the first six positions in a word.
Figure 1.
Percentage of words represented (solid line), average percentage of vowels (dashed line), and maximum and minimum percentages of vowels (dotted lines) across concepts, as a function of position in the word.
Figure 1.
Percentage of words represented (solid line), average percentage of vowels (dashed line), and maximum and minimum percentages of vowels (dotted lines) across concepts, as a function of position in the word.

The dotted lines show the maximum and minimum of this percentage across the 40 concepts, demonstrating that the pattern holds for all the concepts at least through the first four positions. The solid line shows the percentage of words long enough to have any symbol at the specified position. The figure does not include more than six positions because only 14% of the words contain more than six symbols. The average frequencies of the different symbols at the different positions serve as a baseline against which any effects of sound symbolism will appear as deviations from the average for some sounds in the words for some concepts.
3. Sound-Sound Associations
In this section we look at the question whether the distributions of different sounds over different positions in the words corresponding to our meaning list reveal something about sound symbolic effects. In order to test for an overall presence of sound symbolism the following procedure is used. The average relative frequency of each sound in the words for each concept is calculated separately for each position in the word, counting from the beginning of the word. This produces for each position a 40 × 41 matrix in which rows and columns refer to the 40 concepts and the 41 sounds, respectively. The frequencies in each row total 100% by definition, but the frequencies differ widely between columns reflecting the overall frequencies summarized in Table 3. To assess the similarity between sounds according to their patterns of frequencies independent of their overall frequencies, the conventional measure is the Pearson correlation between sounds (columns) across concepts (rows) [15]. This produces for each position a 41 × 41 correlation matrix. Since the pattern of correlations is similar in the different positions, the matrices are averaged across the first four positions in order to reduce random variation. If some sounds tend to occur in words for some concepts and not others at a given position, then the sounds that tend to occur in words for the same concept will be positively correlated with each other. In the absence of sound symbolism, however, the correlations will be 0 except for random variation.
We now go on to test the null hypothesis that the correlations reflect only random variation. If they reflect random variation one would not expect similar patterns to show up in different parts of the world in languages that can be assumed to be unrelated. Thus, a good cross-validation procedure is to calculate average correlation matrices separately for the languages of the Eastern and Western Hemispheres. Doing this we find that the correlation between the two matrices is 0.22. A Mantel test is then applied to this correlation. Rows and columns of one matrix are randomly permuted 10,000 times and each permuted matrix is correlated with the other original matrix. All of the 10,000 correlations proved to be below 0.22, showing that the correlation between the original matrices is significantly positive. Since the correlations in the original matrices are not random, they can be attributed to sound symbolism.
The matrix of average correlations for all languages is now subjected to metric multidimensional scaling (MDS) [16,17]. By the MDS technique, points are located so that the distances between points are as nearly as possible a linear function of the correlations between the sounds. Since the function has negative slope, the sounds that are close to each other tend to be positively correlated in the data.
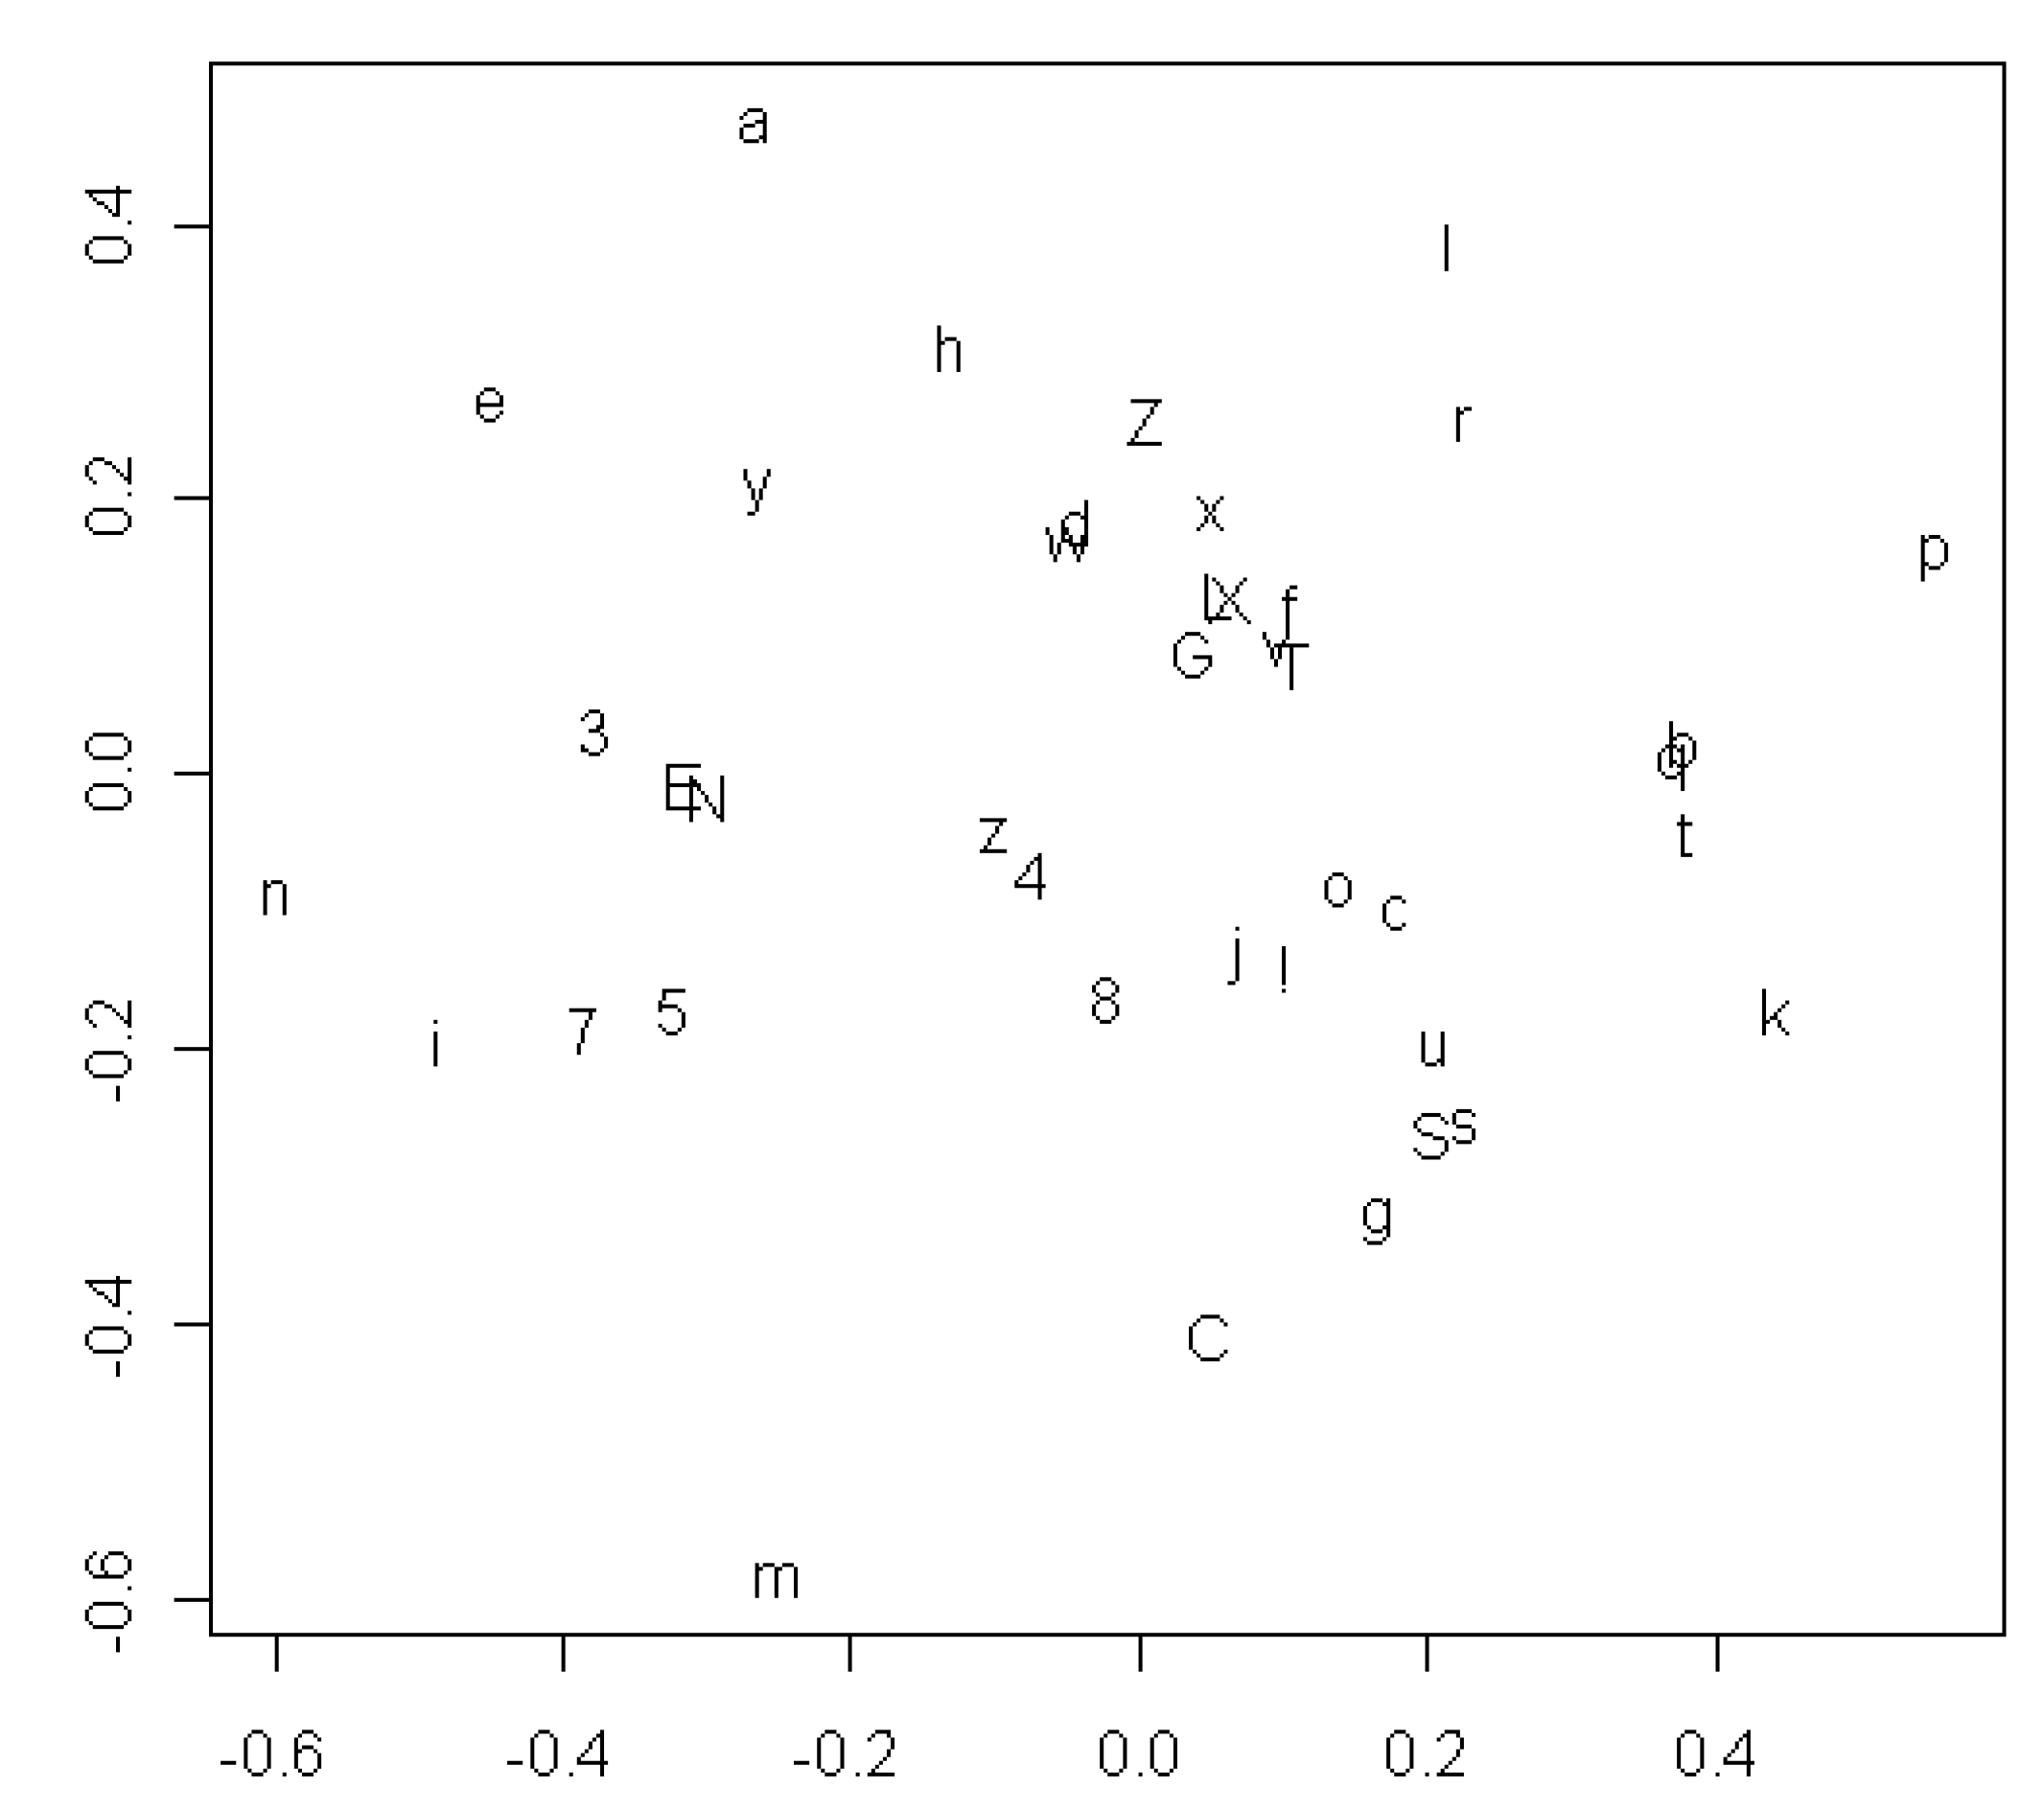
Figure 2 shows the resulting configuration of all 41 sounds in two dimensions. The most striking result in this plot is that the vowels and consonants are not clearly segregated in different regions of the space. The only possible distinction is that most of the vowels are above or to the left of most of the consonants, but o and u are obvious exceptions to this pattern. On the whole, the configuration shows little tendency for vowels to correlate with each other, or for consonants to correlate with each other, any more strongly than for vowels to correlate with consonants. Many of the sounds in the figure are relatively rare in the data, however, with the result that their position is only weakly determined. Only the more frequent sounds can be expected to reveal a meaningful pattern.
Figure 2.
MDS plot showing which of all 41 vowels and consonants tend to appear in the same positions in words for the same concept.
Figure 2.
MDS plot showing which of all 41 vowels and consonants tend to appear in the same positions in words for the same concept.

For more detailed analysis, MDS is applied separately to two subsets of the sounds: the 18 consonants that have an average frequency of at least 0.9% across the different word meanings; and the 7 vowels, including the relatively infrequent E (a low front vowel), whose average frequency is 0.75%. Results for vowels and consonants are in Figure 3 and Figure 4, respectively.
Figure 3.
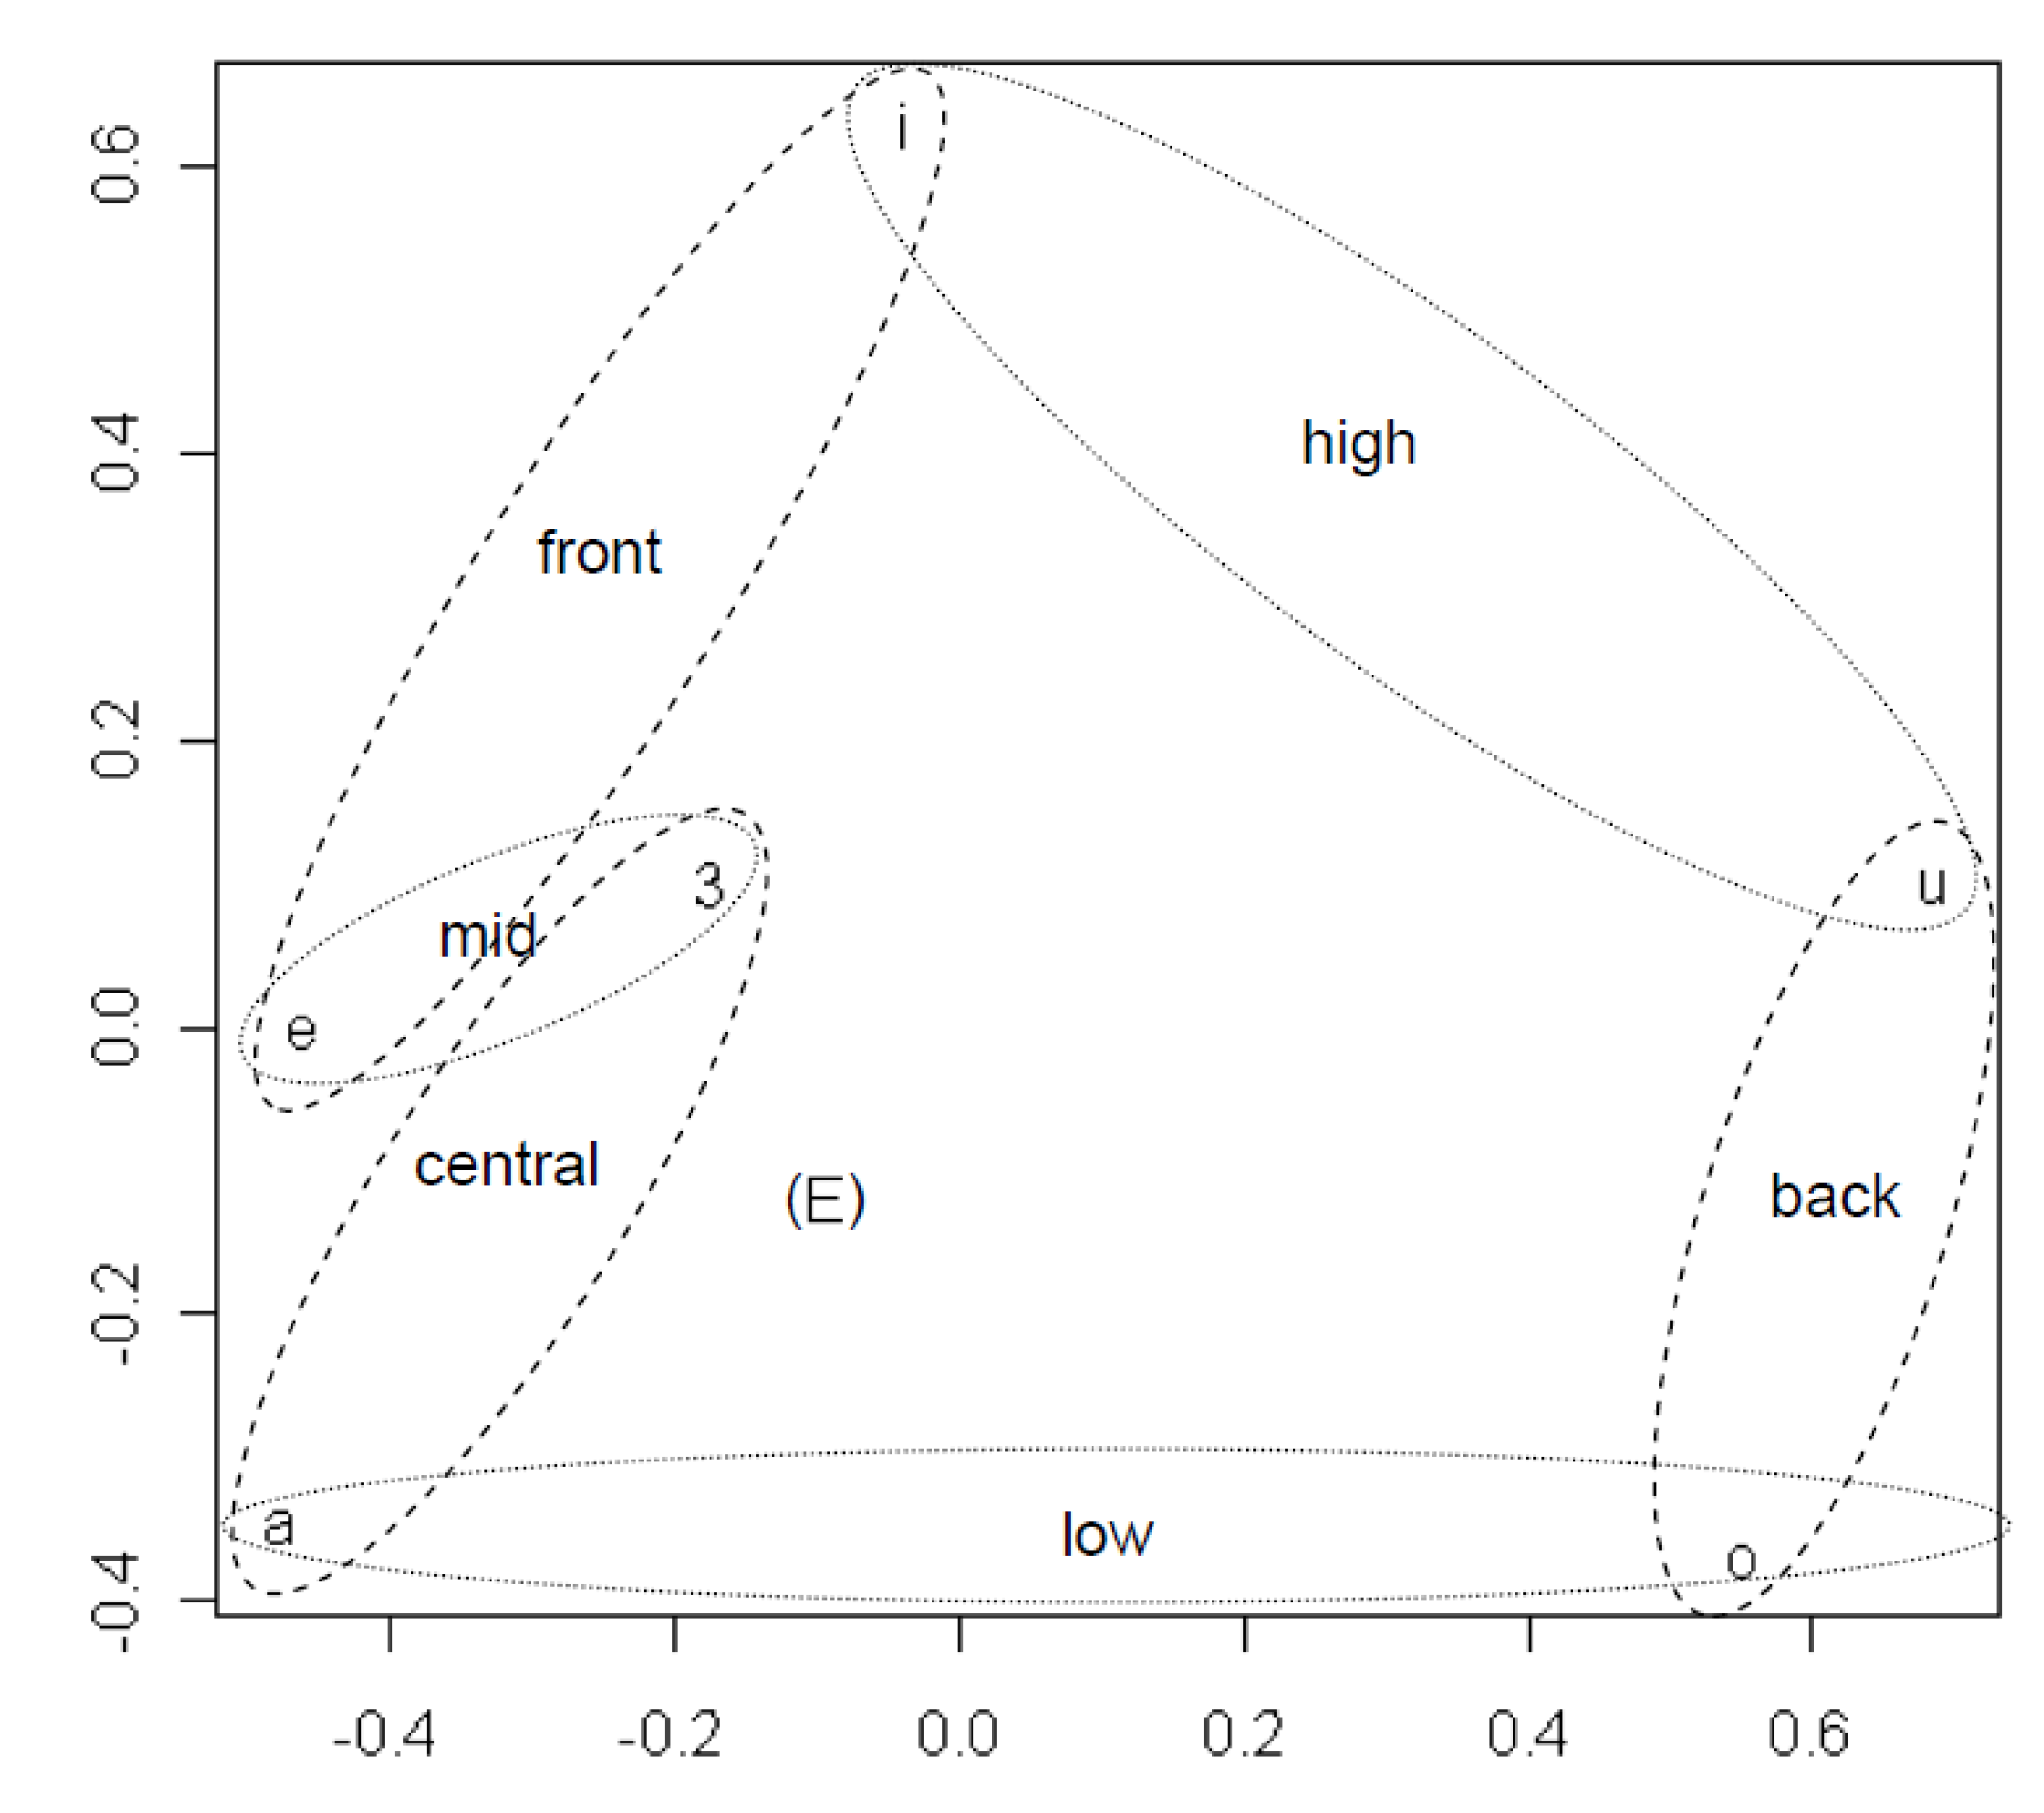
MDS plot showing vowel classes emerging from tendencies across languages for certain vowels to appear in the same positions in words for the same concept.
Figure 3.
MDS plot showing vowel classes emerging from tendencies across languages for certain vowels to appear in the same positions in words for the same concept.

The configuration in Figure 3 is similar to the configuration of the vowels in Figure 2, except upside down and expanded. Reflections and expansions are admissible transformations in Euclidean space because they do not alter the relative distances. Figure 3 shows that, except for /E/, it is possible to heuristically group all vowels in the two phonologically orthogonal dimensions of height and frontedness. The ellipses are drawn by hand. They do not result directly from a quantitative analysis but represent interpretations of the quantitative results. The anomalous position of /E/ may be a result of its low frequency.
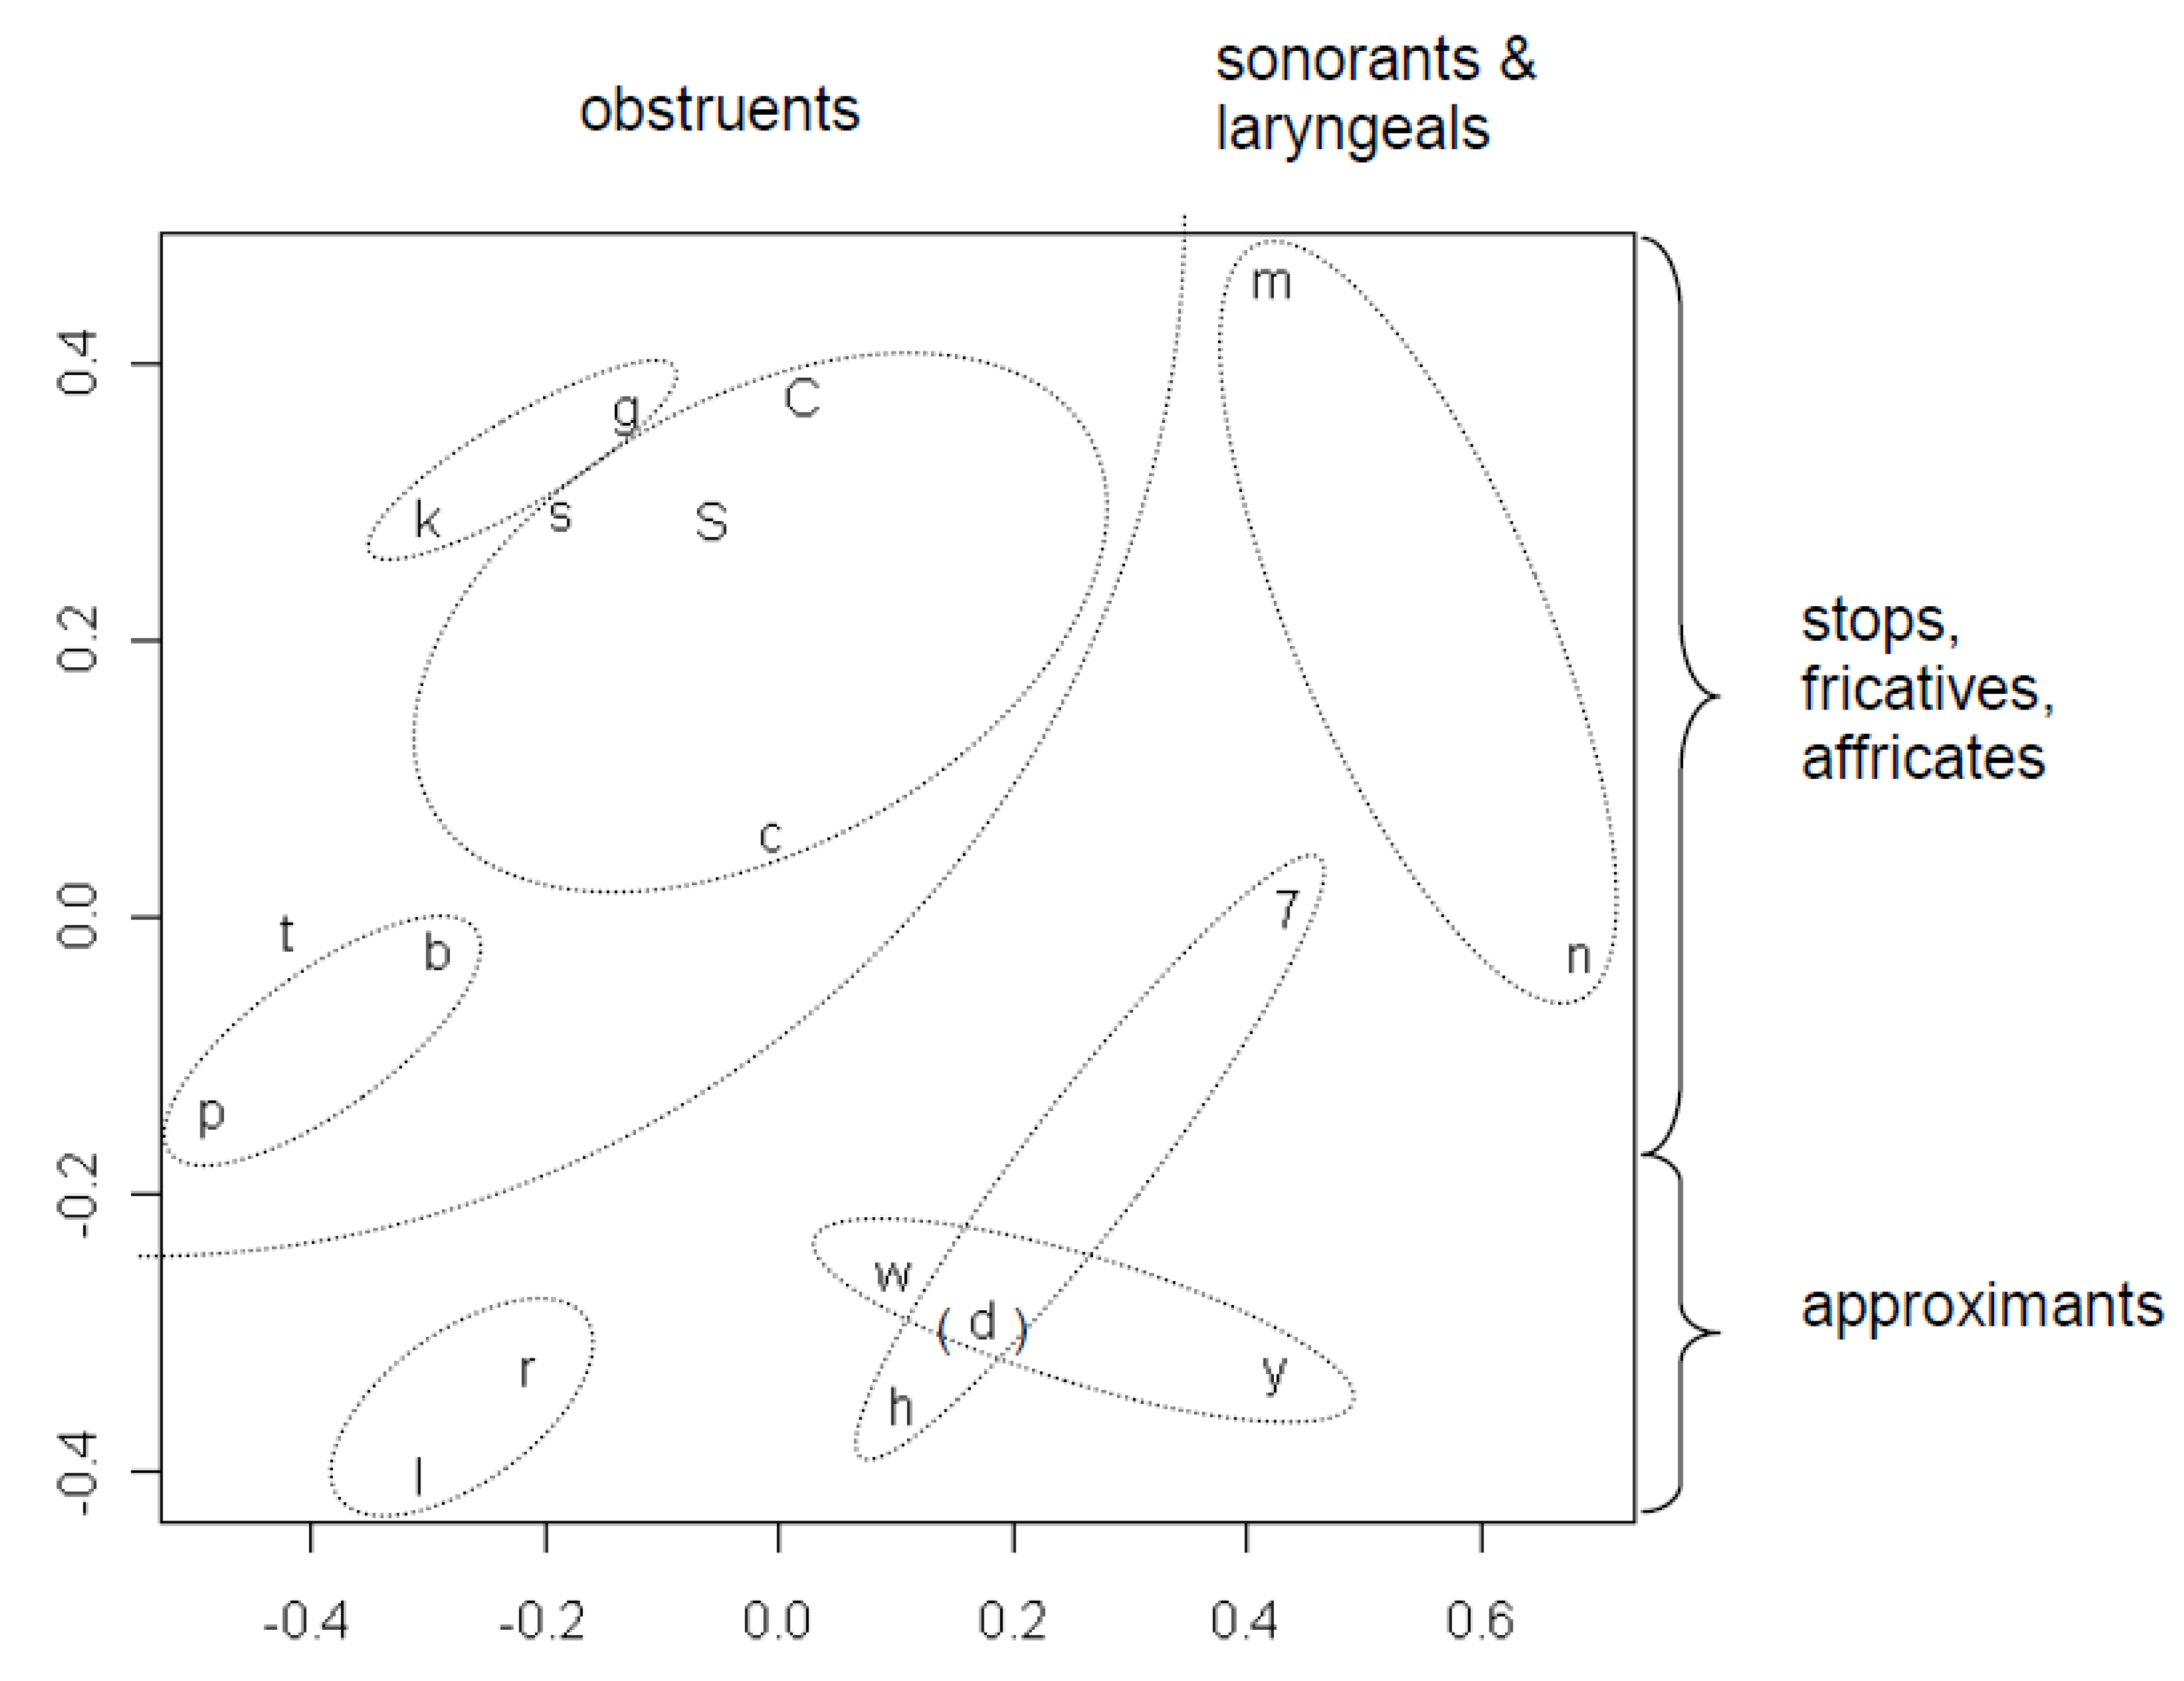
The configuration in Figure 4 is similar to the configuration of the more frequent consonants in Figure 2, except rotated about 180°. Rotations are also admissible transformations in Euclidean space. The consonants displayed in Figure 4 cluster together in several meaningful ways, with the exception of /d/, probably because it has a relatively low frequency of 1.95%. As far as the rest are concerned, their distributions are quite consistent with both narrowly defined phonetic categories (velar stops /k, g/, consonants with a fricative component /C, c, s, S/, bilabial stops /p, b/, nasals /m, n/, liquids /l, r/, glides /w, y/, laryngeals /h, 7/) and more broadly defined categories: obstruents; sonorants and laryngeals; stops, fricatives & affricates; approximants. The clustering of laryngeals /h, 7/ and glides /w, y/ also represents a natural class, namely consonants that involve an absence or minimum of oral articulation (H. Avelino, personal communication).
Figure 4.
MDS plot showing consonant classes emerging from tendencies across languages for certain consonants to appear in the same positions in words for the same concept. (The consonant d is parenthesized because it falls outside the consonant classes indicated by the ellipses).
Figure 4.
MDS plot showing consonant classes emerging from tendencies across languages for certain consonants to appear in the same positions in words for the same concept. (The consonant d is parenthesized because it falls outside the consonant classes indicated by the ellipses).
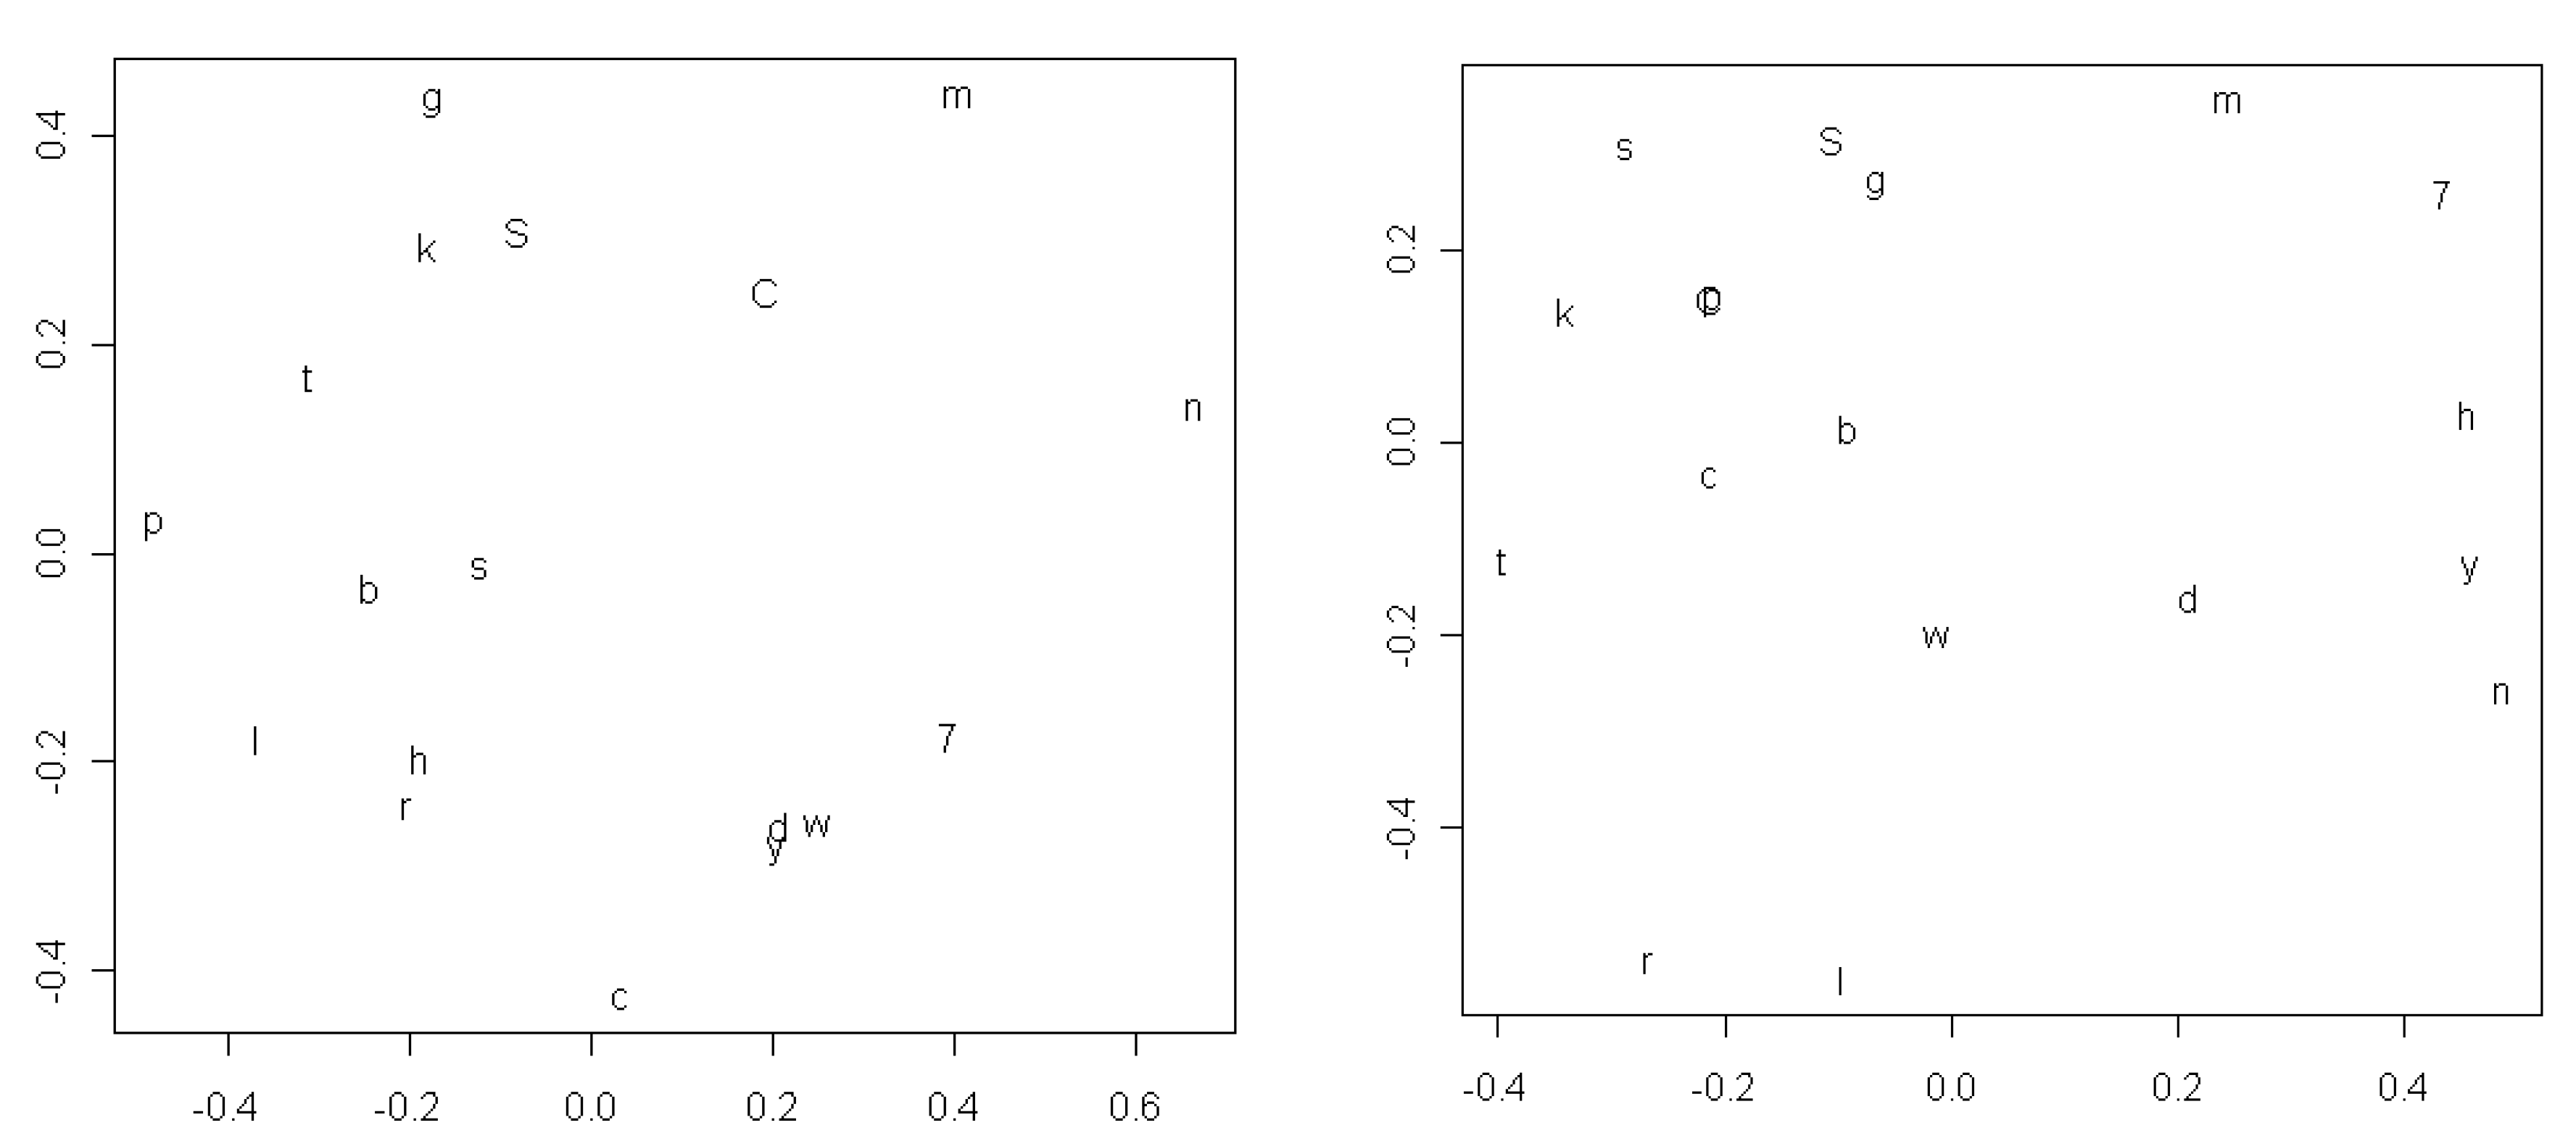
A possible alternative interpretation of the results in Figure 3 and Figure 4 is that the tendency for similar sounds to occur in similar positions is due to certain words that are related at deeper genealogical levels than the families recognized in the relatively conservative classification of the world’s languages which we use [13]. A test of this assumption is to make separate MDS plots similar to the ones in Figure 3 and Figure 4 for languages of the Old and the New World. If what we are seeing is a deep genealogical signal then this should become more distinctive when we ‘zoom in’ on regions where languages are overall more likely to be related. Figure 5 shows the results for consonants: a less orderly picture, where circles grouping together members of the phonetic categories mentioned in the previous paragraph would sometimes overlap. While we believe that this test renders an explanation in terms of inheritance less likely we admit that weakened orderliness may also be caused by the reduction in data. In Section 5 below we return to the issue of inheritance as a possible explanation of what we interpret as sound symbolic effects and present an additional test.
Figure 5.
MDS plots of the most frequent consonants for the Old World (left) and New World (right) compared.
Figure 5.
MDS plots of the most frequent consonants for the Old World (left) and New World (right) compared.

4. Meaning-Meaning Associations
In this section we turn to the complementary question of differences between meanings in the pattern of sounds over different positions in their words. The analysis again starts with the 40 × 41 matrices of average relative frequencies of each sound in the words for each concept at each of the first four positions in the word. For each position, the Pearson correlation of the frequencies is now calculated between concepts (rows) across sounds (columns) to produce a 40 × 40 correlation matrix, and the correlation matrices are again averaged across the first four positions. Because some sounds are generally more common than others, it follows that in any pair of concepts, the generally more common sounds will tend to have higher frequencies for both concepts than the generally less common sounds, producing a positive correlation. Nevertheless, if the pattern of sound frequencies is more similar in the words for some pairs of concepts than for other pairs, then some of the correlations between concepts will be higher than others. In the absence of sound symbolism, however, the correlations will be the same except for random variation.
To test this null hypothesis, average correlation matrices are again calculated separately for the languages of the Eastern and Western Hemispheres. The correlation between the two matrices is 0.46. In the Mantel test, all of the correlations for 10,000 randomly permuted matrices were below 0.46. The null hypothesis is again rejected in favor of sound symbolism.
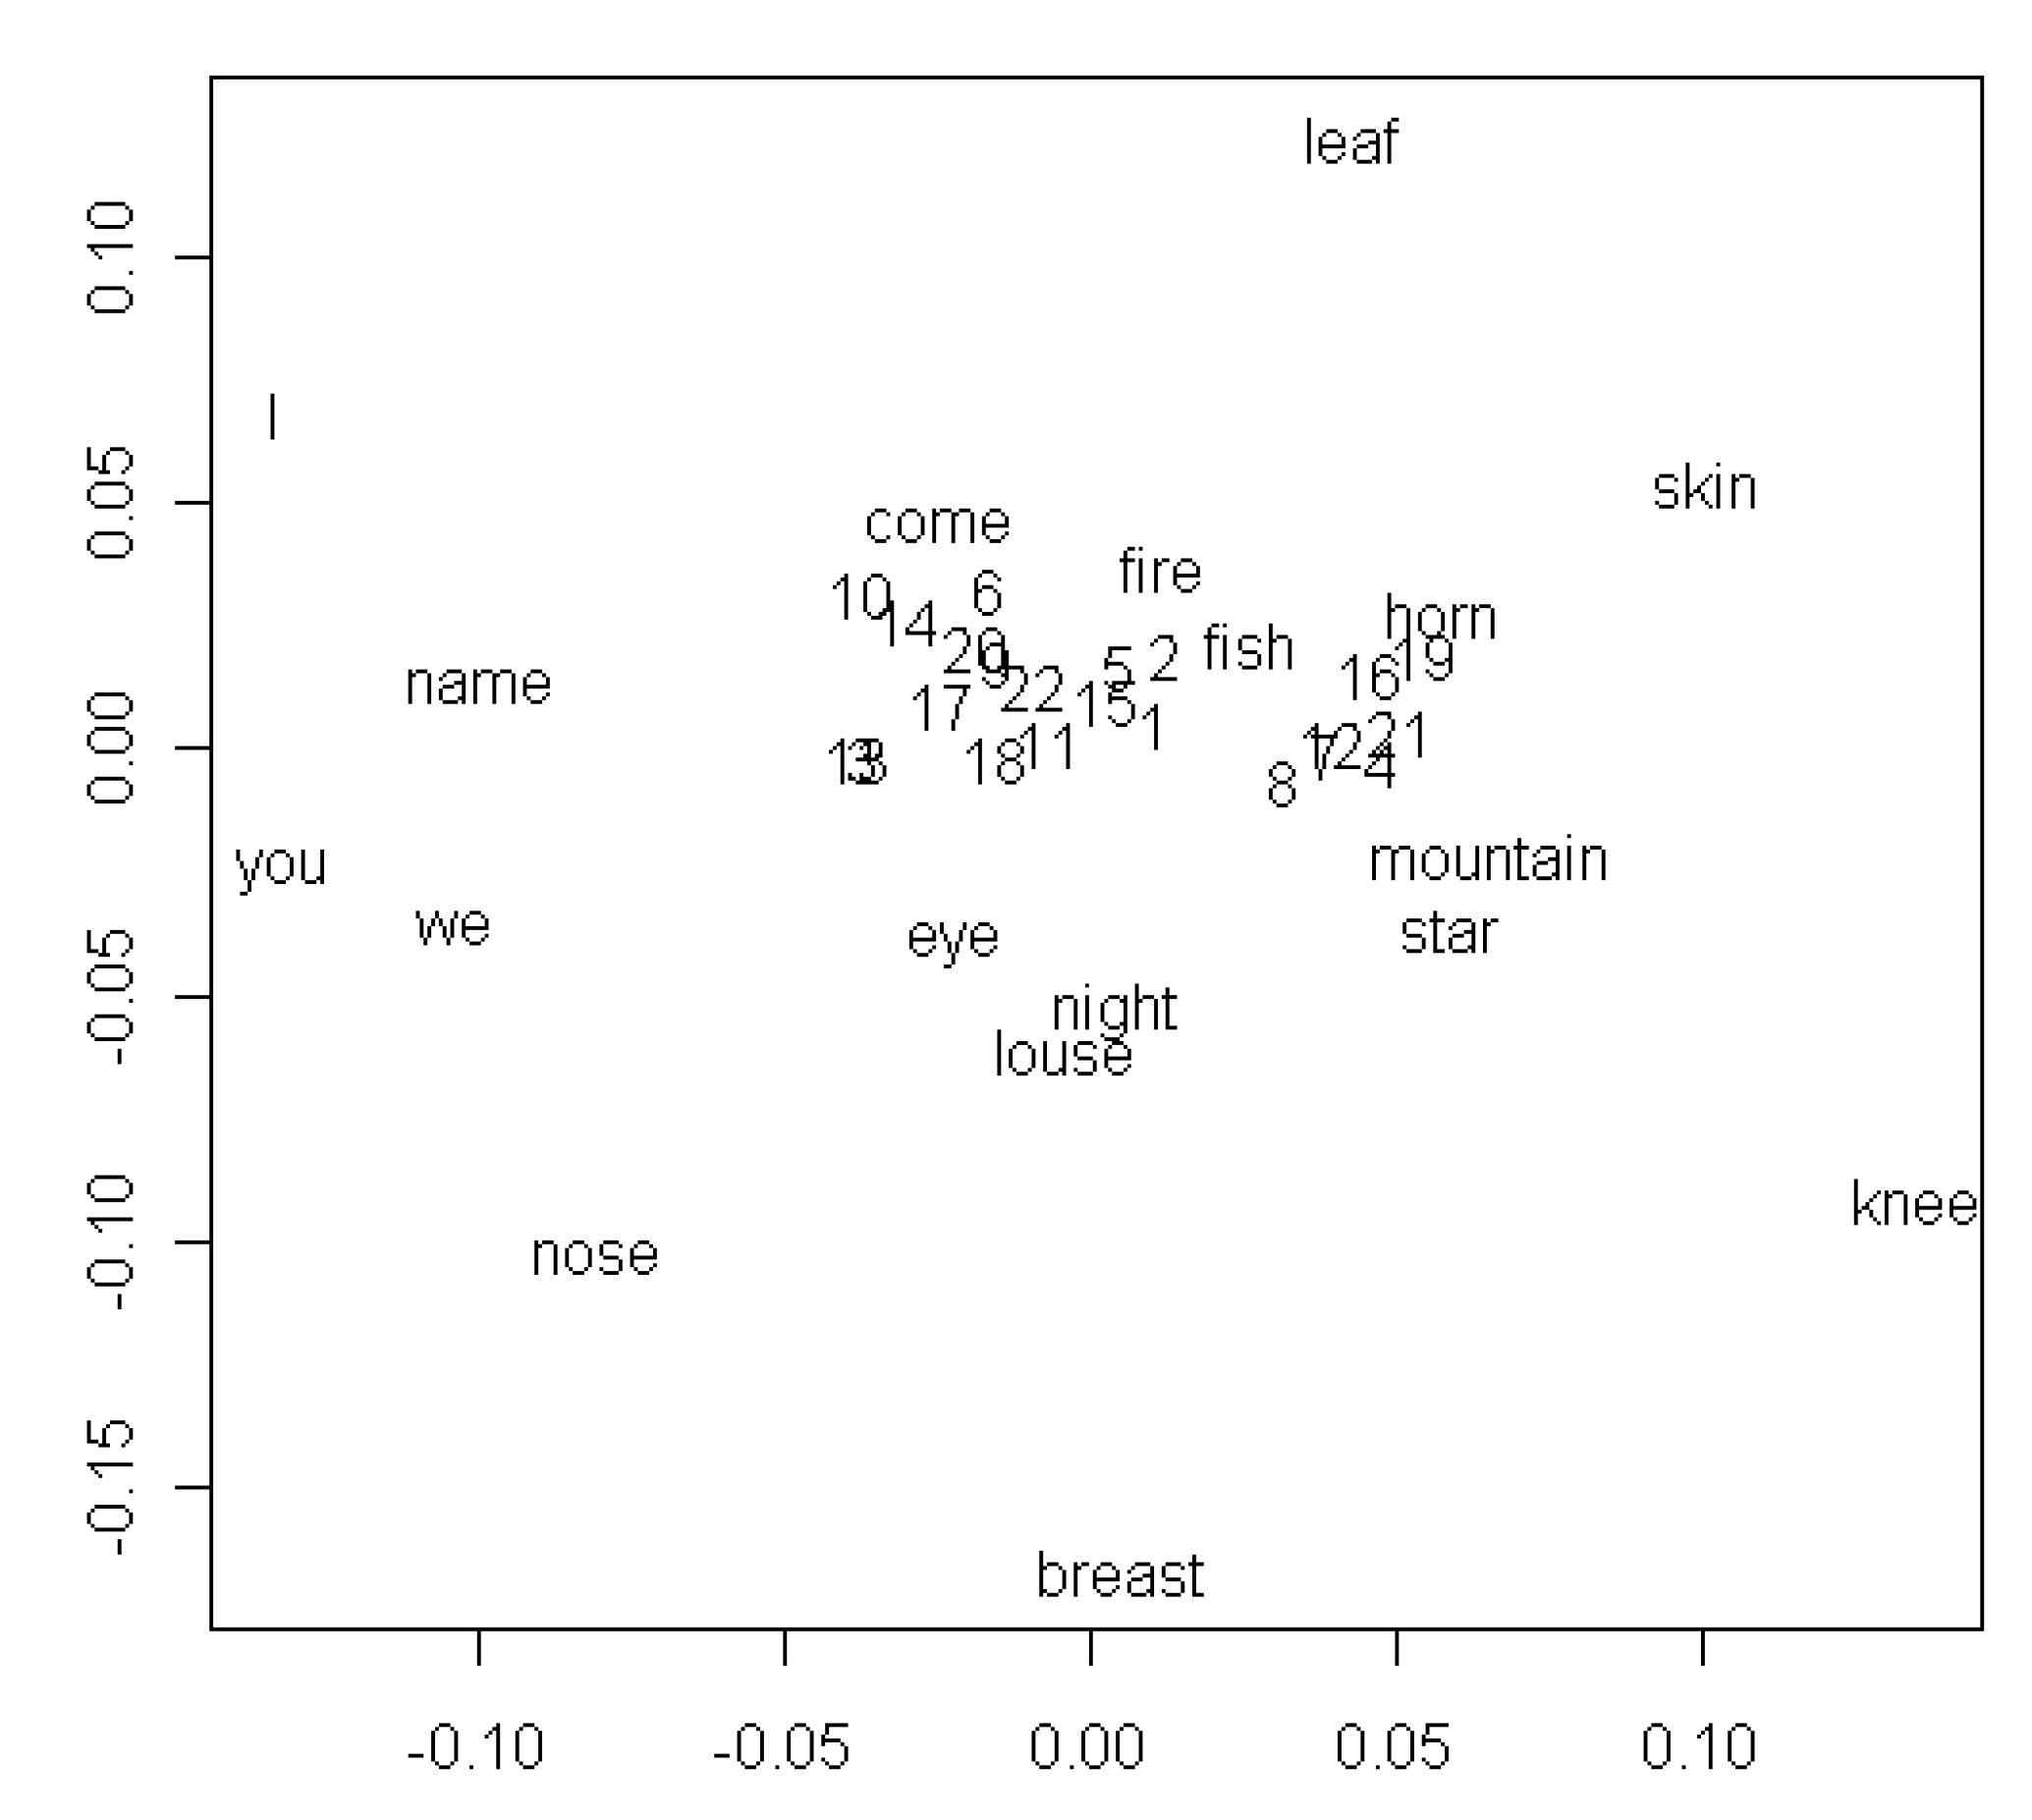
Figure 6 shows the results of MDS applied to the matrix of average correlations for all languages between the 40 concepts. Unlike Figure 3 and Figure 4, this figure offers little encouragement to interpretation. One possibly meaningful cluster appears on the left side of the figure, where the pronouns I, you, and we are joined by name. The most conspicuous feature of the configuration, however, is the dense mass of concepts near the center of the figure, which presumably corresponds to the average pattern of sounds across all concepts. Surrounding this nucleus is a diffuse halo of a few concepts with sound patterns that differ more or less from the average.
Figure 6.
MDS plots showing associations among word meanings resulting from similarities in sound patterns. Legend: 1: one, 2: two, 3: person, 4: dog, 5: tree, 6: blood, 7: bone, 8: ear, 9: tooth, 10: tongue, 11: hand, 12: liver, 13: drink, 14: see, 15: hear, 16: die, 17: sun, 18: water, 19: stone, 20: path, 21: full, 22: new.

5. Sound-Meaning Associations
The configuration in Figure 6 suggests that concepts may be characterized by the extent to which the pattern of sounds in their words differs from the average pattern of sounds across all concepts. The implementation of this idea starts once again with the 40 × 41 matrix of average relative frequencies of each sound in the words for each concept at each of the first four positions in the word. Each concept can be represented as a point in a Euclidean space with a dimension for each sound at each position, for a total of 41 × 4 or 164 dimensions; the coordinates of the point in the space are determined by the frequencies of each sound at each position. These frequencies are now averaged across concepts (rows) to obtain the overall average frequency of each sound in the words for all 40 concepts at each position; the average frequencies determine the coordinates of the centroid of the 40 points in the space. Then for each concept, D is defined as the Euclidean distance between the corresponding point and the centroid.. D measures the deviation of the sound pattern for a concept from the average sound pattern, and can thus be interpreted as a measure of the amount of sound symbolism evoked by the concept.
To test whether D is a reliable property of concepts, it is first calculated separately for the languages of the Eastern and Western Hemispheres. The correlation between the two hemispheres is 0.59. This significant correlation shows that concepts differ reliably in their degree of sound symbolism. Table 4 below therefore includes D for each concept as calculated for all languages.
Table 4.
Ninatic word shapes. D is the distance of first four segments from their overall average frequency distributions. The table is ordered by D in descending order.
| meaning | shape | D | S | meaning | shape | D | S |
|---|---|---|---|---|---|---|---|
| breast | muma | 23.68 | 30.7 | drink | iaaa | 13.49 | 25.0 |
| i | naa | 22.66 | 35.9 | star | karaaa | 13.37 | 26.6 |
| knee | kokaau | 22.50 | 28.0 | night | kanaa | 13.27 | 29.6 |
| you | nin | 21.63 | 30.6 | path | taaa | 12.85 | 30.2 |
| nose | nani | 18.76 | 27.3 | see | kana | 12.71 | 24.7 |
| name | nani | 17.53 | 32.4 | mountain | kaaaa | 12.65 | 26.2 |
| we | nina | 17.44 | 25.4 | bone | kaka | 12.55 | 30.1 |
| skin | kaaa | 17.30 | 29.6 | fish | aaia | 12.44 | 33.4 |
| leaf | aaaa | 17.22 | 29.4 | liver | kanaa | 12.31 | 35.7 |
| tongue | aanaa | 16.52 | 30.1 | eye | naki | 12.05 | 35.4 |
| horn | kaaaa | 15.98 | 28.8 | ear | kaaaa | 11.97 | 37.2 |
| louse | kami | 15.60 | 42.8 | tooth | kaia | 11.79 | 30.7 |
| come | haaa | 15.54 | 26.8 | hear | naaaa | 11.53 | 33.8 |
| dog | kaaaa | 15.24 | 24.2 | blood | aaaa | 11.33 | 29.0 |
| stone | kaaa | 14.12 | 32.1 | die | kaaa | 11.32 | 36.3 |
| fire | kaaa | 14.09 | 25.7 | new | kamaa | 11.17 | 24.3 |
| person | nanaa | 14.04 | 28.7 | two | aaaaa | 11.10 | 39.8 |
| full | kaiaa | 13.99 | 26.9 | one | tanaa | 10.93 | 27.4 |
| hand | maka | 13.97 | 34.9 | tree | aaaa | 10.88 | 33.6 |
| water | kaa | 13.74 | 37.4 | sun | kana | 10.38 | 24.2 |
In Section 3 above we presented a test of whether what we interpret as sound symbolism might instead be a signal of a deep genealogical relation between all or most of the languages in the world. The D values allow us to make an additional test. If higher values of D are due to inheritance there should be a correlation between D and the degree of diachronic stability of the words referring to each concept. In [5] we presented results of measuring stabilities for items on the Swadesh list, resulting in the indices presented in the columns headed by S in Table 4. These S values represent the relative tendencies for words for the concepts in question to be cognate within groups of relatively closely related languages referred to as ‘genera’ in [13] (cf. [5] for further explanation). The correlation between D and S is –0.05, not significantly different from zero. In conclusion, the kinds of words that tend to be inherited (rather than innovated or borrowed) are not the kinds of words that tend to show sound symbolism. We therefore argue, again, that inheritance is not a viable explanation for the effects that we interpret as being due to sound symbolism.
Table 4 also presents the typical shapes of words for the 40 meanings, constructed in the following manner. For each meaning, we first construct the typical length of words by including positions that are filled in the words for the given meaning in more than one half of the languages, and then we insert the sound that is most frequent for the given concept at each position. We name this construct ‘Ninatic’ since the typical word for we is nina (and using the term ‘Nostratic’ as an onomastic model). For comparison, the same procedure applied to the overall average frequency distributions yields kaaa as the overall average word shape. Concepts with high D values are expected to have Ninatic words that differ most from this average.
The Ninatic lexical inventory should be interpreted with caution. From Figure 6 above we know that only a few meanings tend to have phonologically distinctive word shapes, namely breast, i, knee, you, nose, name, we, skin, leaf. The D values further reflect their distinctiveness since the items in question are the ones with the highest values. While Figure 6 suggested that all eight items just listed are distinctive, the Ninatic shapes of skin and leaf, which are quite generic in nature, show that these two items are at best borderline cases, not highly susceptible to sound symbolism. The remaining six items, breast, i, knee, you, nose, name, and we, however, offer themselves to meaningful interpretations.
breast throughout its first three segments contains sounds articulated with the lips, reflecting the engagement of the suckling child.
i and you are in paradigmatic contrast, using the consonant n, which is common, but notably also the same in the two words, plus the different vowels a and i to signal the deictic contrast. Perhaps the different gestures of the tongue are relevant for explaining why a is associated with the speaker and i with the hearer: under the pronunciation of a the tongue rests in a neutral position, whereas the pronunciation of i requires a fronted position, almost as if it were pointing towards the interlocutor. The fact that the words for you and i are among the shorter ones in the list fits the well-known observation that there tends to be an inversely proportional relationship between the length of words and their frequencies [18]. Interestingly, we combines the sounds of you and i. (It should be noted in this connection that whenever languages have a contrast between inclusive we [=i + the listener + perhaps others] and exclusive we [=i + others, not including the listener] the ASJP database contains the inclusive and not the exclusive we). The result is all the more interesting since it makes sense even if only a single language in the database, Egyptian Arabic, exhibits the exact shape of the Ninatic word for we. Thus, this particular result could not have been arrived at by non-systematic inspection of common word shapes associated with we. It is known from cross-linguistic research that first person plural inclusive pronouns are often composed of first and second person singular pronouns [19]. The exercise of constructing Ninatic not only confirms the broad validity of this observation but does it through an entirely objective procedure which, moreover, achieves the assignment of specific sounds of speech to the prototypical word for we.
The Ninatic word for knee kokaau is less straightforward to interpret. Perhaps there is something about the combination of the qualities hard and round that invites respectively a consonant like k and a round vowel like o or u. We note that bone kaka similarly contains a sequence of two k’s. Since the sounds making up bone are less distinctive, cf. the relatively low D-value for this item, it is perhaps exaggerated to attempt to interpret this. Nevertheless, we speculate that there may be an association as regards the general kVkV structures, a kind of association which, according to [20], often affects so-called ‘congeneric’ classes of words and which is classified under the rubric of ‘secondary phonesthemes’ in [21].
With regard to nose, nani, we have little to say apart from the obvious observation that it appropriately contains two nasals.
Finally, name lends itself to the interpretation that there is an association linking together the congeneric concepts i naa, name nani, and perhaps person nanaa. These concepts are so closely associated that one may imagine how they might even be homophonous in some primitive Ur-Ursprache.
The inspection of the basic Ninatic vocabulary has produced some qualitative insight in addition to the quantitative observations made in previous parts of the paper. With regard to the syllable structure we know from Figure 1 above that there is a preference for consonant-vowel sequences in our data. The Ninatic forms in Table 4 do not always represent this structure well because the vowel a is often the most frequent even in the third and fifth positions, presumably because of CC clusters within the words from which the typical distributions were established. The length of words nevertheless reveals what would be a preference for two syllables, and the CV structure is indirectly underscored by the absence of VC sequences. The slots of this general template are filled with sounds that sometimes have sound symbolic connotations. These may enter into paradigmatic contrast (i vs. you). Additionally, syntagmatic combinatorics (we) and congeneric associations (i-name-person, knee-bone) are mechanisms that help to develop the vocabulary further out of a few non-arbitrary building stones. The greater part of the vocabulary may not be affected by sound-symbolism, but 18% (breast, i, knee, you, nose, name, we) clearly is, and the effects of such words extend to others.
5. Conclusions
In spite of the much-acclaimed Saussurean principle of the arbitrariness of the linguistic sign linguists have always been aware that all languages exhibit sound symbolic effects violating this principle. Linguists would probably vary in their estimates regarding the degree to which such effects permeate languages, and it is likely that the estimate of [22] that 91% of the English vocabulary is to some degree non-arbitrary is an extreme one. Nevertheless, hardly anyone would deny that sound symbolism is of importance to the way human languages innovate lexical items. Thus, the conclusions of the present study are perhaps not surprising. These conclusions, however, were arrived at through a much more exhaustive sampling of languages and a more quantitative rigor than commonly encountered in studies of the topic.
Using lists of words all denoting the same 40 basic concepts in more than half of the world’s languages we conclude that sound symbolism is pervasive enough that it gives rise to both sound-sound associations, meaning-meaning associations, and sound-meaning associations. Since certain sounds and positions have intrinsic meaning, all sounds—or at least the most frequent ones—cluster with phonetically related sounds with regard to preferred positions in words referring to the same concepts in unrelated languages. Words sharing categories of meaning may also cluster with regard to sound patterns expressing the meanings in question, but given the limited sample of just 40 concepts studied here it was only possible to note this effect for the cluster i-you-we-name. Finally, certain sounds tend to recur in the words for certain meanings, leading to prototypical word shapes such as muma breast, naa i, kokaau knee, nin you, nani nose, nani name, nina we. In our small sample of frequent, culture-neutral and stable words at least 18% are clearly affected by sound symbolism.
While the construction of our phonologically prototypical ‘Ninatic’ lexicon does not amount to a reconstructed proto-language in the normal sense, it is probably nevertheless the closest we may hope to come to the language spoken by the first humans to develop a true linguistic system. This system would have been characterized by a preference for CV syllables and disyllabic words, although shorter or longer words would also occur. Words for many concepts would be constructed in an unconscious manner by means of relatively subtle sound symbolic means, and from such basic building blocks other words would be constructed through extensions of sound patterns among words sharing semantic features, through the creations of paradigmatic contrasts, and through compositional means. Once the habit arose of combining sounds in conventional ways to denote elements of meaning there would, however, already be an ingredient of arbitrariness involved in the process, since the imitative capacities of speech sounds are severely limited in comparison to the richness of objects and events of the physical world. Thus, it would seem ill-advised not to assume that arbitrariness and the act of symbolizing went hand in hand from the very beginning when the ultimate mother (or mothers) of present-day languages came about.
Acknowledgements
We thank Ramon Ferrer i Cancho, Bernard Comrie, Reuven Tsur, and two anonymous referees for helpful comments on earlier versions of this paper.
References and Notes
- Ohala, J.J. The frequency code underlies the sound-symbolic use of voice pitch. In Sound Symbolism; Hinton, L., Nichols, J., Ohala, J.J., Eds.; Cambridge University Press: Cambridge, UK, 1994; pp. 325–347. [Google Scholar]
- Wichmann, S.; Müller, A.; Velupillai, V.; Brown, C.H.; Holman, E.W.; Brown, P.; Urban, M.; Sauppe, S.; Belyaev, O.; Molochieva, Z.; Wett, A.; Bakker, D.; List, J.-M.; Egorov, D.; Mailhammer, R.; Geyer, H. The ASJP Database (Version 12). Available online: http://email.eva.mpg.de /~wichmann/ languages.htm (accessed on 3 April 2010).
- Lewis, M.P. (Ed.) Ethnologue, 16th ed.; SIL International: Dallas, TX, USA, 2009.
- Swadesh, M. Towards greater accuracy in lexicostatistic dating. Int. J. Am. Ling. 1955, 21, 121–137. [Google Scholar] [CrossRef]
- Holman, E.W.; Wichmann, S.; Brown, C.H.; Velupillai, V.; Müller, A.; Brown, P.; Bakker, D. Explorations in automated language comparison. Folia Linguistica 2008, 42, 331–354. [Google Scholar] [CrossRef]
- Brown, C.H.; Holman, E.W.; Wichmann, S.; Velupillai, V. Automated classification of the World's languages: A description of the method and preliminary results. STUF—Lang. Typology Univ. 2008, 61, 285–308. [Google Scholar] [CrossRef]
- In addition to [5], a series of working papers are devoted to comparing the results of automated classification of individual language families with classifications by experts using the standard comparative method; these papers are posted on http://email.eva.mpg.de/ ~wichmann/papers.htm.
- Wichmann, S.; Müller, A.; Velupillai, V. Homelands of the world’s language families: A quantitative approach. Diachronica 2010, in press. [Google Scholar] [CrossRef]
- Jespersen, O. Linguistica: Selected Papers in English, French and German; Levin & Munksgaard: Copenhagen, Denmark, 1933; pp. 283–303. [Google Scholar]
- Ultan, R. Size-sound symbolism. In Universals of Human Language, Volume 2: Phonology; Greenberg, J.H., Ed.; Stanford University Press: Palo Alto, CA, USA, 1978; pp. 525–568. [Google Scholar]
- Diffloth, G. i: big, a: small. In Sound Symbolism; Hinton, L., Nichols, J., Ohala, J.J., Eds.; Cambridge University Press: Cambridge, UK, 1994; pp. 107–114. [Google Scholar]
- Berlin, B. The first congress of ethnozoological nomenclature. J. Roy. Anthrop. Inst. (N.S.) 2006, S23–S44. [Google Scholar] [CrossRef]
- Haspelmath, M.; Dryer, M.; Gil, D.; Comrie, B. (Eds.) The World Atlas of Language Structures; Oxford University Press: Oxford, UK, 2005.
- Clements, G.N.; Keyser, S.J. CV Phonology. A Generative Theory of the Syllable; M.I.T. Press: Cambridge, MA, USA, 1983. [Google Scholar]
- Cronbach, L.J.; Gleser, G.C. Assessing similarity between profiles. Psychol. Bull. 1953, 50, 456–473. [Google Scholar] [CrossRef] [PubMed]
- Torgerson, W.S. Theory and Methods of Scaling; Wiley: New York, NY, USA, 1958. [Google Scholar]
- Cailliez, F. The analytical solution of the additive constant problem. Psychometrika 1983, 48, 343–349. [Google Scholar] [CrossRef]
- Zipf, G.K. Human Behavior and the Principle of Least-Effort; Addison-Wesley: Cambridge, MA, USA, 1949. [Google Scholar]
- Cysouw, M. The Paradigmatic Structure of Person Marking; Oxford University Press: Oxford, UK, 2003. [Google Scholar]
- Bloomfield, M. On assimilation and adaptation in congeneric classes of words. Am. J. Phil. 1895, 16, 409–434. [Google Scholar] [CrossRef]
- Bolinger, D. Sound symbolism. In International Encyclopedia of Linguistics; Bright, W., Ed.; Oxford University Press: New York, NY, USA, 1992; Volume 4, pp. 28–30. [Google Scholar]
- Householder, F.W., Jr. On the problem of sound and meaning: An English phonestheme. Word 1946, 2, 83–84. [Google Scholar]
© 2010 by the authors; licensee MDPI, Basel, Switzerland. This article is an open access article distributed under the terms and conditions of the Creative Commons Attribution license (http://creativecommons.org/licenses/by/3.0/).
Share and Cite
MDPI and ACS Style
Wichmann, S.; Holman, E.W.; Brown, C.H. Sound Symbolism in Basic Vocabulary. Entropy 2010, 12, 844-858. https://doi.org/10.3390/e12040844
AMA Style
Wichmann S, Holman EW, Brown CH. Sound Symbolism in Basic Vocabulary. Entropy. 2010; 12(4):844-858. https://doi.org/10.3390/e12040844
Chicago/Turabian StyleWichmann, Søren, Eric W. Holman, and Cecil H. Brown. 2010. "Sound Symbolism in Basic Vocabulary" Entropy 12, no. 4: 844-858. https://doi.org/10.3390/e12040844