3.1. Transformation of the Townsend Equations
Crepeau [
28] studied the behavior of the spectral entropy in the axial direction of a transitional boundary layer for a specified vertical location (η = 5.0), with the Reynolds number based on the axial distance x as the control parameter. A modified form of the Townsend equations was used to calculate the spectral entropy behavior in the boundary-layer flow. The results of this study imply the development of a fluid instability arising near the wall and propagating upwards. The important results obtained by Crepeau [
28] warrant further investigation to evaluate the characteristics of the implied upward “burst” of instability through the boundary layer.
Considerable effort has recently been devoted to the study of the transition of laminar boundary layers brought about by the existence of free-stream disturbances. A thorough review of both mathematical and experimental results has been presented in the collection of articles edited by Gad-el-Hak and Tsai [
29]. Recent work has been presented in [
30,
31,
32,
33,
34]. These references present an extensive review of the recent work in this field and hence a review of this work will not be repeated here. However, several aspects of the so-called by-pass transition process are essential to our mathematical model and hence will be discussed here. One of the essential aspects of these studies is the evidence that strong free-stream turbulence produces elongated stream wise structures with narrow span wise scales. These disturbances apparently give rise to a periodic modulation of the stream wise velocity. We will use the results of [
29,
30,
31,
32,
33,
34] to further investigate the possibilities of the existence of vertical bursts occurring near the wall in a boundary-layer flow, as implied in the results of [
28].
The Navier-Stokes equations describing this flow are transformed through a Fourier analysis into a Lorenz-type format, specifically keeping the nonlinear coupling terms. The coefficient of the nonlinear terms is simplified into a form obtained from the perturbation theory of non-relativistic quantum mechanics as described by Landau and Lifshitz [
35]. Using the Fourier expansion procedure as presented by Townsend [
5], the equations of motion for the boundary-layer flow may be separated into steady plus fluctuating values of the velocity components. The velocity fluctuations around the mean values of the velocity components will thus be of primary interest. The equations for the velocity fluctuations may be written as follows [
5]:
In these equations,
ν is the kinematic viscosity. The pressure term may be transformed as:
In these expressions, the mean velocity components are denoted by Ui, with i = 1,2,3 representing the x, y, and z components, while xj, with j = 1,2,3, denote the x, y, and z distances. The three mean velocity components and the nine gradients in the mean velocities are obtained from the solutions for the boundary-layer flow as outlined in previous sections.
As Townsend [
5] points out, the pressure is determined by the velocity and temperature fields and is not a local quantity but depends on the entire field of velocity and temperature. The elimination of the pressure fluctuation term introduces nonlinear coupling between the velocity coefficients. In our work here, we will introduce an internal feedback mechanism that will model the nonlinear interaction process but will allow the resulting equations to be integrated in time. The velocity fluctuations may be expanded in terms of a sum of Fourier components as:
The variation with time of each Fourier component of the fluctuation field is then given by the equation for each of the velocity wave vector amplitudes:
The equations for the rate of change of the wave numbers are:
The equations for the fluctuating velocity components may be transformed by Fourier expansion into a form similar to Lorenz-type equations, as shown by Hellberg and Orszag [
36] and Isaacson [
6,
7]. The equations resulting from the transformation process have been presented in other publications and references to them may be found in [
6].
In the mathematical model used in this study, the coefficients in the set of differential equations for the variation of the wave numbers are replaced by periodic functions of the form cos(ω
0t), where ω
0 is an amplification factor for the frequency of the periodic disturbances. This set of equations forms a set of external control parameters, as discussed by Klimontovich [
37]. A second set of internal control parameters is provided by the values of the mean velocity gradients determined in the solution of the boundary-layer flow as discussed in previous sections.
The computational solution of the nonlinear Townsend equations for the fluctuating components of the velocity wave vectors in our study is aided by the introduction of these two sets of feedback parameters. The first set of parameters is obtained by the
ad hoc replacement of the gradients of the mean velocities that appear in Equation (36) by a periodic cosine function [
37] as follows:
In these expressions, ω
0 is an externally applied frequency factor, held constant at ω
0 = 4.0 throughout the computations. The initial values for the wave numbers are:
With this approximation, we uncouple the continuity equations for the wave numbers from the solutions of the deterministic equations for the velocity fluctuation wave vectors. The solution of these equations for the time dependent wave numbers provides results that are stored in files available for input into the computational solutions of the deterministic equations for the fluctuating velocity coefficients. These results for the wave numbers represent the influence of the externally applied free-stream disturbances across all of the boundary layer vertical stations for which solutions of the deterministic equations will be sought.
A preliminary evaluation of the results of the computations of the deterministic equations for an amplitude of unity for the cosine functions and a frequency factor of ω0 = 4.0 yielded consistent results for the computations. However, for deterministic equations of the Lorenz-type, the results are very sensitive to the values of the external control parameters. We are therefore exploring the behavior of the computational results for the deterministic equations for various values of input amplitude of the cosine functions and for various values of the frequency factor. These results will be reported in a future paper.
The next approximation is to the set of first-order nonlinear differential equations describing the equations of motion of the fluctuating velocity components. We substitute the term
as the coefficient of the nonlinear terms in the equations for the time rate of change of the
coefficients. In this expression [
38,
39]:
where
is an
ad hoc adjustable weight of the perturbation and
is the magnitude of the time-dependent wave vector given by:
The value for has been arbitrarily set to 0.10, which allows the computations to remain stable throughout the time step range for each of the vertical stations examined. Variations in the value of K1 will be examined in the on-going numerical study of the effects of the external control parameters on the solutions of the deterministic equations describing the flow instabilities.
The three deterministic equations for the velocity coefficients may then be written as:
Note that the perturbation factor
is applied to the nonlinear terms in the equations for
and
, and not to one of the directly accessible dependent variables. This is a significant change from the practice in the study of synchronization and chaos [
38,
39]. The form of the perturbation factor and the application of the factor to the nonlinear terms are motivated by the perturbation analysis of the wave functions in non-relativistic quantum mechanics. This has been demonstrated by a specific example reported in [
35]. The application of the perturbation factor in this fashion implies that the nonlinear terms in the first-order equations for the velocity fluctuations represent transition probabilities from an initial state to a secondary state.
The second set of feedback parameters [
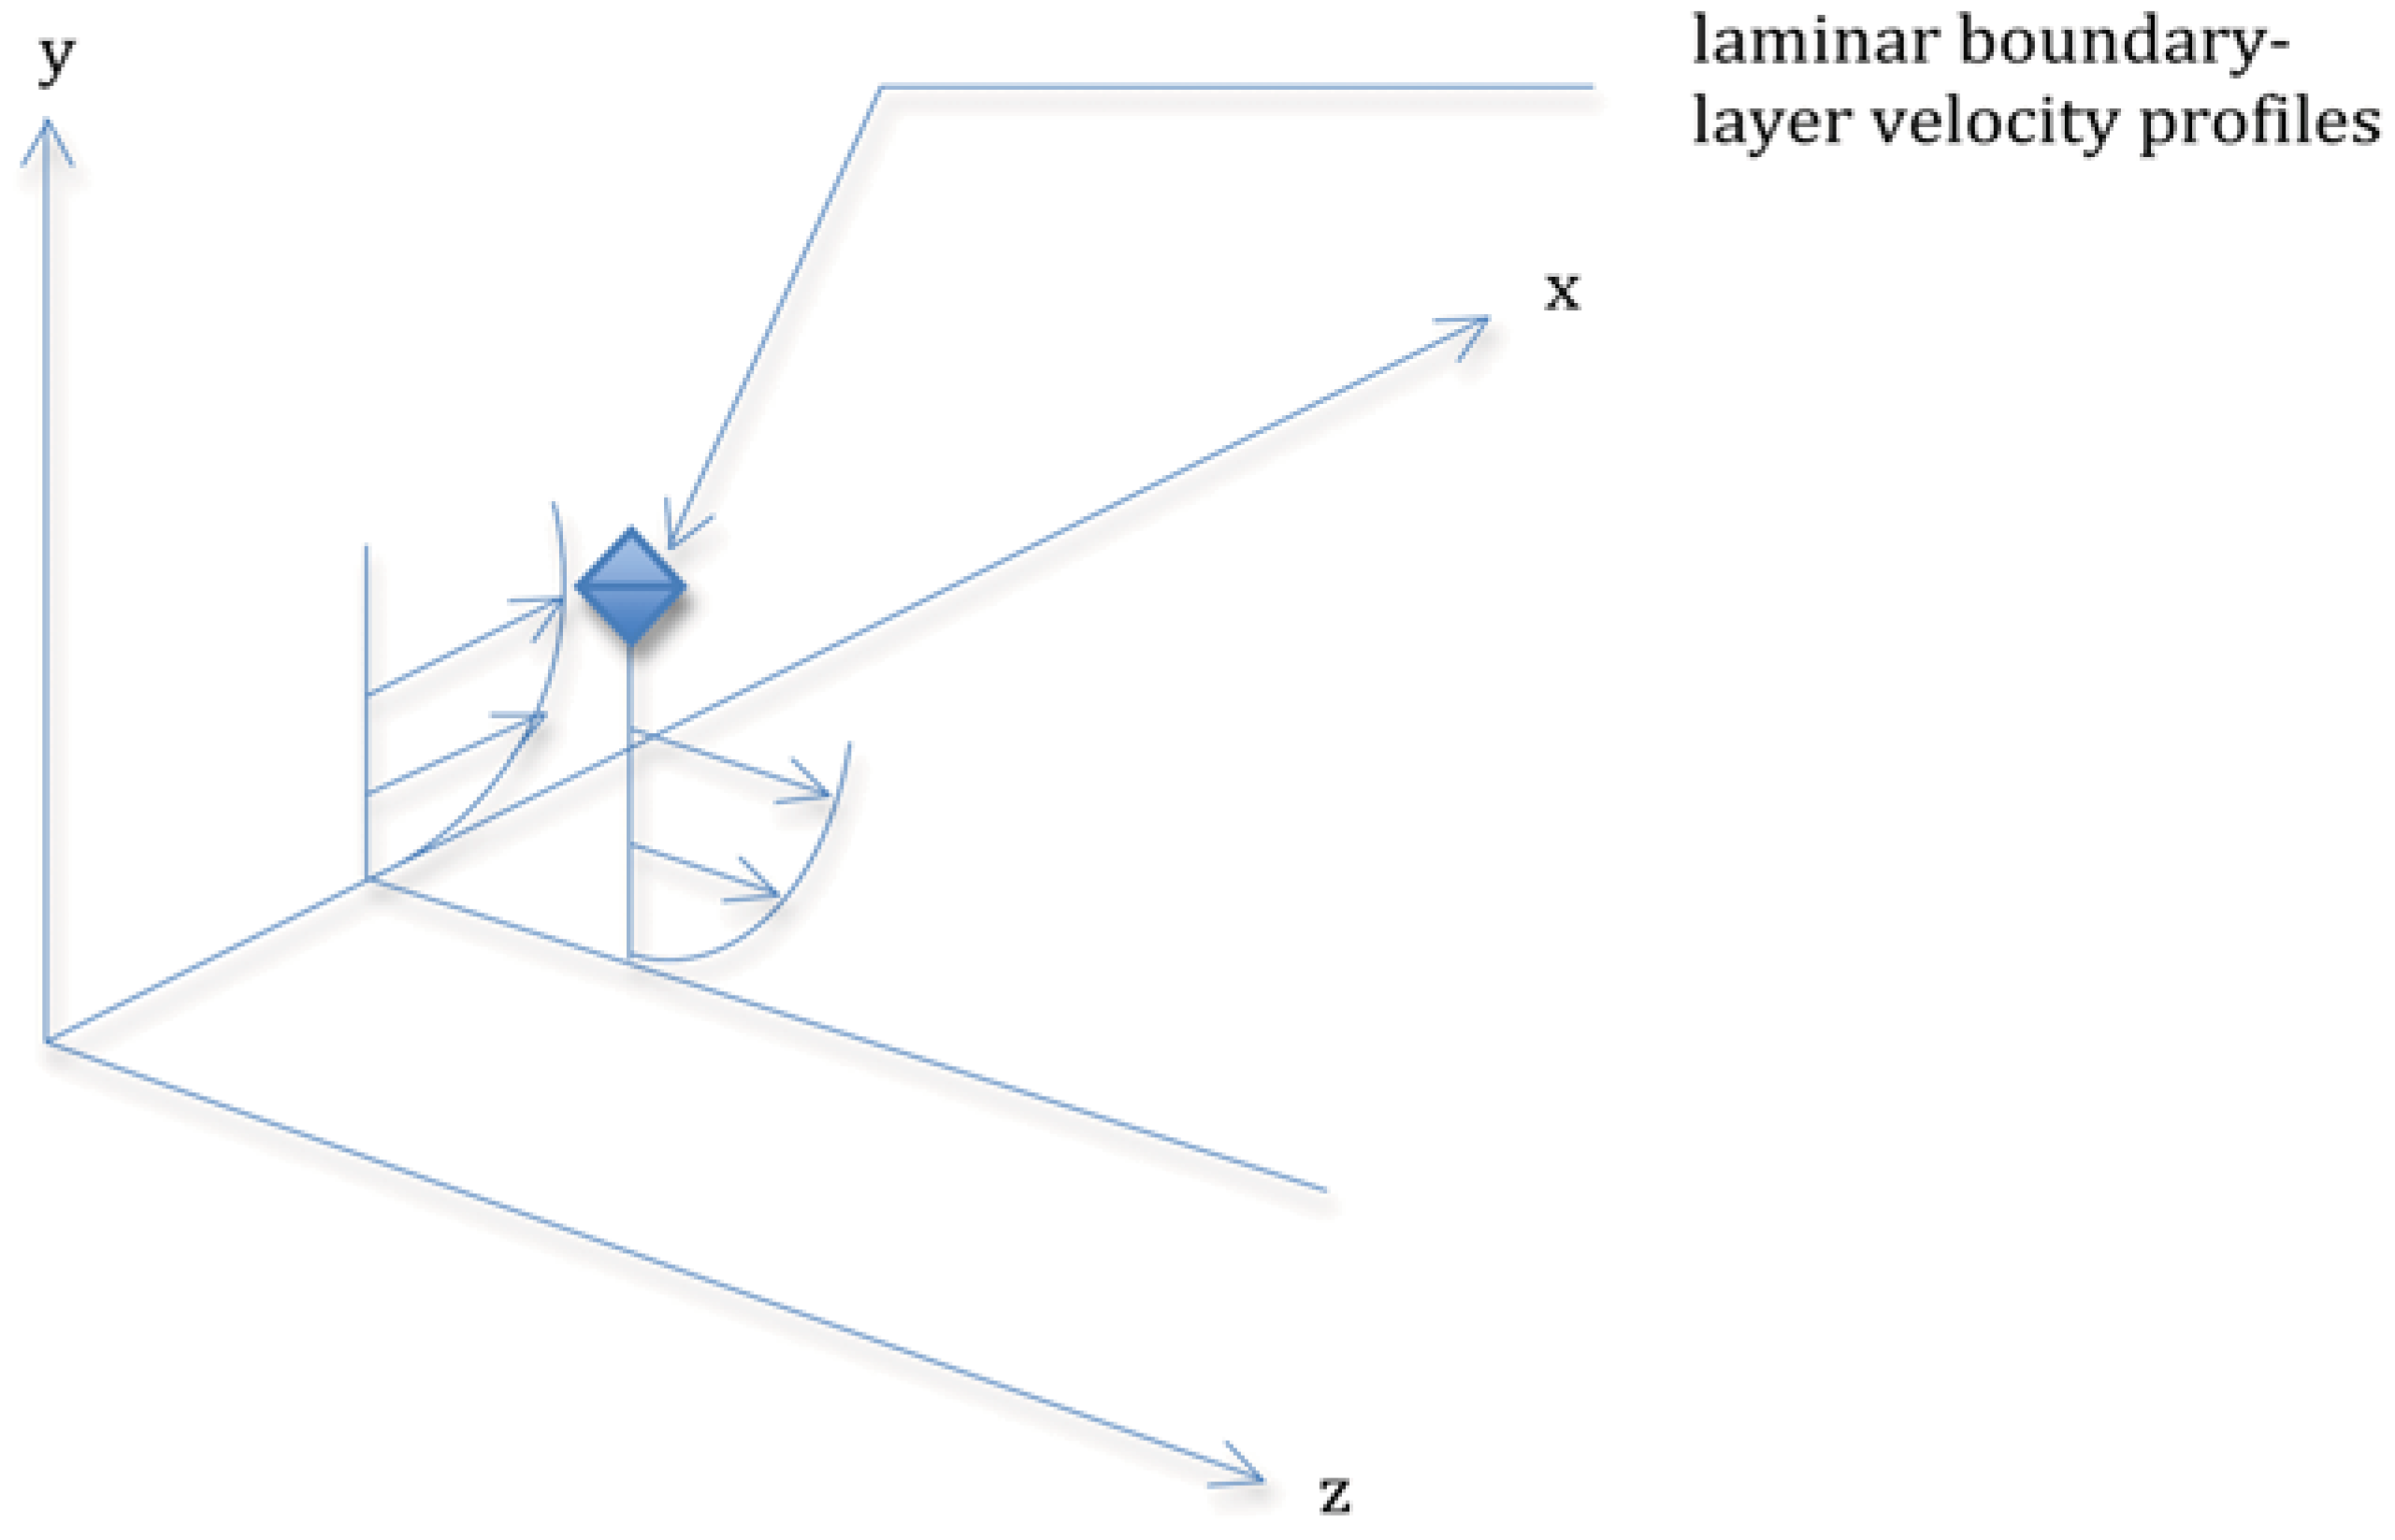
37] are internal to the boundary-layer flow and consists of the set of values obtained for the various mean velocity gradients at each vertical station, j (η), in the laminar boundary layer at the axial station nx = 4 (x = 0.08) and the span wise station nz = 4 (z = 0.08). The equations for the mean velocity gradients in the x-y and y-z planes of the boundary-layer flow are obtained from the solution of the boundary layer environment as described in previous sections. The computational results, stored in external files, provide the gradients of the various mean velocities at the specified vertical locations within the laminar boundary layer at the axial station nx = 4 (x = 0.08), with the computations at each vertical location proceeding from the wall surface to the outer boundary of the shear layer.
The theoretical modeling of the internal flow instabilities within the boundary-layer flow consists of six simultaneous first-order differential equations, to be solved at each vertical station within the wall shear layer. The mean velocity gradients are obtained at each vertical station from the overall solution of the boundary layer equations, together with the thermodynamic and viscous properties of the fluid involved. The solution of the set of equation describing the flow instabilities yields the velocity-fluctuation wave-vectors in three-dimensions for each of the vertical stations within the wall shear layer at the axial station of nx = 4 (x = 0.08). The initial values of the fluctuating velocity wave-vectors are:
The equations are integrated using a fourth-order Runge-Kutta technique with computer source codes as presented by Press
et al. [
40]. First, the three first-order differential equations for the wave numbers are integrated in time with the resulting series stored to files on the hard drive. A time step of 0.0001 s is used with a total of 12,288 time steps included in the integration process. The resulting time-series are stored in external data files. These data files thus become available for the spectral analysis as described in the next section.
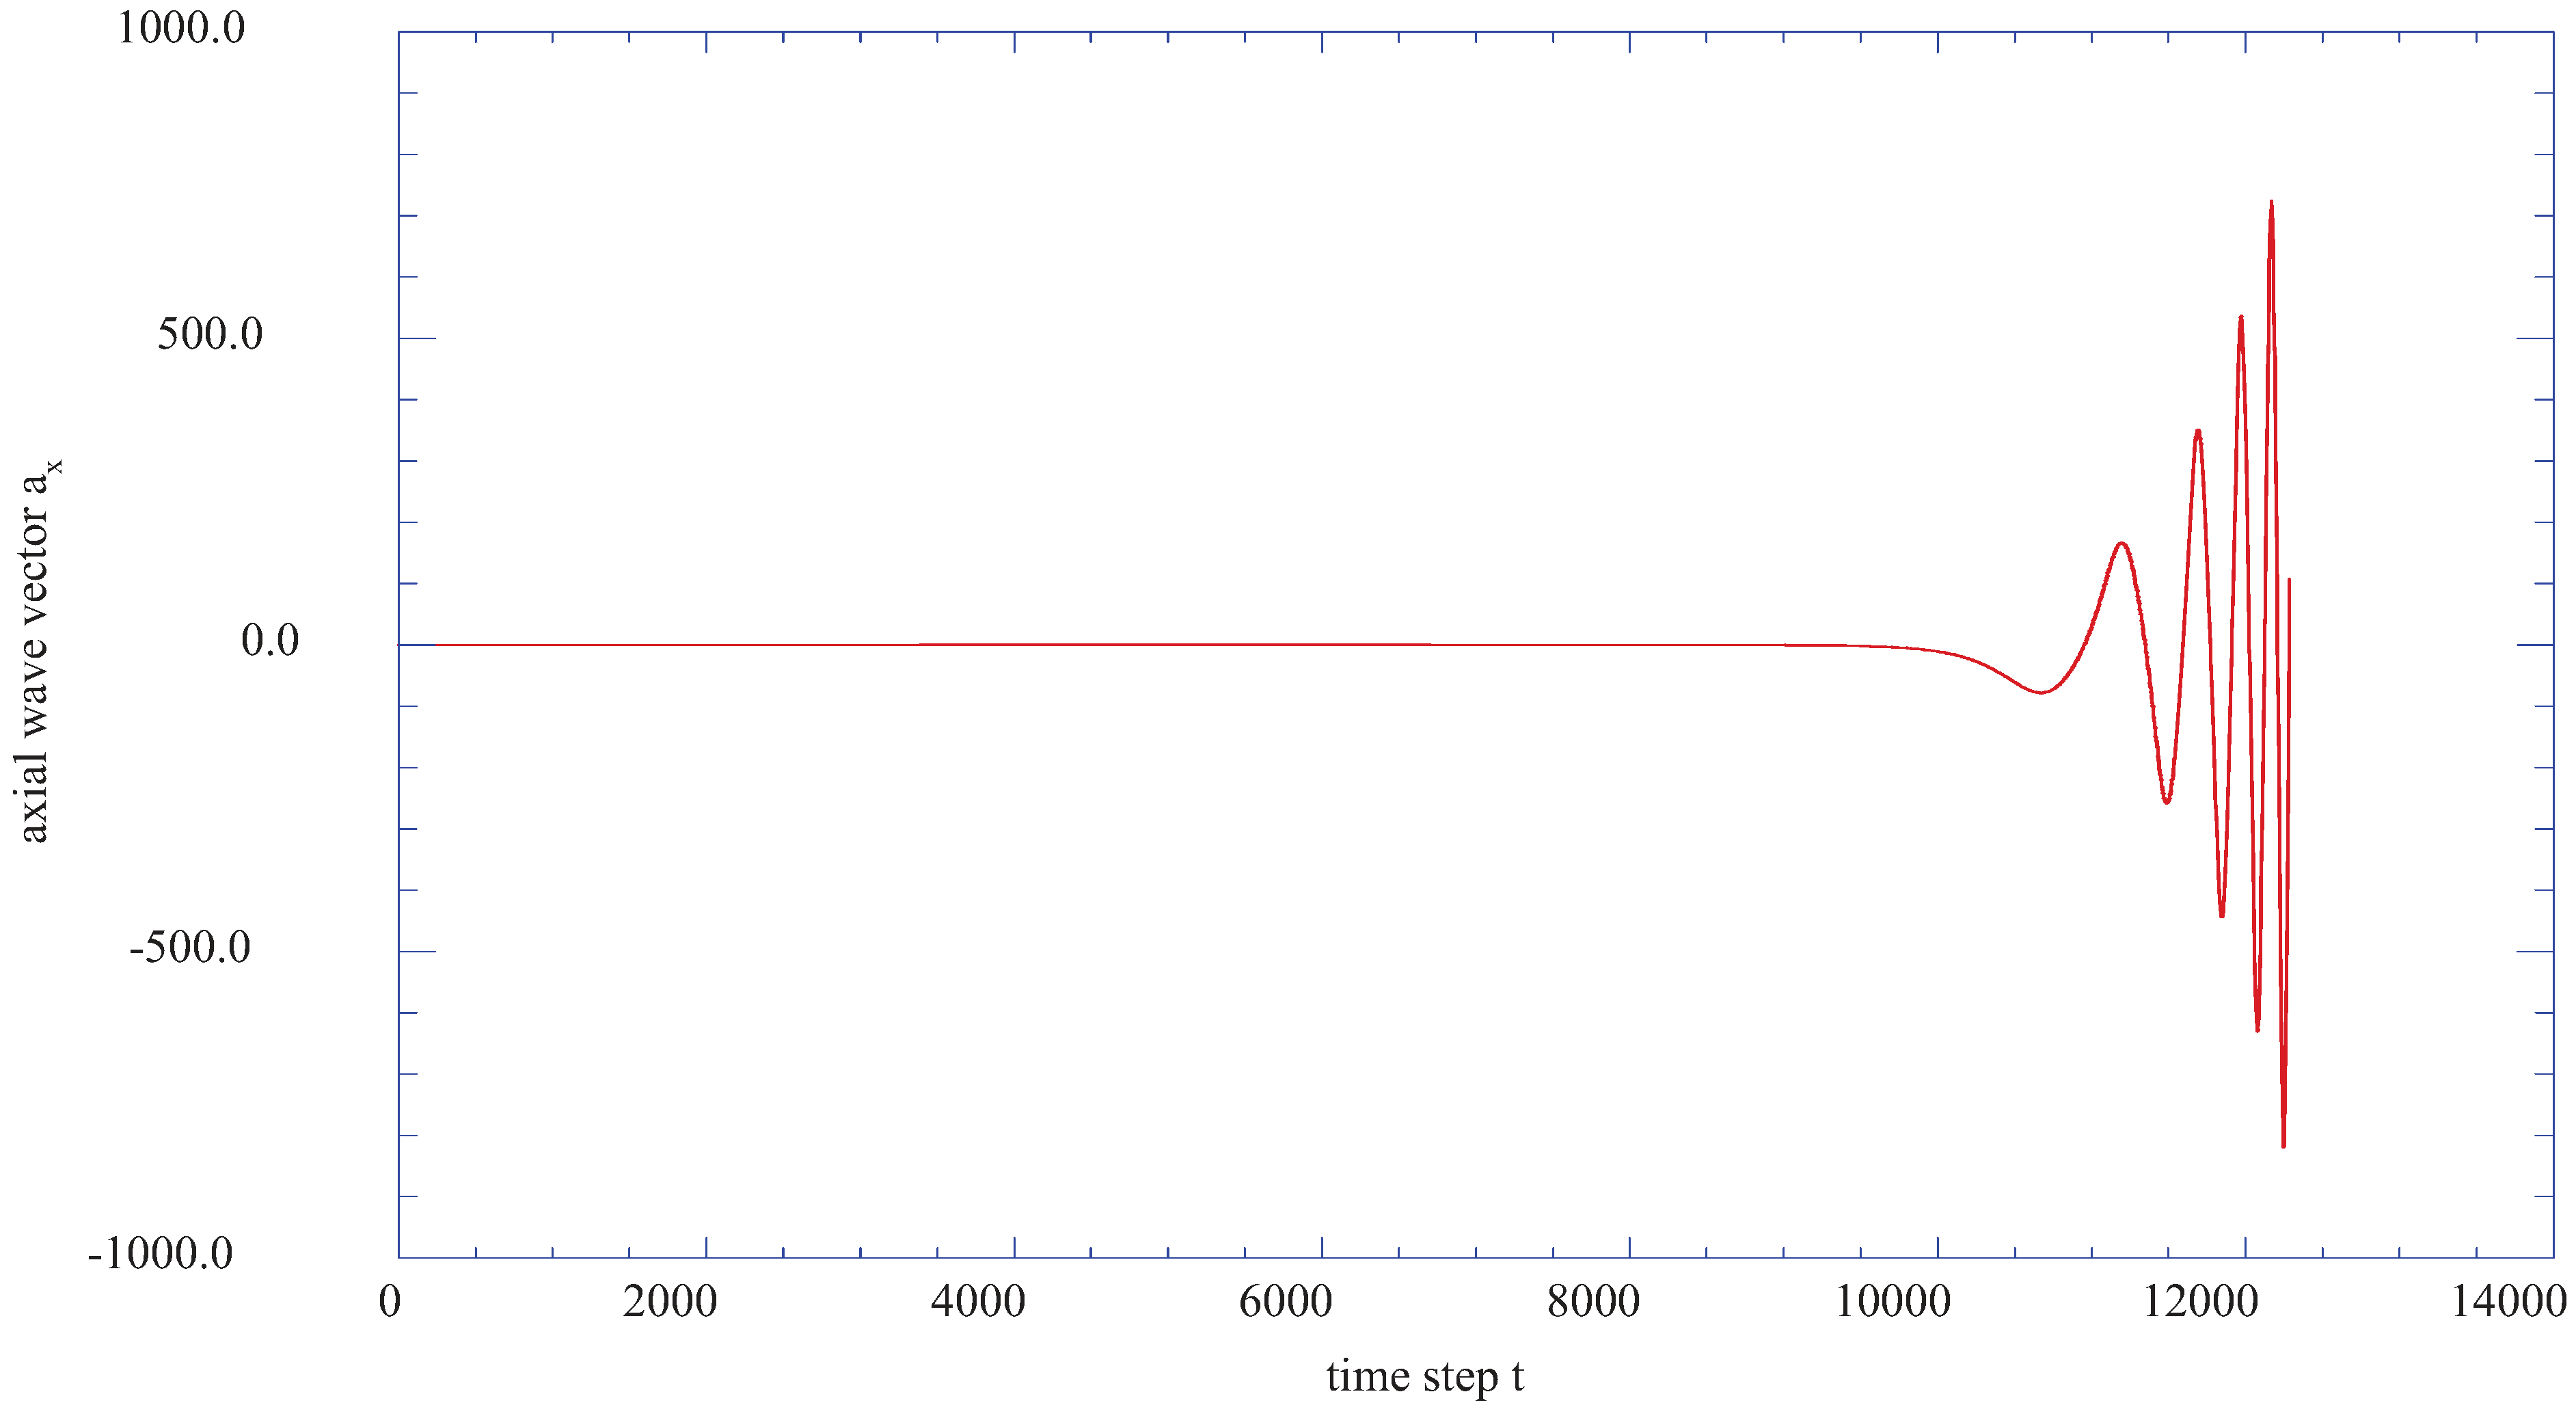
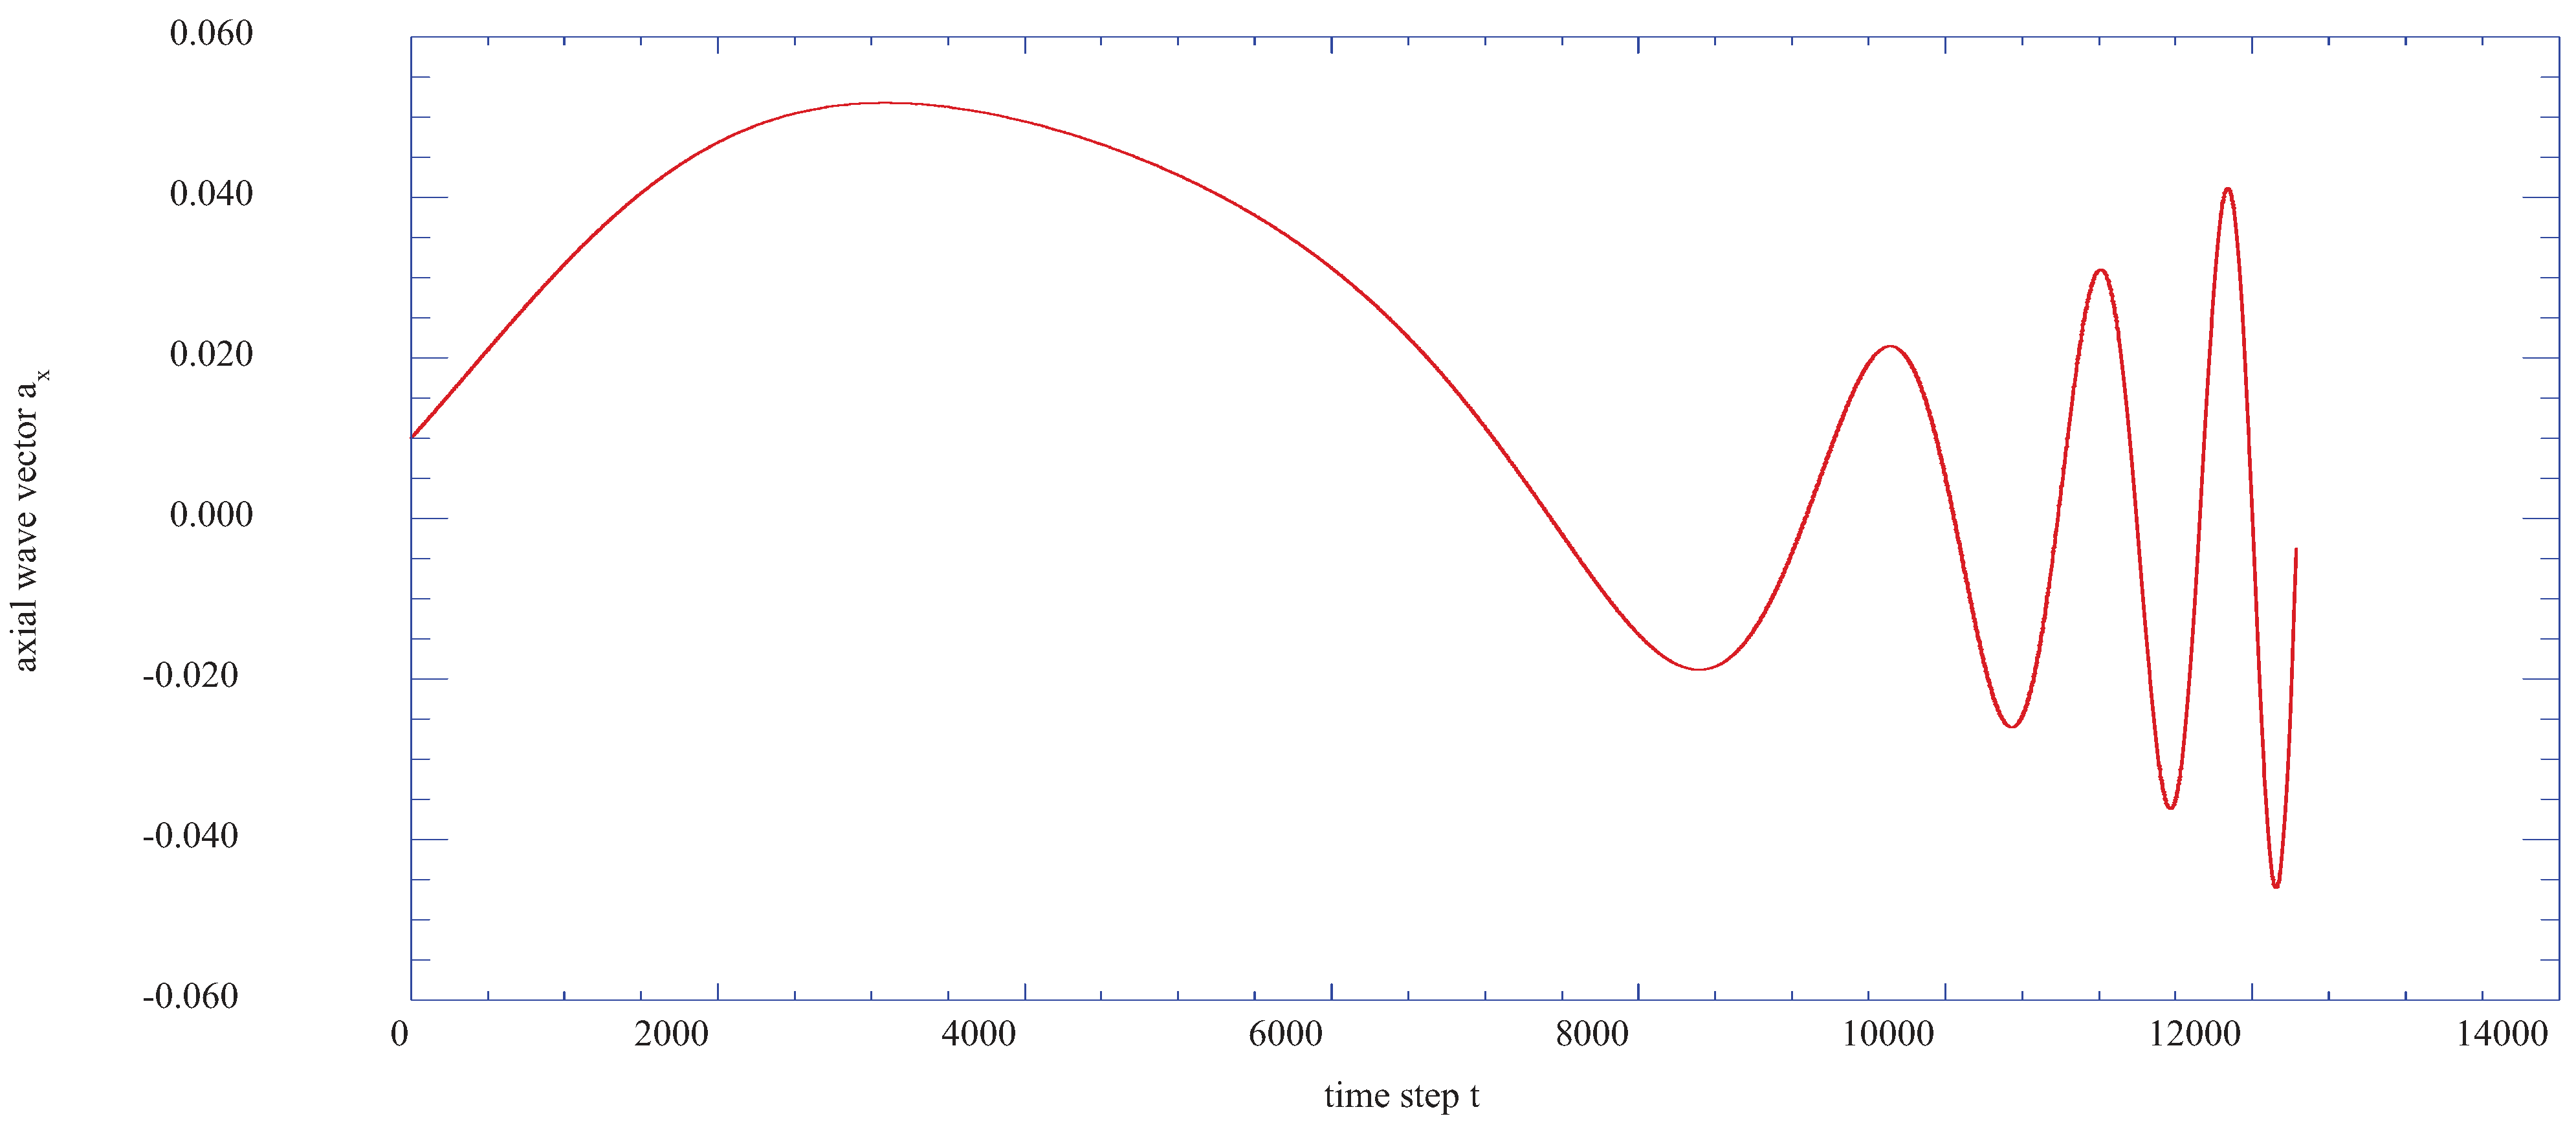
Figure 6 indicates that a flow instability occurs very near the wall at the transformed vertical position of j = 2 (η = 0.200). With a time step for the integration of these equations equal to 0.0001, a very rapid development of the instabilities is indicated.
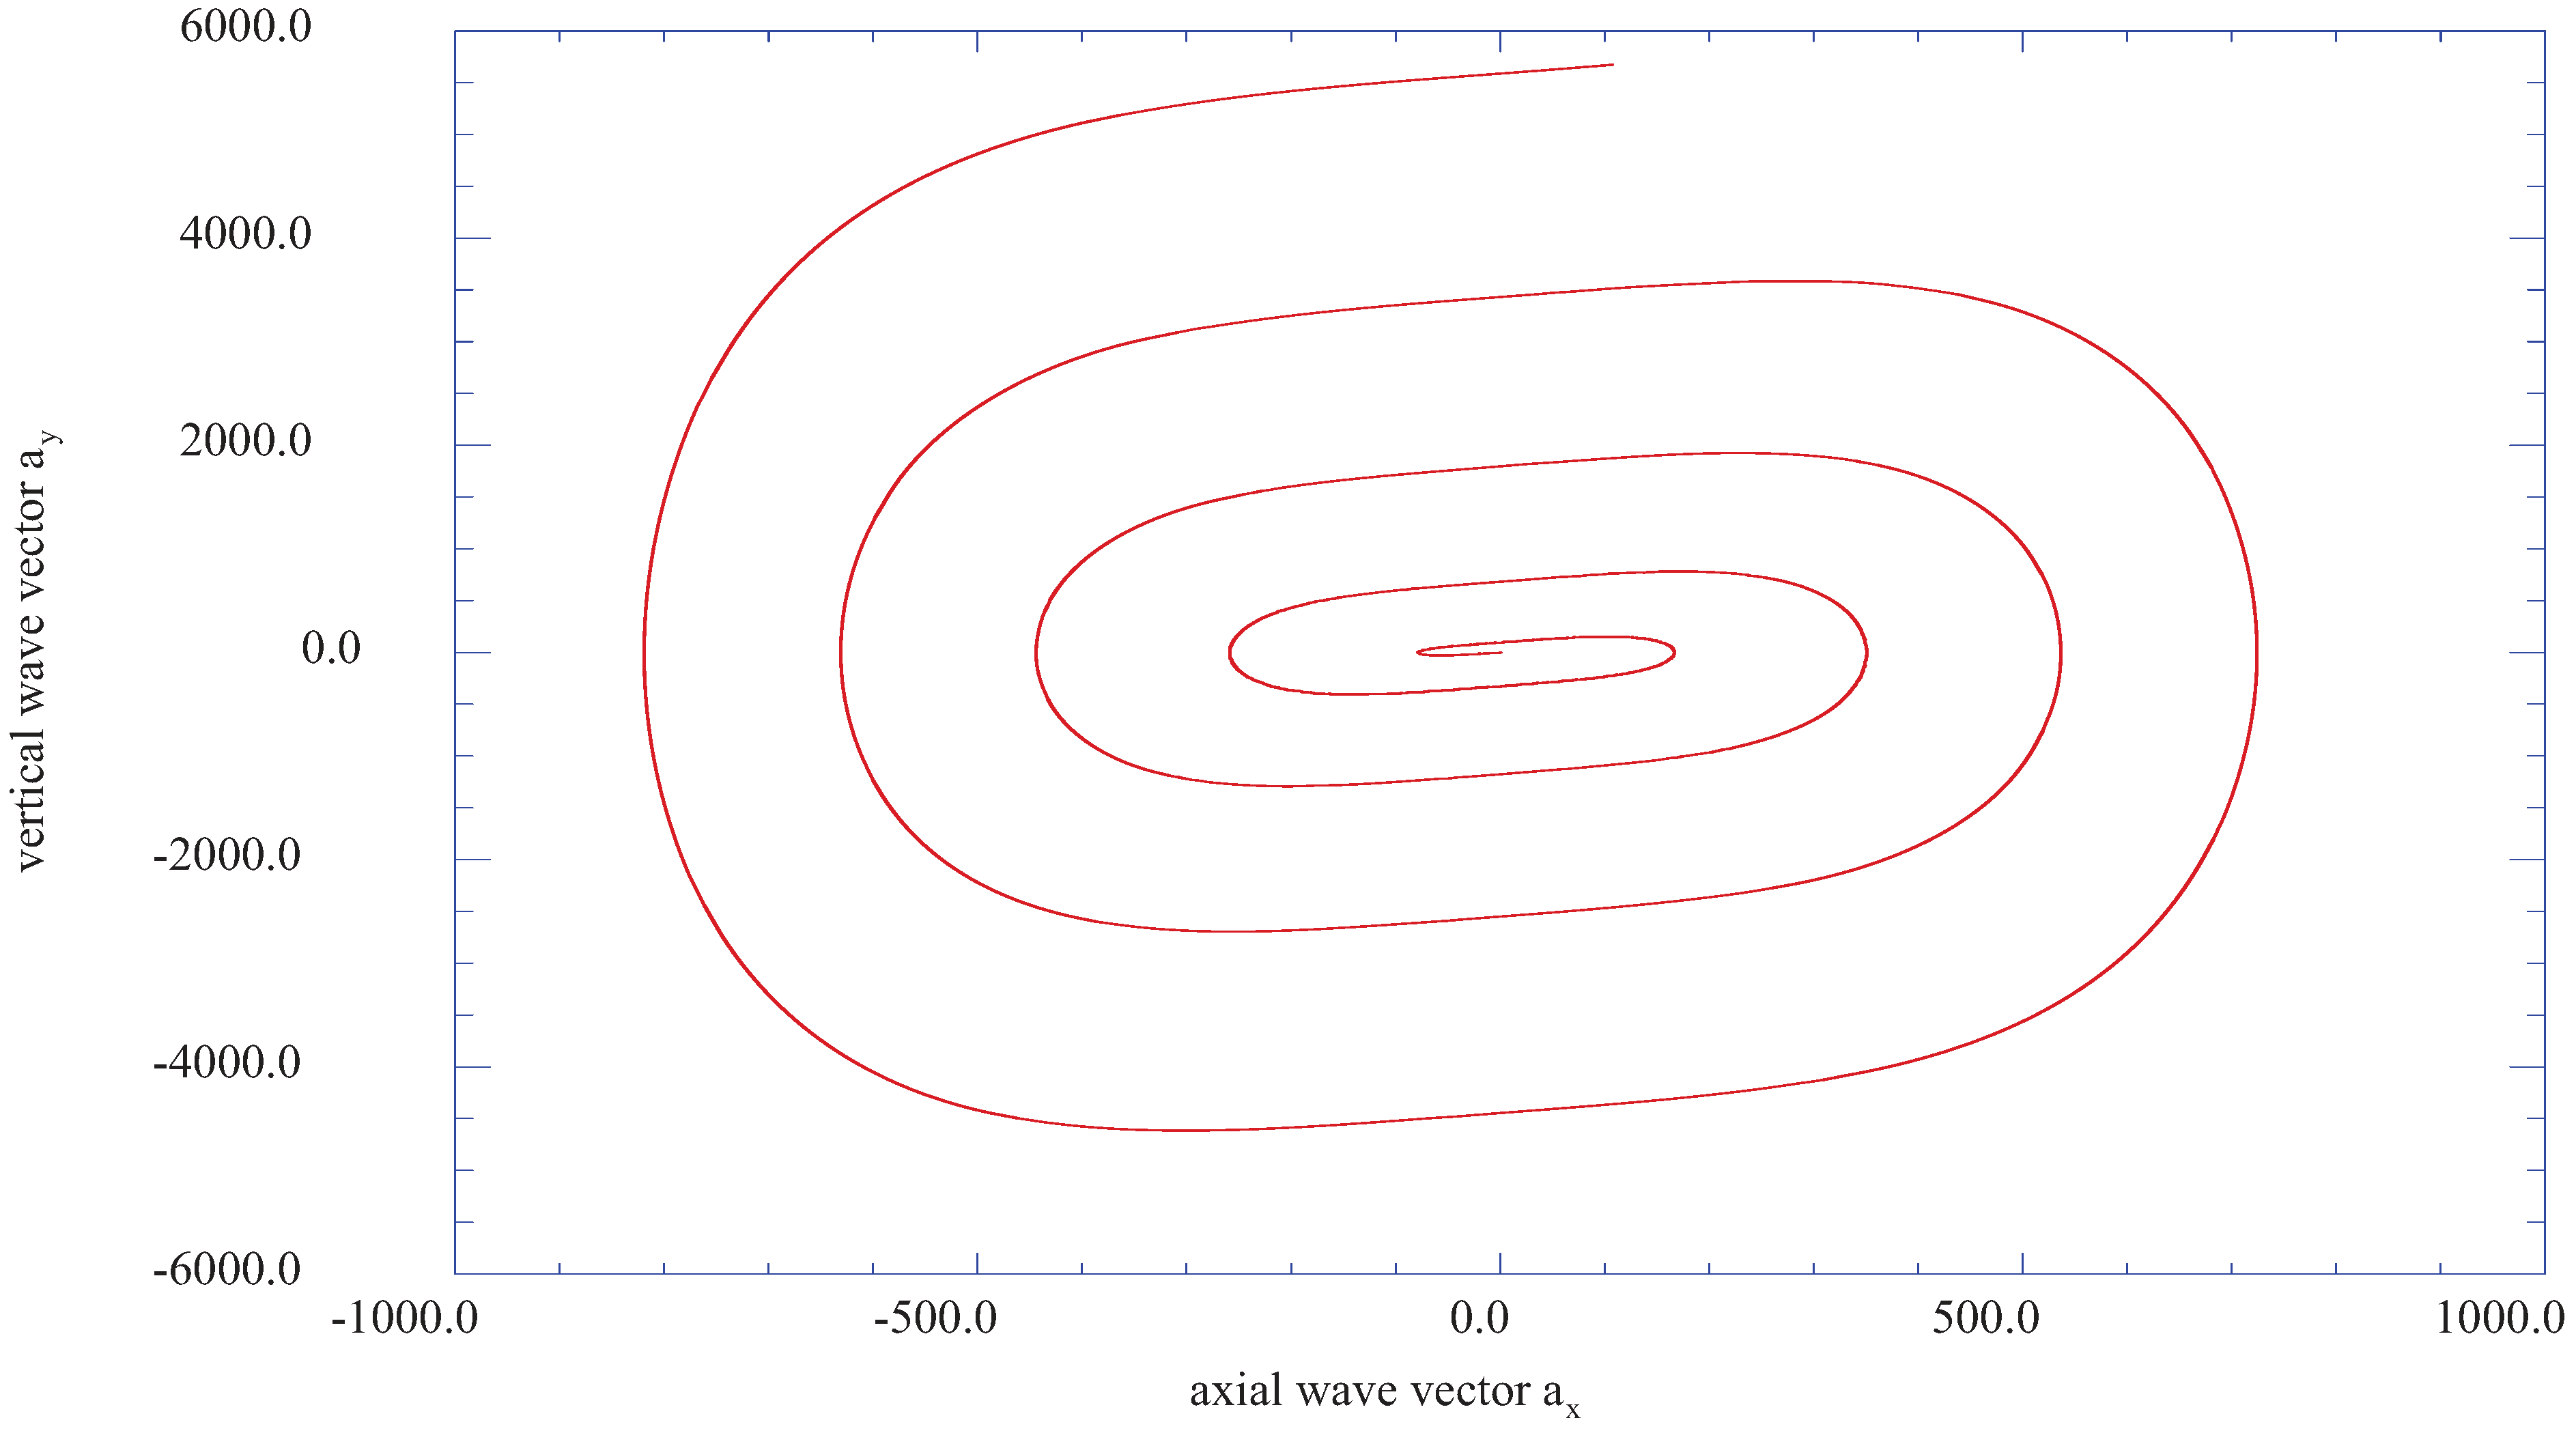
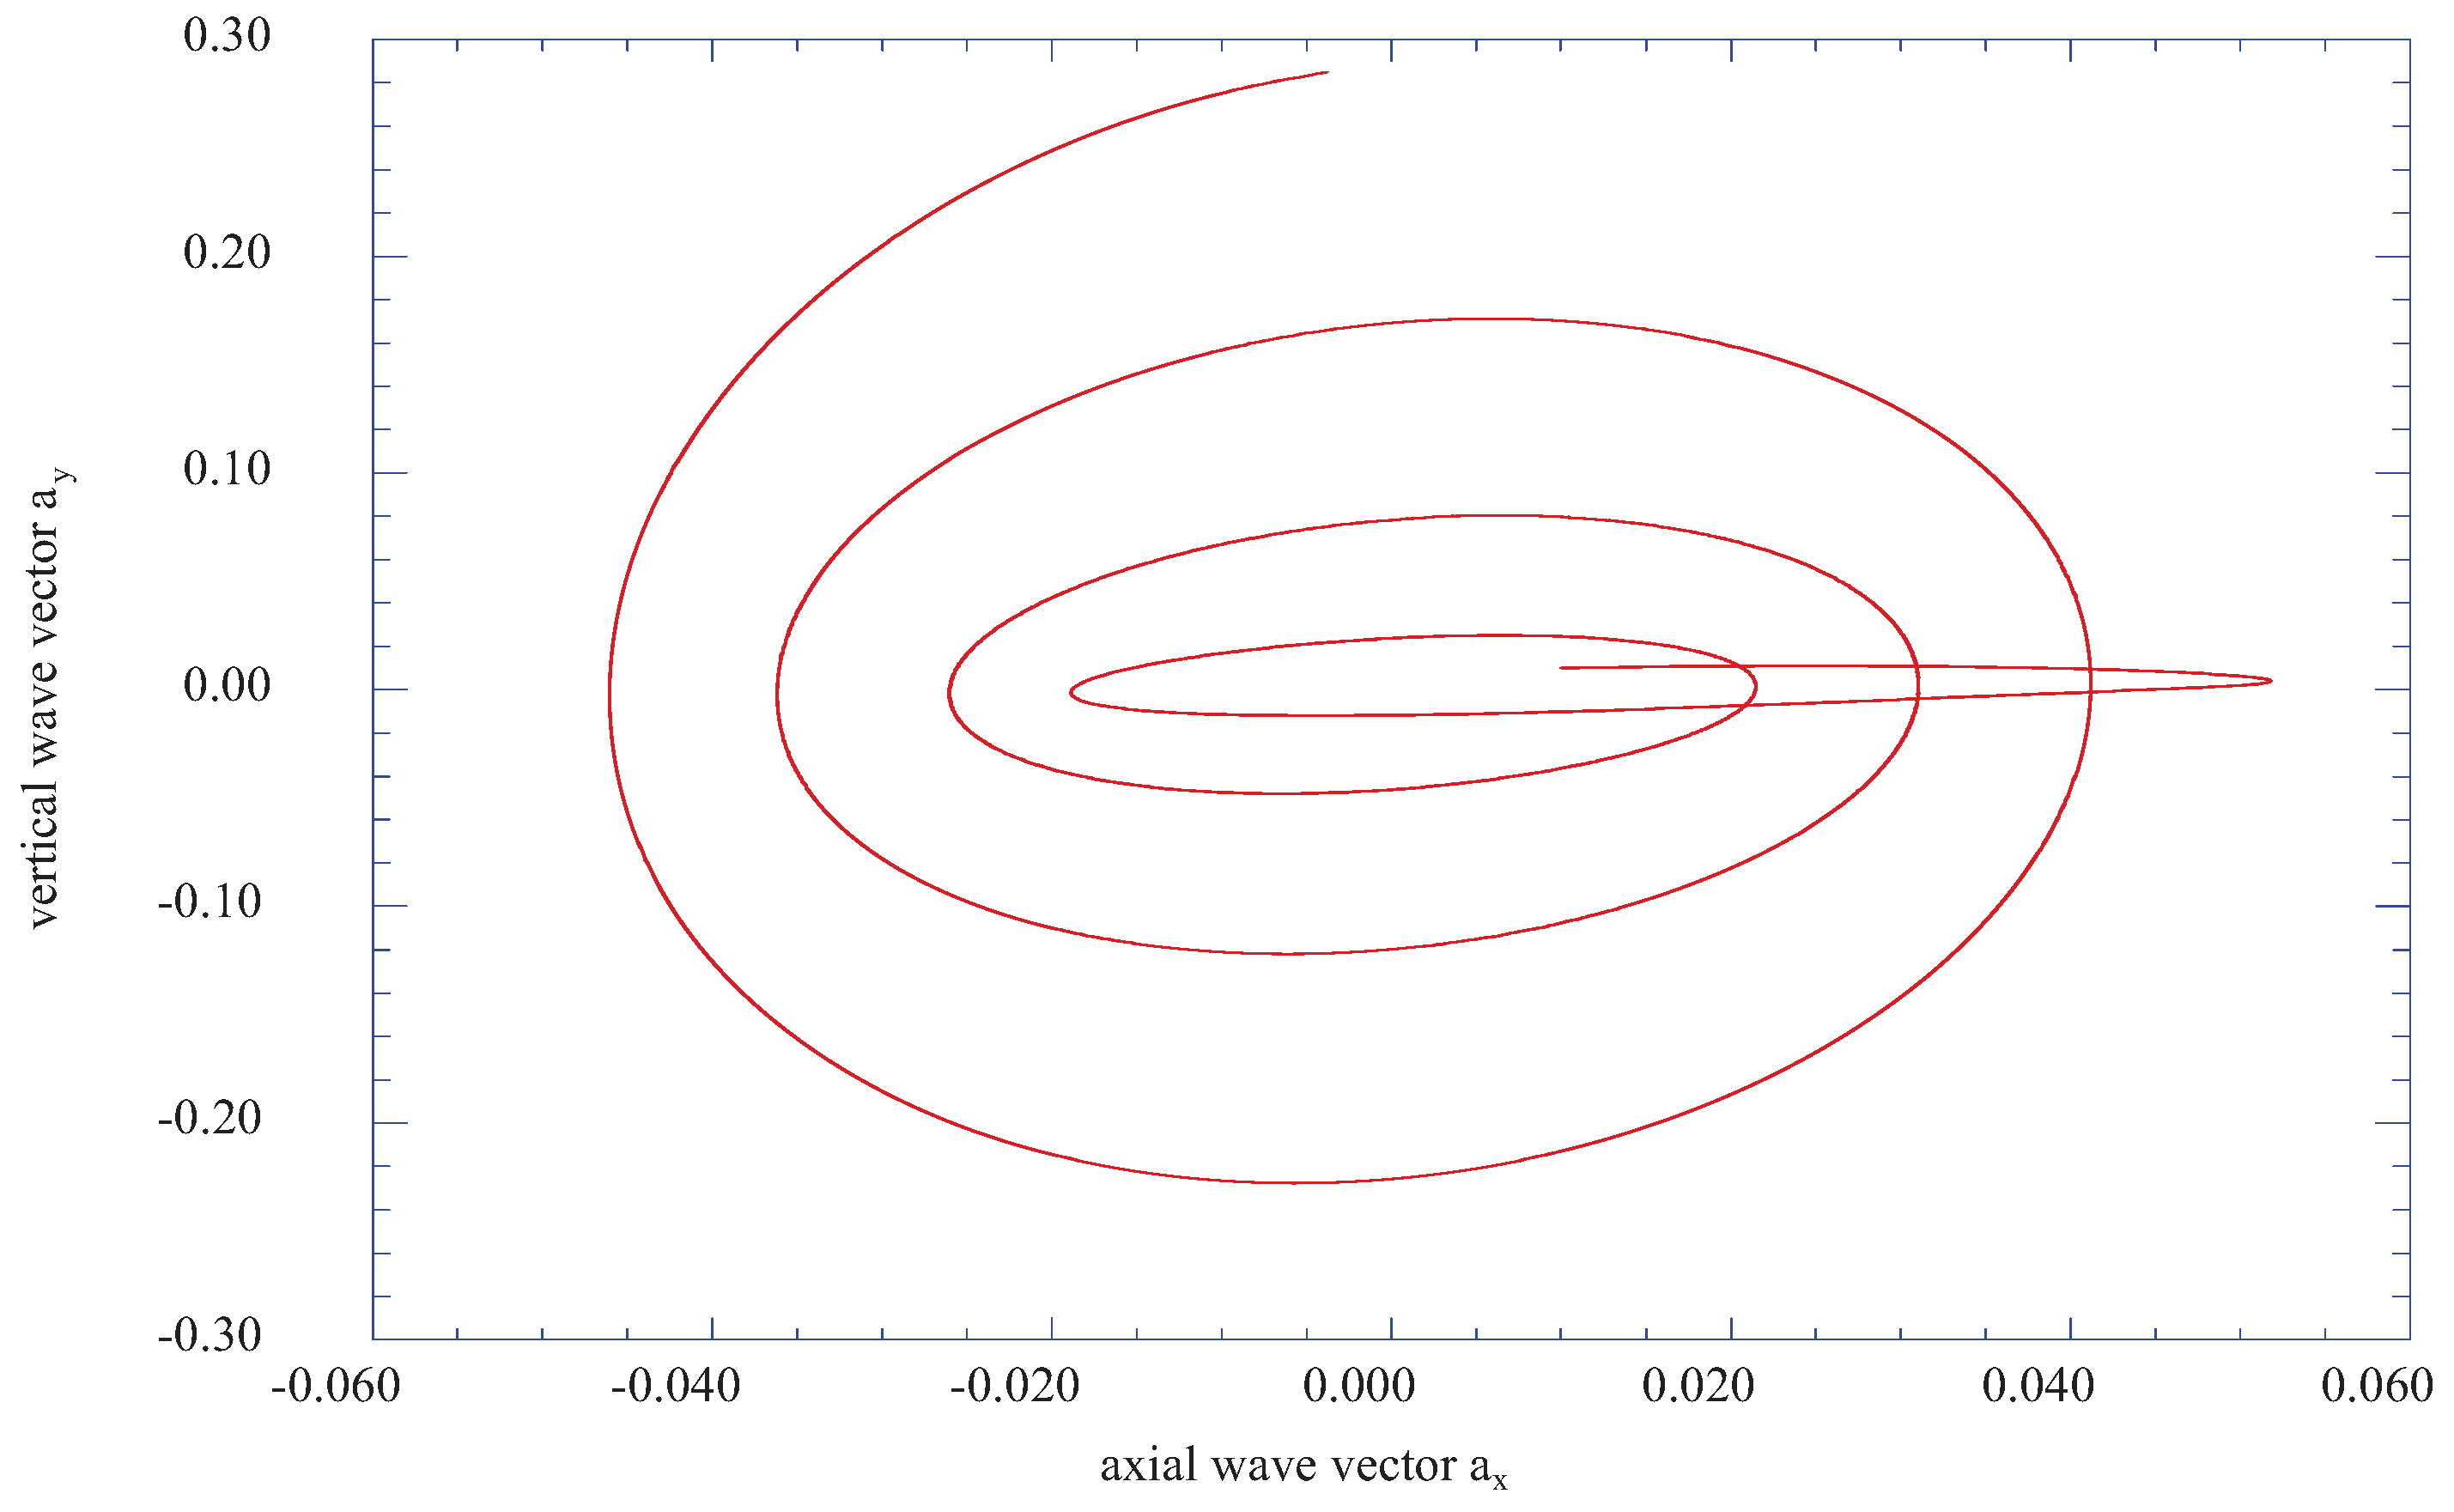
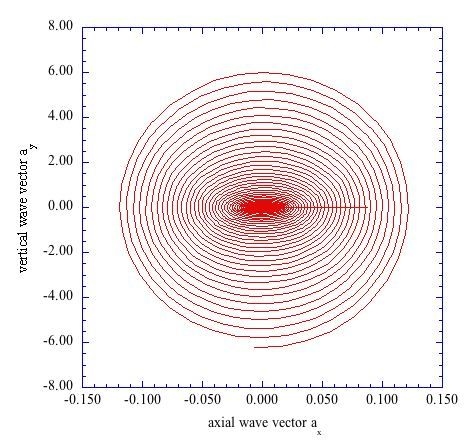
Figure 7 plots the phase plane behavior of the vertical velocity wave vector, a
y,
versus the axial velocity wave vector, a
x, for the transformed vertical location of j = 2 (η = 0.200). These results indicate that the effects of the external periodic disturbance are transmitted through the entire boundary layer structure. As indicated in both
Figure 6 and
Figure 7, the magnitudes of the
ax and
ay wave vectors are significant, thus representing a largely vertical burst of fluctuating fluid elements.
Figure 6.
The axial velocity wave vector, ax, as a function of time step at the transformed vertical station of j = 2 (η = 0.200).
Figure 6.
The axial velocity wave vector, ax, as a function of time step at the transformed vertical station of j = 2 (η = 0.200).
Figure 7.
The vertical component of the fluctuating wave vector, ay, versus the axial component, ax, for the vertical location of j = 2 (η = 0.200).
Figure 7.
The vertical component of the fluctuating wave vector, ay, versus the axial component, ax, for the vertical location of j = 2 (η = 0.200).
Figure 8 presents the phase plane plot for the vertical wave vector component,
ay,
versus the axial wave vector component,
ax, for the vertical location of j = 10 (η = 1.804). These results indicate an oscillatory behavior in the vertical direction still much larger than the extent of the axial fluctuation. Again, these are results obtained within the laminar velocity profile at nx = 4 (x = 0.08).
Figure 8.
The vertical component of the fluctuating velocity wave vector, ay, as a function of the axial fluctuating wave vector, ax, at the vertical location of j = 10 (η = 1.804).
Figure 8.
The vertical component of the fluctuating velocity wave vector, ay, as a function of the axial fluctuating wave vector, ax, at the vertical location of j = 10 (η = 1.804).
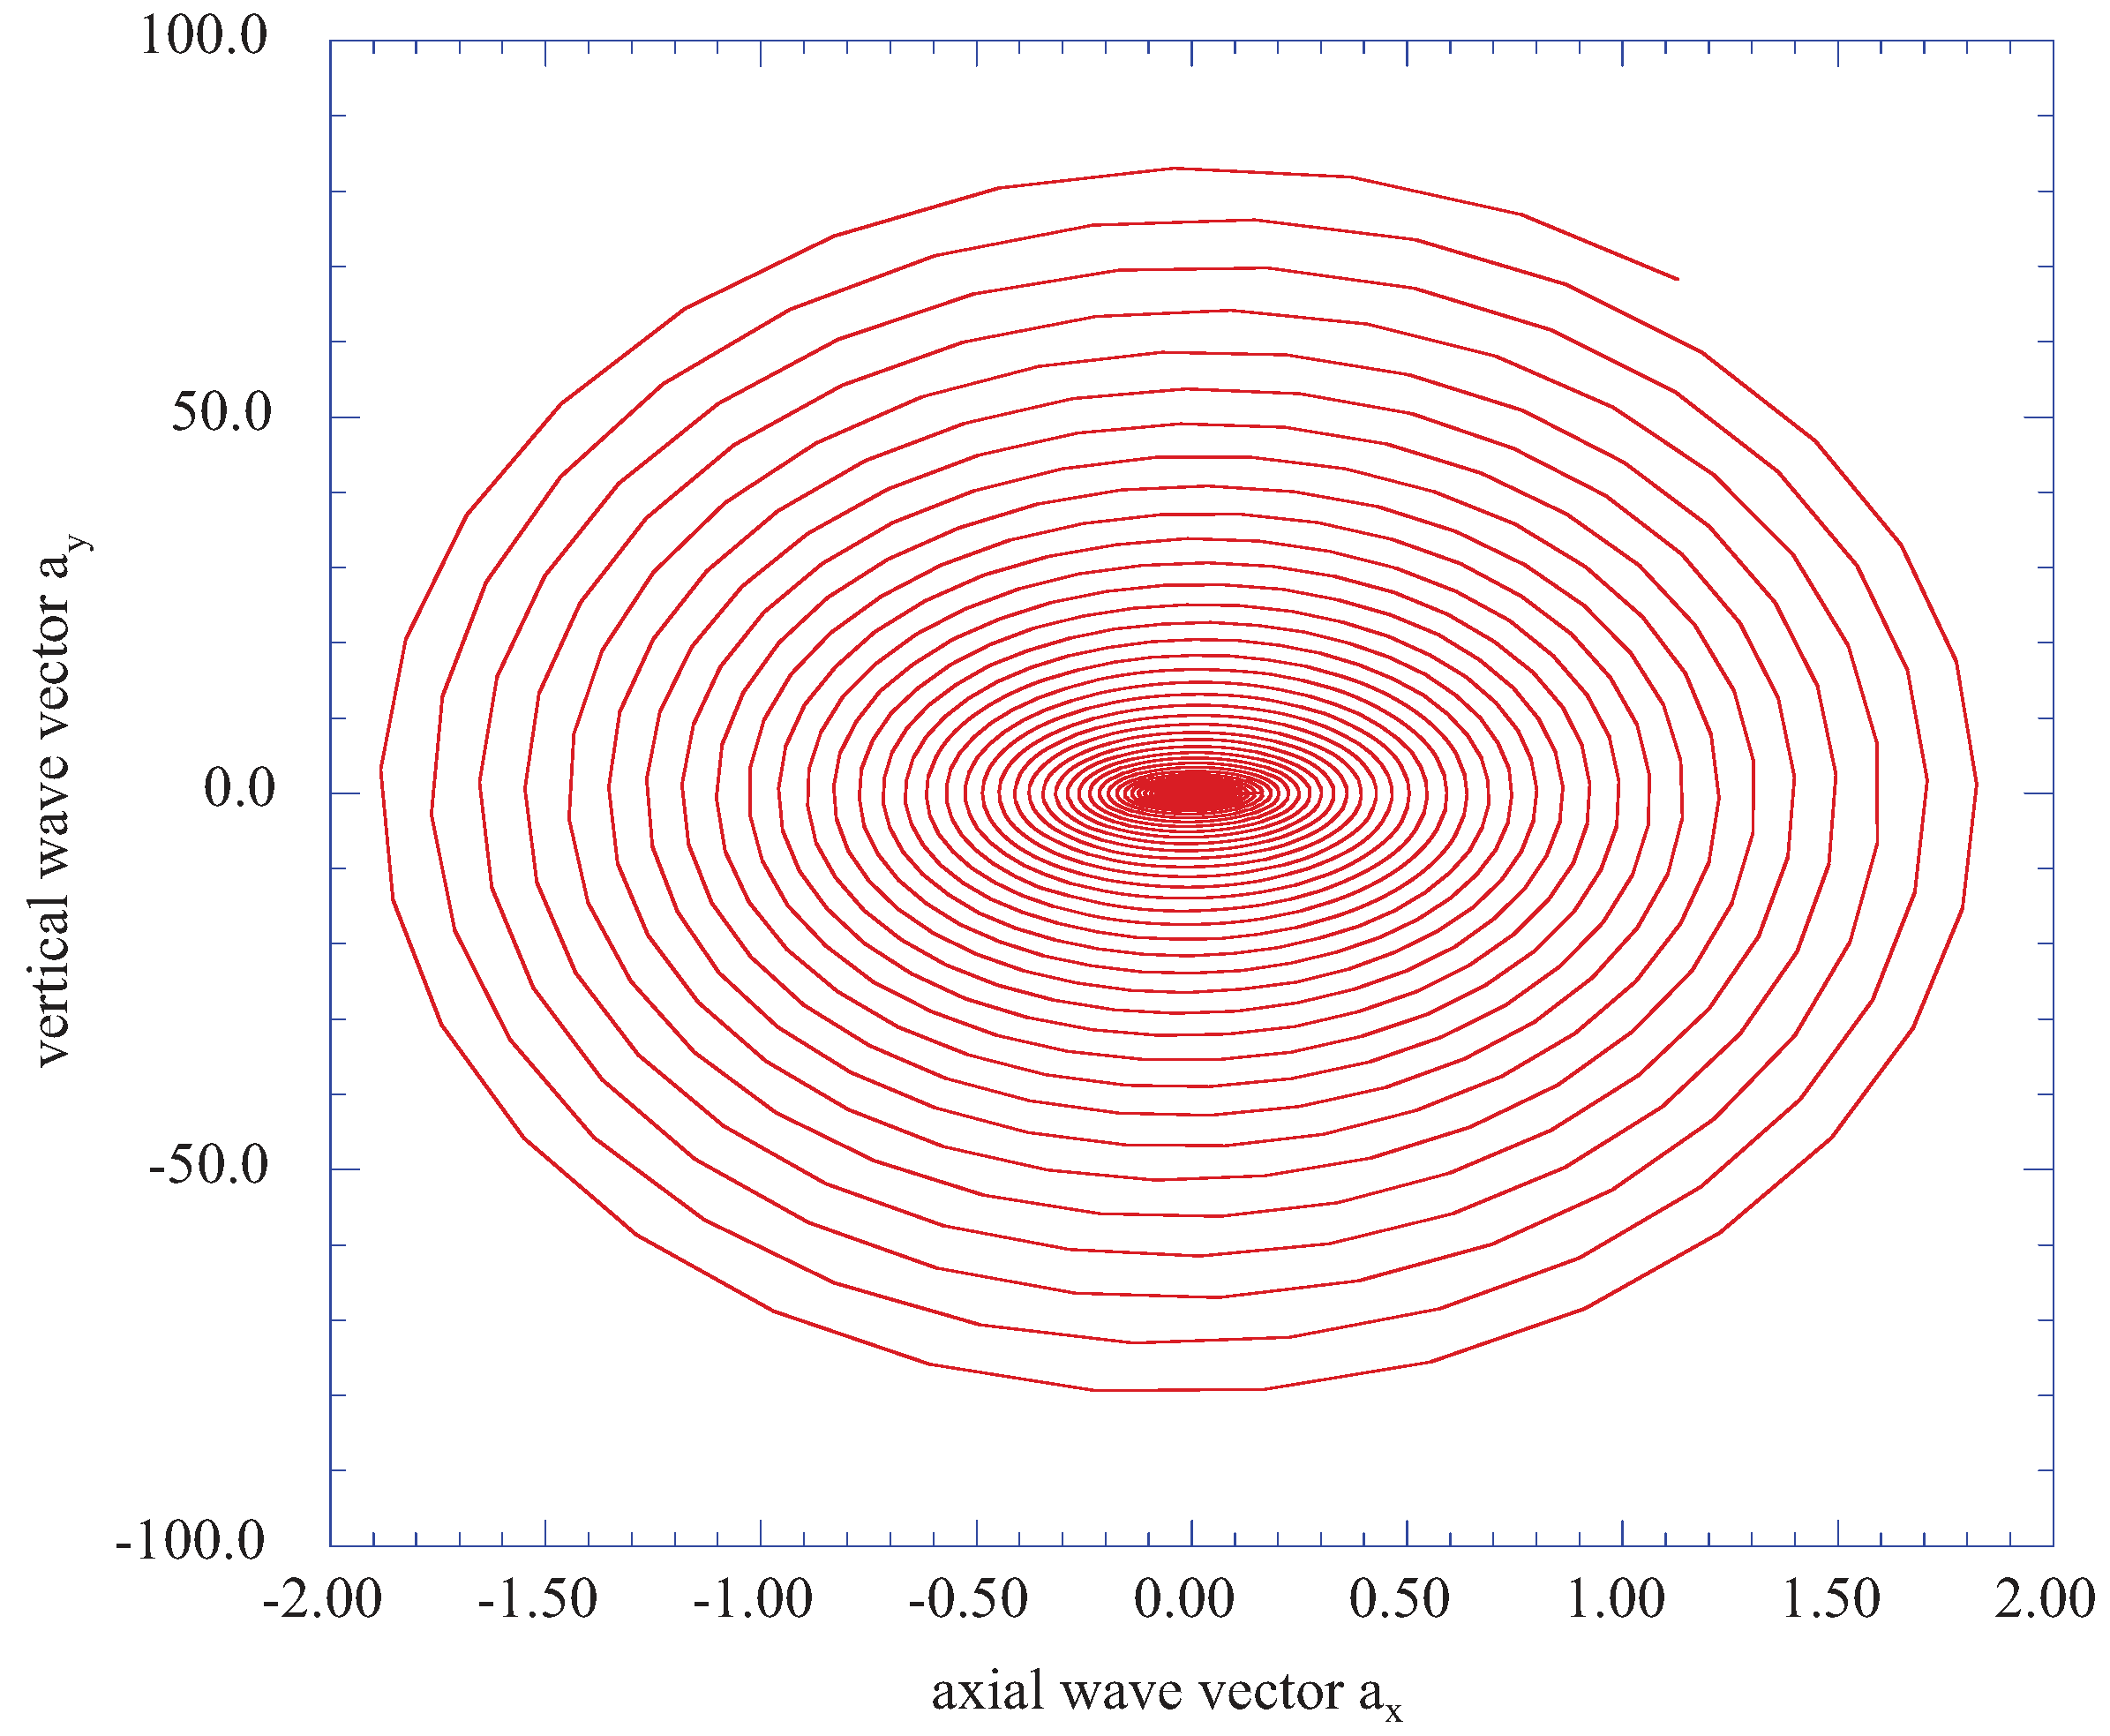
Figure 9 presents the phase plane plot of the vertical component of velocity wave vector,
,
versus the axial velocity wave vector component,
, for the vertical location of j= 14 (η = 2.608).
Figure 9.
The phase plane representation of the vertical fluctuating velocity vector, against the horizontal fluctuating velocity vector, ax, at the vertical location of j = 14 (η = 2.608).
Figure 9.
The phase plane representation of the vertical fluctuating velocity vector, against the horizontal fluctuating velocity vector, ax, at the vertical location of j = 14 (η = 2.608).
These result are at the axial location of nx = 4 (x = 0.08). The phase components of the vertical and horizontal fluctuations have contracted significantly in a very short vertical direction. These results, however, imply the existence of a span wise vortex, with a significant rotation in the x-y plane for the velocity vectors. The prediction of a vertical “burst” of an ordered structure is evident in these results.
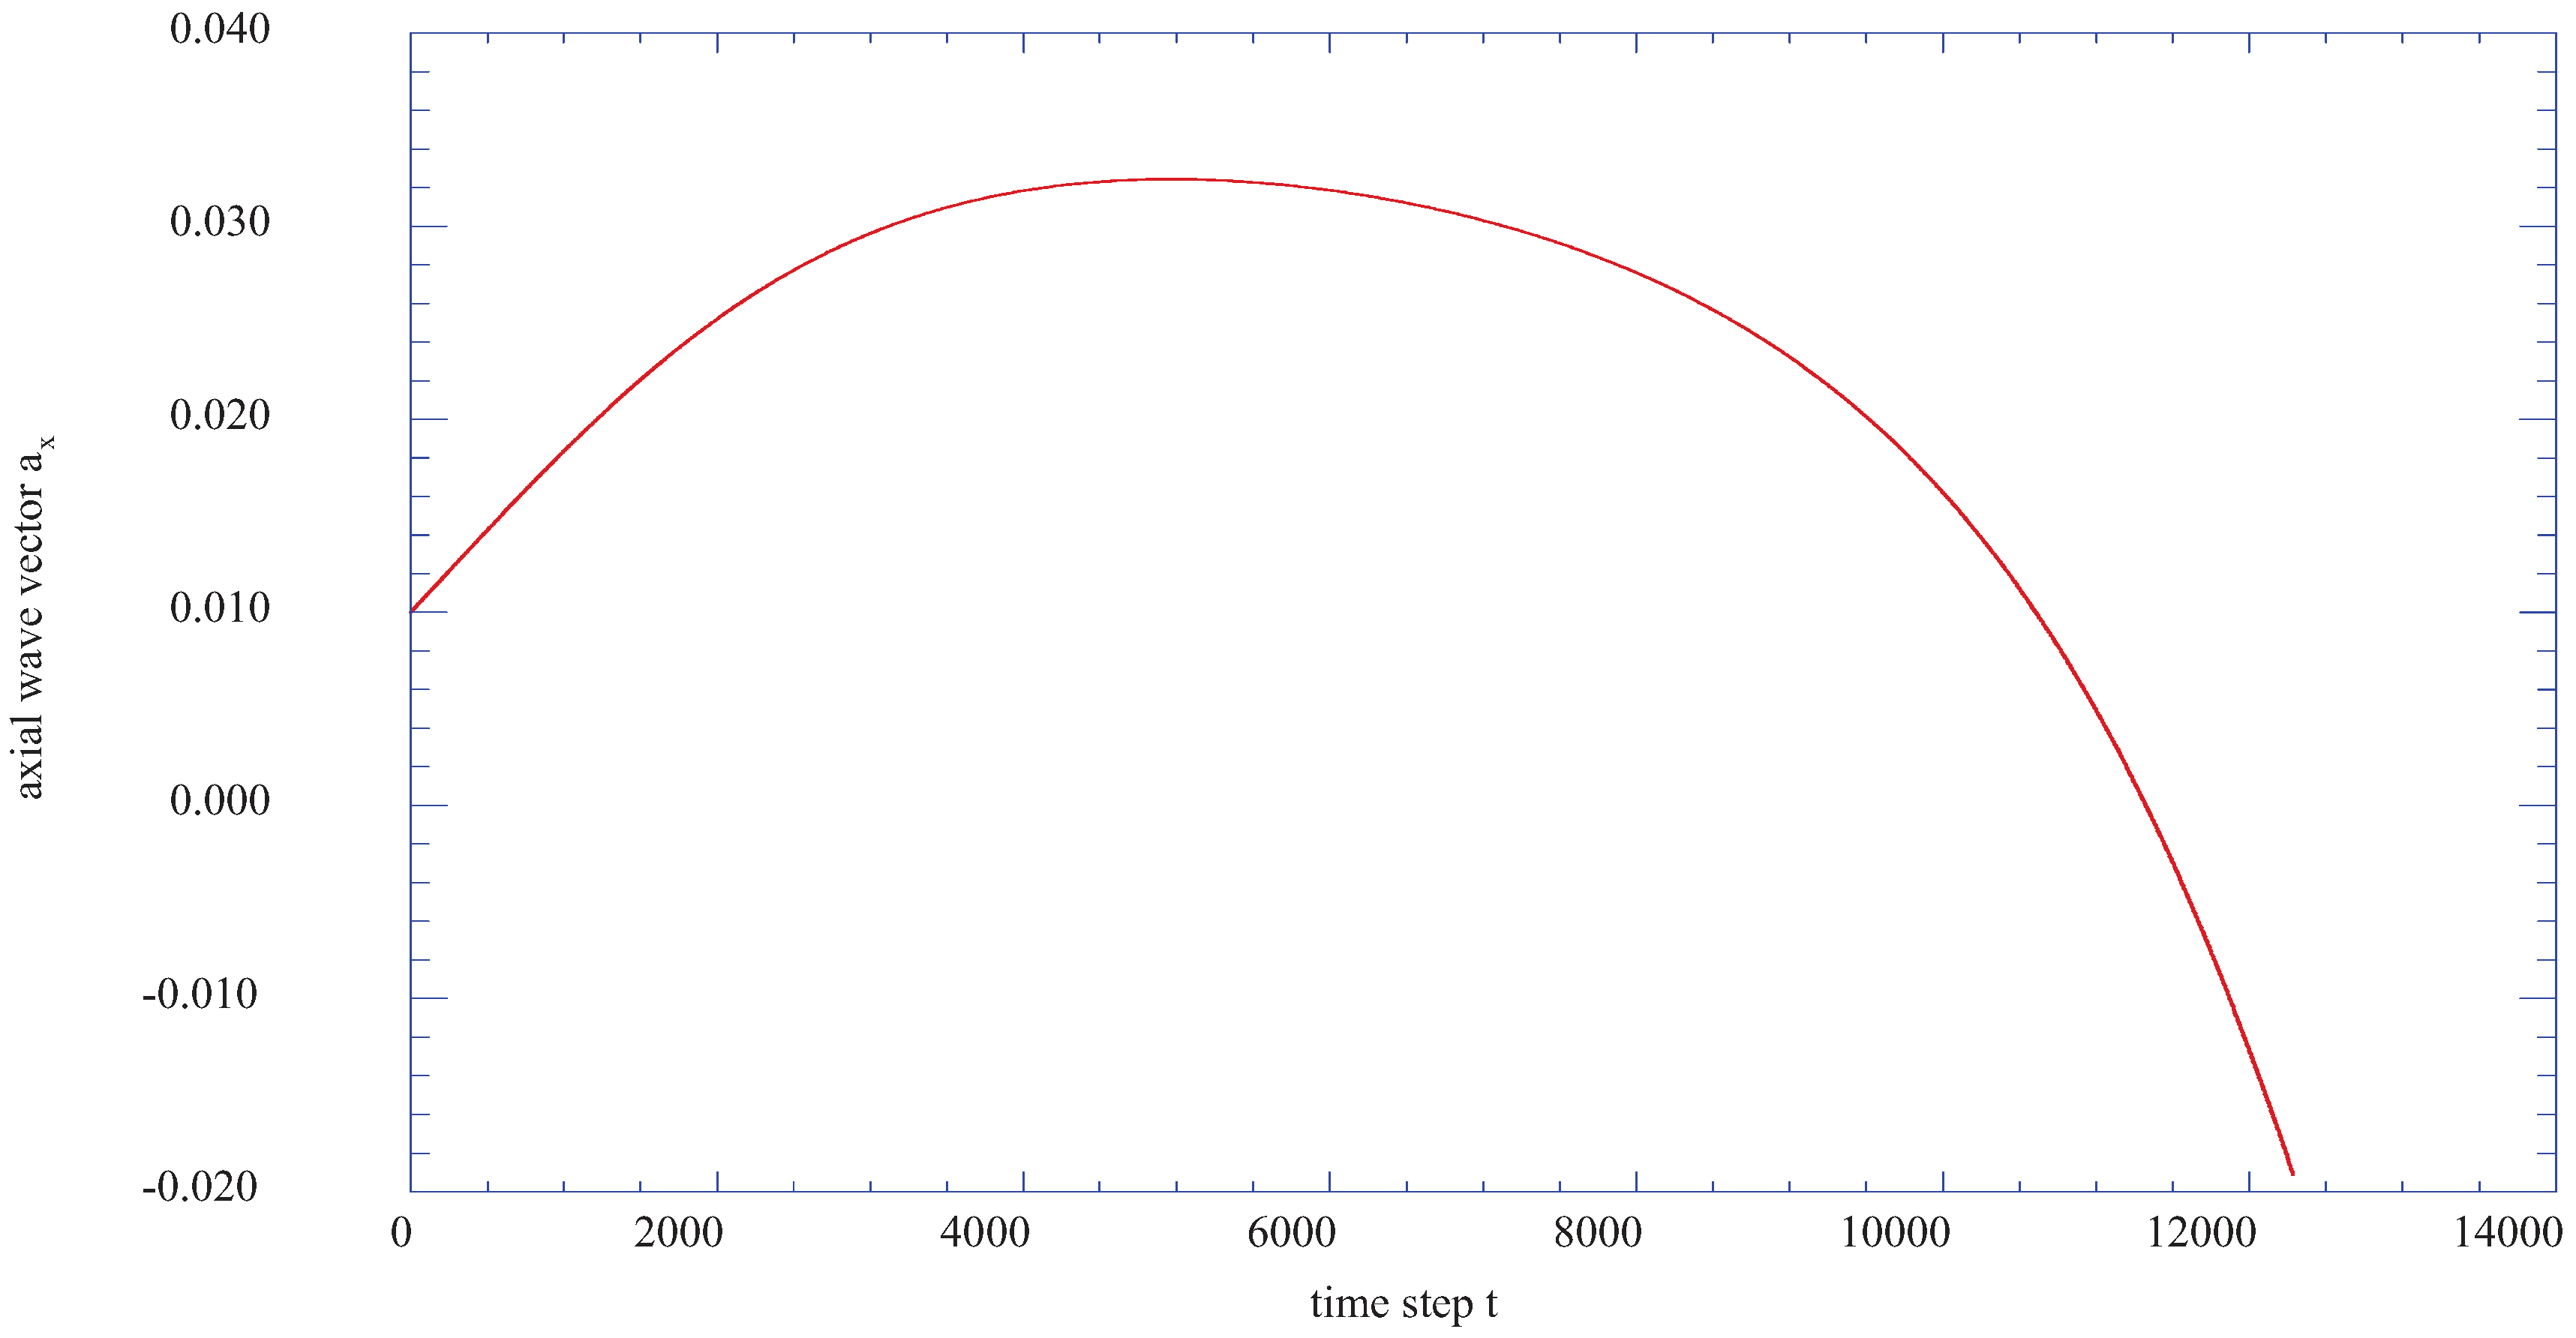
Figure 10 presents the time step results for the axial velocity wave vector component,
ax, at the vertical station j = 18 (η = 3.414) and indicates the development of a weak instability in the wave vector results. These results are considerably reduced in value, thus indicating that at this further distance from the surface, the instabilities have decreased significantly.
Figure 11 is the phase plane plot of the vertical velocity wave vector,
ay versus the axial velocity wave vector,
ax for j = 18 (η=3.414), again demonstrating the reduced level of the instability.
Figure 10.
The axial velocity wave vector, ax, as a function of time step at the transformed vertical station of j = 18 (η= 3.414).
Figure 10.
The axial velocity wave vector, ax, as a function of time step at the transformed vertical station of j = 18 (η= 3.414).
Figure 11.
The phase plane representation of the vertical velocity ay, versus the horizontal velocity ax, at the transformed vertical station of j = 18 (η= 3.414).
Figure 11.
The phase plane representation of the vertical velocity ay, versus the horizontal velocity ax, at the transformed vertical station of j = 18 (η= 3.414).
Finally,
Figure 12 shows the time step results for the axial velocity wave vector,
ax at the vertical station j = 22 (η = 4.221) indicating that at this station, the axial velocity wave vector changes direction from positive x to a negative x direction.
Figure 12.
The axial velocity wave vector, ax, as a function of time step at the transformed vertical station of j = 22 (η= 4.221).
Figure 12.
The axial velocity wave vector, ax, as a function of time step at the transformed vertical station of j = 22 (η= 4.221).
3.2. The Prediction of Spectral Entropy from the Deterministic Results
The Maximum Entropy Method (MEM) [
41] is used extensively in the analysis of nonlinear time series data. Our use of this method is based upon the presentation by Chen [
42], in which the method, known as Burg’s method, was applied to the extraction of spectral energy densities from seismic nonlinear time series data. Chen [
42] presented the first source code for the improvement of Burg’s method in the extraction of the desired spectral information from the data.
One of the significant advantages of the maximum entropy method over the use of the filtered fast Fourier transform (FFT) method is the enhancement of the spectral peaks in the spectral energy density distribution. Our previous experience with the maximum entropy method and the existence of useful source codes for the analysis of the predicted time series led to our use of this method for the evaluation of the spectral entropy for each segment in the series of segments representing an internal block of data from the complete nonlinear time series data.
The method of analysis used for our study is the prediction of the distribution of the spectral entropy of the block of data in the computed nonlinear time series. The individual fluctuating histories for the axial and vertical velocity wave-vector components are combined into one time series by adding the squares of each component for each time step. The selected time series is divided into 64 segments with 32 data sets per segment. The maximum entropy method [
41], is then applied to each segment of 32 data sets to obtain 16 spiked values of the power spectral density,
fr, for each particular segment. The probability values of each set of particular spectral densities for each segment is then computed from
. The methods of [
43,
44,
45] are then applied to the probability distributions for each segment to develop the spectral entropy for the given segment. The spectral entropy (dimensionless) is defined as:
for the j-th segment. This procedure is applied to each of the 64 segments over the selected time range.
To establish an appropriate form for the set of equations describing the boundary-layer flow, we employed the following procedure: First, the physics of the shear layer are represented in the form of six first-order differential equations. The first three equations represent the evaluation of the behavior of the wave numbers with the imposed set of external control parameters throughout the integration process. Second, the integration of the equations of motion and the computation of the kinetic energy associated with the axial and vertical velocity fluctuations are computed. These are computed with the boundary layer velocity gradients serving as the set of internally applied control parameters. Third, local spectral entropy is computed for the vertical station of j = 16 (η = 3.011) at nx = 4 (x = 0.08) for the block of data from 8192 to 10240 time steps in the time span of the computation.
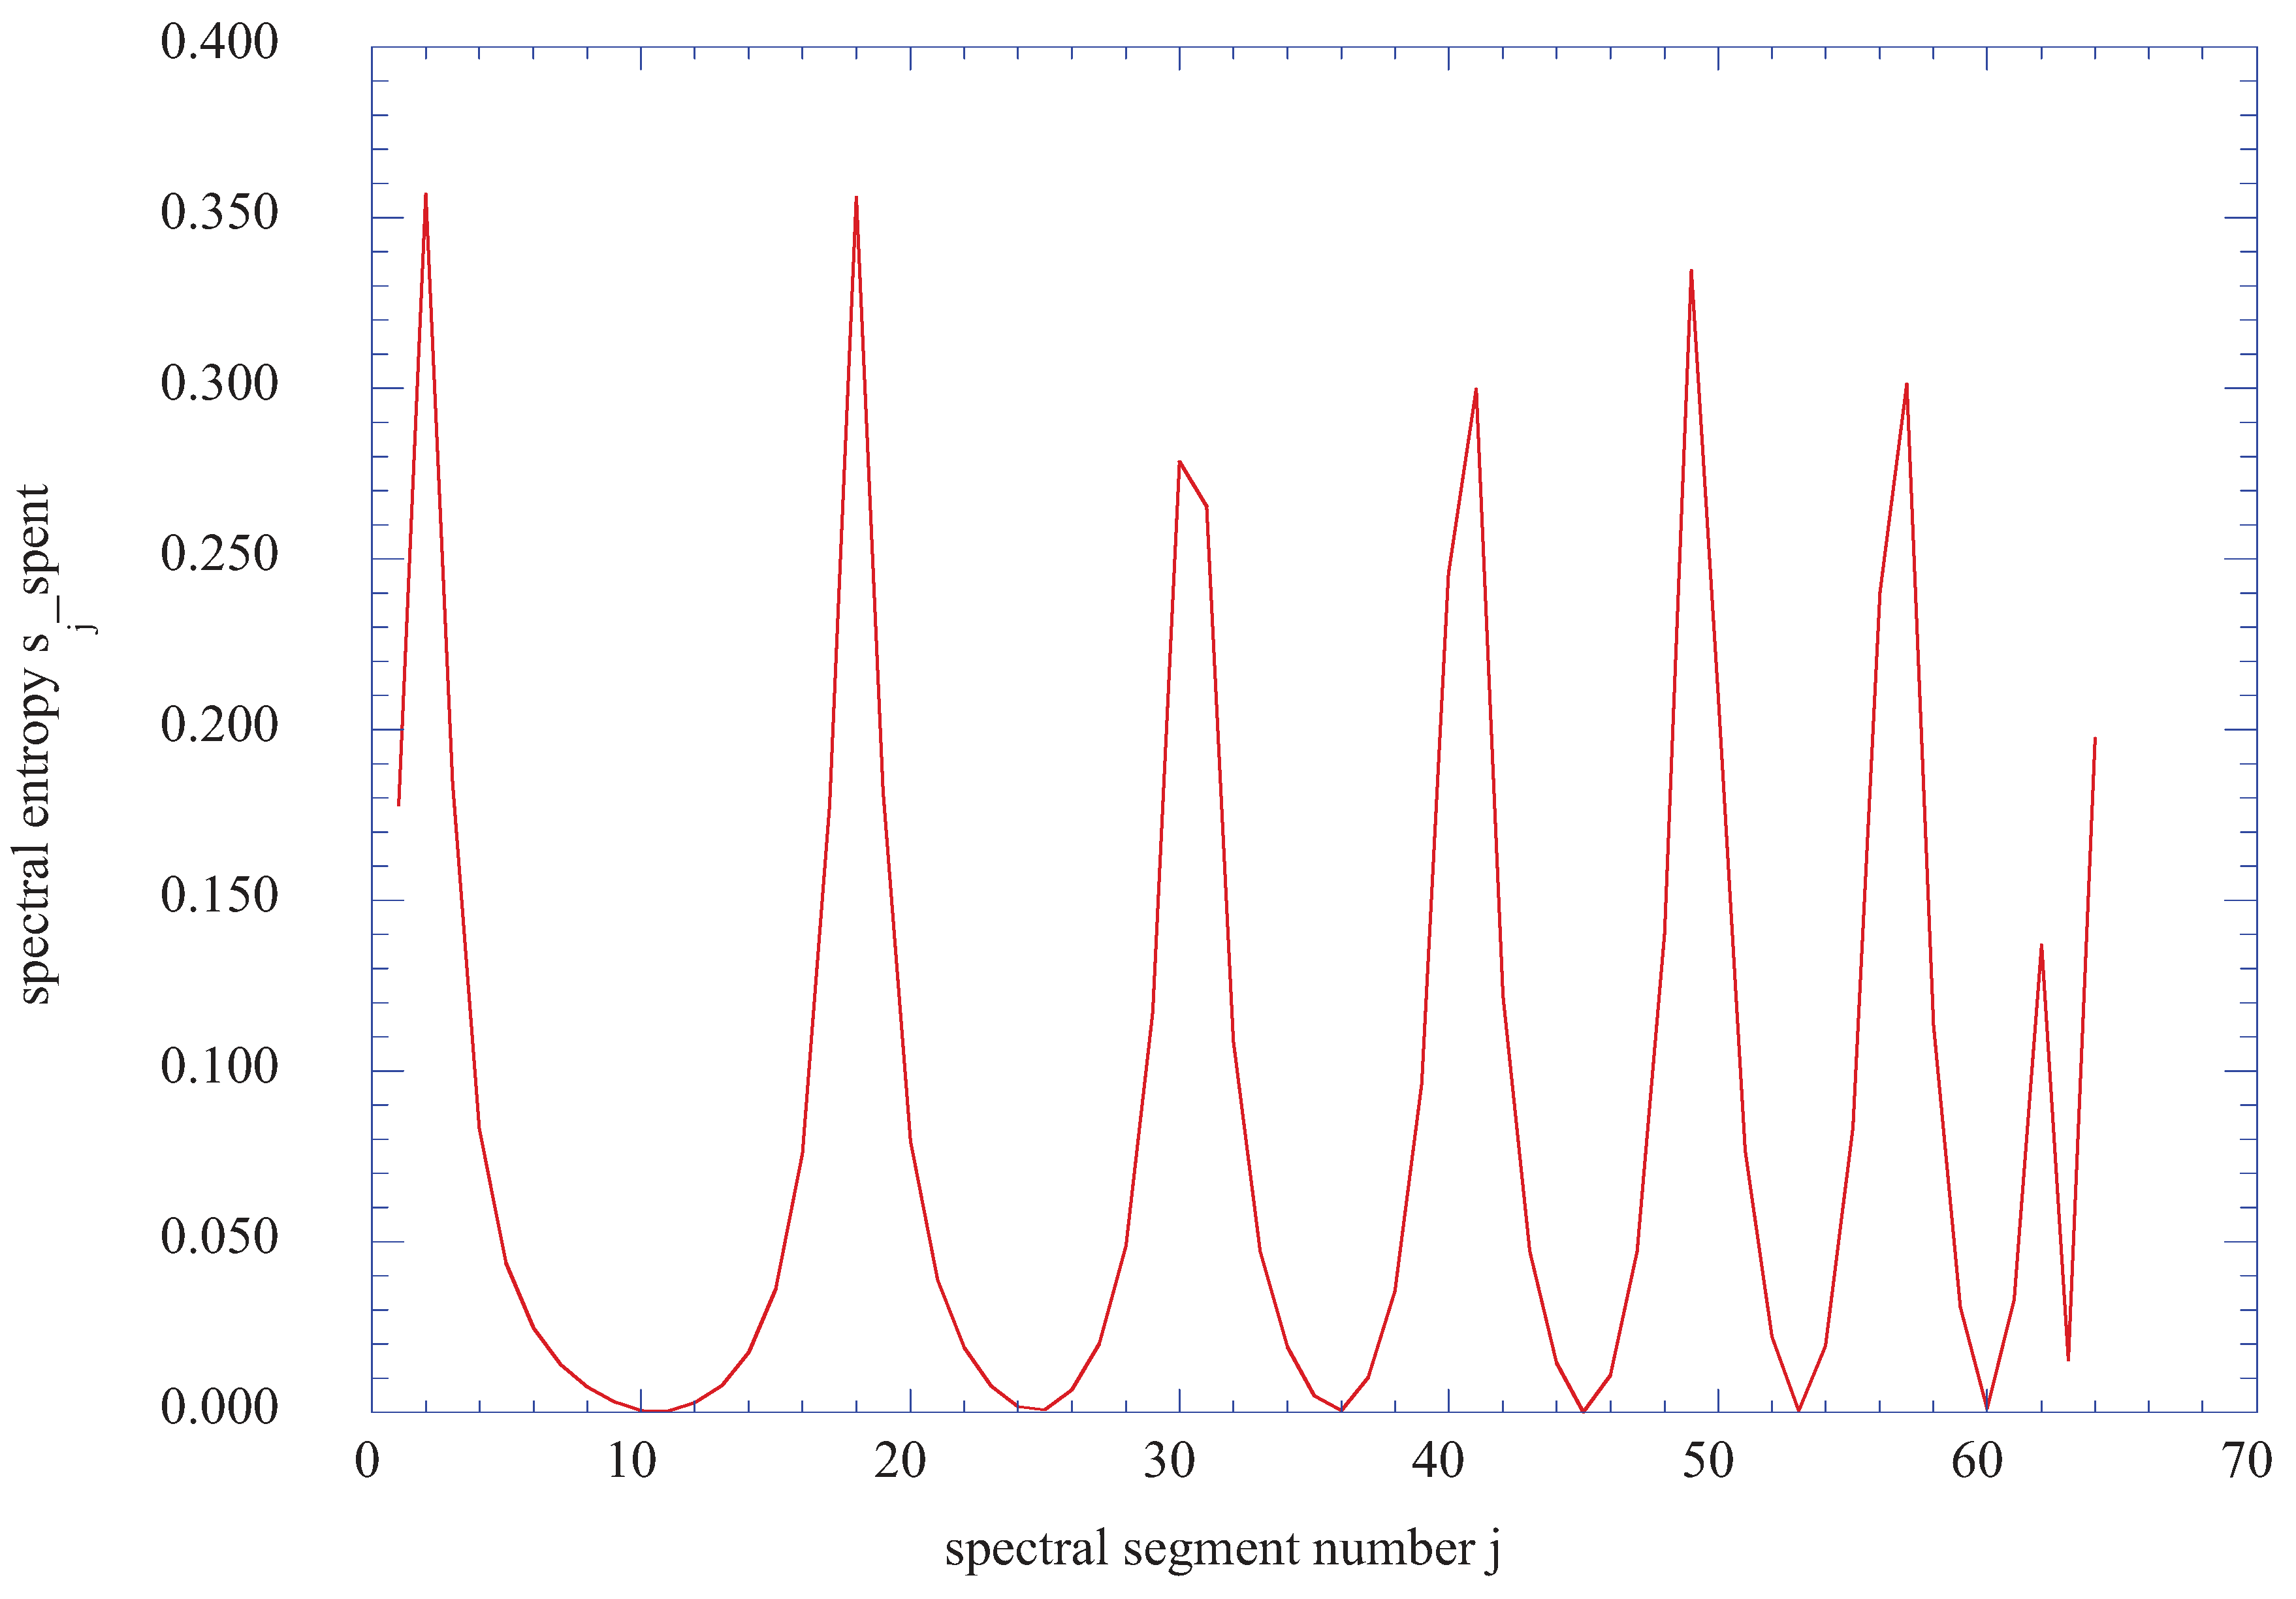
Figure 13 indicates that for the selected time span, regions of sharp incoherent spectral entropy occur between broader regions of coherent spectral entropy. Low values of spectral entropy indicate coherent or ordered vortices, while high spectral entropy values indicate the dissolution of the ordered kinetic energy into regions of incoherent, but significant, kinetic energy.
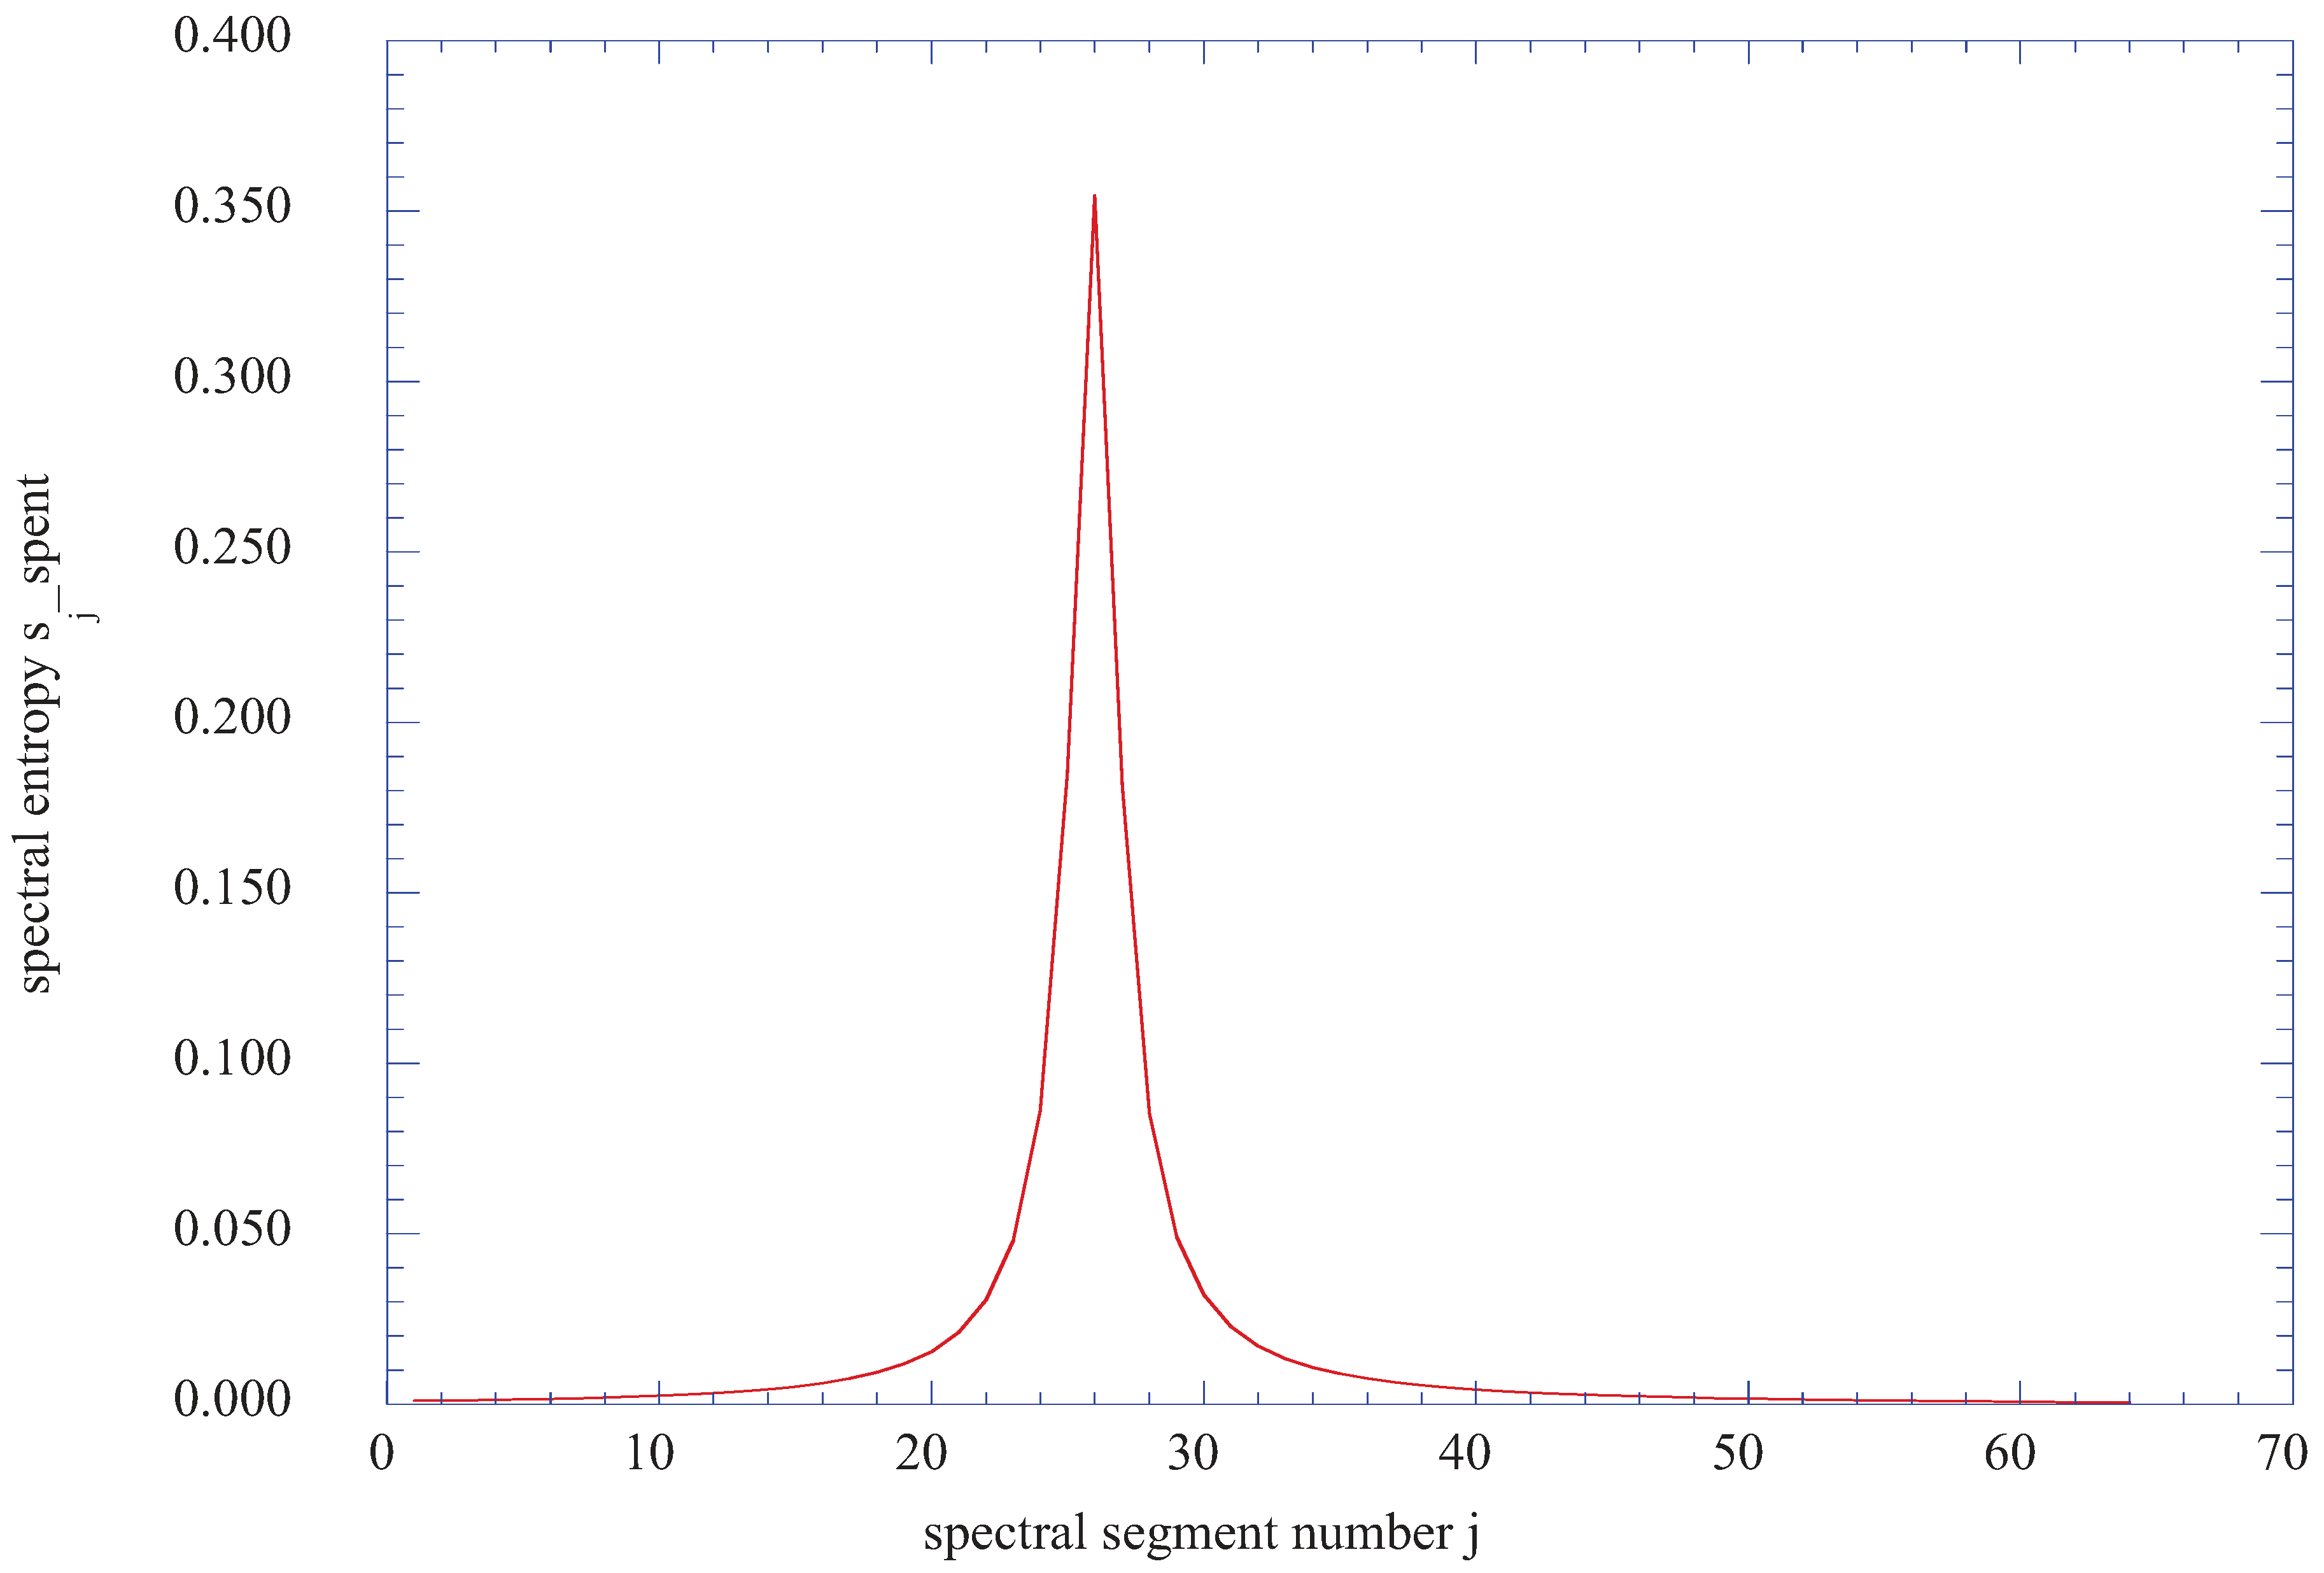
Figure 14, at j = 20 (η = 3.817), shows only a single peak of spectral entropy in a region of small spectral entropy, thus indicating a sharp region of dissolution of directed kinetic energy.
Figure 13.
The spectral entropy of ax2 + ay2 over 2048 time steps from the time step of 8192 to a time step of 10240 for the vertical location of j = 16 (η = 3.011) at nx = 4 (x = 0.08).
Figure 13.
The spectral entropy of ax2 + ay2 over 2048 time steps from the time step of 8192 to a time step of 10240 for the vertical location of j = 16 (η = 3.011) at nx = 4 (x = 0.08).
Figure 14.
The spectral entropy of ax2 + ay2 over 2048 time steps from the time step of 8192 to a time step of 10240 for the vertical location of j = 20 (η = 3.817) at nx = 4 (x = 0.08).
Figure 14.
The spectral entropy of ax2 + ay2 over 2048 time steps from the time step of 8192 to a time step of 10240 for the vertical location of j = 20 (η = 3.817) at nx = 4 (x = 0.08).
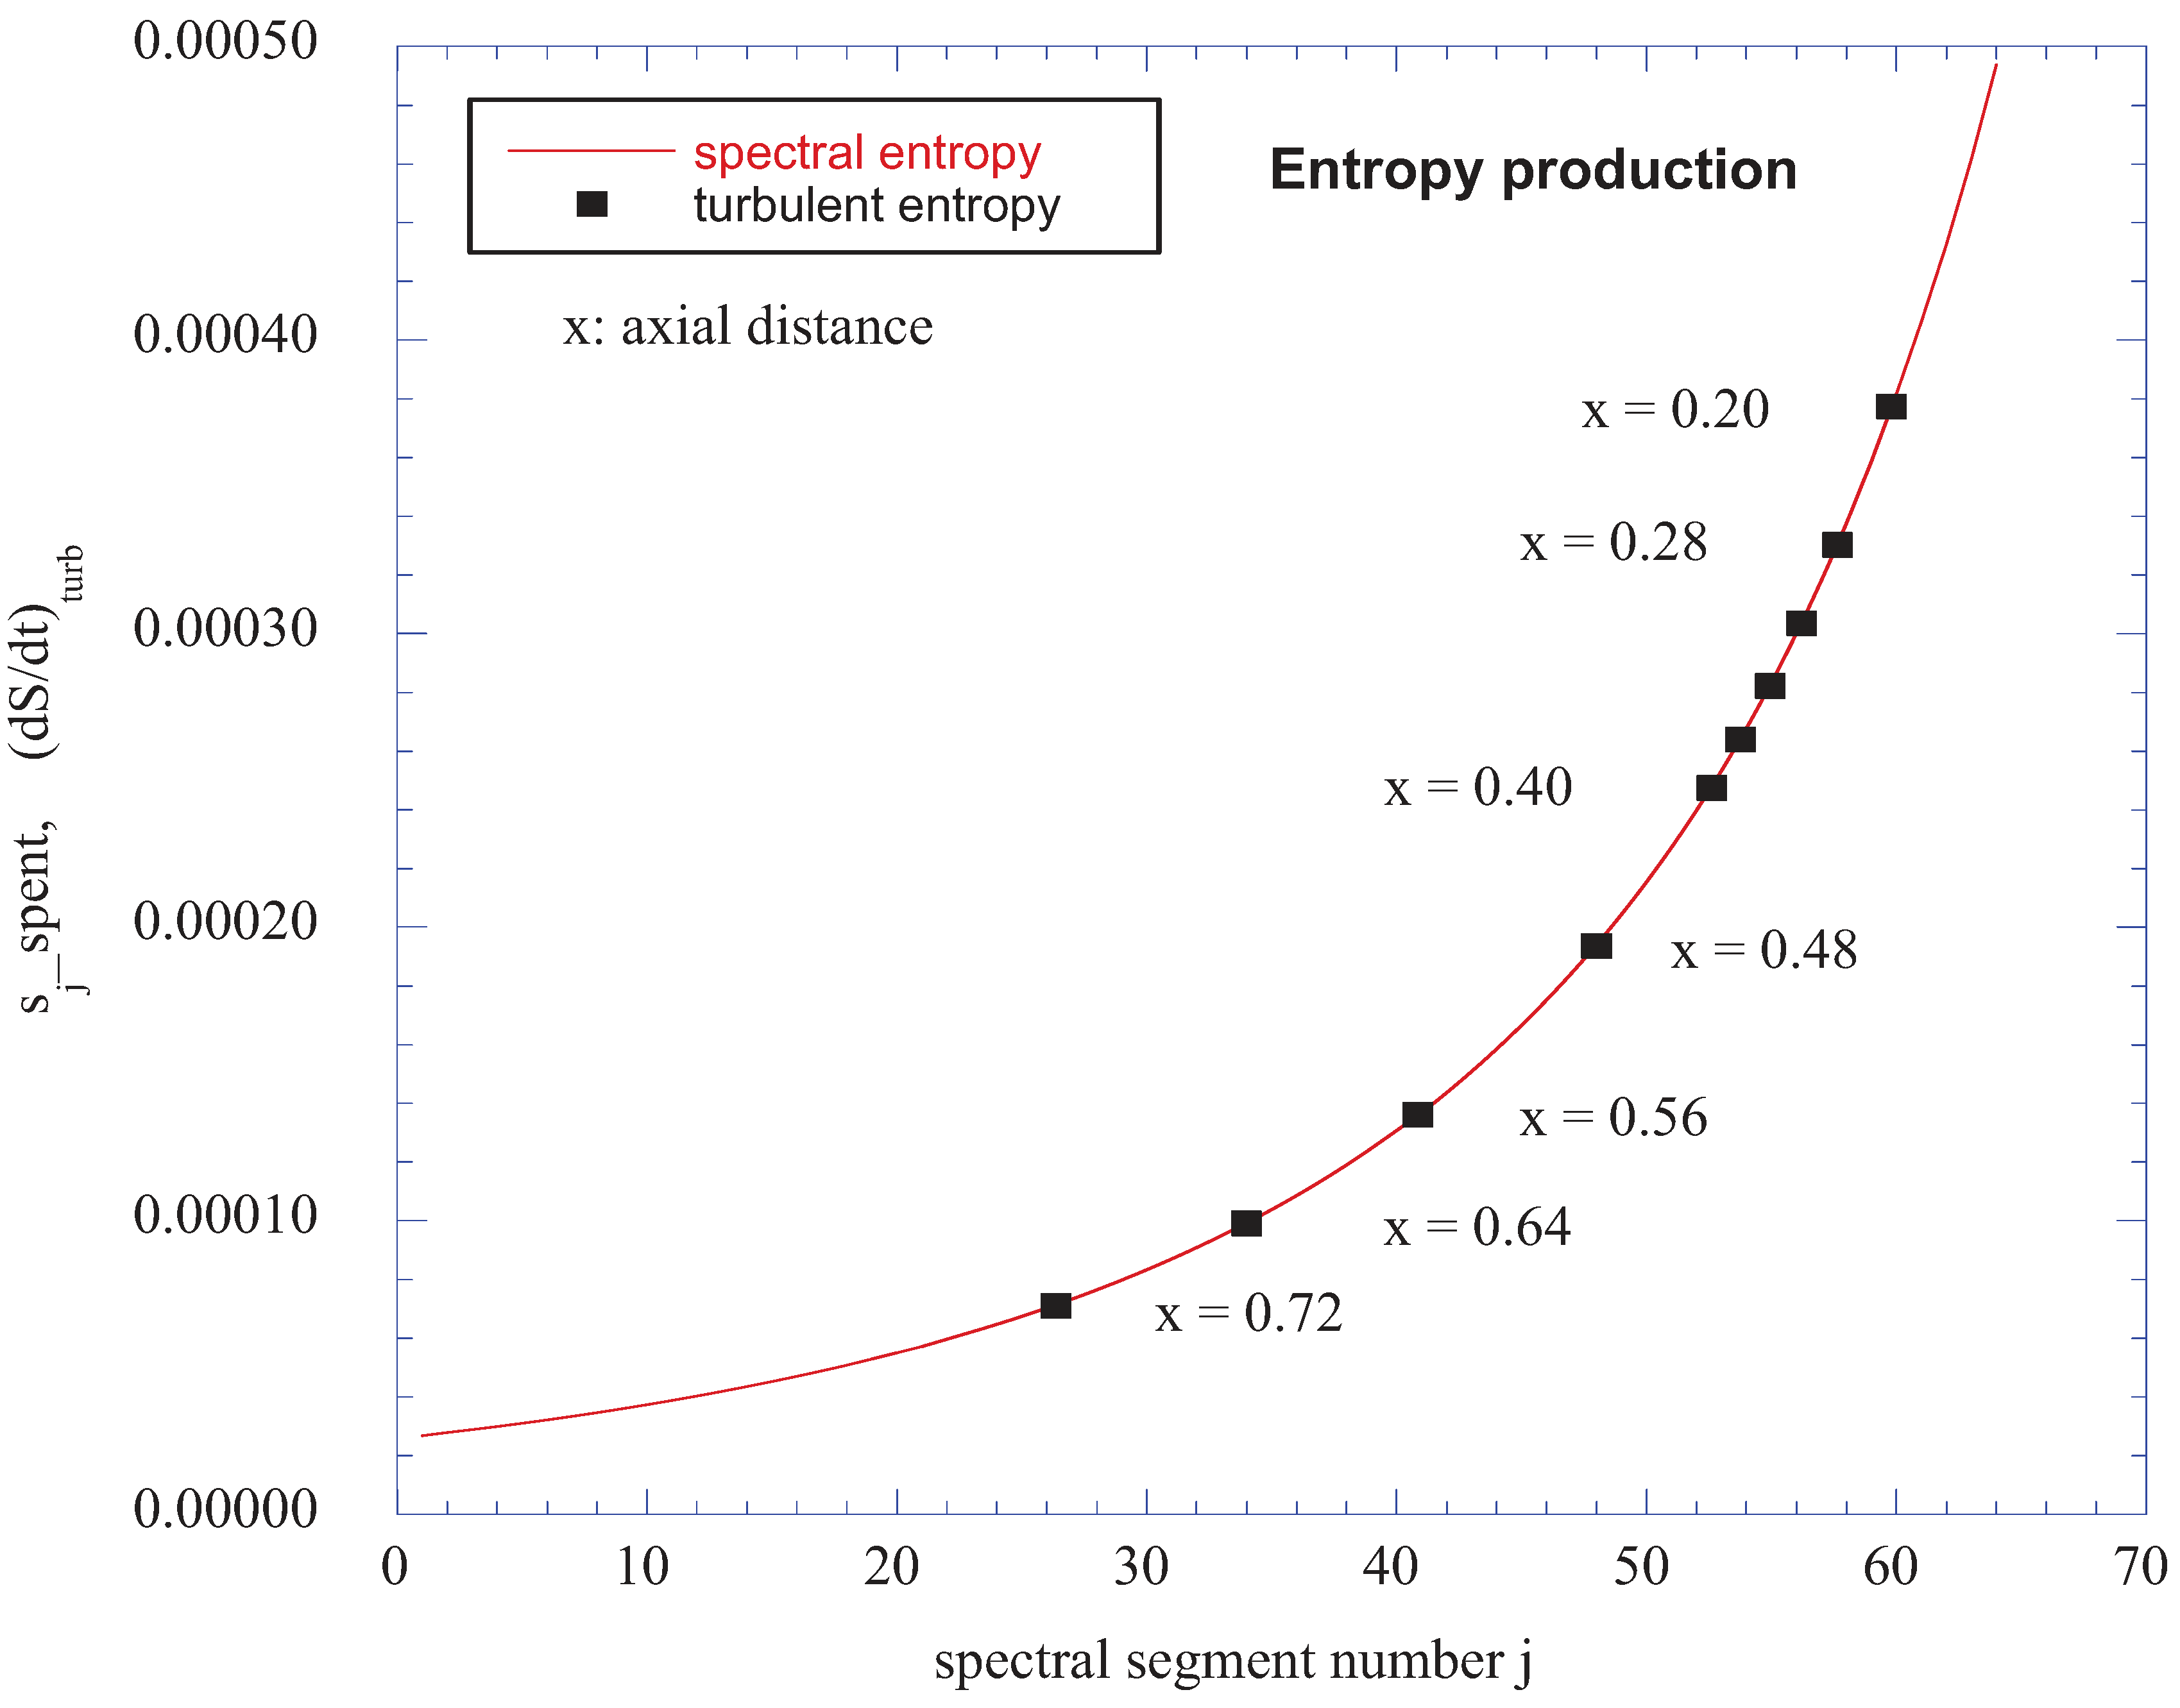
Figure 15 presents the spectral entropy for the vertical station of j = 22 (η = 4.221) at the axial station of nix = 4 (x = 0.08). Here, the spectral entropy does not indicate any peaks or valleys, but a uniformly increasing value across the selected time series. However, these values are three orders of magnitude smaller than the values indicated in the previous peaks of spectral entropy. Also, the dissolution of the instabilities into lower levels of spectral entropy occurs at just over half the height of the boundary layer thickness (η = 4.221 compared with
).
The region of spectral entropy values at j = 22 (η = 4.221) is the region that contributes to the predicted spectral entropy of the overall flow into the boundary-layer dissolution region. This region thus provides a source of flow element kinetic energy available for “dissolution” where the incoming spectral entropy flow is transformed into the wall thermodynamic entropy production region. These incoming flow elements thus provide a flow reservoir of spectral entropy elements, which, through an irrotational “scrambling” process, reach the level of physical scales that ultimately dissipate into background thermodynamic entropy [
46]. Mathieu and Scott [
47] have discussed this “scrambling” process in much more detail. Sagaut and Camdon [
48] have described the flow of spectral entropy elements into the dissipation region as a “streaming” process.
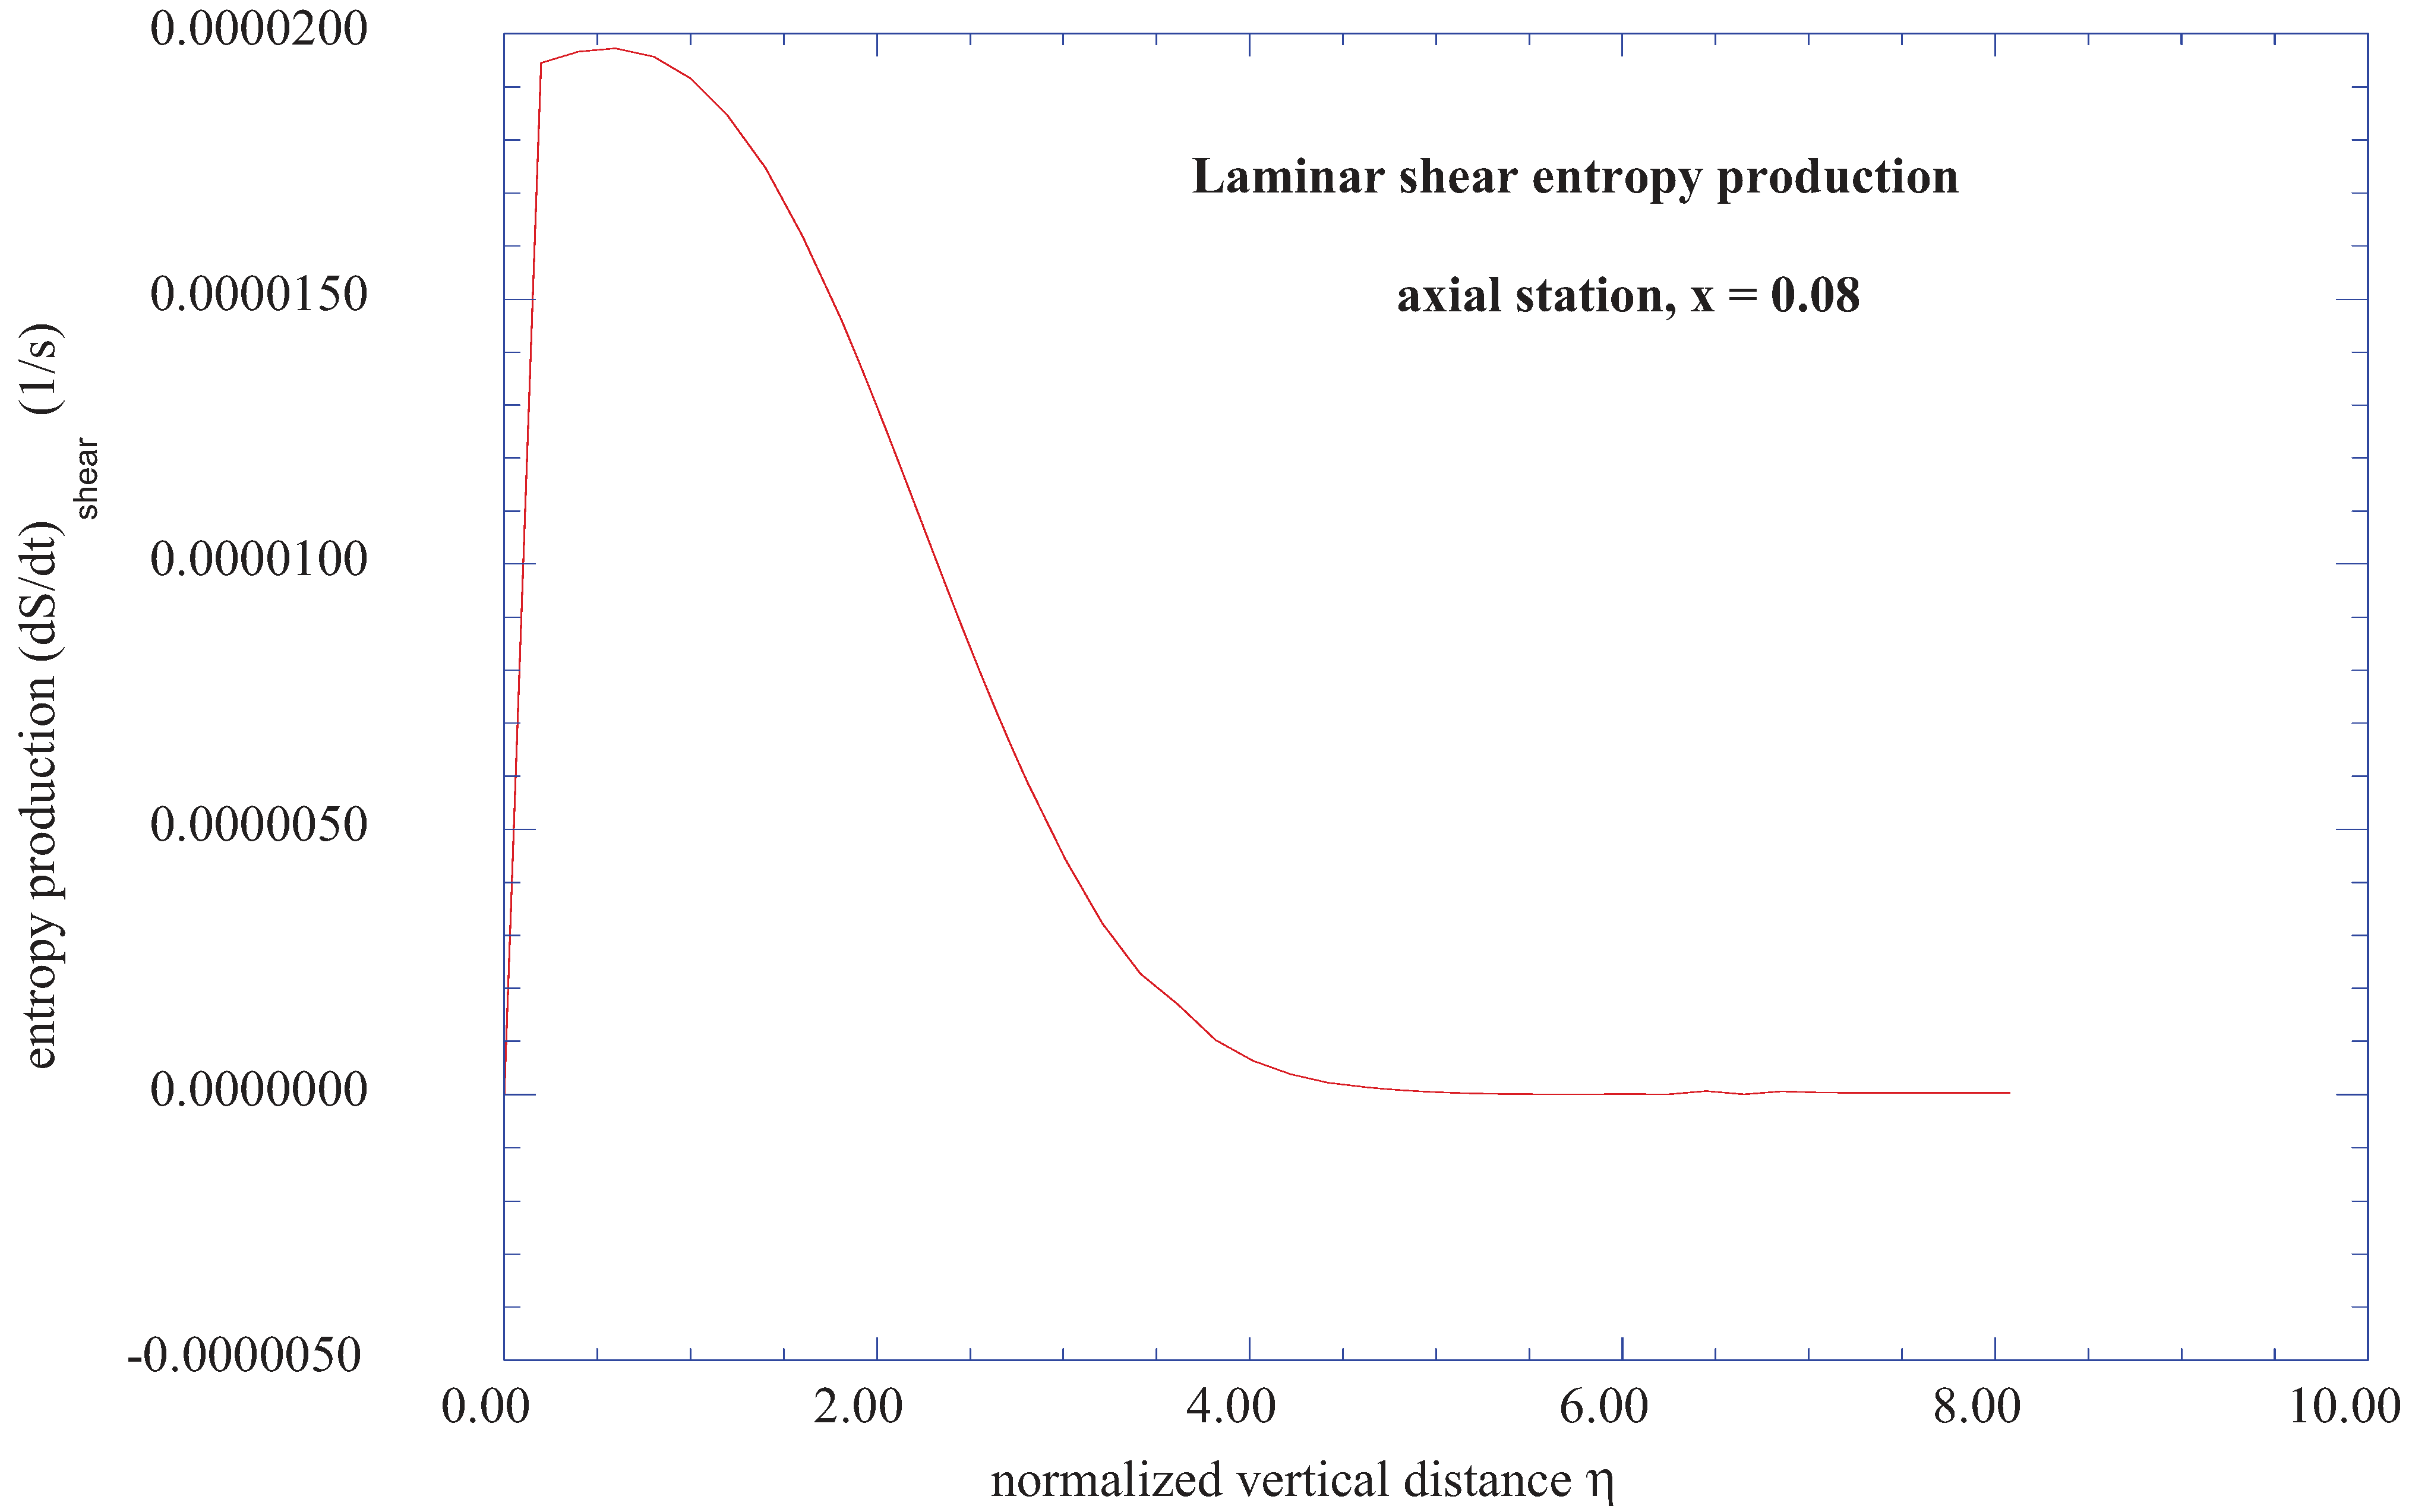
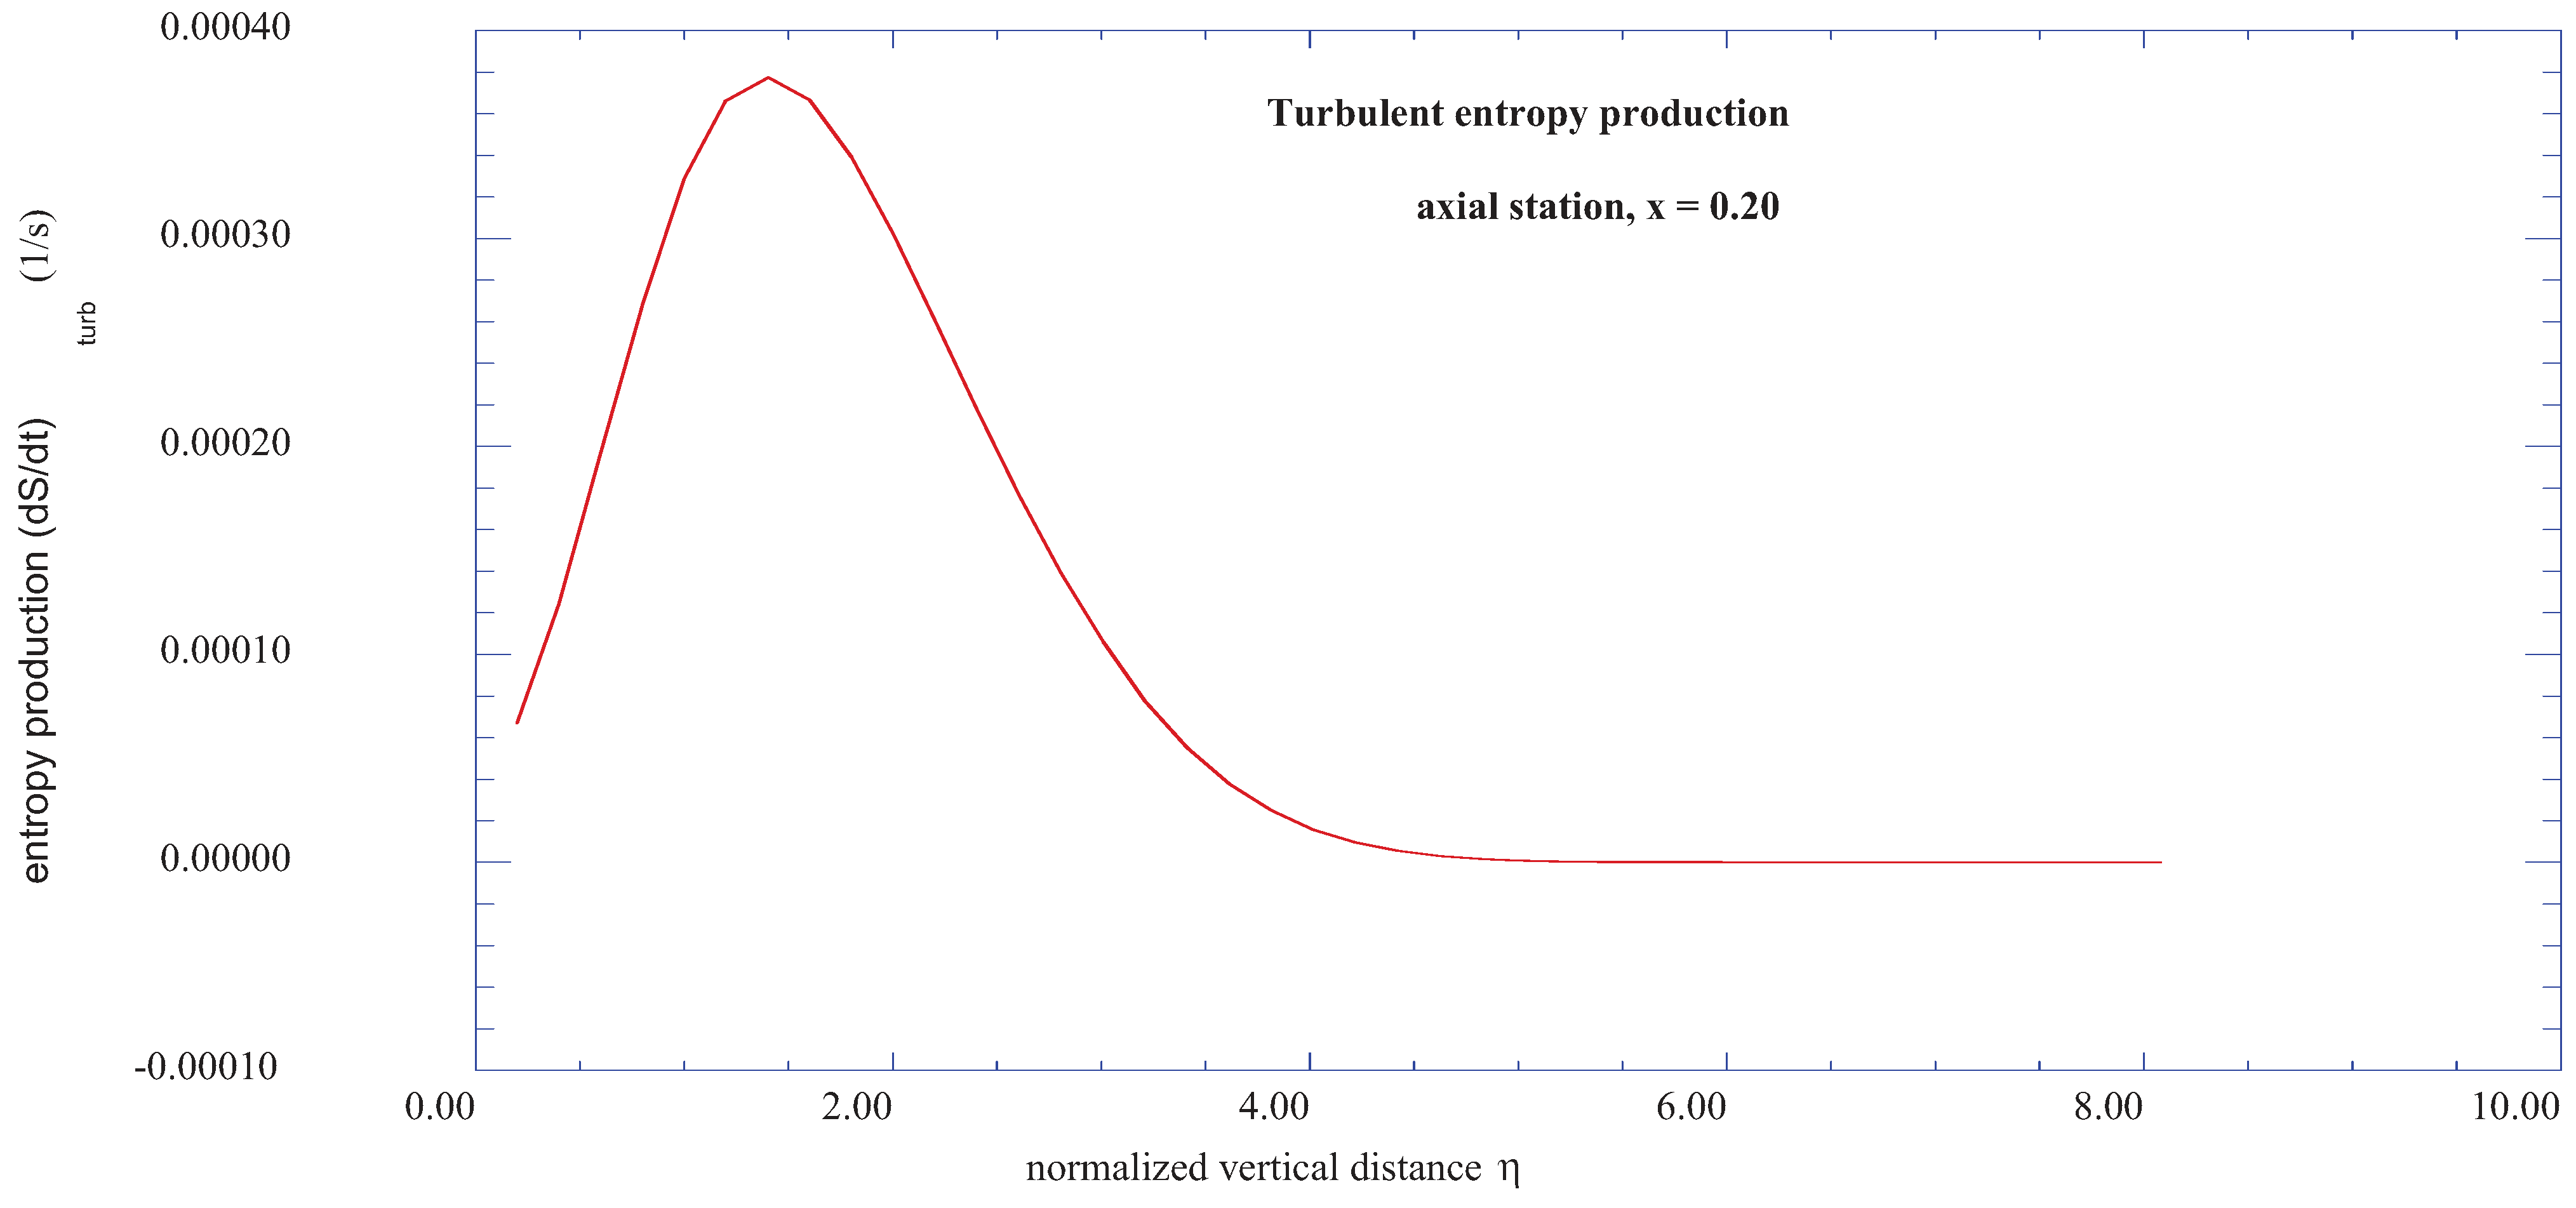
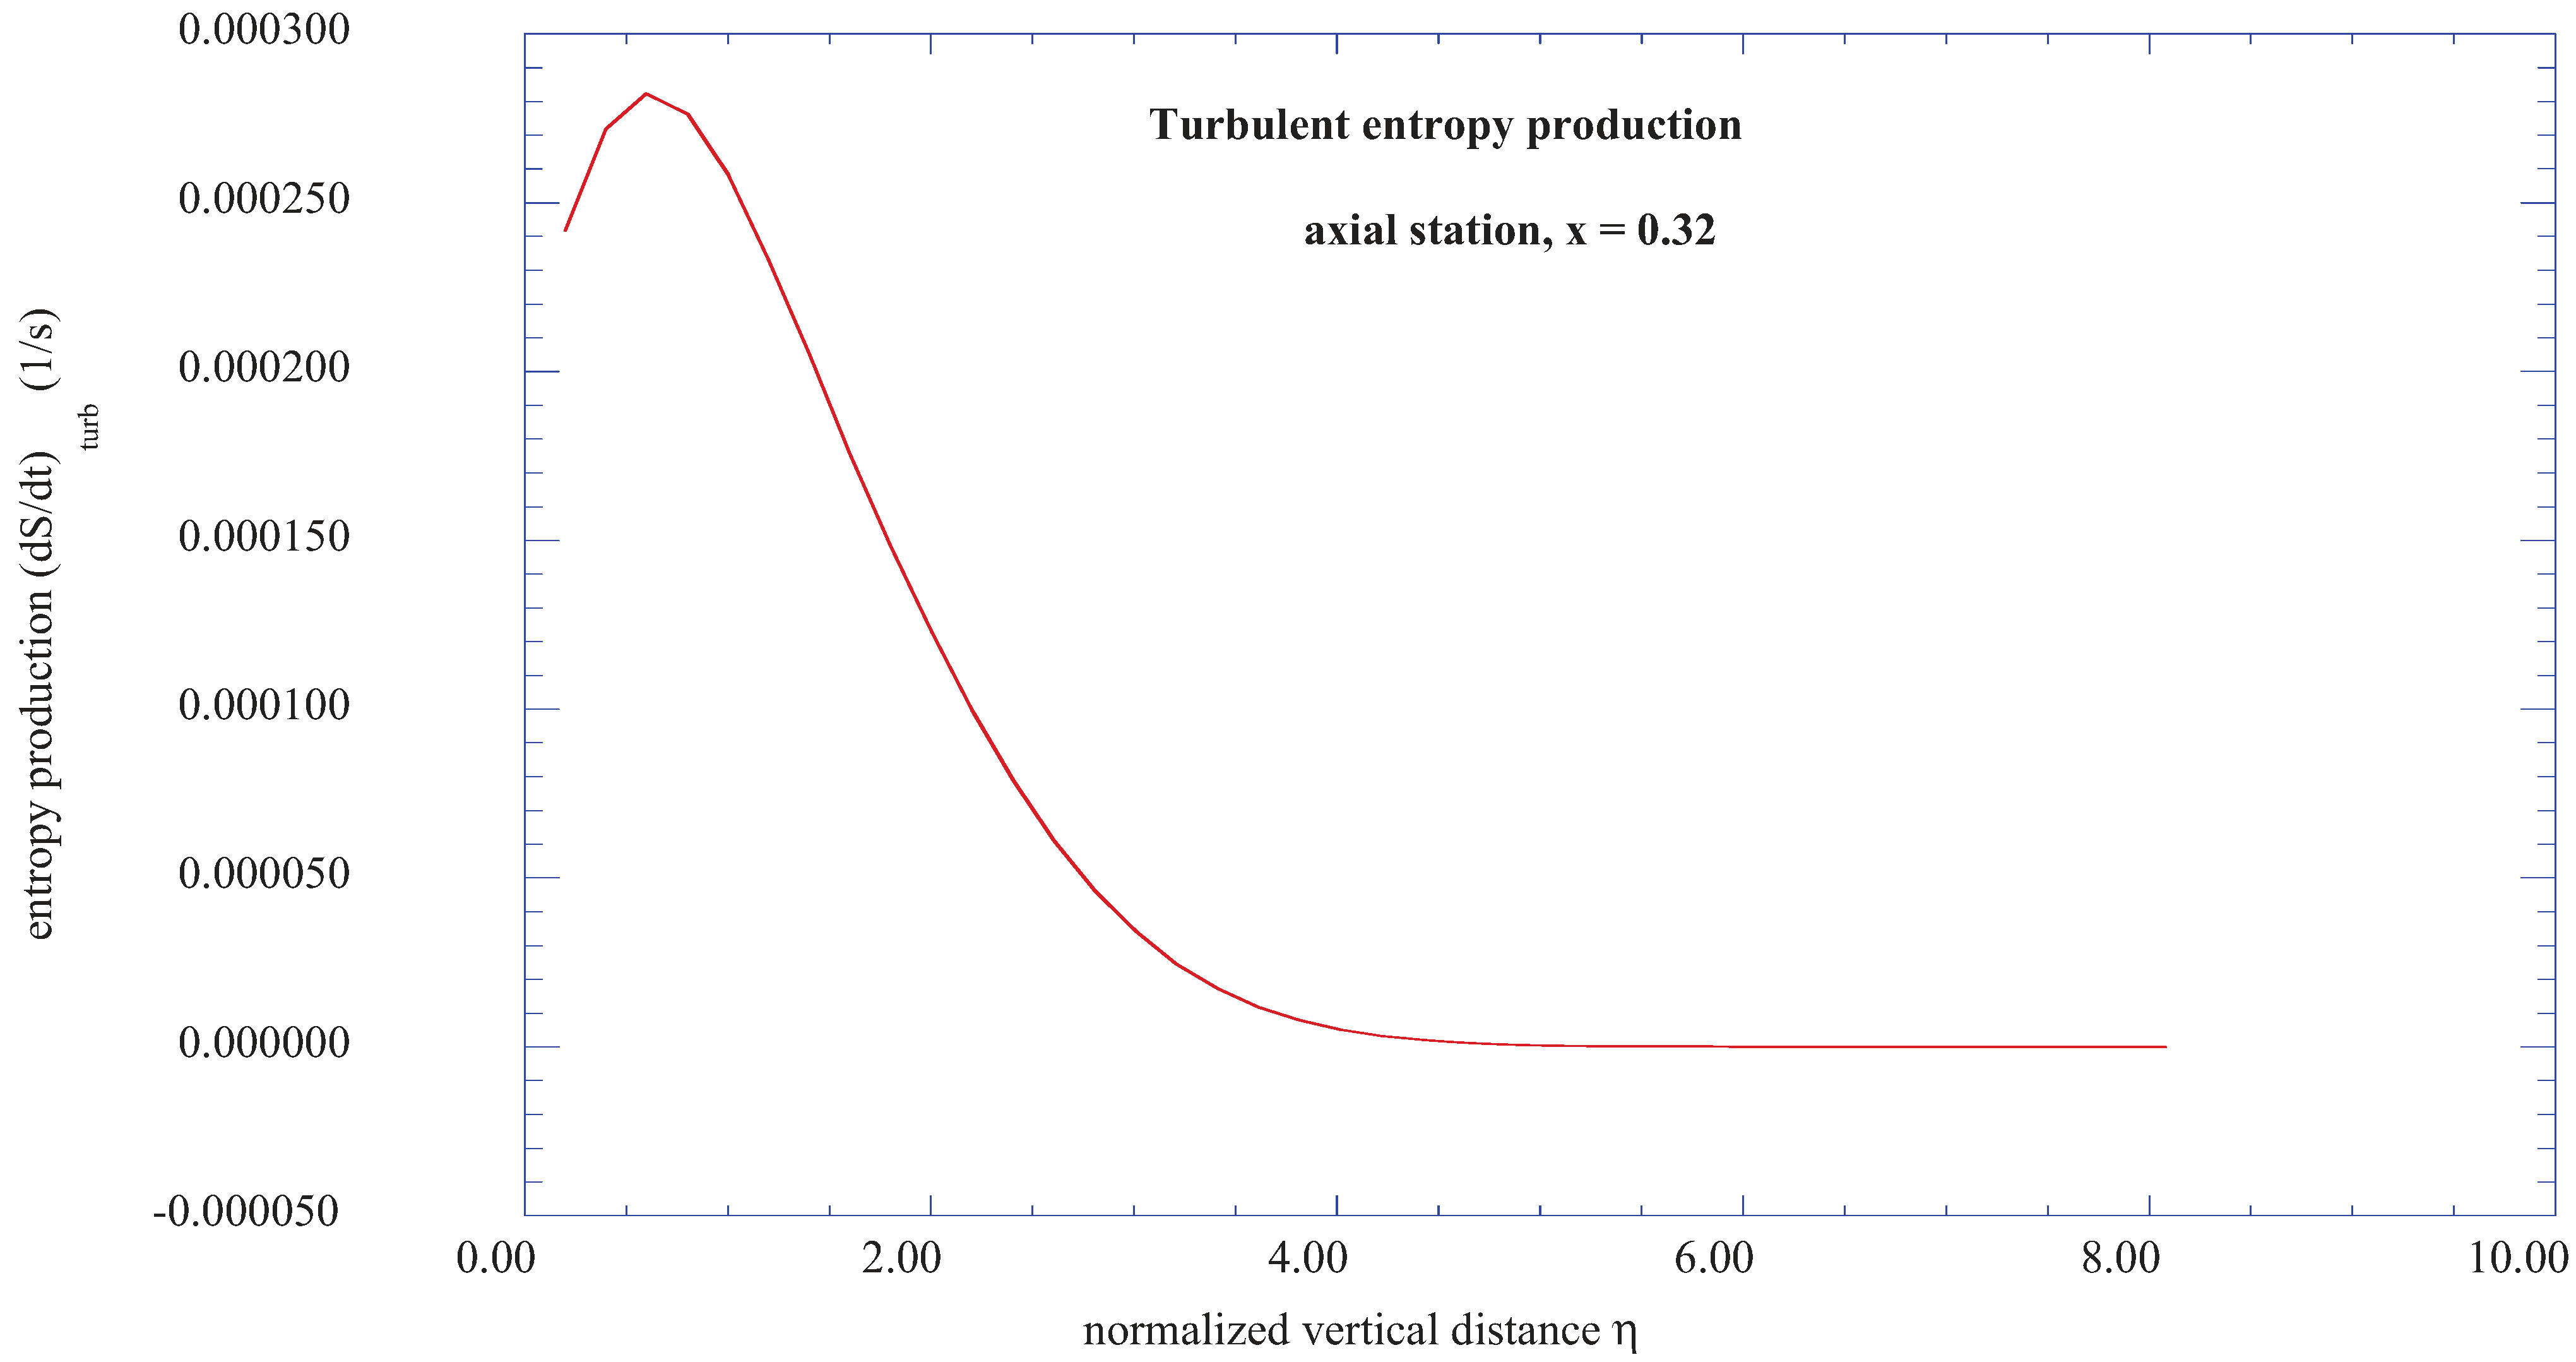
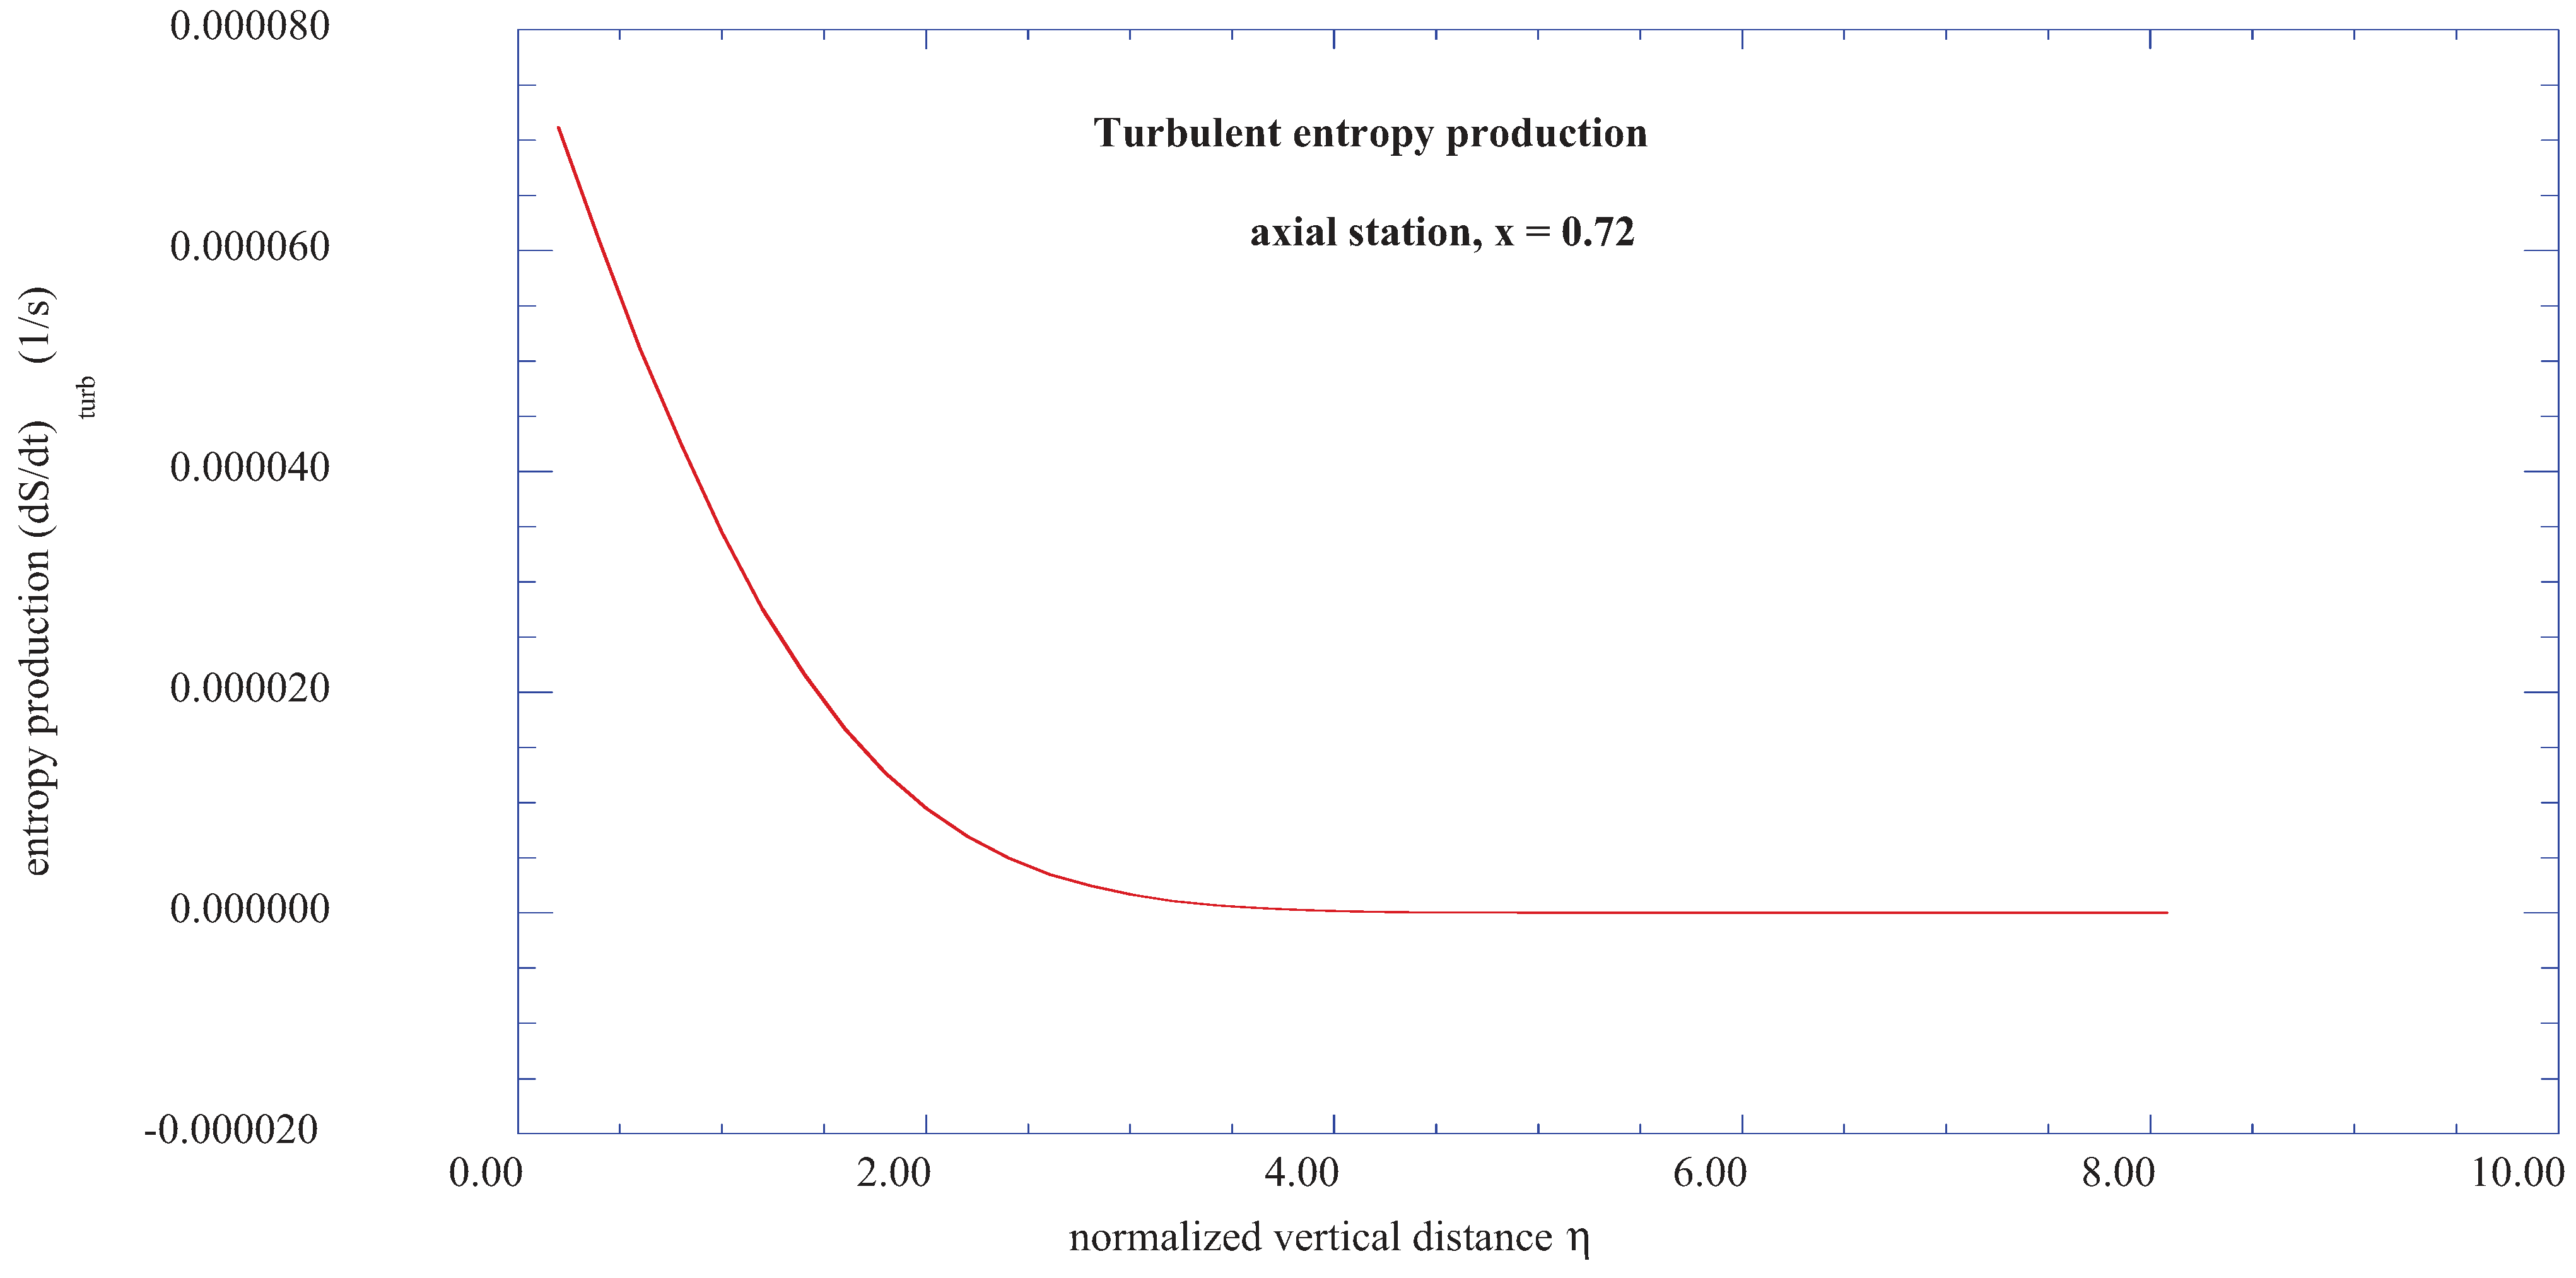
Figure 15 also shows selected maximum turbulent boundary layer entropy production rates for various axial positions along the shear layer. Note that the higher production rates are nearer the origin of the transition region, and decrease in maximum value along the axial distance of the wall shear layer.
Figure 15.
Comparison of wall shear layer maximum entropy production rates at various axial stations with values of spectral entropy of ax2 + ay2 for the vertical location of j = 22 (η = 4.221).
Figure 15.
Comparison of wall shear layer maximum entropy production rates at various axial stations with values of spectral entropy of ax2 + ay2 for the vertical location of j = 22 (η = 4.221).
