Tsallis Mutual Information for Document Classification


Institut d’Informàtica i Aplicacions, Universitat de Girona, Campus Montilvi, Girona 17071, Spain
*
Author to whom correspondence should be addressed.
Entropy 2011, 13(9), 1694-1707; https://doi.org/10.3390/e13091694
Submission received: 1 August 2011
/
Revised: 5 September 2011
/
Accepted: 8 September 2011
/
Published: 14 September 2011
(This article belongs to the Special Issue Tsallis Entropy)
Abstract
:Mutual information is one of the mostly used measures for evaluating image similarity. In this paper, we investigate the application of three different Tsallis-based generalizations of mutual information to analyze the similarity between scanned documents. These three generalizations derive from the Kullback–Leibler distance, the difference between entropy and conditional entropy, and the Jensen–Tsallis divergence, respectively. In addition, the ratio between these measures and the Tsallis joint entropy is analyzed. The performance of all these measures is studied for different entropic indexes in the context of document classification and registration.
1. Introduction
Based on the capability of scanners to transform a large amount of documents to digital images, the automatic processing of administrative documents is a topic of major interest in many office applications. Some examples are noise removal, image extraction, or background detection. Other processes, such as document clustering or template matching, require the definition of document similarity. Document clustering aims to classify similar documents in groups and template matching consists in finding the spatial correspondence of a given document with a template in order to identify the relevant fields of the document.
According to [1], the definition of the similarity between documents can be divided into two main groups based respectively on matching local features, such as the matching of recognized characters [2] or different types of line segments [3], and extracting global layout information, such as the use of a spatial layout representation [4] or geometric features [5]. In this paper, instead of extracting specific pieces of information or analyzing the document layout, we propose to use global measures to evaluate the similarity between two image documents. The similarity between two images can be computed using numerous distance or similarity measures. In the medical image registration field, mutual information has become a standard image similarity measure [6]. In this paper we investigate three different generalizations of this measure based on Tsallis entropy. As it was previously noted in [7], the main motivation for the use of non-extensive measures in image processing is the presence of correlations between pixels of the same object in the image that can be considered as long-range correlations. Although our analysis can be extended to a wide variety of document types, in this paper we focus our attention on invoice classification. In our experiments, we show the good performance of some of the proposed measures using an invoice database composed by colored images.
This paper is organized as follows. Section 2 briefly reviews some previous work on information theory and its use in image registration and document classification. Section 3 presents three generalizations of mutual information that will be applied to document classification. Section 4 presents our general framework for document processing. Section 5 analyzes the obtained results in invoice classification and registration. Finally, Section 6 presents conclusions and future work.
2. Related Work
In this section, we review some basic concepts on information theory, image registration and document image analysis.
2.1. Information-Theoretic Measures
Let be a finite set, let X be a random variable taking values with distribution . Likewise, let Y be a random variable taking values . The Shannon entropy of a random variable X is defined by
The Shannon entropy measures the average uncertainty of random variable X. If the logarithms are taken in base 2, entropy is expressed in bits. The conditional entropy is defined by
where is the joint probability and is the conditional probability. The conditional entropy measures the average uncertainty associated with X if we know the outcome of Y. The mutual information () between X and Y is defined by
is a measure of the shared information between X and Y.
An alternative definition of can be obtained from the definition of the informational divergence or Kullback–Leibler distance (). The distance between two probability distributions p and q [8,9], that are defined over the alphabet , is given by
The conventions that and if are adopted. The informational divergence satisfies the information inequality , with equality if and only if . The informational divergence is not strictly a metric since it is not symmetric and does not satisfy the triangle inequality. Mutual information can be obtained from the informational divergence as follows [8]:
Thus, mutual information can also be seen as the distance between the joint probability distribution and the distribution , i.e., the distance of the joint distribution to the independence.
Mutual information can be also expressed as a Jensen–Shannon divergence. Since Shannon entropy is a concave function, from Jensen’s inequality, we can obtain the Jensen–Shannon inequality [10]:
where is the Jensen–Shannon divergence of probability distributions with prior probabilities or weights , fulfilling . The JS-divergence measures how `far’ are the probabilities from their likely joint source and equals zero if and only if all are equal. Jensen–Shannon’s divergence coincides with when is equal to the marginal probability distribution and are equal to the rows of the probability conditional matrix of the information channel . Then, can be redefined as
A generalization of the Shannon entropy was given by Tsallis in [11]:
where and . is a concave function of p for and when (and natural logarithms are taken in the definition of the Shannon entropy).
2.2. Image Registration
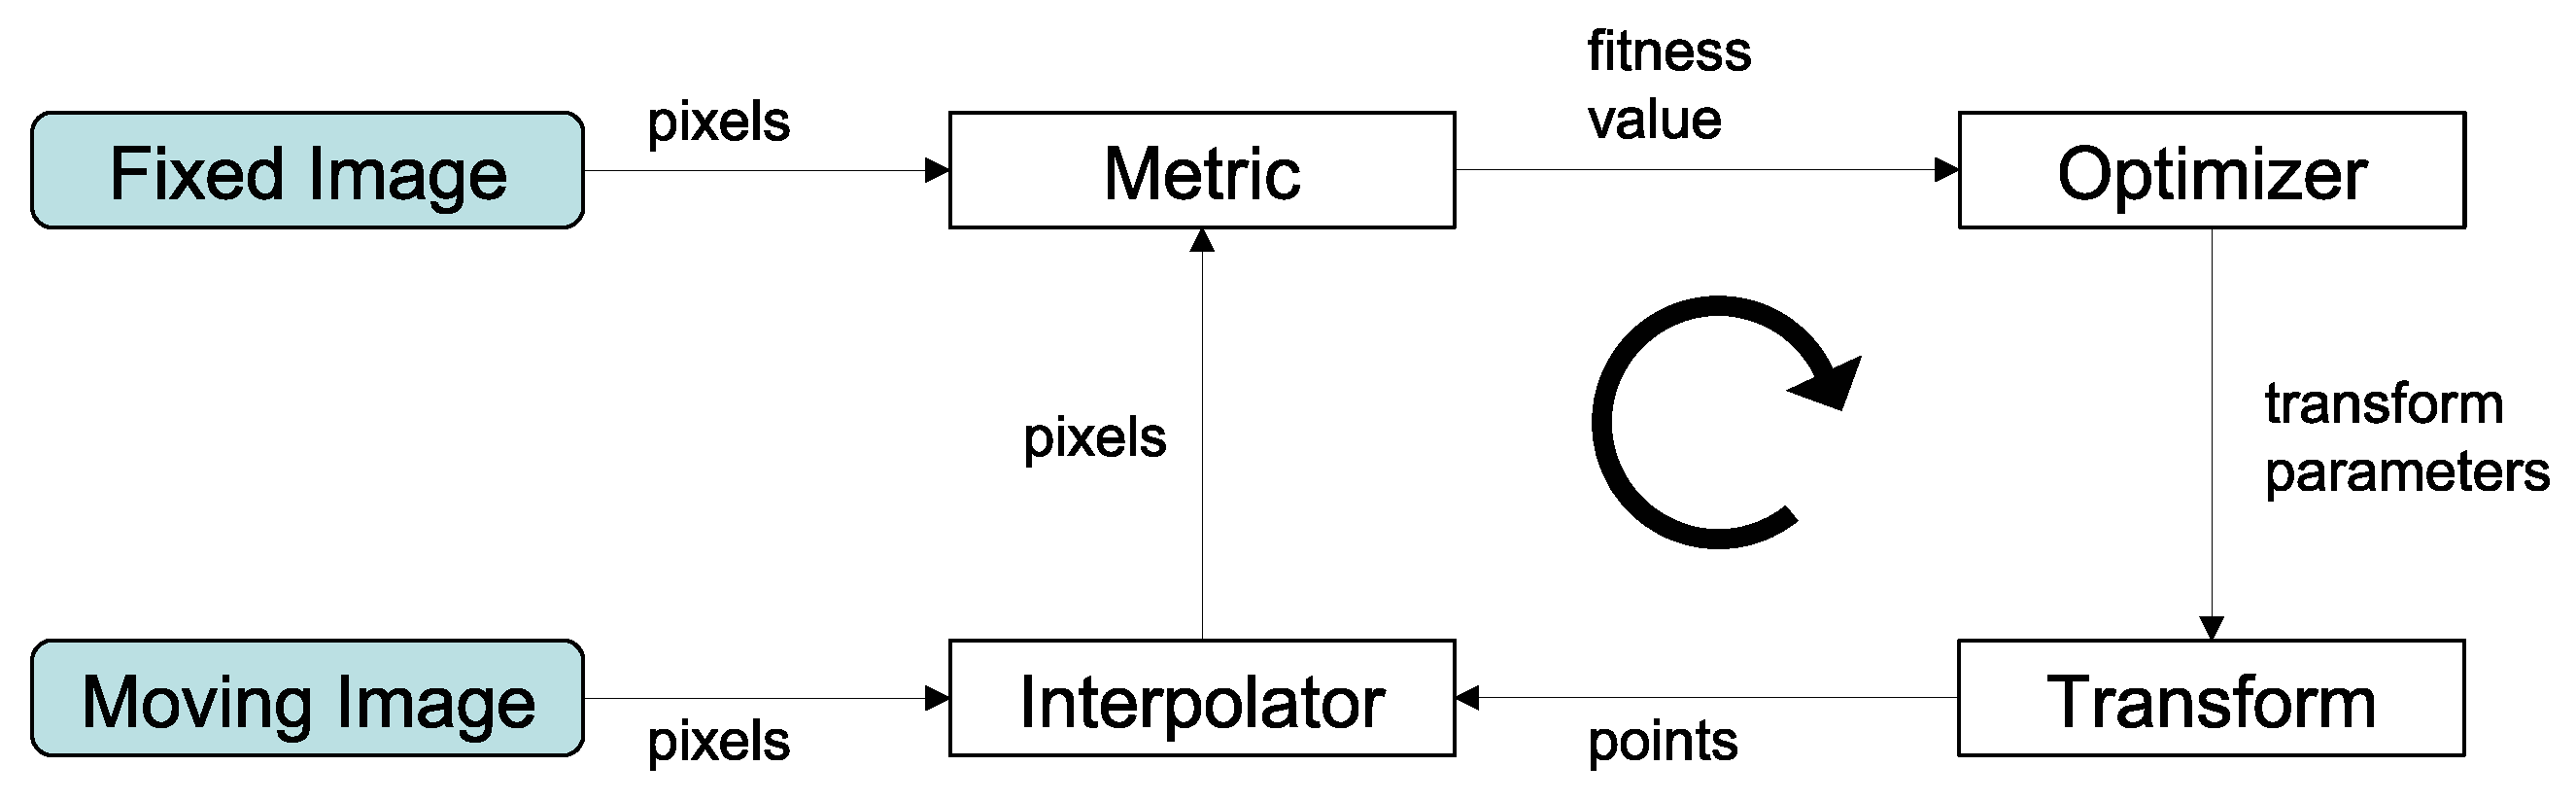
Image registration is treated as an iterative optimization problem with the goal of finding the spatial mapping that will bring two images into alignment. This process is composed of four elements (see Figure 1). As input, we have both fixed X and moving Y images. The transform represents the spatial mapping of points from the fixed image space to points in the moving image space. The interpolator is used to evaluate the moving image intensity at non-grid positions. The metric provides a measure of how well the fixed image is matched by the transformed moving one. This measure forms the quantitative criterion to be optimized by the optimizer over the search space defined by the parameters of the transform.
Figure 1.
Main components of the registration process.processregistre
The crucial point of image registration is the choice of a metric. One of the simplest measures is the sum of squared differences (SSD). For N pixels in the overlap domain of images A and B, this measure is defined as
where and represent the intensity at a pixel i of the images A and B, respectively, and N the number of overlapping pixels. When this measure is applied, we assume that the image values are calibrated to the same scale. This measure is very sensitive to a small number of pixels that have very large intensity differences between images A and B. Another common image similarity measure is the correlation coefficient (CC), which is defined as
where is the mean pixel value in image and is the mean of . While the makes the implicit assumption that the images differ only by Gaussian noise, the assumes that there is a linear relationship between the intensity values in the images [12].
From the information theory perspective, the registration between two images X and Y (associated with the random variables X and Y, respectively) can be represented by an information channel , where its marginal and joint probability distributions are obtained by simple normalization of the corresponding intensity histograms of the overlap area of both images [13]. The most successful automatic image registration methods are based on the maximization of . This method, almost simultaneously introduced by Maes et al. [13] and Viola et al. [14], is based on the conjecture that the correct registration corresponds to the maximum between the overlap areas of the two images. Later, Studholme et al. [15] proposed a normalization of mutual information defined by
which is more robust than , due to its greater independence of the overlap area. Another theoretical justification of its good behavior is that is a true distance. Different measures derived from the Tsallis entropy have also been applied to image registration [16,17,18,19].
2.3. Document Image Similarity
In the context of document image analysis, image similarity is mainly used for classification purposes in order to index, retrieve, and organize specific document types. Nowadays, this task is especially important because huge volumes of documents are scanned to be processed in an automatic way. Some automatic solutions based on optical character recognition (OCR), bank check reader, postal address reader and signature verifier, have already been proposed but a lot of work has still to be done to classify other types of documents such as tabular forms, invoices, bills, and receipts [20]. Chen and Blostein [21] presented an excellent survey on document image classification.
Many automatic classification techniques of image documents are based on the extraction of specific pieces of information from the documents. In particular, OCR software is especially useful to extract relevant information in applications that are restricted to a few specific models where the information can be located precisely [22]. However, many applications require to deal with a great variety of layouts, where relevant information is located in different positions. In this case, it is necessary to recognize the document layout and apply the appropriate reading strategy [23]. Several strategies have been proposed to achieve an accurate document classification based on the layout analysis and classification [1,4,5,23,24,25].
An invoice is a commercial document issued by a seller, containing details about the seller, the buyer, products, quantities, prices, etc., and usually a logo and tables. Hamza et al. [20] identify two main research directions in invoice classification. The first one concerns data-based systems and the second one concerns model-based systems. Data-based systems are usually used in heterogeneous document flows and extract different information from documents, such as tables [26], graphical features such as logos and trademarks [27], or the general layout [23]. On the contrary, model-based systems are used in homogeneous document flows, where similar documents arrive generally one after the other [28,29,30,31].
In this paper, we focus our attention on capturing visual similarity between different document images using global measures that do not require the analysis of the document layout. In the literature of document image classification, different measures of similarity have been used. Appiani et al. [23] design a criterion to compare the structural similarity between trees that represent the structure of a document. Shin and Doermann [24] use a similarity measure that considers spatial and layout structure. This measure quantifies the relatedness between two objects, combining structural and content features. Behera et al. [32] propose to measure the similarity between two images by computing the distance between their respective kernel density estimation of the histograms using the Minkowski distance or the intersection of the histograms.
3. Generalized Mutual Information
We review here three different mutual information generalizations based on the Kullback–Leibler distance, the difference between entropy and conditional entropy, and the Jensen–Tsallis divergence, respectively.
3.1. Mutual Information
From Equation (5), we have seen that mutual information can be expressed as the Kullback–Leibler distance between the joint probability distribution and the distribution . On the other hand, Tsallis [33] generalized the Kullback–Leibler distance in the following form:
Although a simple substitution of for can be used as an absolute similarity measure between two images, we focus our interest on a relative one. Such a decision is motivated by the better behavior of with respect to [15]. Then, the generalization of can be given by
Although is a normalized measure for , this is not true for other α values as can take values greater than 1. This measure is always positive and symmetric.
3.2. Mutual Entropy
Another way of generalizing mutual information is the so-called Tsallis mutual entropy [35]. The Tsallis mutual entropy is defined for as
This measure is positive and symmetric and Tsallis joint entropy is an upper bound [35]. Tsallis mutual entropy represents a kind of correlation between X and Y.
3.3. Jensen–Tsallis Information
Since Tsallis entropy is a concave function for , the Jensen–Shannon divergence can be extended to define the Jensen–Tsallis divergence:
As we have seen in Equation (7), Jensen–Shannon divergence coincides with when is the marginal probability distribution , and are the rows of the probability conditional matrix of the channel. Then, for the channel , a generalization of mutual information, which we call Jensen–Tsallis Information () can be expressed by
For the reverse channel , we have
This measure is positive and, in general, non-symmetric with respect to the reversion of the channel. Thus, . An upper bound of this measure is given by the Tsallis joint entropy: . The Jensen–Tsallis divergence and its properties have been studied in [17,36].
Similar to the previous measures, a normalized version of can be defined as
This measure will also take values in the interval .
4. Overview
Large organizations and companies deal with a large amount of documents, such as invoices and receipts, which are usually scanned and stored in a database as image files. Then, some information of these images, such as the seller, the date, or the total amount of the invoice, is integrated in the database via manual editing or OCR techniques.
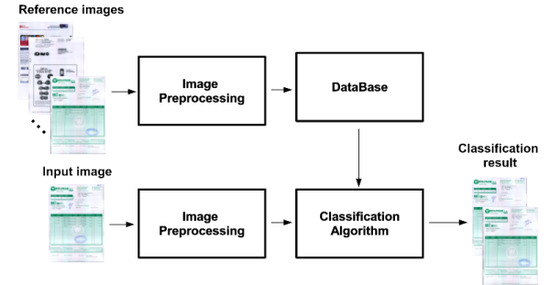
A critical issue for document analysis is the classification of similar documents. The documents of the same class can share some interesting information such as the background color, the document layout, the position of the relevant information on the image, or metadata, such as the seller. Once one document is grouped into a class, an specific processing for extracting the desired information can be designed depending on these features [23]. A simple way to define a class consists in taking a representative image. Then, we can create a database with the representative images and every new entry in the database is grouped into the class that the similarity between the new image and the representative image is maximum. A general scheme of our framework is represented in Figure 2. There are two different groups of images. The first one, formed by the reference images, is given by a document set where all documents are different between them and where each document represents a document type that identifies a class. This group of documents forms the document database. The second one, composed by the input images, is given by a set of documents that we want to use as classifier input with the aim of finding their corresponding class within the database of the reference images. Note that each input image has one, and only one, reference image, and different input images can have the same reference image.
Figure 2.
Document classification pipeline.
The main goal of this paper is to analyze the application of the Tsallis-based generalizations of mutual information presented in the previous section to the document classification process. In the experiments of document classification carried out in this paper, we do not apply any spatial transform to the images as we assume that they are approximately aligned.
Another objective of this paper is to analyze the performance of the Tsallis-based generalizations of mutual information in aligning two documents. This is also a critical point since it allows us to find the spatial correspondence between an input document and a template. The registration framework used in this paper is represented in Figure 1.
5. Results and Discussion
To evaluate the similarity between two document images, the similarity measures presented in Section 3 have been implemented in Visual C++ .NET. In our experiments, we have dealt with a color invoice database, where 24-bits per pixel (8-bits for each RGB color channel) are used. These images usually present a complex layout, including pictures, logos, and highlighted areas. The database is composed by 51 reference invoices and 95 input invoices to be classified. It is required that each input invoice has one and only one reference invoice of the same type in the database. This reference invoice is similar (i.e., from the same supplier) but not identical to the input invoice. In our first experiment on invoice classification, we assume that the images to be compared are fairly well aligned.
The reference and input invoices have been preprocessed using the method presented in [37] with the aim of correcting the skew error introduced during the scanning process. Although the skew error is corrected, they still present small translation errors between them. Preliminary experiments have shown that the best classification results are obtained for resolutions with height between 100 and 200 pixels. Note that this fact greatly speeds up the computation process as computation time is proportional to image resolution. In our experiments, all images have been scaled from the original scanning resolution (around pixels) to a height of 100 pixels, conveniently adjusting the image width to keep the aspect ratio of the images.
Let us remember that the main objective is to calculate the degree of similarity between each input invoice and all reference invoices. In this way, an ordered list of reference invoices, called similarity list, can be obtained from the degree of similarity (from the highest to the lowest) between both the input and the reference invoices. Thus, we interpret that the first reference invoice of the list is the class assigned to the input invoice.
Next, two performance measures are considered for comparison purposes: the percentage of success and the classification error. The percentage of success is given by the number of correctly classified input invoices (i.e., the corresponding reference image of the input invoice has been set to the first place in the similarity list) over the total number of inputs. Given an input invoice, the classification error is determined by the position of the corresponding reference invoice in the similarity list. If the reference invoice is chosen properly, this will be located at position 0 of the list.
Table 1 shows the two performance values for each measure and different α values. Note that the values for the and measures are not shown for since these measures are only defined for . For , the corresponding Shannon measures are considered in all cases. The first parameter represents the classification success in percentage and the second, in parentheses, represents the mean of classification error of the misclassified input invoices. As it can be seen, we can observe that the measures have a different behavior with respect to the α values. While and achieve the best classification success for α values between 0.4 and 1.2, the rest of the measures (, , , ) perform better for α values between 1.0 and 1.4. For these values, the normalized measures classify correctly all the documents. In general, the normalized measures perform much better than the corresponding non normalized ones. We have also tested the performance of and measures and we have obtained a classification success of and , respectively. Note that these results are worse than the ones obtained using the proposed Tsallis-based measures.

Table 1.
The percentage of classification success and the mean of classification error of the misclassified input invoices (in parentheses) for different measures and α values.
| α values | ||||||||||||
|---|---|---|---|---|---|---|---|---|---|---|---|---|
| 0.2 | 96.84 | (1.67) | 92.63 | (1.29) | 71.58 | (6.26) | 69.47 | (9.00) | ||||
| 0.4 | 98.95 | (2.00) | 100.0 | (0.00) | 80.00 | (2.58) | 81.05 | (3.39) | ||||
| 0.6 | 98.95 | (1.00) | 100.0 | (0.00) | 90.53 | (1.67) | 89.47 | (1.30) | ||||
| 0.8 | 98.95 | (1.00) | 100.0 | (0.00) | 94.74 | (1.40) | 94.74 | (1.00) | ||||
| 1.0 | 98.95 | (2.00) | 100.0 | (0.00) | 98.95 | (2.00) | 100.0 | (0.00) | 98.95 | (2.00) | 100.0 | (0.00) |
| 1.2 | 98.95 | (2.00) | 100.0 | (0.00) | 87.37 | (2.58) | 100.0 | (0.00) | 97.89 | (1.00) | 100.0 | (0.00) |
| 1.4 | 97.89 | (1.50) | 97.89 | (1.00) | 78.95 | (6.40) | 100.0 | (0.00) | 97.89 | (1.50) | 100.0 | (0.00) |
| 1.6 | 94.74 | (1.40) | 94.74 | (1.00) | 72.63 | (8.27) | 97.89 | (1.50) | 96.84 | (1.33) | 97.89 | (1.00) |
| 1.8 | 89.47 | (2.10) | 90.53 | (1.56) | 67.37 | (9.65) | 93.68 | (2.50) | 96.84 | (1.33) | 97.89 | (1.00) |
| 2.0 | 87.37 | (2.33) | 86.32 | (2.15) | 63.16 | (10.66) | 91.58 | (4.86) | 96.84 | (1.33) | 97.89 | (1.00) |
| 2.2 | 75.79 | (2.13) | 77.89 | (2.10) | 54.74 | (10.23) | 88.42 | (6.64) | 96.84 | (1.33) | 97.89 | (1.00) |
| 2.4 | 67.37 | (2.61) | 70.53 | (2.50) | 52.63 | (10.78) | 86.32 | (8.31) | 96.84 | (1.33) | 97.89 | (1.00) |
| 2.6 | 65.26 | (3.06) | 66.32 | (2.97) | 46.32 | (10.55) | 85.26 | (9.50) | 96.84 | (1.33) | 97.89 | (1.00) |
| 2.8 | 64.21 | (3.50) | 64.21 | (3.38) | 42.11 | (10.60) | 81.05 | (8.67) | 96.84 | (1.33) | 97.89 | (1.00) |
| 3.0 | 63.16 | (3.80) | 64.21 | (3.79) | 38.95 | (10.93) | 77.89 | (8.67) | 97.89 | (1.50) | 100.0 | (0.00) |
The classification error (shown between parentheses in Table 1) allows us to evaluate to what extent the classification is wrong when an invoice is misclassified. If this value is low, the system could suggest a short list of class candidates and the user could select the correct one, while if this value is high that is not recommendable. From the results, we can conclude that, for a high range of α values, methods identify the correct class in the first positions (for almost all cases the mean classification error is lower than 5). Thus, the short list can be taken into account for the final user interface design. The classification error obtained using and measures is 20.25 and 6.73, respectively. Note also that Tsallis-based measures clearly outperform and measures.
Our second experiment analyzes the capability of the Tsallis-based proposed measures to align two similar documents in the same spatial coordinates. In this case, two different features, robustness and accuracy, have been studied.
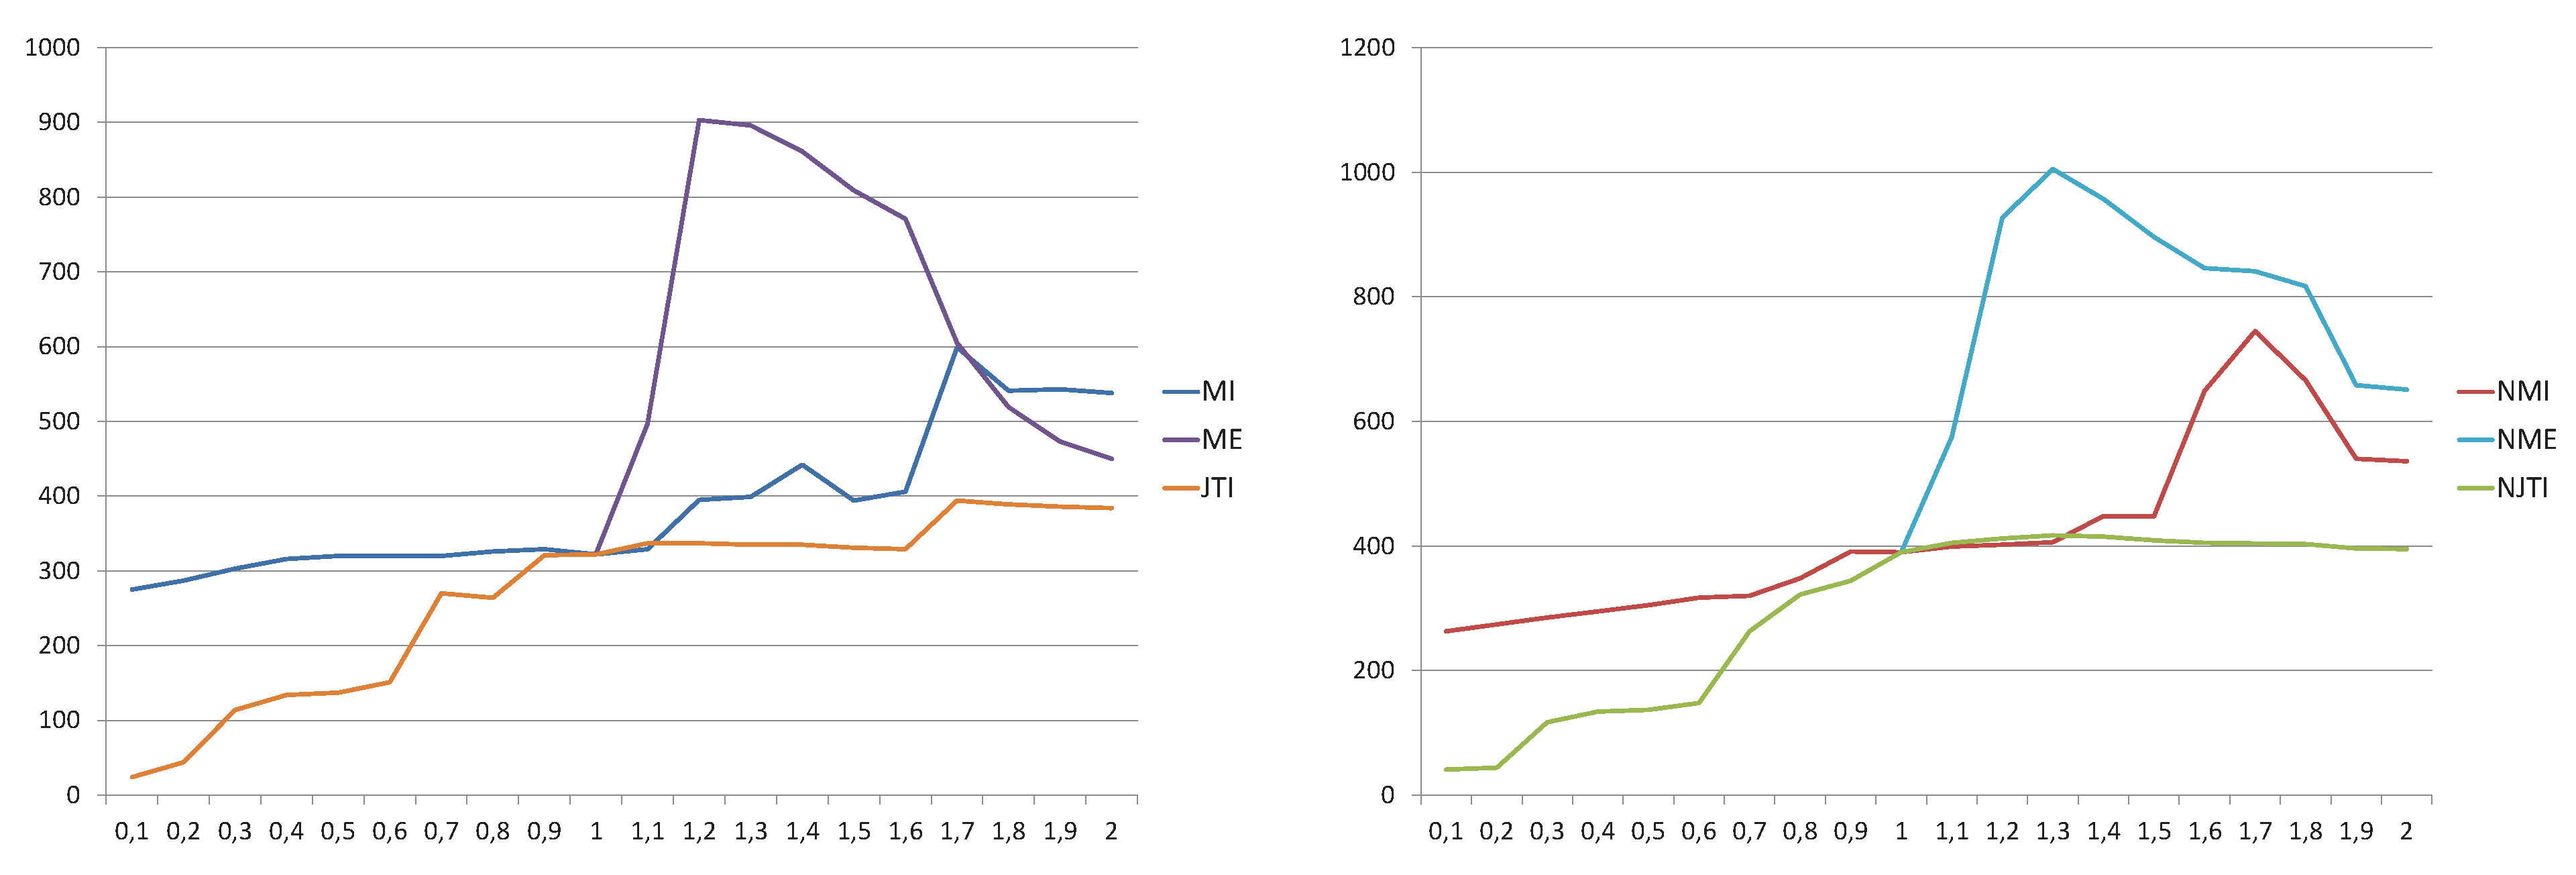
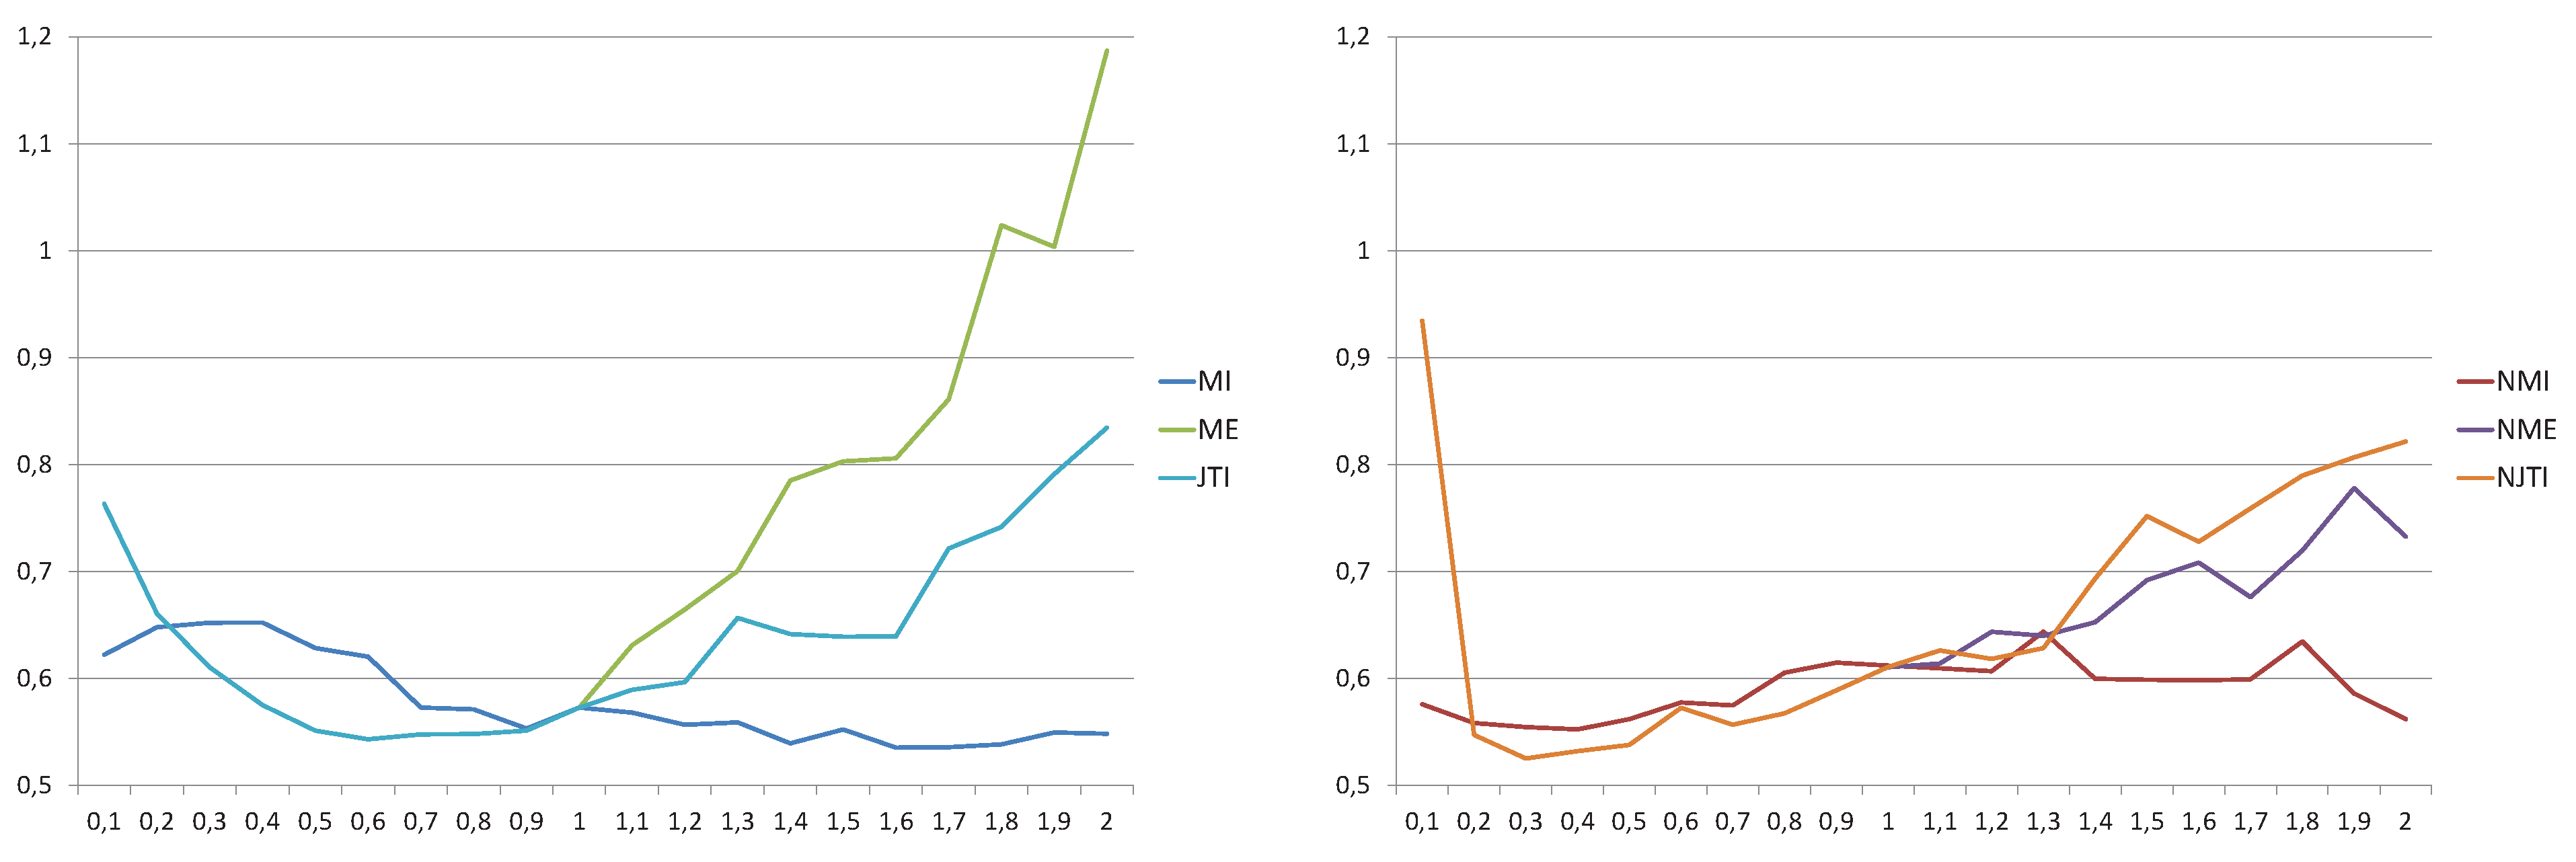
First, the robustness has been evaluated in terms of the partial image overlap. This has been done using the parameter AFA (Area of Function Attraction) introduced by Capek et al. [38]. This parameter evaluates the range of convergence of a registration measure to its global maximum, counting the number of pixels (i.e., translations in image space) from which the global maximum is reached by applying a maximum gradient method. Note that this global maximum may not necessarily be the optimal registration position. The AFA parameter represents the robustness with respect to the different initial positions of the images to be registered and with respect to the convergence to a local maximum of the similarity measure that leads to an incorrect registration. The higher the AFA, the wider the attraction basin of the measure. In this experiment, the images have been scaled to a height of 200 pixels, conveniently adjusting the width to keep the aspect ratio. In Figure 3, the left plot represents the results for the , , and measures with different α values and the right plot represent the results for their corresponding normalized measures. As it can be seen, the best results are achieved for α values greater than 1 for all the measures, being the mutual entropy the one that reaches the best results. As in the previous experiment, the normalized measures also perform better than the non normalized ones.
Figure 3.
AFA parameter values with respect to the α value for the , , and measures (left) and the corresponding normalized measures (right). AFA parameter evaluates the range of convergence of a registration measure to its global maximum.
Figure 3.
AFA parameter values with respect to the α value for the , , and measures (left) and the corresponding normalized measures (right). AFA parameter evaluates the range of convergence of a registration measure to its global maximum.
The second feature that we will analyze for the alignment experiment is the accuracy. In this case, the general registration scheme of Figure 1 has been applied, where we have used the Powell’s method optimizer [39], a rigid transform (which only considers translation and rotation, but not scaling), and a linear interpolator. The registration process is applied to 18 images of the same class that are aligned with respect to a common template (scaling them to a height of 800 pixels and keeping the aspect ratio). For each image with its original resolution (around pixels), 14 points have been manually identified and converted to the scaled space of a height of 800 pixels. The same process has been done with the template image. In order to quantify the registration accuracy, the points of each image have been moved using the final registration transform. The mean error, given by the average Euclidean distance between these moved points and the corresponding points in the template, has also been computed. In Figure 4, for each measure and each α value, the mean error is plotted. In this case, we can not derive a general behavior. performs better for , while for . In this case, the non normalized measure performs better than the normalized one. Both and do not outperform the corresponding Shannon measures (). Finally, Jensen–Tsallis information have a minimum in and the accuracy diminishes when the α value increases. Among all measures, the normalized Jensen–Tsallis information achieves the best results, obtaining the minimum error (and thus the maximum accuracy) for .
Figure 4.
Mean error at the final registration position for different measures and α values for the , , and measures (left) and the corresponding normalized measures (right).
Figure 4.
Mean error at the final registration position for different measures and α values for the , , and measures (left) and the corresponding normalized measures (right).
As a conclusion, for document classification, the best results have been obtained by the normalized measures, using α values between 0.4 and 1.2 for and between 1 and 1.4 for and . For document registration, the most robust results have been obtained by with and the most accurate ones have been achieved by with .
6. Conclusions
In this paper, we have analyzed the behavior of different similarity measures based on Tsallis entropy applied to document processing. Three different generalizations of mutual information, based respectively on Kullback–Leibler distance, the difference between entropy and conditional entropy, and the Jensen–Tsallis divergence, and their ratio with the Tsallis joint entropy have been tested. Two types of experiments have been carried out. First, the proposed measures have been applied to invoice classification, showing different behavior depending on the measure and the entropic index. Second, the document registration has been studied in terms of robustness and accuracy. While the highest robustness is achieved for entropic indices higher than 1, the highest accuracy has been obtained for entropic indices clearly lower than 1.
In our future work, we will analyze the performance of the measures analyzed for different typologies of documents, such as scientific papers or journal pages, and further tests will be conducted on larger databases.
Acknowledgements
This work has been funded in part with Grant Numbers TIN2010-21089-C03-01 from the Spanish Government and 2009-SGR-643 from the Catalan Government.
References
- Peng, H.; Long, F.; Chi, Z. Document image recognition based on template matching of component block projections. IEEE Trans. Pattern Anal. Mach. Intell. 2003, 25, 1188–1192. [Google Scholar] [CrossRef]
- Lopresti, D.P. String techniques for detecting duplicates in document databases. IJDAR 2000, 2, 186–199. [Google Scholar] [CrossRef]
- Tseng, L.Y.; Chen, R.C. The Recognition of Form Documents Based on Three Types of Line Segments. In Proceedings of the 4th International Conference on Document Analysis and Recognition, ICDAR’97, Ulm, Germany, 18–20 August 1997; pp. 71–75.
- Hu, J.; Kashi, R.S.; Wilfong, G.T. Document Image Layout Comparison and Classification. In Proceedings of the Fifth International Conference on Document Analysis and Recognition, ICDAR’99, Bangalore, India, 20–22 September 1999; pp. 285–288.
- Shin, C.; Doermann, D.S.; Rosenfeld, A. Classification of document pages using structure-based features. IJDAR 2001, 3, 232–247. [Google Scholar] [CrossRef]
- Hajnal, J.; Hawkes, D.; Hill, D. Medical Image Registration; CRC Press Inc.: Boca Raton, FL, USA, 2001. [Google Scholar]
- Portes de Albuquerque, M.; Esquef, I.; Gesualdi Mello, A.; Portes de Albuquerque, M. Image thresholding using Tsallis entropy. Pattern Recognit. Lett. 2004, 25, 1059–1065. [Google Scholar] [CrossRef]
- Cover, T.M.; Thomas, J. Elements of Information Theory; John Wiley and Sons Inc.: Hoboken, NJ, USA, 1991. [Google Scholar]
- Yeung, R.W. Information Theory and Network Coding; Springer: Berlin, Heidelberg, Germany, 2008. [Google Scholar]
- Burbea, J.; Rao, C.R. On the convexity of some divergence measures based on entropy functions. IEEE Trans. Inf. Theory 1982, 28, 489–495. [Google Scholar] [CrossRef]
- Tsallis, C. Possible generalization of Boltzmann-Gibbs statistics. J. Stat. Phys. 1988, 52, 479–487. [Google Scholar] [CrossRef]
- Hill, D.L.G.; Batchelor, P.G.; Holden, M.; Hawkes, D.J. Medical image registration. Phys. Med. Biol. 2001, 46, R1–R45. [Google Scholar] [CrossRef] [PubMed]
- Maes, F.; Collignon, A.; Vandermeulen, D.; Marchal, G.; Suetens, P. Multimodality image registration by maximization of mutual information. IEEE Trans. Med. Imaging 1997, 16, 187–198. [Google Scholar] [CrossRef] [PubMed]
- Viola, P.A. Alignment by Maximization of Mutual Information. PhD thesis, MIT Artificial Intelligence Laboratory (TR 1548), Cambridge, MA, USA, 1995. [Google Scholar]
- Studholme, C. Measures of 3D Medical Image Alignment. PhD thesis, Computational Imaging Science Group, Division of Radiological Sciences, United Medical and Dental school’s of Guy’s and St Thomas’s Hospitals, University of London, London, UK, 1997. [Google Scholar]
- Wachowiak, M.P.; Smolikova, R.; Tourassi, G.D.; Elmaghraby, A.S. Similarity Metrics Based on Non-additive Entropies for 2D-3D Multimodal Biomedical Image Registration. In Proceedings of SPIE Medical Imaging 2003: Image Processing, San Diego, CA, USA, 15 May 2003; Volume 5032, pp. 1090–1100.
- Bardera, A.; Feixas, M.; Boada, I. Normalized Similarity Measures for Medical Image Registration. In Proceedings of Medical Imaging SPIE 2004: Image Processing, San Diego, CA, USA, 12 May 2004; Volume 5370, pp. 108–118.
- Mohamed, W.; Ben Hamza, A. Nonextensive Entropic Image Registration. In Image Analysis and Recognition; Springer: Berlin, Heidelberg, Germany, 2009; Volume 5627, pp. 116–125. [Google Scholar]
- Khader, M.; Ben Hamza, A.; Bhattacharya, P. Multimodality Image Alignment Using Information-Theoretic Approach. In Image Analysis and Recognition; Springer: Berlin, Heidelberg, Germany, 2010; Volume 6112, pp. 30–39. [Google Scholar]
- Hamza, H.; Belaïd, Y.; Belaïd, A.; Chaudhuri, B.B. An End-to-End Administrative Document Analysis System. In Proceedings of the 2008 The 8th IAPR International Workshop on Document Analysis Systems, DAS’08, Nara, Japan, 16–19 September 2008; pp. 175–182.
- Chen, N.; Blostein, D. A survey of document image classification: Problem statement, classifier architecture and performance evaluation. Int. J. Doc. Anal. Recognit. 2007, 10, 1–16. [Google Scholar] [CrossRef]
- Trier, Ø.D.; Jain, A.K.; Taxt, T. Feature extraction methods for character recognition—A survey. Pattern Recognit. 1996, 29, 641–662. [Google Scholar] [CrossRef]
- Appiani, E.; Cesarini, F.; Colla, A.M.; Diligenti, M.; Gori, M.; Marinai, S.; Soda, G. Automatic document classification and indexing in high-volume applications. IJDAR 2001, 4, 69–83. [Google Scholar] [CrossRef]
- Shin, C.; Doermann, D.S. Document Image Retrieval Based on Layout Structural Similarity. In Proceedings of the 2006 International Conference on Image Processing, Computer Vision and Pattern Recognition, IPCV’06, Las Vegas, NV, USA, 26–29 June 2006; pp. 606–612.
- Gupta, M.D.; Sarkar, P. A Shared Parts Model for Document Image Recognition. In Proceedings of the 9th International Conference on Document Analysis and Recognition, ICDAR’07, Curitiba, Brazil, 23–26 September 2007; Volume 2, pp. 1163–1172.
- Costa e Silva, A.; Jorge, A.M.; Torgo, L. Design of an end-to-end method to extract information from tables. IJDAR 2006, 8, 144–171. [Google Scholar] [CrossRef]
- Alippi, C.; Pessina, F.; Roveri, M. An Adaptive System for Automatic Invoice-Documents Classification. In Proceedings of the IEEE International Conference on Image Processing, ICIP’05, Genova, Italy, 11–14 September 2005; Volume 2, pp. II-526–II-529.
- Arai, H.; Odaka, K. Form Processing based on Background Region Analysis. In Proceedings of the 4th International Conference on Document Analysis and Recognition, ICDAR’97, Ulm, Germany, 18–20 August 1997; pp. 164–169.
- Cesarini, F.; Gori, M.; Marinai, S.; Soda, G. INFORMys: A flexible invoice-like form-reader system. IEEE Trans. Pattern Anal. Mach. Intell. 1998, 20, 730–745. [Google Scholar] [CrossRef]
- Tang, Y.Y.; Liu, J. Information Acquisition and Storage of Forms in Document Processing. In Proceedings of the 4th International Conference on Document Analysis and Recognition, ICDAR’97, Ulm, Germany, 18–20 August 1997; pp. 170–174.
- Duygulu, P.; Atalay, V. A hierarchical representation of form documents for identification and retrieval. IJDAR 2002, 5, 17–27. [Google Scholar] [CrossRef]
- Behera, A.; Lalanne, D.; Ingold, R. Combining color and layout features for the identification of low-resolution documents. Int. J. Signal Process. 2005, 2, 7–14. [Google Scholar]
- Tsallis, C. Generalized entropy-based criterion for consistent testing. Phys. Rev. E 1998, 58, 479–487. [Google Scholar] [CrossRef]
- Taneja, I.J. Bivariate measures of type α and their applications. Tamkang J. Math. 1988, 19, 63–74. [Google Scholar]
- Furuichi, S. Information theoretical properties of Tsallis entropies. J. Math. Phys. 2006, 47, 023302. [Google Scholar] [CrossRef]
- Ben Hamza, A. Nonextensive information-theoretic measure for image edge detection. J. Electron. Imaging 2006, 15, 13011.1–13011.8. [Google Scholar] [CrossRef]
- Gatos, B.; Papamarkos, N.; Chamzas, C. Skew detection and text line position determination in digitized documents. Pattern Recognit. 1997, 30, 1505–1519. [Google Scholar] [CrossRef]
- Capek, M.; Mroz, L.; Wegenkittl, R. Robust and Fast Medical Registration of 3D-Multi-Modality Data Sets. In Proceedings of Medicon 2001, Pula, Croatia, 12–15 June 2001; pp. 515–518.
- Press, W.; Teulokolsky, S.; Vetterling, W.; Flannery, B. Numerical Recipes in C; Cambridge University Press: Cambridge, UK, 1992. [Google Scholar]
© 2011 by the authors; licensee MDPI, Basel, Switzerland. This article is an open access article distributed under the terms and conditions of the Creative Commons Attribution license (http://creativecommons.org/licenses/by/3.0/).
Share and Cite
MDPI and ACS Style
Vila, M.; Bardera, A.; Feixas, M.; Sbert, M. Tsallis Mutual Information for Document Classification. Entropy 2011, 13, 1694-1707. https://doi.org/10.3390/e13091694
AMA Style
Vila M, Bardera A, Feixas M, Sbert M. Tsallis Mutual Information for Document Classification. Entropy. 2011; 13(9):1694-1707. https://doi.org/10.3390/e13091694
Chicago/Turabian StyleVila, Màrius, Anton Bardera, Miquel Feixas, and Mateu Sbert. 2011. "Tsallis Mutual Information for Document Classification" Entropy 13, no. 9: 1694-1707. https://doi.org/10.3390/e13091694