Article

Energy and Exergy Analysis for Improving the Energy Performance of Air-Cooled Liquid Chillers by Different Condensing-Coil Configurations

Department of Energy and Refrigerating Air-Conditioning Engineering, National Taipei University of Technology, Taipei 10608, Taiwan
*
Author to whom correspondence should be addressed.
Entropy 2012, 14(3), 517-532; https://doi.org/10.3390/e14030517
Submission received: 13 December 2011 / Revised: 15 February 2012 / Accepted: 2 March 2012 / Published: 8 March 2012

Abstract

:
This study constructed a parameter analysis for improving the energy performance of air-cooled water chillers by altering the angle configuration of the condenser coils. The mathematical models for energy and exergy analyses of the individual components and overall system of air-cooled water chillers are presented. This study investigated the potential enhancement of performance efficiency in air-cooled chillers and the energy conversion efficiency of each component, in order to determine how the angle configuration of condenser coils influences chiller performance. This study found that the overall performance of an air-cooled chiller could be improved by approximately 3.4%, and the total irreversibility could be reduced by approximately 2.7%. With each 1% increase in average wind speed over the condenser coils, the overall performance of an air-cooled chiller was found to be enhanced by approximately 0.43%, and its total irreversibility was reduced by approximately 0.35%. The results of this study can be effectively applied to air-cooled condenser units, and can provide an important basis of reference for developing and enhancing the energy efficiency of air-cooled chillers.

1. Introduction

Large air-cooled chillers are frequently used in air-conditioning and refrigeration units. The main components of air-cooled chillers are the compressor, condenser, throttling device, and evaporator (Figure 1). With regards to condensers, V-V-type fin-tube condenser coils are normally configured with the upper fan, often resulting in unevenly distributed flow and varying wind speed, which adversely influences the mechanical performance of air-cooled chillers. Lee et al. [1] conducted a Computational Fluid Dynamics (CFD) simulation and analysed the angle configuration of condenser coils in order to investigate its influence on airflow distribution and heat transfer. Results showed that changing the angle configuration increased the average wind speed and heat transfer by 7.85% and 5.29%, respectively. These results indicate that adjusting the configuration of the condenser can be effective in enhancing the heat transfer capacity of condensers in air-cooled chillers. Thus, exploring the influence of increased wind speed on system performance and energy conversion efficiency is an important topic for researchers seeking to improve the performance of air-cooled chillers.
In recent years, many studies have developed chiller models; however, the majority of such research has focused on simulating the parameters of water-cooled chillers. Many researchers have used steady-state or transient models for system simulation, and have verified the accuracy of these simulation programs through experimentation [2,3,4]. However, there is very limited research on parameter simulation of air-cooled chillers. A few studies have focused on researching the control strategies and operating conditions of air-cooled chillers under partial load [5,6,7,8,9,10]. Many researchers have used thermodynamic irreversibility analysis and exergy analysis to investigate how different configurations influence the energy efficiency of system components in chillers, heat pumps, refrigerators, and other equipment [11,12,13,14,15,16].
Figure 1. Physical model of an air-cooled chiller.
Entropy 14 00517 g001
The above overview demonstrates that few studies have addressed the issue of how the angle configuration of condenser coils influences the overall performance of air-cooled chillers and the exergy of the various system components (i.e., compressor, condenser, throttling device, and evaporator). Therefore, the main objective of this study was to construct a parameter analysis model in which the angle configuration of condenser coils can be altered, and to develop mathematical models of individual components and the overall system of an air-cooled water chiller. Once these models are used to simulate overall unit performance, we will develop irreversibility and exergy equations for each system component. Lastly, we aim to investigate the potential enhancement of performance efficiency in air-cooled chillers and the energy conversion efficiency of each component, in order to determine how the angle configuration of condenser coils influences chiller performance. We believe that the results of this research can provide an important basis of reference for future design of air-cooled chiller units.

2. Energy Model of Development

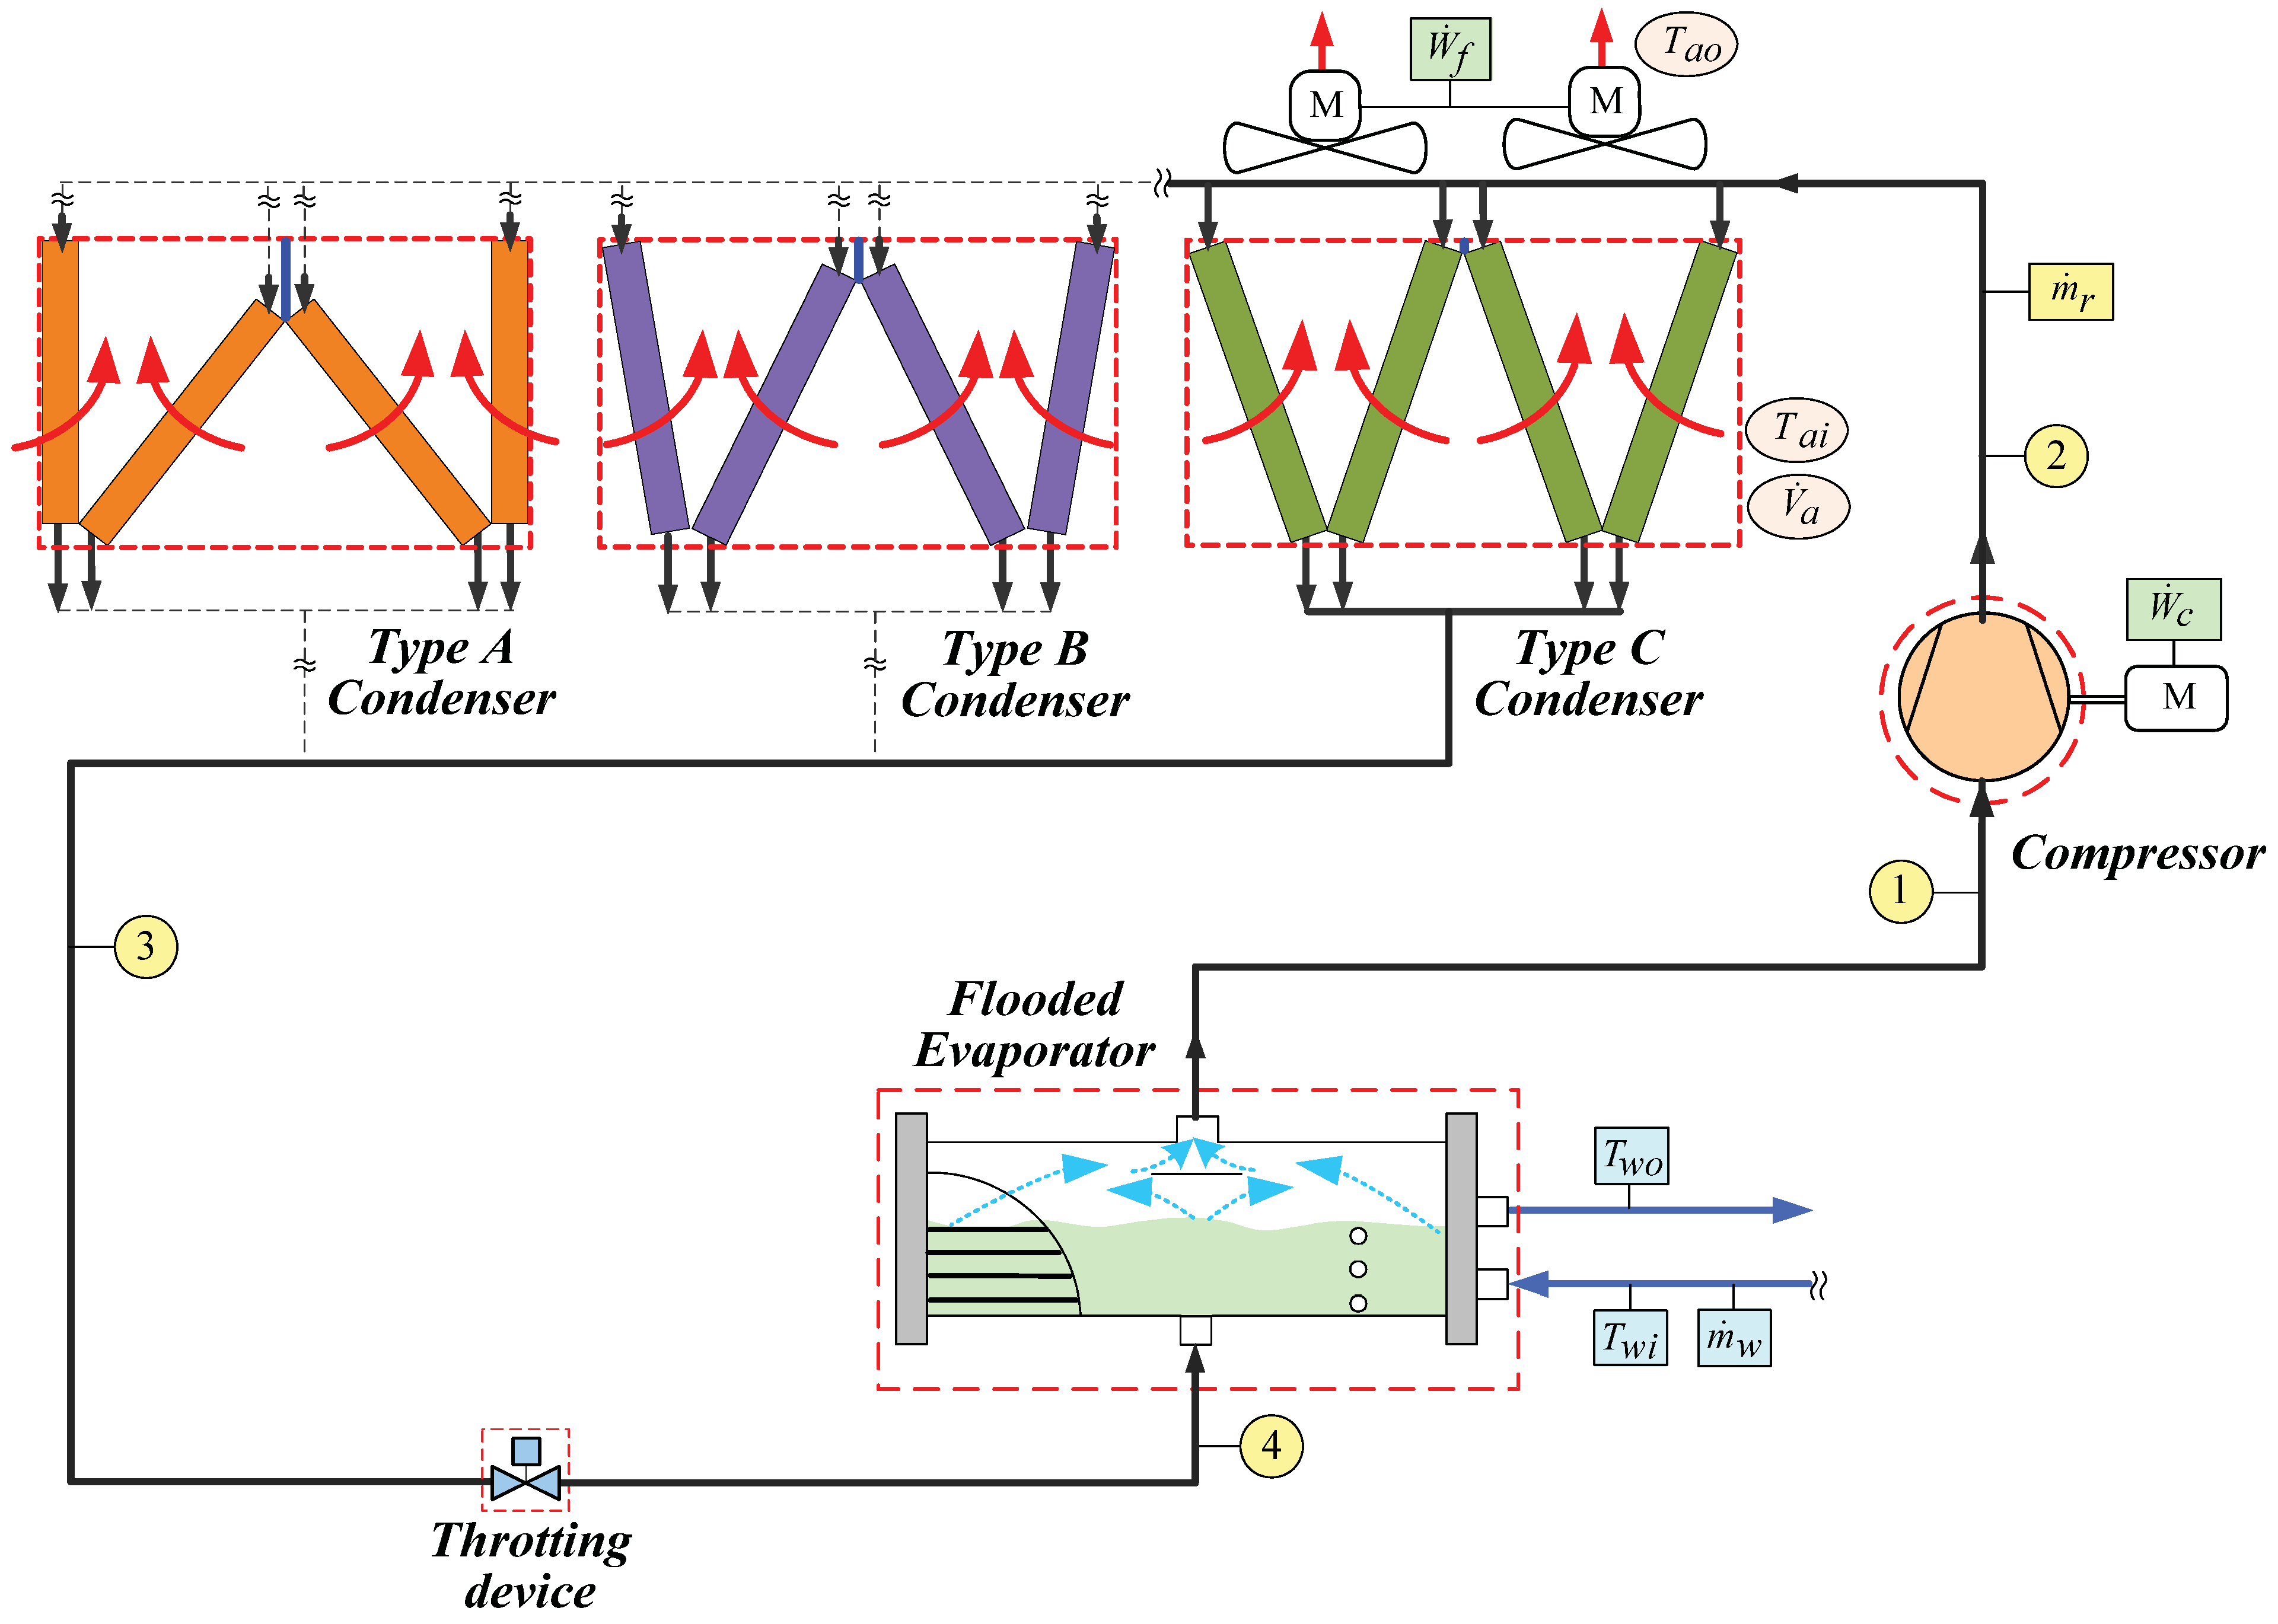
2.1. System Description

Figure 1 illustrates the mechanical model of the air-cooled chiller in this study. The main components of the chiller are the compressor, condenser unit, throttling device, and flooded evaporator. The condenser is comprised of four fin-tube heat exchangers (condenser coils) and many fans. We studied three condenser configurations, which are illustrated and labelled as Types A–C in Figure 1. For each configuration, we employed four condenser coil sets and four fan units with identical specifications. The specifications of the condenser coils are listed in Table 1.
Table 1. Physical dimensions of condenser coils.
Heat Exchanger ConfigurationValueUnit
Length (L)4760mm
Height (H)1200mm
Tubes for coil90-
Vertical tube spacing38.1mm
Horizontal tube spacing33.0mm
Number of tube rows3
Tubes per row30
Fins per inch14-
Fin thickness0.25mm
Outside tube diameter15.9mm
Tube thickness0.5mm

2.2. Model Description

2.2.1. Compressor

In accordance with the conservation laws of mass and energy, as well as the experimental data provided by compressor manufacturers, we employed a curve-fitting method to predict the real energy consumption of the compressor. The calculation of the related parameters is shown in Equations (1)–(5). Equation (1) measures compressor input power [2], Equation (2) calculates the mass flow rate of the refrigerant, Equation (3) calculates the volumetric efficiency of the compressor [3], and Equation (4) measures compressor power [2], as follows:
W ˙ c = m ˙ r w c η m η e
m ˙ r = V ˙ d i s v 1 η v
η v = f ( R c o m p ) = f ( P 2 P 1 ) = c 1 + c 2 ( P 2 P 1 )
w c = ( h 2 h 1 ) = ( h 2 s h 1 ) η i s e n
The rate at which power is consumed by the compressor during actual operation is influenced by isentropic efficiency ( η i s e n ). In this study, the performance data provided by manufacturers is used for the curve fitting, and isentropic efficiency is expressed as the second-degree curve of the pressure ratio [16]. The fitting equation is shown in Equation (5):
η i s e n = f ( R c o m p ) = f ( P 2 P 1 ) = c 1 + c 2 ( P 2 P 1 ) + c 3 ( P 2 P 1 ) 2

2.2.2. Condenser

According to the data provided by manufacturers, we calculated the amount of electricity consumed by the fan units in air-cooled chillers with the following equation:
W ˙ f = c 1 V ˙ a + c 2
To simplify the complex mathematical models, we made the following assumptions about condenser coils: (1) they represent steady-state and steady-flow processes; (2) changes in kinetic and potential energy at their input and output points can be disregarded; and (3) the influence of scale deposit and refrigerant oil can also be disregarded. The related parameters for the condenser were calculated using Equations (7)–(12). Condensation capacity was calculated using Equation (7):
Q ˙ c = m ˙ r ( h 3 h 2 ) = m ˙ a c p a ( T a o T a i ) = ε c d Q ˙ c max
m ˙ a = V ˙ a v a i
Q ˙ c max = C ˙ min ( T c T a i )
The N T U ε method, as shown in Equations (11) and (12), was used for the heat transfer analysis model:
ε c d = 1 e N T U c d
N T U c d = U c d A c d m ˙ a c p a
To reduce the complexity of the simulation program, we expressed the heat transfer coefficient U c d A c d of the condenser as a function of condensation capacity and volumetric airflow [8], as shown in Equation (12). The air-cooled condenser software developed by McQuiston et al. [17] was used to determine the condensation capacity:
U c d A c d = c 1 V ˙ a + c 2 Q ˙ c + c 3 V ˙ a 2 + c 4 Q ˙ c 2 + c 5 V ˙ a Q ˙ c + c 6 V ˙ a 2 Q ˙ c 2 + c 7 V ˙ a Q ˙ c 2 + c 8 V ˙ a 2 Q ˙ c

2.2.3. Throtting Device

The throttling process in this study was assumed to be isenthalpic ( h 4 = h 3 ). The mass flow rate of the refrigerant is as follows:
m ˙ r = m ˙ r x = K v ρ 3 Δ P  
where ρ 3 is the density of the supercooled liquid refrigerant before it enters the throttling device, Δ P is the difference between condensation pressure and evaporation pressure, and K v is the flow coefficient of the throttling device.

2.2.4. Evaporator

To simplify the complex mathematical models, the same assumptions made for the condenser were made for the evaporator (i.e., steady-state and steady-flow process, and disregarding the kinetic and potential energy changes and the influence of scale deposit and refrigerant oil). The related parameters for the evaporator were calculated using Equations (14)–(18). The following equation was used to calculate the cooling capacity on the water and refrigerant sides of the evaporator:
Q ˙ e = m ˙ r ( h 1 h 4 ) = m ˙ w c p w ( T w o T w i ) = ε e v Q ˙ e max = ε e v C ˙ min ( T w i T e )
Q ˙ e max = C ˙ min ( T w i T e )
The N T U ε method, as shown in Equations (16) and (17), was used for the heat transfer analysis model:
ε e v = 1 exp N T U e v
N T U e v = U e v A e v m ˙ w c p w
As with the condensers, we expressed the heat transfer coefficient U e v A e v of the evaporator as a function of cooling capacity and the mass flow rate of chilled water [8] [Equation (18)]. We used the performance simulation software developed by the Wieland Corporation to determine the cooling capacity of the evaporator:
U e v A e v = c 1 Q ˙ e + c 2 m ˙ w + c 3 Q ˙ e 2 + c 4 m ˙ w 2 + c 5 Q ˙ e 2 m ˙ w + c 6 Q ˙ e m ˙ w 2 + c 7 Q ˙ e 2 m ˙ w 2 + c 8 Q ˙ e m ˙ w
The c1c8 coefficients in Equation (18) were calculated using evaporator performance data provided by the manufacturers.

2.2.5. Systems Analysis of Energy Efficiency

The coefficient of performance (COP) was used to assess the overall performance of the air-cooled chiller [Equation (19)]. Capacity was calculated according to the flow rate and difference in the input and output temperatures of the chilled water in the evaporator [Equation (20)]:
C O P = Q ˙ e W ˙ i n
Q ˙ e = m ˙ w × ρ w × c p w × ( T w i T w o )
The input power of the system included the power consumption of both the compressor and fans [Equation (21)], and the heat dissipation capacity of the condenser was calculated using Equation (22):
W ˙ i n = W ˙ c + W ˙ f
Q ˙ c = Q ˙ e + W ˙ c

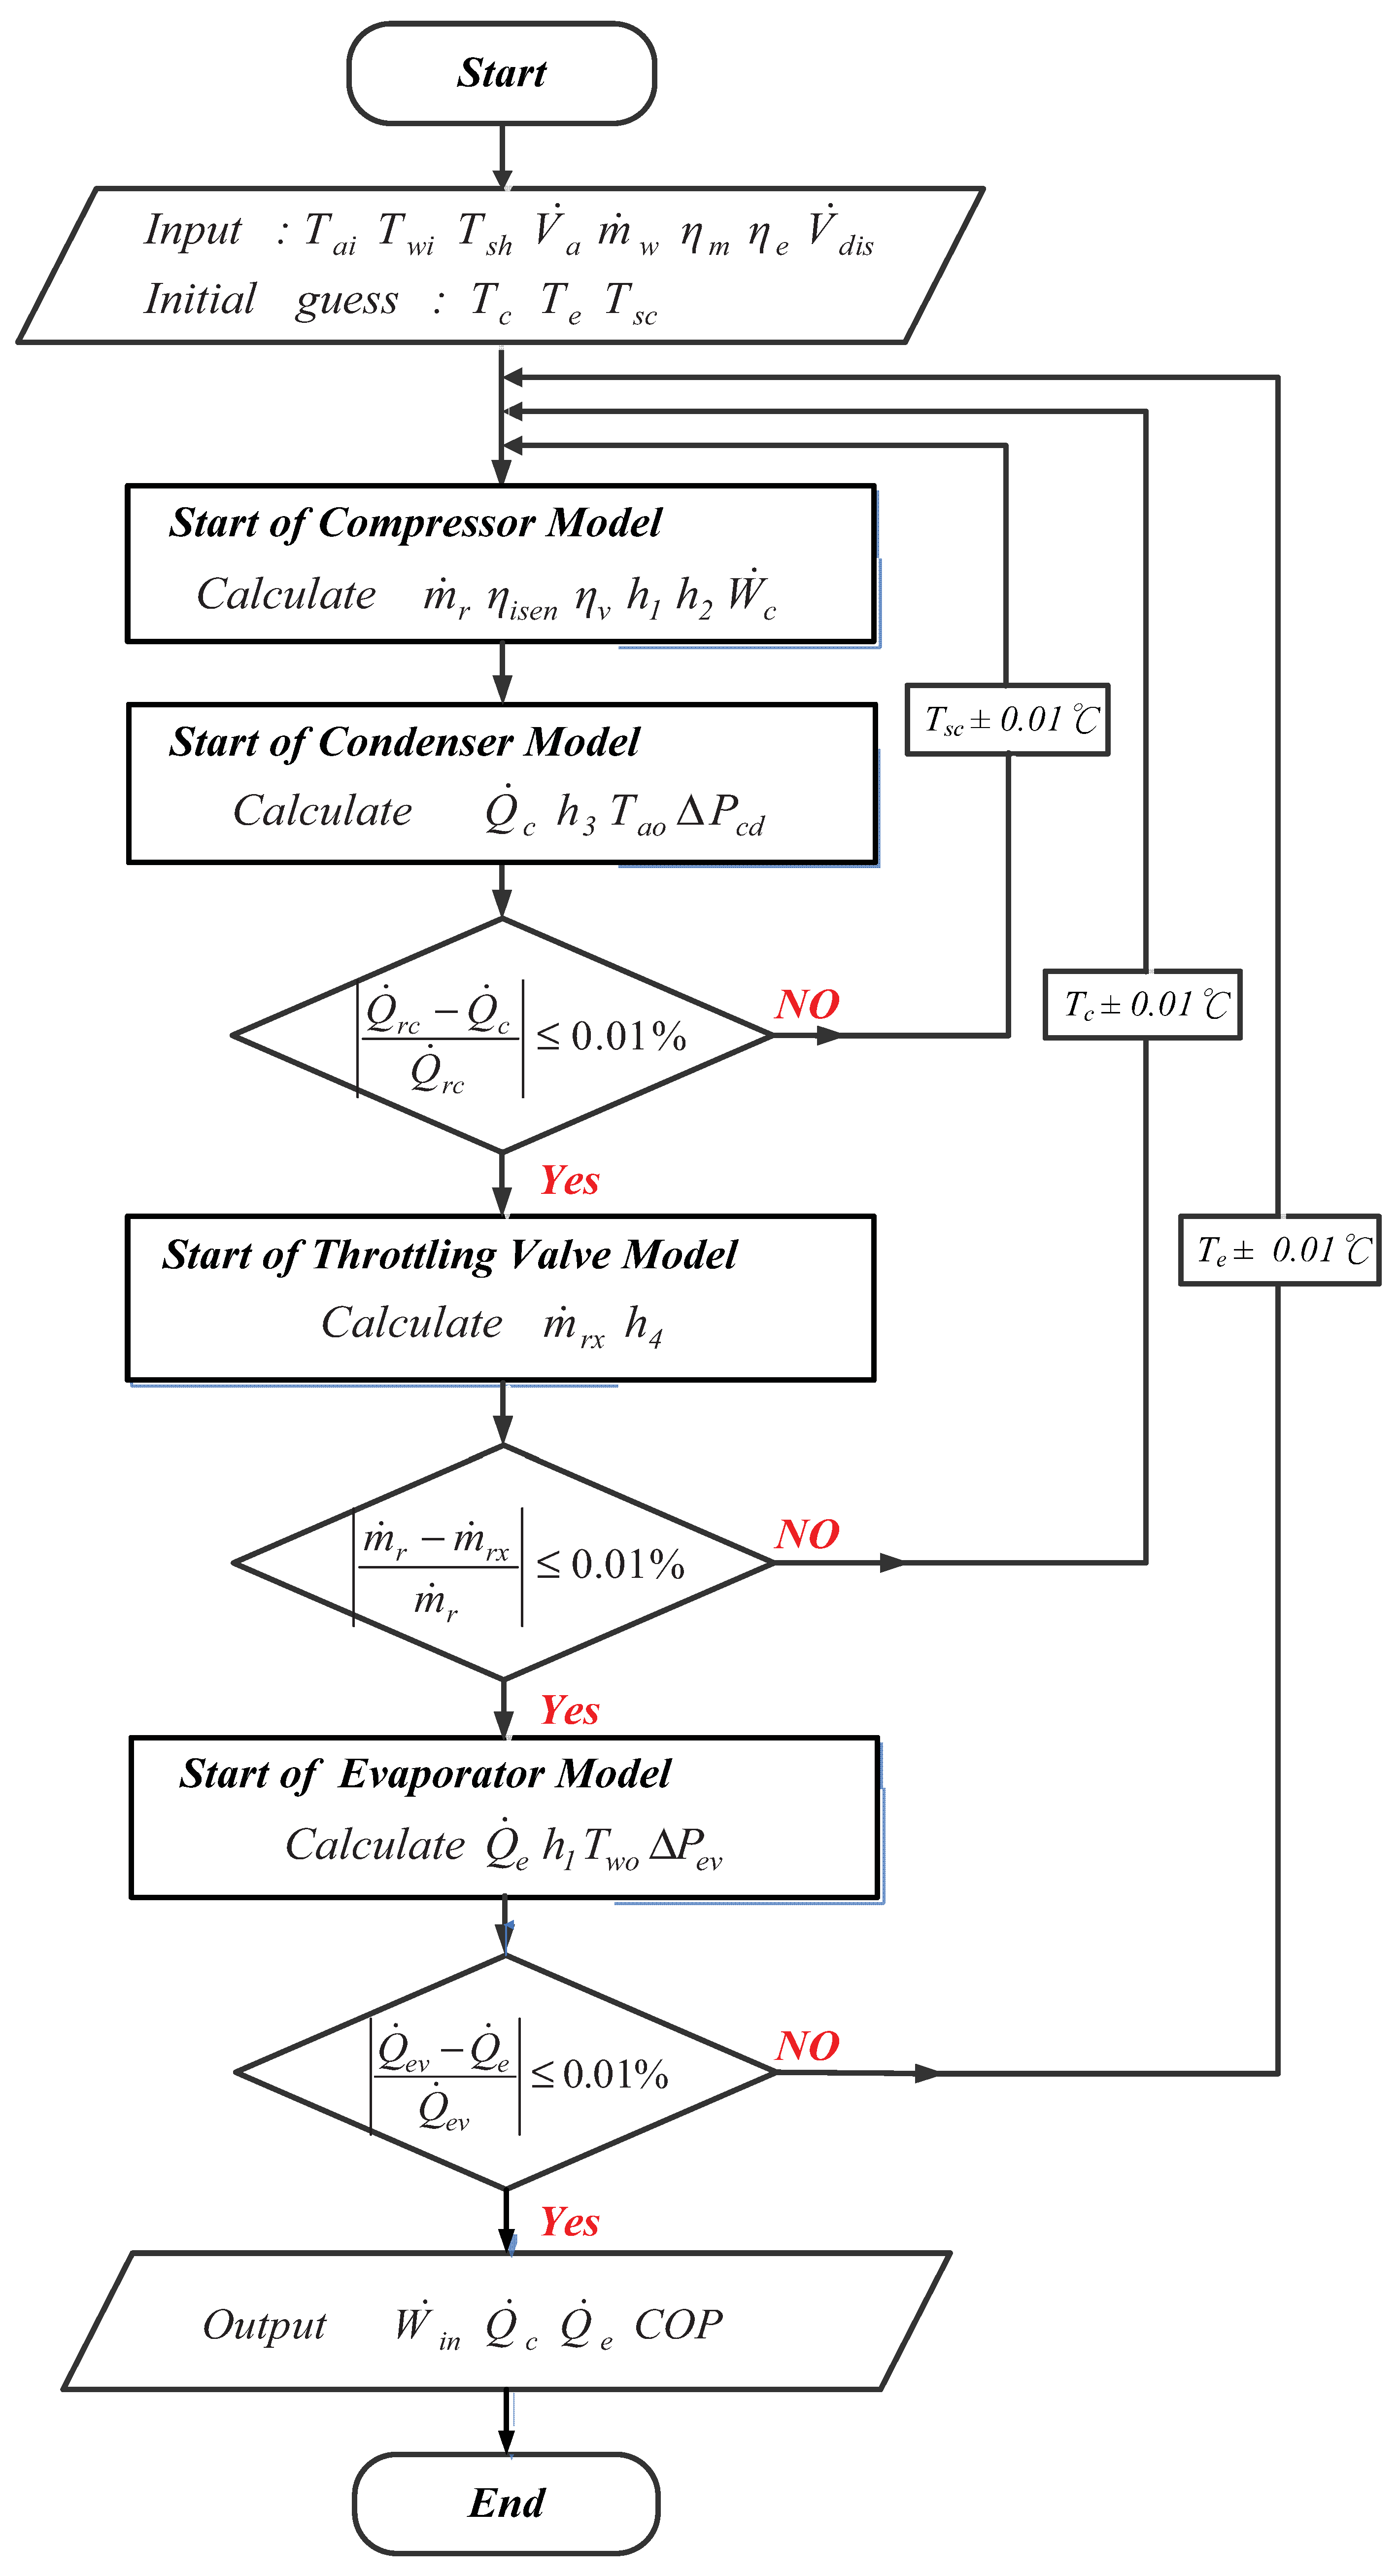
2.3. Simulation System Solving and Analytical Process

The mathematical models of the components in this study are sequentially linked into a complete system. By inputting known parameters and fully-developed mathematical models, we computed the component parameters. Iterative computation was used to bring each system component to an equilibrium state of convergence in order to complete the system performance simulation.
The system analysis process is shown in Figure 2. First, the input design conditions and initial values are chosen. Then, the operational state of the compressor is calculated, followed by that of the condenser, the throttling device, and the evaporator. Finally, the system outputs results, which should indicate the chiller performance.
We used the software developed by the National Institute of Standards and Technology [18] to compute the thermodynamic properties of the refrigerant. A polynomial fitting method was then employed to derive an equation for the thermodynamic properties of the refrigerant; this equation was then incorporated into the program database.

3. Exergy Model of Development

The overall performance efficiency of the system was analysed by applying the conservation of energy (the first law of thermodynamics) and using COP as the assessment index. For each component, we conducted irreversibility and exergy analyses to determine the energy loss caused by irreversible processes. The results clearly show that the components could be improved to enhance the energy efficiency of the system. To simplify the equations for thermodynamic analysis, we adopted the following basic assumptions:
(1)
The control volume in each component is a steady-state, steady-flow process;
(2)
Kinetic and potential energy changes at the input and output points of control volume in each component can be disregarded;
(3)
The irreversibility of suction pipes, exhaust pipes, and tubes can be overlooked;
(4)
The throttling device functions as an isenthalpic process;
(5)
The control volume of the condenser includes the refrigerant and air side;
(6)
The control volume of the evaporator includes the refrigerant and chilled water sides.
The irreversibility and exergy equations of the components in this study are listed in Table 2 and Table 3, respectively. Here, the boundary temperature of heat transfer in the irreversibility equations is indicated by the environmental temperature T o .
Figure 2. Simulation system solving and analytical process.
Entropy 14 00517 g002
Table 2. Irreversibility analysis of system components.
ComponentsMass BalanceEnergy BalanceEntropy BalanceIrreversibility
Compressor m ˙ 2 = m ˙ 1 = m ˙ r Q ˙ l = m ˙ r ( h 2 h 1 ) + W ˙ c S ˙ g e n = m ˙ r ( s 2 s 1 ) - Q ˙ l T 0 I ˙ = X ˙ d e s = T o S ˙ g e n
Condenser m ˙ 3 = m ˙ 2 = m ˙ r m ˙ a o = m ˙ a i = m ˙ a Q ˙ c = m ˙ r ( h 3 h 2 ) = m ˙ a ( h a o h a i ) S ˙ g e n = m ˙ r ( s 3 s 2 ) + m ˙ a ( s a o s a i ) I ˙ = X ˙ d e s = T o S ˙ g e n
Throttling Device m ˙ 4 = m ˙ 3 = m ˙ r h 4 = h 3 S ˙ g e n = m ˙ r ( s 4 s 3 ) I ˙ = X ˙ d e s = T o S ˙ g e n
Evaporator m ˙ 1 = m ˙ 4 = m ˙ r m ˙ w o = m ˙ w i = m ˙ w Q ˙ e = m ˙ r ( h 1 h 4 ) = m ˙ w c p w ( T w o T w i ) S ˙ g e n = m ˙ r ( s 1 s 4 ) + m ˙ w ( s w o s w i ) I ˙ = X ˙ d e s = T o S ˙ g e n
Table 3. Exergy analysis of system components.
ComponentsMass BalanceEnergy BalanceEntropy balanceExergy
Compressor m ˙ 2 = m ˙ 1 = m ˙ r Q ˙ l = m ˙ r ( h 2 h 1 ) + W ˙ c ϕ 1 ϕ 2 = ( h 1 h 2 ) T o ( s 1 s 2 ) X ˙ d e s = W ˙ c m ˙ r ( ϕ 1 ϕ 2 )
Condenser m ˙ 3 = m ˙ 2 = m ˙ r m ˙ a o = m ˙ a i = m ˙ a Q ˙ c = m ˙ r ( h 3 h 2 ) = m ˙ a ( h a o h a i ) ϕ 2 ϕ 3 = ( h 2 h 3 ) T o ( s 2 s 3 ) ϕ a i ϕ a o = ( h a i h a o ) T o ( s a i s a o ) X ˙ d e s = m ˙ r ( ϕ 2 ϕ 3 ) + m ˙ a ( ϕ a i ϕ a o )
Throttling Device m ˙ 4 = m ˙ 3 = m ˙ r h 4 = h 3 ϕ 3 ϕ 4 = ( h 3 h 4 ) T o ( s 3 s 4 ) X ˙ d e s = m ˙ r ( ϕ 3 ϕ 4 )
Evaporator m ˙ 1 = m ˙ 4 = m ˙ r m ˙ w o = m ˙ w i = m ˙ w Q ˙ e = m ˙ r ( h 1 h 4 ) = m ˙ w c p w ( T w o T w i ) ϕ 1 ϕ 4 = ( h 1 h 4 ) T o ( s 1 s 4 ) ϕ w i ϕ w o = ( h w i h w o ) T o ( s w i s w o ) X ˙ d e s = m ˙ r ( ϕ 1 ϕ 4 ) + m ˙ w ( ϕ w i ϕ w o )
Equation (23) was used to calculate the value of air entropy [19] on the air side of the condenser, while the ASHRAE [15] table was used to compute the entropy of water in the evaporator:
ϕ a i ϕ a o = ( c p a + ω c p v ) [ ( T a i T a o ) T o ln ( T a i T a o ) ]

4. Results and Discussion

4.1. Validation of the Chiller Model

This study used a 125 RT air-cooled chiller for full-scale experimentation in order to determine the power consumption of the compressor and fan, the heat transfer capacity of the evaporator and condenser, and the COP of the chiller when in actual operation. These data were used to verify the accuracy of the simulation results. The configurations for the flow of refrigerant in the chiller system are shown in Figure 1. For the experiment, we used a semi-dense spiral compressor, Type A compressor coils configured with fans, a throttling device, and a flooded evaporator. The test standards for air-cooled chillers set out in ARI-550/590 [20] were referenced when the measurement methods and the instrument precision requirements were considered.
Table 4 compares the performance data of the actual air-cooled chillers with the predicted values obtained from the simulation. The total amount of heat transferred by condenser coils for the experiment was 579.5 kW, as compared to 581.5 kW for the simulation, amounting to a 0.35% difference. The total amount of actual heat transferred by evaporator in the experiment was 439.5 kW, as opposed to the simulated amount of 441.8 kW, a 0.52% difference. Power consumption of the actual and simulated compressor was 140.0 kW and 139.7 kW, respectively, a difference of −0.21%. Finally, the experimental (2.93) and simulated (2.97) COP differed by 1.37%. These results verify the suitability of the theoretical simulation method used by this study.
Table 4. Performance compared of the experiment and the simulation.
ItemUnitExperimentSimulationError
CondenserkW579.5581.50.35%
EvaporatorkW439.5441.80.52%
CompressorkW140.0139.7−0.21%
COP-2.932.971.37%

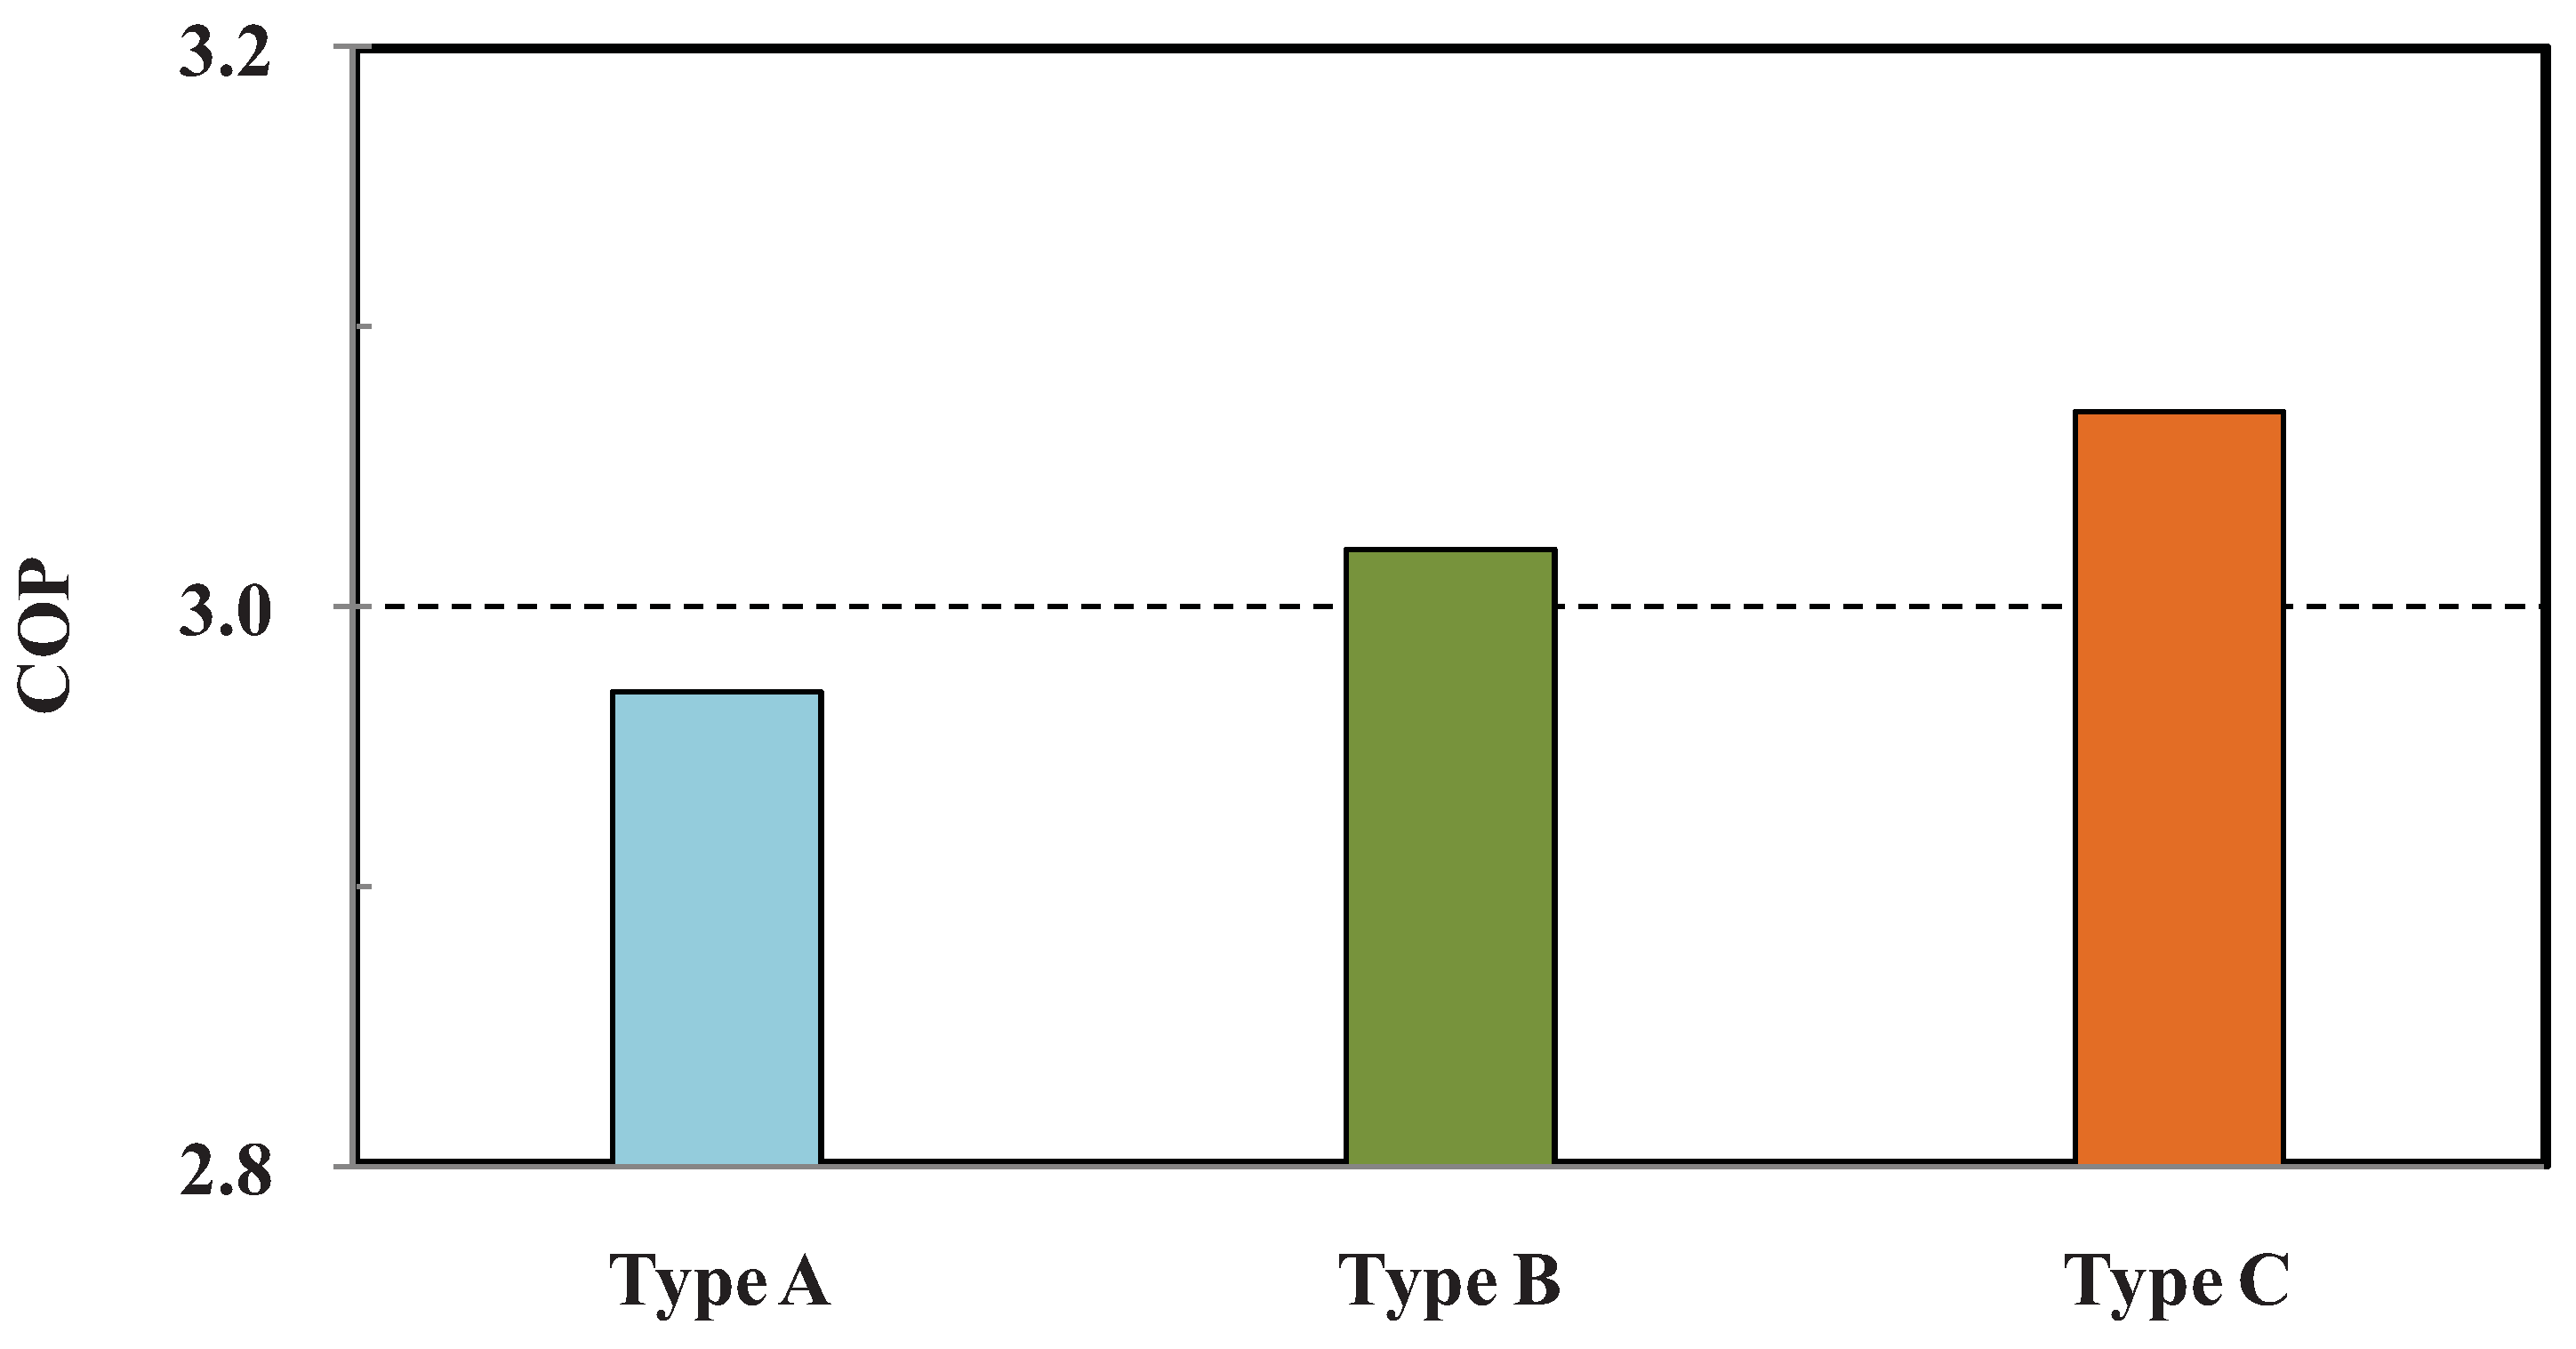
4.2. Influence on System Performance

Lee et al. [1] employed the CFD airflow simulation method in order to investigate how five condenser configurations influenced airflow distribution and heat transfer performance. This study used three of those angle configurations (designated by Type A, B, and C) as the research model. The results provided by Lee et al. [1] indicated that the average wind speeds corresponding to condenser configurations Type A–C were respectively 2.48 m s−1, 2.55 m s−1, and 2.68 m s−1. Thus, the average wind speeds of Types B and C exceed that of Type A by 2.62% and 7.85%, respectively. The total amount of heat transferred by the condensers in the Type B and C angle configurations also exceeded that of Type A by 1.56% and 5.29%, respectively. In order to determine the influence of increased wind speed on the overall performance of air-cooled chillers, previously developed mathematical models and system analysis procedures were used to simulate the condenser configurations. The simulation results are shown in Table 5 and Figure 3.
Table 5. Performance comparison for the condenser cases studied.
ItemUnitType AType BType C
Tc°C50.450.149.8
Te°C5.45.35.2
Tsc°C0.41.22.0
Tao°C44.944.644.3
CondenserkW581.5584.9588.1
EvaporatorkW441.8445.8449.7
CompressorkW139.7139.0138.4
Figure 3 compares the three condenser configurations in terms of their influence on COP. As shown by Figure 3, the COP for Types A–C was 2.97, 3.02, and 3.07, respectively. Type C had the highest COP, followed by Type B, and lastly Type A. Thus, the overall performance of the air-cooled chiller was best with condenser configuration Type C, followed by Type B. The COP of Types B and C exceeded that of Type A by 1.7% and 3.4%, respectively.
Figure 3. Comparison of the condenser configuration for the COP.
Entropy 14 00517 g003
Based on the above data, increased average wind speed over the condenser coils in Types B and C enhanced the heat performance over Type A by 0.6% and 1.1%, respectively. The output wind temperature T a o in Types B and C was also reduced by 0.3 °C and 0.6 °C as compared to Type A, which caused the condensation temperature T c in both types to be reduced by 0.3 °C and 0.6 °C when compared to Type A. At the same time, the degree of supercooling of the liquid refrigerant was increased by 0.8 °C and 1.6 °C, respectively. The reduction of T c in Types B and C enhanced the performance of the compressor, leading to a reduction in power consumption of 0.5% and 0.9%, respectively, as compared to Type A. Although the evaporator temperature T e for Types B and C was reduced by only 0.1 °C and 0.2 °C, the heat transfer performance of the evaporator increased by 0.9% and 1.8%, respectively, as compared to Type A.
The average wind speed over the condenser coils increased by approximately 7.85% from Types A–C [1]. If the average wind speed was used to assess system performance (COP), COP would have increased by approximately 0.43% with every 1% increase in average wind speed.

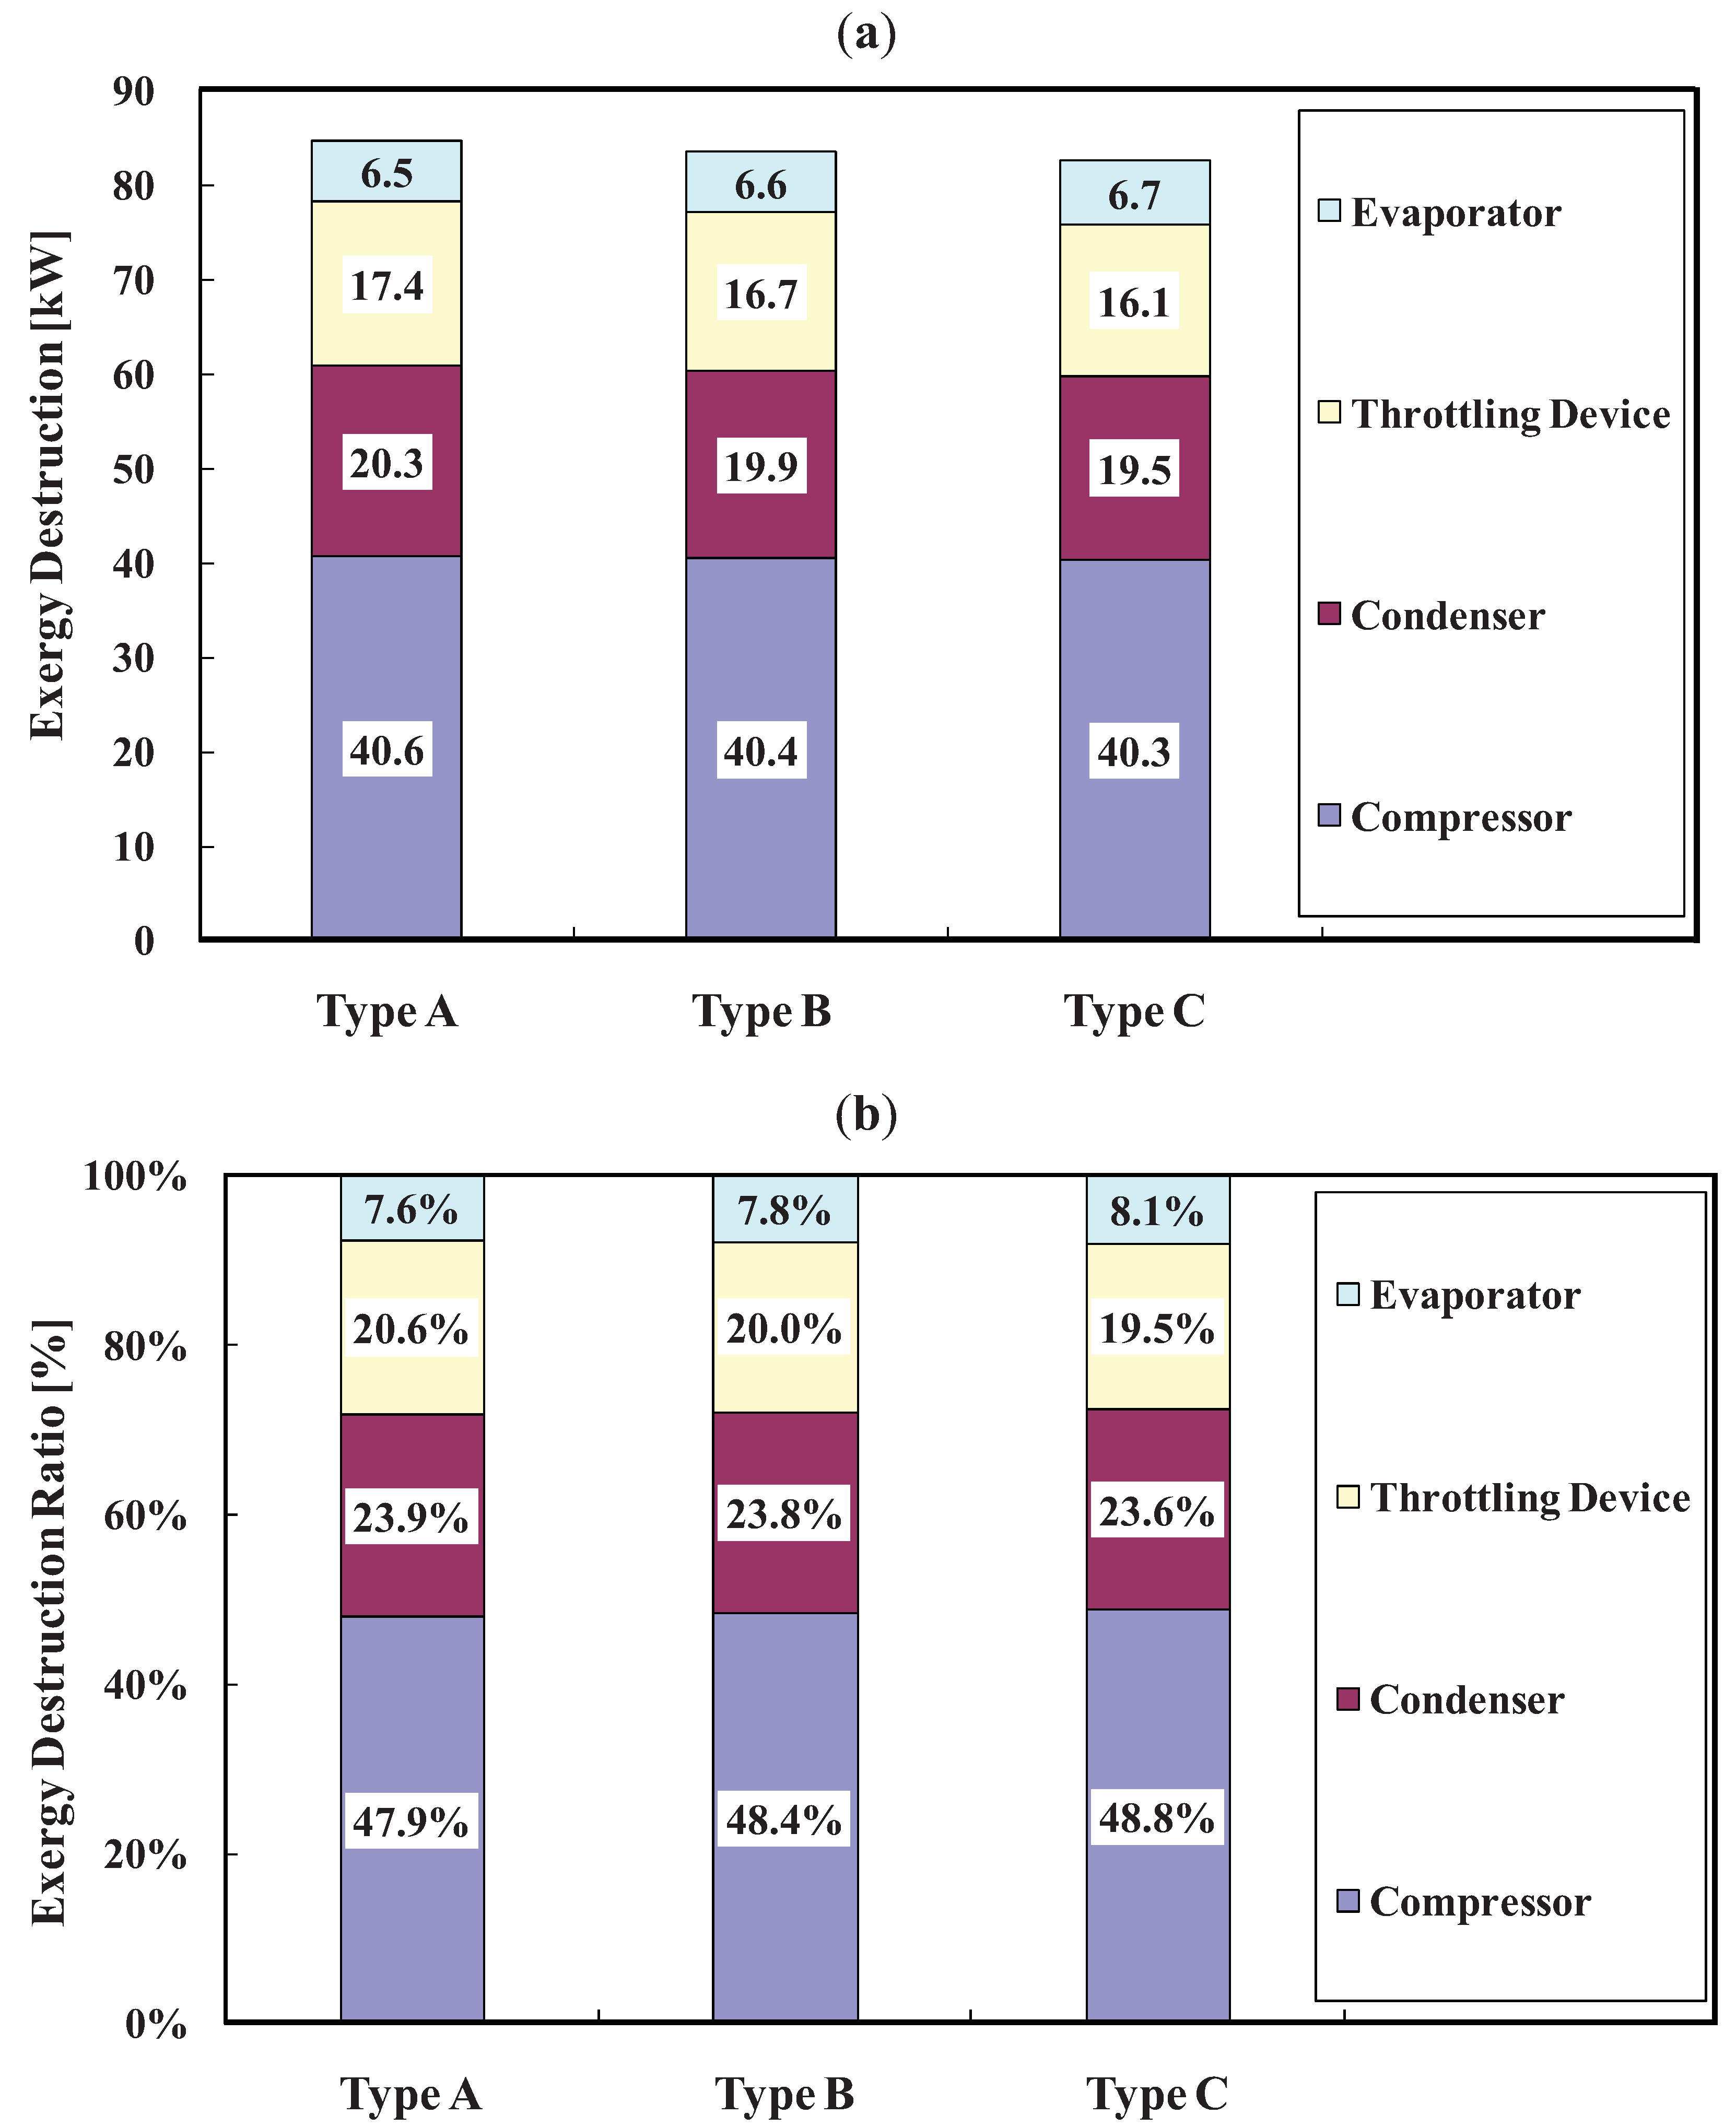
4.3. Influence on Component Irreversibility

This study used previously developed irreversibility and exergy equations to analyse the extent of energy loss caused by irreversibility in the main components of air-cooled chillers. The irreversibility analysis results for Types A–C are shown in Figure 4a,b.
Figure 4a compares the irreversibility X ˙ d e s (exergy destruction) of the four main components (compressor, condenser, throttling device, and evaporator). The total irreversibility of the Type A system was 84.7 kW, which can be broken down into individual component contributions of 40.6 kW for the compressor, 20.3 kW for the condenser, 17.4 kW for the throttling device, and 6.5 kW for the evaporator.
The irreversibility X ˙ d e s corresponding to condenser configuration Type B was 40.4 kW for the compressor, 19.9 kW for the condenser, 16.7 kW for the throttling device, and 6.6 kW for the evaporator, amounting to a total of 83.5 kW. The total irreversibility corresponding to the Type C condenser configuration was 82.5 kW, with 40.3 kW from the compressor, 19.5 kW from the condenser, 16.1 kW from the throttling device, and 6.7 kW from the evaporator.
Regardless of the angle configuration, the irreversibility of the compressors was the highest among all the main components of the air-cooled chiller, followed by the condensers. Evaporators had the lowest X ˙ d e s value. The total irreversibility of Types B and C was lower than that of Type A by approximately 1.4% and 2.7%, respectively. For Type B, the irreversibility of its major components showed the following improvement over other systems: 0.4% for the compressor, 2.0% for the condenser, 4.0% for the throttling device, and −1.1% for the evaporator. Likewise, for Type C, the irreversibility of its major components showed the following improvement over other systems: 0.8% for the compressor, 3.9% for the condenser, 7.8% for the throttling device, and −3.2% for the evaporator.
Figure 4b compares the exergy destruction ratio y d for the four major components for all three condenser configurations. The exergy destruction for the compressors for Types A–C was respectively 47.9%, 48.4%, and 48.8%. Likewise, the exergy destruction ratio was 23.9%, 23.8%, and 23.6% for the condensers, 20.6%, 20.0%, 19.5% for the throttling devices, and 7.6%, 7.8%, and 8.1% for the evaporators.
Figure 4. Comparison of irreversibility analysis associated with components for condenser configuration. (a) Exergy destruction (Irreversibility). (b) Exergy destruction ratio.
Entropy 14 00517 g004
The above results show that regardless of angle configuration, the exergy destruction ratio of the compressors was the highest, followed by the condensers, the throttling devices, and lastly the evaporators. The exergy destruction ratios y d of the compressor and evaporator for Type B were higher (by 1.0% and 2.5%, respectively) than those of the components for Type A. The exergy destruction ratios of the condenser and throttling device for Type B were lower (by 0.6% and 2.7%, respectively) than Type A throttling device. For Type C, the exergy destruction ratios y d of the compressor and evaporator exceeded those for Type A by 1.9% and 6.0%, respectively. The exergy destruction ratio of the condenser and throttling device for Type C, however, was 1.3 and 5.3% lower than those of the Type A throttling device.
This study used thermodynamic analysis to clearly identify the irreversibility and exergy destruction ratios of each component. The above results show that changing the condenser configuration increased the average wind speed over condenser coils, which reduced condensation temperature and the system pressure ratio. The pressure loss from internal friction in the compressor, condenser, and throttling device was thus reduced, which in turn reduced the irreversibility of the components. The reduced condensation temperature and increased degree of supercooling heightened the difference in entropy between the input and output points of the evaporator. This led to a slight increase in the irreversibility of the evaporator. However, the increased average wind speed still improved the overall irreversibility of the system. In addition, the total irreversibility of the system was reduced by approximately 2.7% from condenser configuration Types A–C. If the total irreversibility was assessed in terms of average wind speed, the overall irreversibility could be reduced by approximately 0.35% with every 1% increase in average wind speed.

5. Conclusions

The objective of this study was to construct a parameter analysis model in which the angle configuration of condenser coils could be altered, and to develop mathematical models of the overall system and individual components of an air-cooled water chiller. These models were then used to simulate overall unit performance, and then used to develop irreversibility and exergy equations for each system component. This was done in order to investigate the potential enhancement of performance efficiency in air-cooled chillers, including the energy conversion efficiency of each system component. Ultimately, this study aimed to determine how the angle configuration of the condenser coils influences chiller performance.
We found that changing the angle configuration of condenser coils (from Type A–C) in an air-cooled chiller results in a 3.4% increase in COP and 2.7% decrease in total irreversibility. We also found that with each 1% increase in average wind speed over condenser coils, the overall performance of the air-cooled chiller was enhanced by approximately 0.43%, and its total irreversibility was reduced by approximately 0.35%. We believe that the results of this study can be effectively applied to air-cooled condenser units, in order to provide an important reference for developing and enhancing the energy efficiency of air-cooled chillers.

Nomenclature

C ˙ min
heat capacity (kW K−1)
Cpa
specific heat capacity of air (kJ kg−1 K−1)
Cpv
specific heat capacity of wet air (kJ kg−1 K−1)
Cpw
specific heat capacity of water (kJ kg−1 K−1)
h
enthalpy (kJ kg−1)
I ˙
exergy destruction or irreversibility (kW)
K v
flow factor for throttling device
m ˙
mass flow rate (kg s−1)
NTU
number of transfer unit
ΔP
refrigerant pressure difference (kPa)
Q ˙
heat transfer rate (kW)
R c o m p
compression ratio
S ˙ g e n
entropy generation (kJ K−1)
s
specific entropy (kJ kg−1 K−1)
T
temperature (K)
UA
overall heat transfer coefficient (kW K−1)
V ˙
volume flow (m3 s1)
v
specific volume (m3 kg−1)
w c
work of per unit mass compressed (kJ kg−1)
W ˙ c
power consumption of compressor (kW)
W ˙ f
power consumption of fans (kW)
W ˙ i n
power consumption of chiller (kW)
X ˙ d e s
exergy destruction (kW)
y d
exergy destruction ratio (%)

Greek Symbols 

η e
mechanical efficiency
η i s e n
isentropic efficiency
η m
motor efficiency
η v
volumetric efficiency
ε
effectiveness (0 < ε ≤ 1
ρ
density (kg m−3)
ω
humidity ratio (kg kgda−1)
ϕ
flow exergy (kW kg−1)
μ
viscosity (Pa s)

Subscripts 

1
compressor suction
2
compressor discharge
2s
compressor discharge for isentropic compression
3
condenser discharge or throttling device inlet
4
throttling device outlet or evaporator suction
a
air side of condenser
ai
air entering the condenser
ao
air leaving the condenser
ave
average
c, cd
condenser
c1,c2…,c8
coefficient
dis
discharge
e, ev
evaporator
r
refrigerant
w
water
wi
water entering the evaporator
wo
water leaving the evaporator
wi, wo
chiller water inlet and outlet, respectively

References

  1. Lee, T.S.; Wu, W.C.; Chuah, Y.K.; Wang, S.K. An improvement of airflow and heat transfer performance of multi-coil condensers by different coil configurations. Int. J. Refrig. 2010, 33, 1370–1376. [Google Scholar] [CrossRef]
  2. Brown, M.W.; Bansal, P.K. An elemental NTU-ε model for vapour-comperssion liquid chillers. Int. J. Refrig. 2001, 24, 612–627. [Google Scholar] [CrossRef]
  3. Fu, L.; Ding, G. Steady-state simulation of screw liquid chillers. Appl. Therm. Eng. 2002, 22, 1731–1748. [Google Scholar] [CrossRef]
  4. Bansal, P.K.; Tedford, J.D.; Le, C.V. Simulation model of a screw liquid chiller for process industries using local heat transfer integration. Proc. IME E J. Process. Mech. Eng. 2005, 219, 95–107. [Google Scholar]
  5. Storcker, W.F.; Jones, J.W. Refrigeration and Air Conditioning, 2nd ed.; McGRAW-Hill: New York, NY, USA, 2001. [Google Scholar]
  6. Chan, K.T.; Yu, F.W. Experimental determination of the energy efficiency of an air-cooled chiller under part load. Energy 2005, 30, 1747–1758. [Google Scholar]
  7. Chan, K.T.; Yu, F.W. Thermodynamic-behaviour model for air-cooled screw chillers with a variable set-point condensing temperature. Appl. Energ. 2006, 83, 265–279. [Google Scholar] [CrossRef]
  8. Yu, F.W.; Chan, K.T. Analysis of component characteristics of air cooled chillers for modeling floating condensing temperature control. Energ. Convers. Manag. 2005, 46, 927–939. [Google Scholar]
  9. Yu, F.W.; Chan, K.T. Part load performance of air-cooled centrifugal chillers with variable speed condenser fan control. Build. Environ. 2007, 42, 3816–3829. [Google Scholar] [CrossRef]
  10. Yu, F.W.; Chan, K.T. Optimizing condenser fan control for air-cooled centrifugal chillers. Int. J. Therm. Sci. 2008, 47, 942–953. [Google Scholar] [CrossRef]
  11. Bridges, B.D.; Harshbarger, D.S.; Bullard, C.W. Second law analysis of refrigerators and air conditioners. ASHRAE Trans. 2001, 107, 1. [Google Scholar]
  12. Yumrutas, R.; Kunduz, M.; Kanoğlu, M. Exergy analysis of vapor compression refrigeration systems. Exergy 2002, 2, 266–272. [Google Scholar] [CrossRef]
  13. Bilgen, E.; Takahashi, H. Exergy analysis and experimental study of heat pump systems. Exergy 2002, 2, 259–265. [Google Scholar] [CrossRef]
  14. Esen, H.; Inalli, M.; Esen, M.; Pihtili, K. Energy and exergy analysis of a ground-coupled heat pump system with two horizontal ground heat exchangers. Bldg. Environ. 2007, 42, 3606–3615. [Google Scholar] [CrossRef]
  15. ASHRAE. Fundamentals ASHRAE Handbook; ASHRAE: Atlanta, GA, USA, 2001. [Google Scholar]
  16. Lee, T.S. Second-law analysis to improve the energy efficiency of screw liquid chillers. Entropy 2010, 12, 375–389. [Google Scholar] [CrossRef]
  17. McQuiston, F.C.; Parker, J.D.; Spitler, J.D. Heating, Ventilating, and Air Conditioning Analysis & Design; John Wiley & Sons, Inc.: Hoboken, NJ, USA, 2005. [Google Scholar]
  18. NIST. NIST Standard Reference Database 23; Version 8.0.; NIST: Boulder, CO, USA, 2007. [Google Scholar]
  19. Bejan, A. Advanced Engineering Thermodynamics; John Wiley & Sons, Inc: Hoboken, NJ, USA, 2006. [Google Scholar]
  20. 2003 standard for performance rating of water-chilling packages using the vapor compression cycle. ARI 550/590; Air-Conditioning, Heating and Refrigeration Institute: Arlington, VA, USA, 2003.

