Using Neighbor Diversity to Detect Fraudsters in Online Auctions


Abstract
: Online auctions attract not only legitimate businesses trying to sell their products but also fraudsters wishing to commit fraudulent transactions. Consequently, fraudster detection is crucial to ensure the continued success of online auctions. This paper proposes an approach to detect fraudsters based on the concept of neighbor diversity. The neighbor diversity of an auction account quantifies the diversity of all traders that have transactions with this account. Based on four different features of each trader (i.e., the number of received ratings, the number of cancelled transactions, k-core, and the joined date), four measurements of neighbor diversity are proposed to discern fraudsters from legitimate traders. An experiment is conducted using data gathered from a real world auction website. The results show that, although the use of neighbor diversity on k-core or on the joined date shows little or no improvement in detecting fraudsters, both the neighbor diversity on the number of received ratings and the neighbor diversity on the number of cancelled transactions improve classification accuracy, compared to the state-of-the-art methods that use k-core and center weight.1. Introduction
Online auctions have become a popular business model for more than a decade now. They attract not only legitimate businesses trying to sell their products, but also fraudsters wishing to commit fraudulent transactions. Most auction websites, such as eBay and Yahoo! Auctions, provide a reputation system to help buyers select reputable sellers. Therefore, maintaining a good reputation in the reputation system is important for sellers to gain trust and subsequent business from potential buyers in online auctions.
The reputation systems used by most auction websites are essentially recommendation systems. For example, in eBay, after committing transactions, buyers and sellers can give positive, negative or neutral ratings together with textual comments to reflect their experiences about transactions. An auction account receiving more positive ratings and fewer or no negative ratings has better online reputation. In addition to attracting sales, seller reputation also has an economically and statistically significant effect on price of merchandise [1]. A buyer is often willing to purchase the same merchandise from a more reputable seller at a higher price than from a less reputable seller at a lower price.
Normally, a legitimate seller works hard to ensure the quality of his/her merchandises and services to maintain good online reputation. However, a fraudster can easily deceive the reputation system into giving the fraudster a good online reputation, resulting in the so-called inflated reputation fraud [2]. Usually, this deceitful scheme is accomplished by a group of collusive auction accounts who commit many transactions within the group for low-price merchandise and give each other positive ratings [3]. Because the cost for creating accounts and committing transactions for low-price merchandise in online auctions is low, such inflated reputation behavior has become commonplace and consequently damages the trustworthiness of the reputation systems of auction websites.
Many approaches have been proposed in the literature to detect inflated reputation fraud in online auctions. Earlier approaches are based on user-level features [4,5] such as median, sum, mean or standard deviation of the prices of merchandises that an account bought or sold in a certain period of time. In contrast, most recent approaches have adopted a social network approach. They build a graph based on accounts’ transaction history, and then apply Social Network Analysis (SNA) to detect cohesive groups in the graph since the accounts in a collusive group often have extensive transactions within the group to boost their reputations [2,3,5–13]. To detect the cohesive groups in the graph, the notion of k-core has been found to be more feasible than other notions for cohesive groups, such as component, clique and k-plex [2,13]. However, the use of k-core often results in low precision. The notion of center weight is then proposed to improve the precision, but it decreases the recall [6].
Instead of focusing solely on the user-level features or the cohesive groups in the social network, we propose the notion of neighbor diversity of an auction account to quantify the diversity of all traders that have given at least a rating to this account. Prior to calculating neighbor diversity, all accounts are partitioned into several classes based on selected features such as the number of received ratings or k-core. Then, the neighbor diversity of an account is calculated using the class distribution of his/her neighbors in the social network. Because Shannon entropy [14] is often used to quantify the diversity of a group [15–17], it is adopted in this paper to calculate the neighbor diversity.
The objective of this paper is to improve the classification performance for fraudster detection in online auctions. To achieve this goal, we propose four types of neighbor diversity, based on the number of received ratings, the number of cancelled transactions, the joined date and k-core. A dataset of auction accounts crawled from Ruten, one of the largest online auction websites in Taiwan, is used to perform ten-fold cross validation experiment with three classification algorithms. The results show that using the neighbor diversity improves the classification accuracy, precision and recall for J48 decision tree, neural network and support vector machine.
The rest of this paper is organized as follows: Section 2 reviews previous works on fraudster detection. Section 3 defines four different measurements of neighbor diversity used in this paper. Section 4 describes the data collection process. Section 5 presents the experimental setting and discusses the results. Finally, Section 6 concludes this paper and gives some directions for future work.
2. Related Work
This section reviews previous work on detecting inflated reputation fraud in online auctions. For recent surveys on online auction frauds in general, please refer to [18,19]. For problems associated with the online reputation system, please refer to [20,21].
In the literature, the reputation systems used by most online auction websites have been criticized to be overly simple and likely to be taken advantage of by deceitful traders to inflate their online reputations. Many approaches have been proposed to deal with this problem. Chau and Faloutsos [4] suggested the use of user-level features to build a decision tree for detecting fraudsters. The user-level features they used include median and standard deviation of the prices of items sold/bought within several different periods of times, and the ratio of the number of items bought to the number of all transactions. Later, Chau et al. [5] proposed combining these user-level features with network-level features to detect the conspired groups in the social network built from the transaction history, as they observed that fraudsters and their accomplices are likely to form a bipartite core in the social network. Their method first built a Markov Random Field (MRF) model from the transaction history among all traders, then used the results of the user-level features [4] to instantiate the observed values of the nodes in the MRF model, and finally applied the belief propagation algorithm to calculate the probabilities of fraudster, accomplice and normal user for each node. Pandit et al. [7] simplified this method by instantiating the observed values of the nodes in the MRF model to a constant, and consequently the user-level features were no longer needed. Bin and Faloutsos [8] replaced the belief propagation algorithm in these methods [4,7] with the loopy belief propagation algorithm. The inflated reputation problem in a Chinese auction website was studied in [22], where the authors combined transaction-related features (including price, frequency, comment and connectedness in the transaction network) and user-level features (including reputation and age) to build a logistic regression model for estimating the likelihood of collusion of an account. Chang and Chang [23] suggested using a wrapper approach to select a subset of features from a large candidate feature pool to build a decision tree for fraudster detection.
As a fraudster relies on his/her accomplices to boost his/her online reputation, extensive transactions among them must occur in the transaction history. Accordingly, many approaches have tried to detect fraudsters by detecting the cohesive groups in the social network built from the transaction history. The notion of k-core has been found to be more feasible than other notions for cohesive groups (e.g., component, clique and k-plex) to detect fraudsters [2,13]. A common way to build the social network is to represent each trader as a node, and each transaction between two traders as an edge connecting the two corresponding nodes of the two traders. Furthermore, duplicate edges between two nodes are removed to simplify the network. Let G = (V, E) denote the graph for the social network, where V is the set of nodes and E is the set of edges. A subgraph H = (W, E/W) induced by the set W ⊆ V is a k-core if the degree of v is no fewer than k for every v ∈ V, and H is the maximum subgraph with this property. A node may be in several k-core subgraphs, each with a different k value. The maximum of these k values is referred to as the k-core attribute of this node, which can be calculated in linear time with respect to the number of edges in the graph [24].
Wang and Chiu [2] suggested using two social network measurements, k-core and core/periphery ratio, to distinguish fraudsters from normal traders, where the core/periphery ratio is the number of the nodes in the k-core divided by the number of the nodes adjacent to the k-core. Later, they suggested using k-core and center weight for fraud detection [6]. They found that fraudsters often appear in the k-cores with k ≥ 2. However, using k-core alone often results in low precision, and thus they applied center weight to improve the precision. A “robbery” algorithm was used to calculate the center weight of each node. Initially, this algorithm assigns the degree of a node as the node’s weight. Then, those nodes with larger weights repeatedly steal weights from their adjacent nodes with smaller weights. Finally, only a small number of nodes have weight greater than 0, and all of their adjacent nodes have weight 0. Essentially, those nodes with non-zero weight are the centers of k-cores, and are classified as fraudsters. Although, the use of center weight along with k-core improves the precision, but the recall is reduced.
Notably, in all of the above approaches, both k-core and center weight were used as a Boolean attribute. For k-core, they checked whether k ≥ 2 holds. For center weight, they checked whether center weight > 0 holds. Chiu et al. [13] used social network metrics such as k-core, k-plex, n-clique, normalized betweenness and degree to build a decision tree for fraud detection. They also suggested that abnormal accounts can be identified in the k-cores with k ≥ 2. Furthermore, among the abnormal accounts, fraudulent accounts can be identified using normalized betweenness, k-core with k ≥ 6, and k-plex containing 5 nodes with k = 2.
Instead of building a social network of all traders, Morzy [3] suggested building a social network of all sellers to discover clusters of sellers who are densely connected through committed transactions. First, all transactions of the low-price merchandise are ignored. Then, each node in the social network represents a seller, and for any two sellers, if there exists at least a user-defined number of common buyers for the two sellers, then the two nodes representing the two sellers are linked, and the strength of the link is set to the number of their common buyers. Furthermore, the density of a node is defined as the number of its neighboring nodes. Finally, a score of trustworthiness of a seller is calculated using the densities of its neighboring nodes and the strengths of its links. Notably, instead of detecting fraudsters, Morzy [3] tried to measure the trustworthiness of each trader.
3. Neighbor Diversity
Given an account x, x’s neighbors are those accounts who gave at least one rating to x. Notably, we disregard those accounts who had transactions with x but never gave any rating to x, as x’s neighbors. The infalted reputation fraud is achieved by giving positive ratings among the members in a collusive group, and if the two parties of a transaction do not give a positive rating to his/her counterparty, then the chance of both belonging to the same collusive group will be small. Moreover, if none of the two parties in a transaction gives his/her counterparty a rating, then the information about this transaction is not available to the public. Consequently, we, as a third party to the transaction, cannot built a link between these two parties using the dataset crawlled from the auction website.
As described in Section 1, a fraudster does business mostly with his/her accomplices to inflate his/her reputation. The accomplices may share some common characteristics, and consequently the diversity of a fraudster’s neighbors on those characteristics is likely to be small. In this section, we propose four measurements for neighbor diversity. Later in Section 5.2, we provide a preliminary analysis to show that fraudsters tend to have lower neighbor diversity than non-fraudsters.
Prior to calculating the neighbor diversity, we first select an attribute attr and divide all accounts into several classes based on this selected attribute. Let n be the number of classes, and pi(x) be the ratio of the number of x’s neighbors in the i-th class and the total number of x’s neighbors. Then, the neighbor diversity on the attribute attr of an account x, denoted as Dattr(x), is calculated using Shannon entropy [14] as follows:
Notably, by selecting a different attribute for attr, we have a different measurement for neighbor diversity. In this study, we tried four attributes, including the number of received ratings, the number of cancelled transactions, k-core and the joined date, and developed four different measurements for neighbor diversity. The following four subsections describe how to use the four selected attributes to divide all accounts into several classes. Once each account is assigned to a class, Equation (1) is applied to calculate neighbor diversity of an account.
3.1. Neighbor Diversity on the Number of Received Ratings
The number of received ratings of an account is the first attribute chosen for measuring neighbor diversity. We divided the range of the number of received ratings into several half-open intervals, and the accounts with their numbers of received ratings falling into the same interval belong to the same class. The half-open interval for the first class is [0, 25 × 2), and the half-open interval for the i-th class is [25 × 2i−1, 25 × 2i) for i > 1. Then, Equation (1) is applied to calculate the neighbor diversity on the number of received ratings. We denote the neighbor diversity on the number of received ratings of an account x as Dr(x).
3.2. Neighbor Diversity on the Number of Cancelled Transactions
The number of cancelled transactions of an account is the second chosen attribute for calculating neighbor diversity. We divided the range of the number of cancelled transactions into several half-open intervals in exactly the same manner as the number of received ratings. Then, Equation (1) is applied to calculate the neighbor diversity on the number of cancelled transactions. We denote the neighbor diversity on the number of cancelled transactions of an account x as Dc (x).
3.3. Neighbor Diversity on k-Core
In the literature, k-core was found useful to detect cohesive groups of fraudsters and their accomplices [2,6,13]. According to [6,13], fraudsters are more likely to reside in the 2-core subgroups. Thus, the k-core is the third chosen attribute for calculating neighbor diversity in this study. We use the scoial network of all traders built from the transaction history, as described in Section 2. The k-core of an account is defined as the largest k value among all k-core subgroups that contain the account in the social network. For example, if an account belong to a 2-core subgroup, a 3-core subgroup and a 4-core subgroup simultaneously, then the k-core of the account is 4.
To calculate the neighbor diversity on k-core, we divided the range of the k-core attribute into half-open intervals of width 2. That is, the first half-open interval is [0, 2), and the i-th half-open interval is [2 × (i − 1), 2 × i) for i > 1. Then, each interval corresponds to a class, and Equation (1) is applied to calculate the neighbor diversity on k-core. We denote the neighbor diversity on the k-core of an account x as Dk (x).
3.4. Neighbor Diversity on the Joined Date
The joined date of an account is the date that the account is created or registered. For ease of handling, we transform the joined date of an account into the number of months that the account has created. We divided the range of the number of months into half-open intervals, each with a width of 10 months. That is, the first half-open interval is (0,10) for those accounts who are smaller than 10 months old; the i-th half-open interval is [10 × (i − 1), 10 × i) for i > 1. Then, each interval corresponds to a class, and Equation (1) is applied to calculate the neighbor diversity on the joined date. We denote the neighbor diversity on the joined date of an account x as Dj (x).
4. Data Collection
In the experimental study, we gathered a list of accounts from a real world auction website, constructed a social network to calculate accounts’ features, and built several classifiers for performance evaluation. The first two steps are described in the following two subsections, and the last step is discussed in Section 5.
4.1. Collecting the List of Auction Accounts
Ruten ( www.ruten.com.tw) is one of the largest auction websites in Taiwan, funded by e-Bay and PChome Online [12]. Ruten regularly releases a list of suspended accounts, together with their reasons for the suspension. Like previous work [13,25], our list of accounts starts with these suspended accounts, and then grows to include more accounts in a level-wise manner. The detailed process is as follows:
Firstly, we collected the lists of suspended accounts from Ruten during July 2013, and thus gathered 9168 suspended accounts. However, not all suspended accounts are fraudsters. For example, some accounts are suspended due to selling cigarettes or alcohol. We manually examined the suspended reasons of these 9168 suspended accounts, and kept only those accounts who have received at least one rating and whose suspension reasons are related to fraudulent behavior. These suspended reasons include fake biddings, evaluation hype, selling counterfeit products, and failure to deliver products. As a result, only 932 out of the 9168 suspended accounts were kept. We denote these 932 accounts as the L1 accounts. Because Ruten changed the status of one of the 932 accounts back to normal during October 2013, the L1 accounts include one non-fraudster and 931 fraudsters.
Secondly, we crawled Ruten to collect all the ratings that the L1 accounts had received. These ratings also provide the information about who gave the ratings to these L1 accounts. As a result, 3475 new accounts were collected, and each of these 3475 accounts had given at least a rating to at least one L1 account. We denote these 3475 accounts as L2 accounts. Notably, 149 out of the 3475 L2 accounts are suspended accounts, and because they are suspended accounts who gave positive ratings to the fraudsters in the L1 accounts, we classified them as fraudsters. Among the 149 fraudsters, 46 accounts also appeared in the initial list of the 9168 suspended accounts.
Thirdly, we crawled Ruten again to collect all the ratings that the L2 accounts had received, and gathered 233,169 new accounts who had given at least one rating to at least one L2 account. We denote these 233,169 accounts as L3 accounts. For the experiment in Section 5, the L3 accounts are only used to build the social network to provide a complete view of the L2 accounts’ neighbors. We did not try to classify the L3 accounts as fraudsters or non-fraudsters. Therefore, we did not collect information about whether an L3 account is fraudster or not in this study.
4.2. Construction of Social Network
In the literature [7,10,13,25], the transaction network of auction accounts is often used as the social network for fraudster detection. In this study, we also adopted the transaction network to derive the k-core, center weight and neighbor diversity of each account. Notably, k-core was found useful to detect fraudsters [2,13], and center weight was found to further improve the precision of using k-core alone [6]. Thus, later in Section 5.3, we use k-core and center weight in combination with the neighbor diversity for fraudster detection.
In the transaction network, each node represents an account, and each edge represents a rating that one account gave another account. If there exist more than one rating between two accounts, only one edge between the two accounts’ corresponding nodes is added to the transaction network. To construct the transaction network, we first added all L1, L2 and L3 accounts as the nodes to the transaction network. Then, for each rating received by an L1 or an L2 account, an edge is added to the transaction network. The resulted network contains 237,576 (=932 + 3475 + 233,169) nodes and 348,259 edges. This network did not include those edges for the ratings that occur after 31 July 2013.
Once the transaction network was constructed, we used the transaction network to calculate the k-core and center weight for each node in the network, as described in Section 2. Also, we crawled Ruten’s website to collect the number of received ratings, the number of cancelled transactions, and the joined date for each account in the network. Finally, we used the transaction netowork to calculate the four measurements of neighbor diversity for each L1 and L2 account. We did not calculate the neighbor diversity for the L3 accounts because this network is only a part of the complete transaction network and it does not include all neighbors of the L3 accounts. Therefore, L3 accounts are only used to built the transaction network, and to calculate the neighbor diversity of the L1 and L2 accounts.
5. Experimental Results
5.1. Setting
The set of accounts used in the experimental study includes all L1 and L2 accounts. It contains 4407 (=932 + 3475) accounts, and among them, 1080 (=931 + 149) are fraudsters, and 3327 (=4407 – 1080) are non-fraudsters (i.e., normal accounts). Descriptive statistics of the four measurements of neighbor diversity for the group of frausters and for the group of non-fraudsters are shown in Table 1. For ease of exposition, the neighbor diversities on the number of received ratings, on the number of cancelled transactions, on k-core, and on the joined date are denoted as Dr, Dc, Dk and Dj, respectively.
The experiment includes two parts. The first part (in Section 5.2) performed a Mann-Whitney U Test on each of the four measurements of neighbor diversity between the group of 1080 fraudsters and the group of 3327 non-fraudsters. The results provide a preliminary evidence that fraudsters tend to have a lower neighbor diversity than non-fraudsters.
The second part of the experiment (in Section 5.3) evaluated whether the use of neighbor diversity could improve the classification performance on discerning fraudsters and non-fraudsters. For each account, the following attributes were used: k-core, center weight, and the four measurements of neighbor diversity. We first used k-core and center weight to build a classifier and evaluated its classification performance. Then, we compared the performance of each classifier against the performance of the classifier with the addition of one measurement of neighbor diversity as input attribute. Three classification algorithms (J48 decision tree, Neural Networks (NN) and Support Vector Machine (SVM)) from Weka [26] were used to perform 10-fold cross-validation. Notably, the classification experiment was conducted in two different settings. In Test 1, both k-core and center weight were used as numeric attributes. However, previous work [13,25] used k-core and center weight as Boolean attributes by checking whether k is greater than or equal to 2, and whether the center weight is 0 or not. Thus, in Test 2, we used k-core and center weight as Boolean attributes to build classifiers.
5.2. Results on Comparing the Mean Neighbor Diversity between Groups
Prior to comparing the mean neighbor diversity between the group of fraudsters and the group of non-fraudsters, we used the Kolmogorov–Smirnov test to check the normality for each group on each of the four measurements of neighbor diversity. The results showed that the assumption of normality failed for both groups on all four measurements of neighbor diversity.
Because the assumption of normality of distribution is questionable, the Mann-Whitney U Test was used as a substitute for a Student t test to compare the difference between the mean neighbor diversity at both groups. The test results were all in the expected direction and significant (z = −38.562 and p < 0.05 for Dr, z = −37.535 and p < 0.05 for Dc, z = −27.131 and p < 0.05 for Dk, and z = −30.141 and p < 0.05 for Dj). Therefore, the mean neighbor diversity is lower in the group of fraudsters than in the group of non-fraudsters for all four measurements of neighbor diversity.
5.3. Results on Classification Performance
For ease of exposition, center weight is denoted as CW. Test 1 used k-core and CW or k-core, CW and one of Dr, Dc, Dk and Dj as input attributes to build classifiers. The results of Test 1 using J48, NN and SVM are shown in Tables 2, 3 and 4, respectively. With all three classification algorithms, the recall is lower than 52% when using only k-core and CW. With the addition of Dr or Dc as input attribute, the recall improves respectively to 0.8731 and 0.587 using J48, and respectively to 0.7787 and 0.875 using NN. With all three classification algorithms, the addition of Dr or Dc always significantly improves the accuracy, recall and F1-measure, but sometimes slightly decreases the precision. The addition of Dk or Dj does not provide stable improvement on recall and precision when using different classification algorithms. Notably, in Tables 2–7, if the addition of a neighbor diversity shows poorer result than without using the neighbor diversity, its result are shown in italic font. Also, the best results are shown in bold.
Test 2 is the same as Test 1 except that the k-core and CW attributes are first transformed into Boolean attributes, as described earlier in Section 5.1. The results of Test 2 using J48, NN and SVM are shown in Tables 5 and 7, respectively. Compared to using numeric k-core and CW in Tables 2 and 4, using Boolean k-core and CW only slightly improves the precision but further decreases the recall to less than 37%. However, with the addition of Dr, Dc, Dk or Dj as input attribute, accuracy, recall and F1-measure are improved with all three classification algorithms.
5.4. Discussion
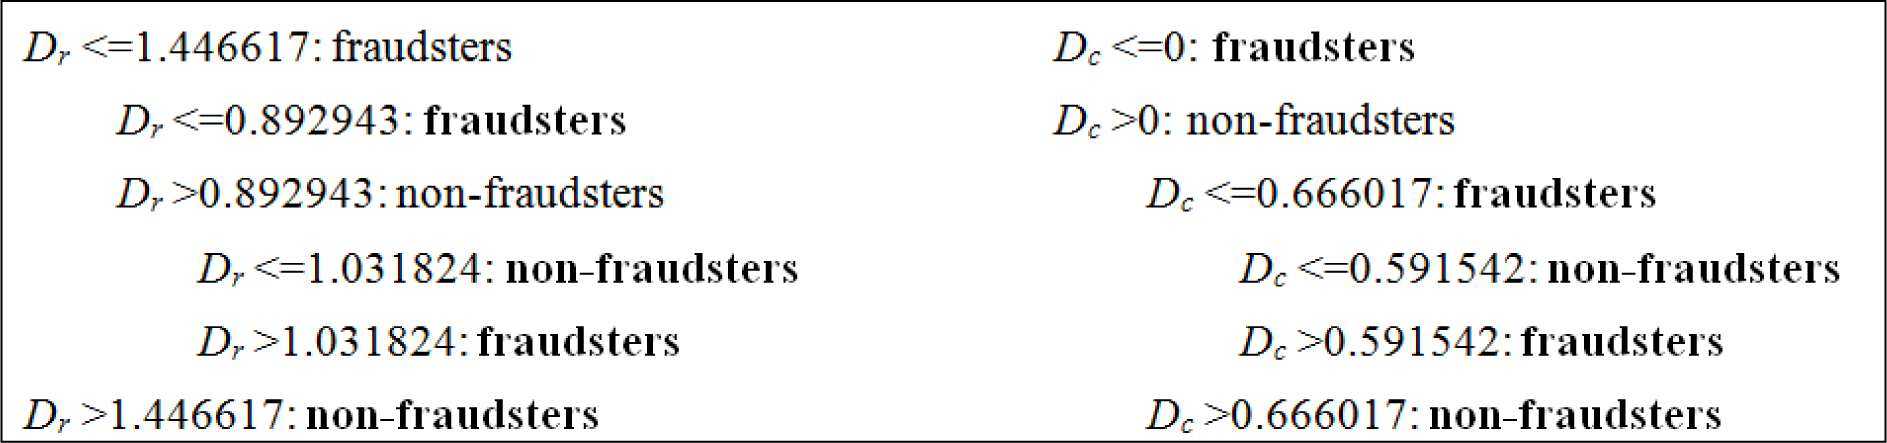
To understand the implication why Dr and Dc help detecting fraudsters, we built two decision trees, one using Dr and another using Dc, as the only input attribute. The results, shown in Table 8, remain competitive to those reported in Table 2.
For clarity, we show both decision trees up to depth 3 in Figure 1. The nodes in the top two levels of the decision tree of Dr essentailly classified accounts with Dr <= 0.892943 as fraudsters and accounts with Dr > 0.892943 as non-fraudsters. This coincides with our assumption that fraudsters tend to have lower neighbor diversity than non-fraudsters. Similarly, the nodes in the top two levels of the decision tree of Dc essentailly classified accounts with Dc <= 0.666017 as fraudsters and accounts with Dr > 0.666017 as non-fraudsters.
6. Conclusions
Most recent approaches for fraudster detection in online auction utilize social network analysis to detect cohesive groups in the social network [2,6,13]. This work takes a different perspective by measuring the diversity of the neighbors of each trader. The intuition behind this approach is that the neighbors of a fraudster are likely to have similar patterns, and therefore have a low diversity. Four ways to measure the neighbor diversity based on four different attributes are proposed, and their performance for detecting fraudsters are evaluated using a real world dataset crawlled from the auction website Ruten. The experimental results show that the addition of using neighbor diversity on the number of received ratings (i.e., Dr) or on the number of cancelled transactions (i.e., Dc) significantly improves the accuracy, recall and F1-measure at the cost of sometimes slightly reducing the precision. However, the results of the neighbor diversity on k-core (i.e., Dk) or on the joined date (i.e., Dj) show little or no improvement.
In contrast to the inflated reputation problem, an evildoer may try to damage the reputation of its competitors by giving negative ratings to the competitors [20,21]. How to adapt the reputation systems to such malicious activities is an interesting topic. One possible remedy is to use a weighted voting system such that a negative rating from a more reputable trader carries more weight when calculating the reputation of a trader. This is left as future work.
Acknowledgments
This research is supported by the National Science Council under Grant 102-2221-E-155-034-MY3.
Author Contributions
Both authors contributed to the conception and design of the study, the collection and analysis of the data and the discussion of the results. Jun-Lin Lin wrote the manuscript.
Conflicts of Interest
The authors declare no conflict of interest.
References and Notes
- Houser, D.; Wooders, J. Reputation in Auctions: Theory, and Evidence from eBay. J. Econ. Manag. Strategy 2006, 15, 353–369. [Google Scholar]
- Wang, J.-C.; Chiu, C.-Q. Detecting online auction inflated-reputation behaviors using social network analysis, Available online: http://citeseerx.ist.psu.edu/viewdoc/download?doi=10.1.1.69.6139&rep=rep1&type=pdf (accessed on 9 May 2014).
- Morzy, M. New algorithms for mining the reputation of participants of online auctions. Algorithmica 2008, 52, 95–112. [Google Scholar]
- Chau, D.H.; Faloutsos, C. Fraud detection in electronic auction, Presented at European Web Mining Forum, held as part of ECML/PKDD 2005, Porto, Portugal, 3 October 2005.
- Chau, D.; Pandit, S.; Faloutsos, C. Detecting Fraudulent Personalities in Networks of Online Auctioneers. In Knowledge Discovery in Databases: PKDD 2006; Fürnkranz, J., Scheffer, T., Spiliopoulou, M., Eds.; Springer: Berlin/Heidelberg, Germany, 2006; Volume 4213, pp. 103–114. [Google Scholar]
- Wang, J.-C.; Chiu, C.-C. Recommending trusted online auction sellers using social network analysis. Expert Syst. Appl 2008, 34, 1666–1679. [Google Scholar]
- Pandit, S.; Chau, D.H.; Wang, S.; Faloutsos, C. Netprobe: A fast and scalable system for fraud detection in online auction networks, In Proceedings of the 16th International Conference on World Wide Web; ACM: Banff, Alberta, Canada, 2007; pp. 201–210.
- Bin, Z.; Yi, Z.; Faloutsos, C. Toward a Comprehensive Model in Internet Auction Fraud Detection, In Proceedings of the 41st Annual Hawaii International Conference on System Sciences, Waikoloa, Big Island, HI, USA, 7–10 January 2008; p. 79.
- Morzy, M. Cluster-based analysis and recommendation of sellers in online auctions. Comput. Syst. Sci. Eng 2007, 22, 279–287. [Google Scholar]
- Lin, S.J.; Jheng, Y.Y.; Yu, C.H. Combining ranking concept and social network analysis to detect collusive groups in online auctions. Expert Syst. Appl 2012, 39, 9079–9086. [Google Scholar]
- Yu, C.H.; Lin, S.J. Web crawling and filtering for on-line auctions from a social network perspective. Inf. Syst. E Bus. Manag 2012, 10, 201–218. [Google Scholar]
- Yu, C.H.; Lin, S.J. Fuzzy rule optimization for online auction frauds detection based on genetic algorithm. Electron. Commer. Res 2013, 13, 169–182. [Google Scholar]
- Chiu, C.; Ku, Y.; Lie, T.; Chen, Y. Internet Auction Fraud Detection Using Social Network Analysis and Classification Tree Approaches. Int. J. Electron. Commer 2011, 15, 123–147. [Google Scholar]
- Shannon, C.E. A Mathematical Theory of Communication. Bell Syst. Tech. J 1948, 27. [Google Scholar]
- Quinlan, J.R. C4.5: Programs for Machine Learning; Morgan Kaufmann Publishers Inc: San Francisco, CA, USA, 1993; p. 302. [Google Scholar]
- Usta, I.; Kantar, Y.M. Mean-variance-skewness-entropy measures: A multi-objective approach for portfolio selection. Entropy 2011, 13, 117–133. [Google Scholar]
- Lin, J.-L. On the Diversity Constraints for Portfolio Optimization. Entropy 2013, 15, 4607–4621. [Google Scholar]
- Noufidali, V.; Thomas, J.S.; Jose, F.A. E-Auction Frauds—A Survey. Int. J. Comput. Appl 2013, 61, 41–45. [Google Scholar]
- Dong, F.; Shatz, S.M.; Xu, H. Combating online in-auction fraud: Clues, techniques and challenges. Comput. Sci. Rev 2009, 3, 245–258. [Google Scholar]
- Dellarocas, C.; Wood, C.A. The sound of silence in online feedback: Estimating trading risks in the presence of reporting bias. Manag. Sci 2008, 54, 460–476. [Google Scholar]
- Dellarocas, C. Online Reputation Systems: How to Design One That Does What You Need. MIT Sloan Manag. Rev 2010, 51, 33–38. [Google Scholar]
- You, W.; Liu, L.; Xia, M.; Lv, C. Reputation inflation detection in a Chinese C2C market. Electron. Commer. Res. Appl 2011, 10, 510–519. [Google Scholar]
- Chang, W.-H.; Chang, J.-S. An effective early fraud detection method for online auctions. Electron. Commer. Res. Appl 2012, 11, 346–360. [Google Scholar]
- Batagelj, V.; Zaversnik, M. An O(m) Algorithm for Cores Decomposition of Networks 2002, arXiv, cs/0310049.
- Wang, J.C.; Chiu, C.C. Recommending Trusted Online Auction Sellers Using Social Network Analysis. Expert Syst. Appl 2008, 34, 1666–1679. [Google Scholar]
- Witten, I.H.; Frank, E.; Hall, M.A. Data Mining: Practical Machine Learning Tools and Techniques; Morgan Kaufmann Publishers Inc: Burlington, MA, USA, 2011; p. 664. [Google Scholar]


| neighbor diversity | group | median | mean | std | skewness | kurtosis |
|---|---|---|---|---|---|---|
| Dr | fraudster | 0.0000 | 0.3812 | 0.62818 | 1.669 | 2.205 |
| non−fraudster | 2.5219 | 2.1475 | 1.06877 | −0.891 | −0.460 | |
| Dc | fraudster | 0.0000 | 0.0397 | 0.20918 | 6.236 | 41.781 |
| non−fraudster | 0.9574 | 0.9296 | 0.74878 | 0.221 | −1.087 | |
| Dk | fraudster | 0.3113 | 0.7064 | 0.81721 | 0.698 | −0.877 |
| non−fraudster | 1.8937 | 1.6073 | 8.389 | −0.834 | −0.596 | |
| Dj | fraudster | 0.5475 | 0.8344 | 0.95975 | 0.735 | −0.764 |
| non−fraudster | 2.5850 | 2.1136 | 1.08845 | −0.956 | −0.506 | |
| Attributes | Accuracy | Recall | Precision | F1-measure |
|---|---|---|---|---|
| k-core & CW | 82.9816 | 0.5000 | 0.7200 | 0.590164 |
| k-core & CW & Dr | 85.818 | 0.8731 | 0.6590 | 0.751091 |
| k-core & CW & Dc | 84.0708 | 0.5870 | 0.7124 | 0.643649 |
| k-core & CW & Dk | 82.9589 | 0.5426 | 0.6951 | 0.609455 |
| k-core & CW & Dj | 83.1178 | 0.5806 | 0.6830 | 0.627651 |
| Attributes | Accuracy | Recall | Precision | F1-measure |
|---|---|---|---|---|
| k-core & CW | 79.6006 | 0.5167 | 0.5968 | 0.553869 |
| k-core & CW & Dr | 83.7758 | 0.7787 | 0.6386 | 0.701726 |
| k-core & CW & Dc | 81.5975 | 0.8750 | 0.5830 | 0.699760 |
| k-core & CW & Dk | 78.6476 | 0.4398 | 0.5857 | 0.502371 |
| k-core & CW & Dj | 79.2149 | 0.4991 | 0.5897 | 0.540631 |
| Attributes | Accuracy | Recall | Precision | F1-measure |
|---|---|---|---|---|
| k-core & CW | 82.9362 | 0.4917 | 0.7234 | 0.585459 |
| k-core & CW & Dr | 84.4112 | 0.7685 | 0.6551 | 0.707283 |
| k-core & CW & Dc | 83.1178 | 0.5389 | 0.7029 | 0.610071 |
| k-core & CW & Dk | 82.4824 | 0.5120 | 0.6930 | 0.588906 |
| k-core & CW & Dj | 82.7774 | 0.5046 | 0.7087 | 0.589483 |
| Attributes | Accuracy | Recall | Precision | F1-measure |
|---|---|---|---|---|
| k-core & CW | 80.1225 | 0.3009 | 0.7287 | 0.425924 |
| k-core & CW & Dr | 84.4792 | 0.8176 | 0.6445 | 0.720803 |
| k-core & CW & Dc | 83.9573 | 0.5889 | 0.7075 | 0.642775 |
| k-core & CW & Dk | 80.5764 | 0.4204 | 0.6637 | 0.514749 |
| k-core & CW & Dj | 81.4613 | 0.5204 | 0.6527 | 0.579090 |
| Attributes | Accuracy | Recall | Precision | F1-measure |
|---|---|---|---|---|
| k-core & CW | 79.8275 | 0.3602 | 0.6627 | 0.466721 |
| k-core & CW & Dr | 84.3885 | 0.6713 | 0.6853 | 0.678228 |
| k-core & CW & Dc | 84.0481 | 0.6435 | 0.6861 | 0.664118 |
| k-core & CW & Dk | 80.9621 | 0.4815 | 0.6508 | 0.553493 |
| k-core & CW & Dj | 81.7109 | 0.5463 | 0.6512 | 0.594155 |
| Attributes | Accuracy | Recall | Precision | F1-measure |
|---|---|---|---|---|
| k-core & CW | 80.1225 | 0.3009 | 0.7287 | 0.425924 |
| k-core & CW & Dr | 84.2296 | 0.6815 | 0.6771 | 0.679293 |
| k-core & CW & Dc | 81.6201 | 0.5944 | 0.6331 | 0.613140 |
| k-core & CW & Dk | 80.6444 | 0.3556 | 0.7098 | 0.473822 |
| k-core & CW & Dj | 81.5294 | 0.4778 | 0.6736 | 0.559052 |
| Attribute | Accuracy | Recall | Precision | F1-Measure |
|---|---|---|---|---|
| Dr | 84.1843 | 0.8019 | 0.6420 | 0.713096 |
| Dc | 81.3252 | 0.9500 | 0.5716 | 0.713749 |
© 2014 by the authors; licensee MDPI, Basel, Switzerland This article is an open access article distributed under the terms and conditions of the Creative Commons Attribution license (http://creativecommons.org/licenses/by/3.0/).
Share and Cite
Lin, J.-L.; Khomnotai, L. Using Neighbor Diversity to Detect Fraudsters in Online Auctions. Entropy 2014, 16, 2629-2641. https://doi.org/10.3390/e16052629
Lin J-L, Khomnotai L. Using Neighbor Diversity to Detect Fraudsters in Online Auctions. Entropy. 2014; 16(5):2629-2641. https://doi.org/10.3390/e16052629
Chicago/Turabian StyleLin, Jun-Lin, and Laksamee Khomnotai. 2014. "Using Neighbor Diversity to Detect Fraudsters in Online Auctions" Entropy 16, no. 5: 2629-2641. https://doi.org/10.3390/e16052629