Phase Competitions behind the Giant Magnetic Entropy Variation: Gd5Si2Ge2 and Tb5Si2Ge2 Case Studies

 ,
, 

Abstract
:
1. Introduction
2. Thermodynamics of First Order Phase Transitions
2.1. General Approach
2.2. How to Inspect the “Hidden” Magnetic Ordering Temperatures
- (1)
- Measure the magnetization as a function of magnetic field for several temperatures in the range where TS is expected (a broader interval will provide more points and hence more accurate fits), ensuring that for some isotherms the field is strong enough to induce the metamagnetic transition;
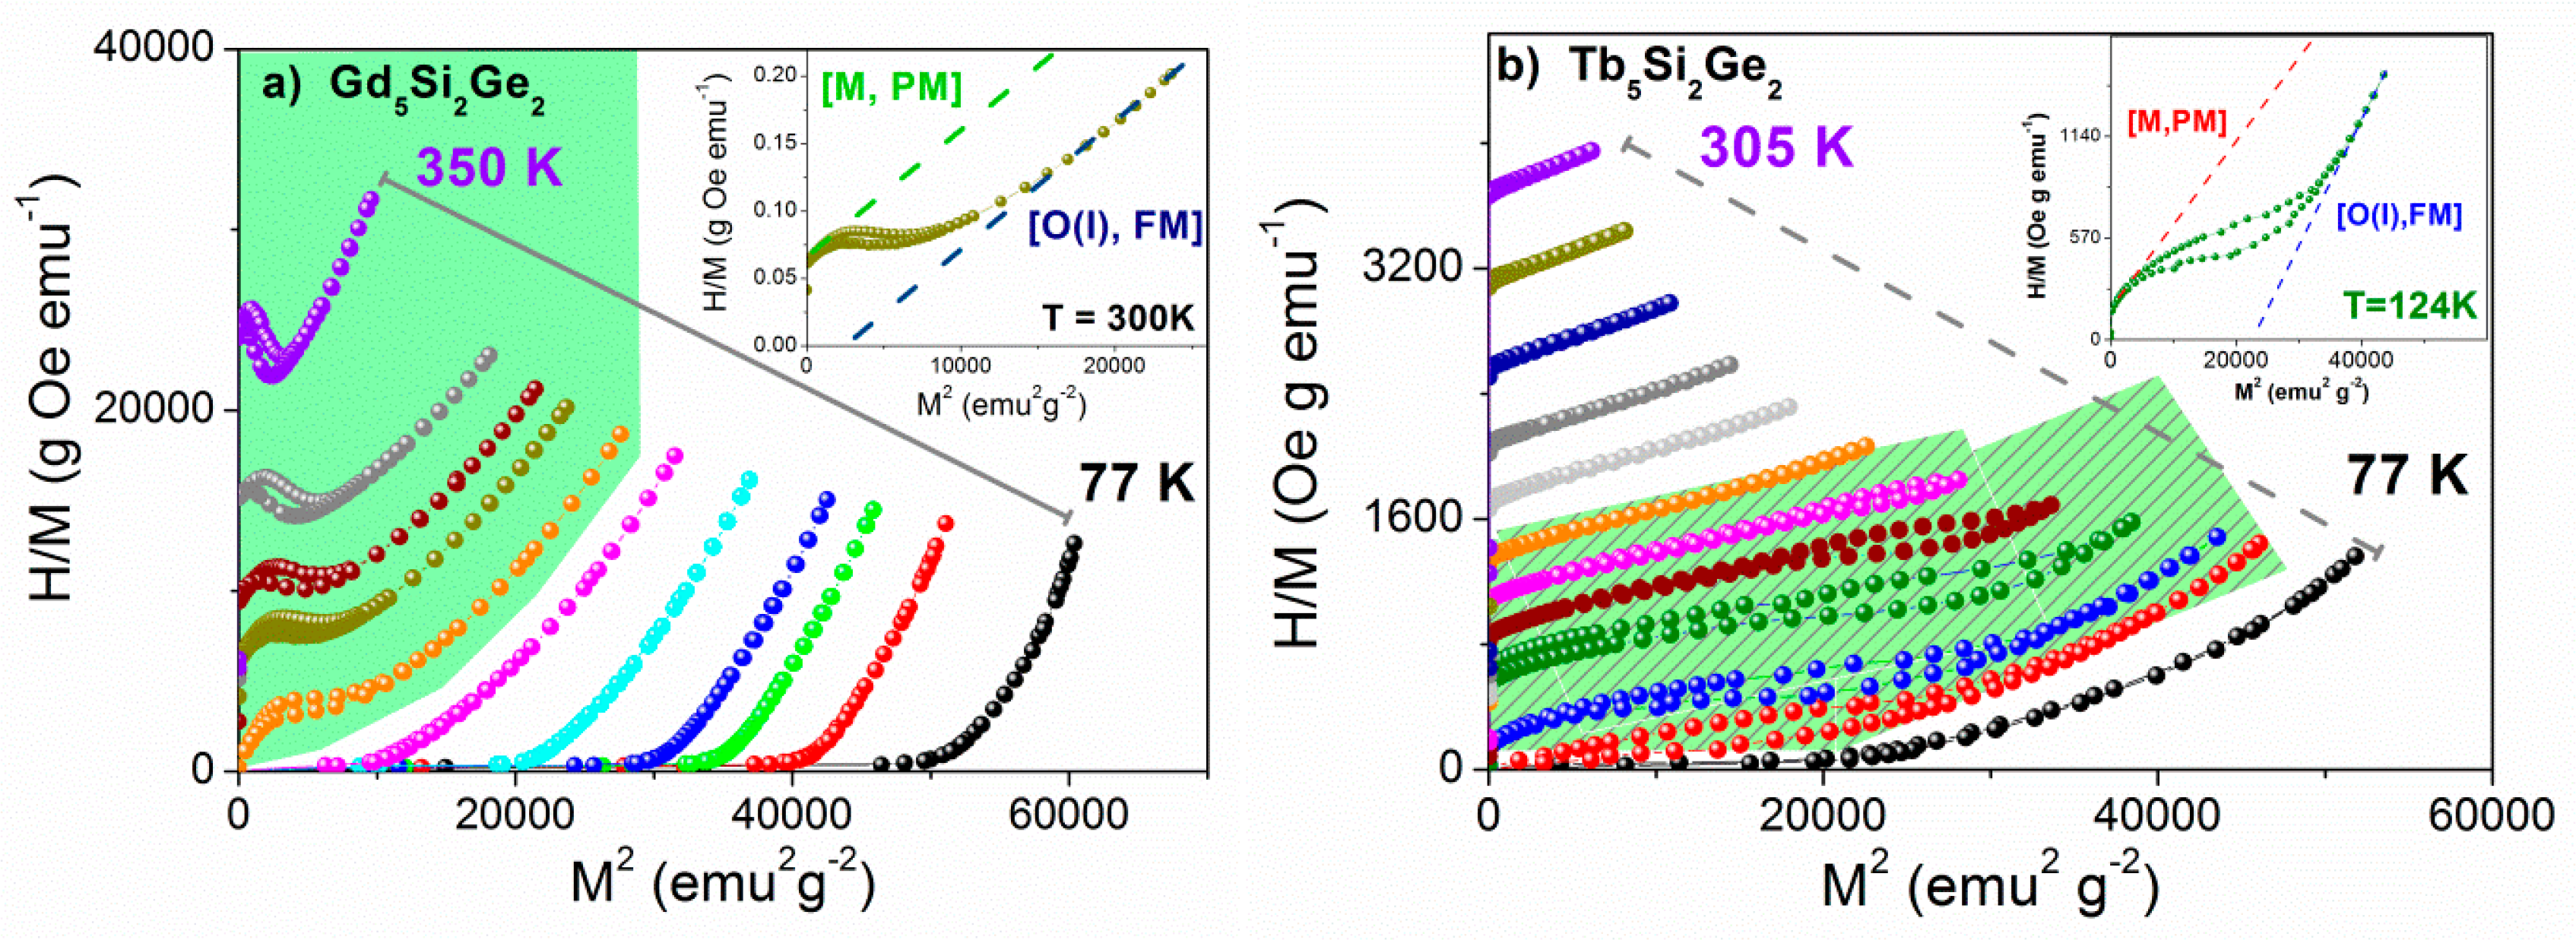
- (2)
- Replot the data in the Arrott form (H/M as a function of M2) and identify the two different linear regimes associated with LM (1) and HM (2) states for T > TS;
- (3)
- Perform linear fits to these two different regimes and estimate their interceptions with the positive y-axis (for the LM state) and with the positive x-axis (for the HM state) in order to extract, respectively, the inverse susceptibility of the LM (1) state—χ−1(LM)—and the squared spontaneous magnetization of the HM (2) phase—M2S (HM).;
- (4)
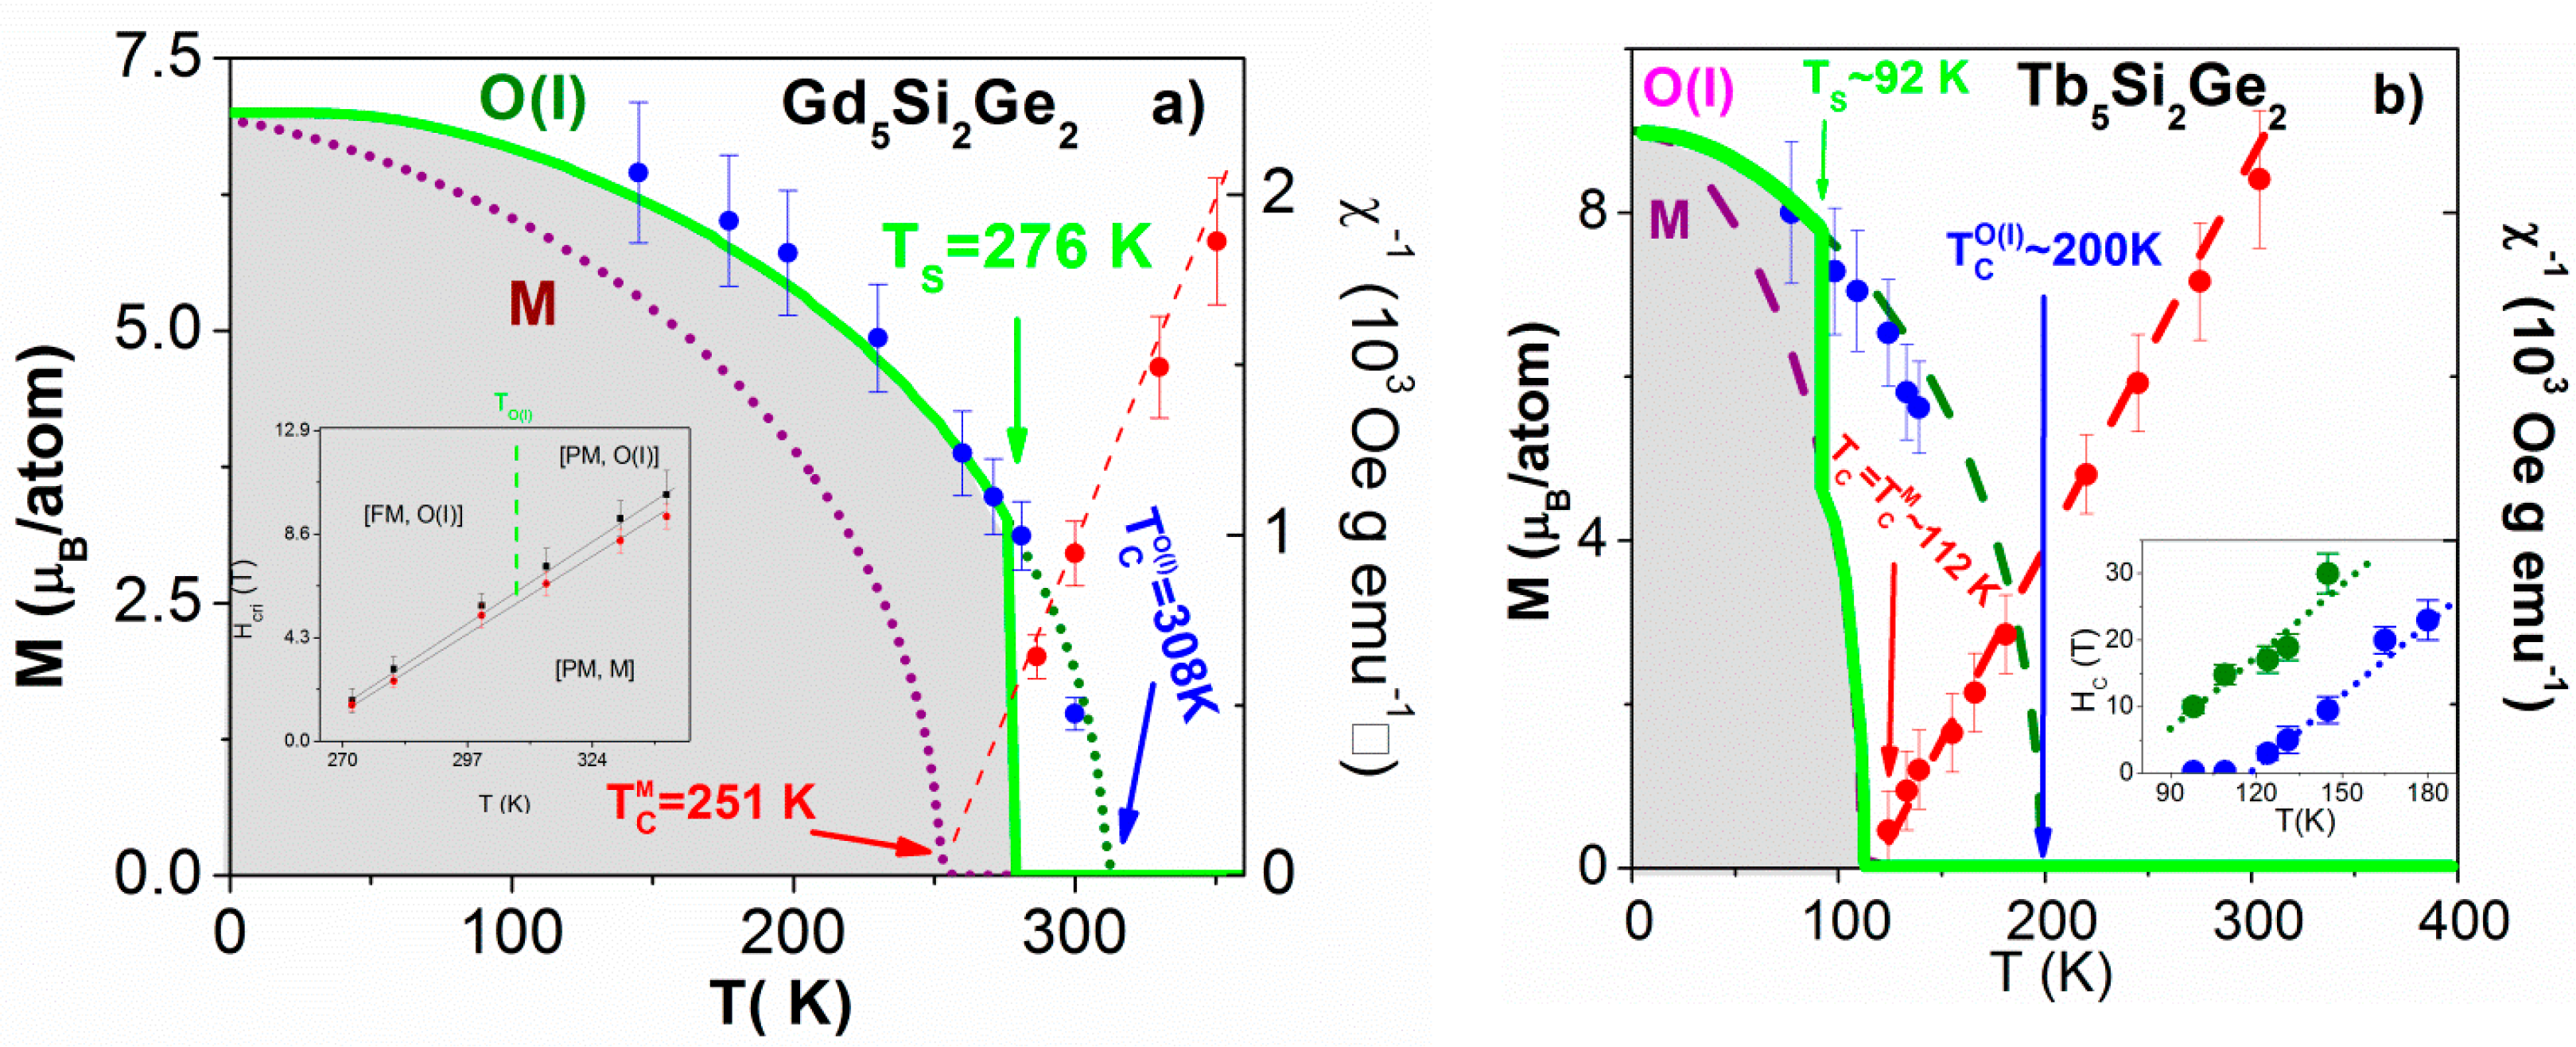
- Plot χ−1(1) and (2) as a function of temperature;
- (5)
- Through linear and Brillouin fits to these curves, the magnetic ordering temperatures of both 1 and 2 structures are extracted.
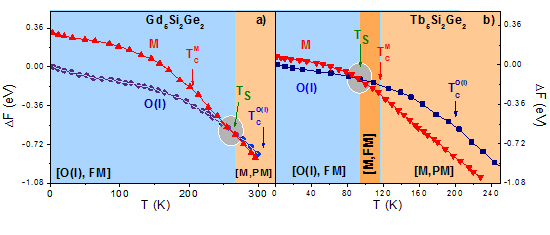
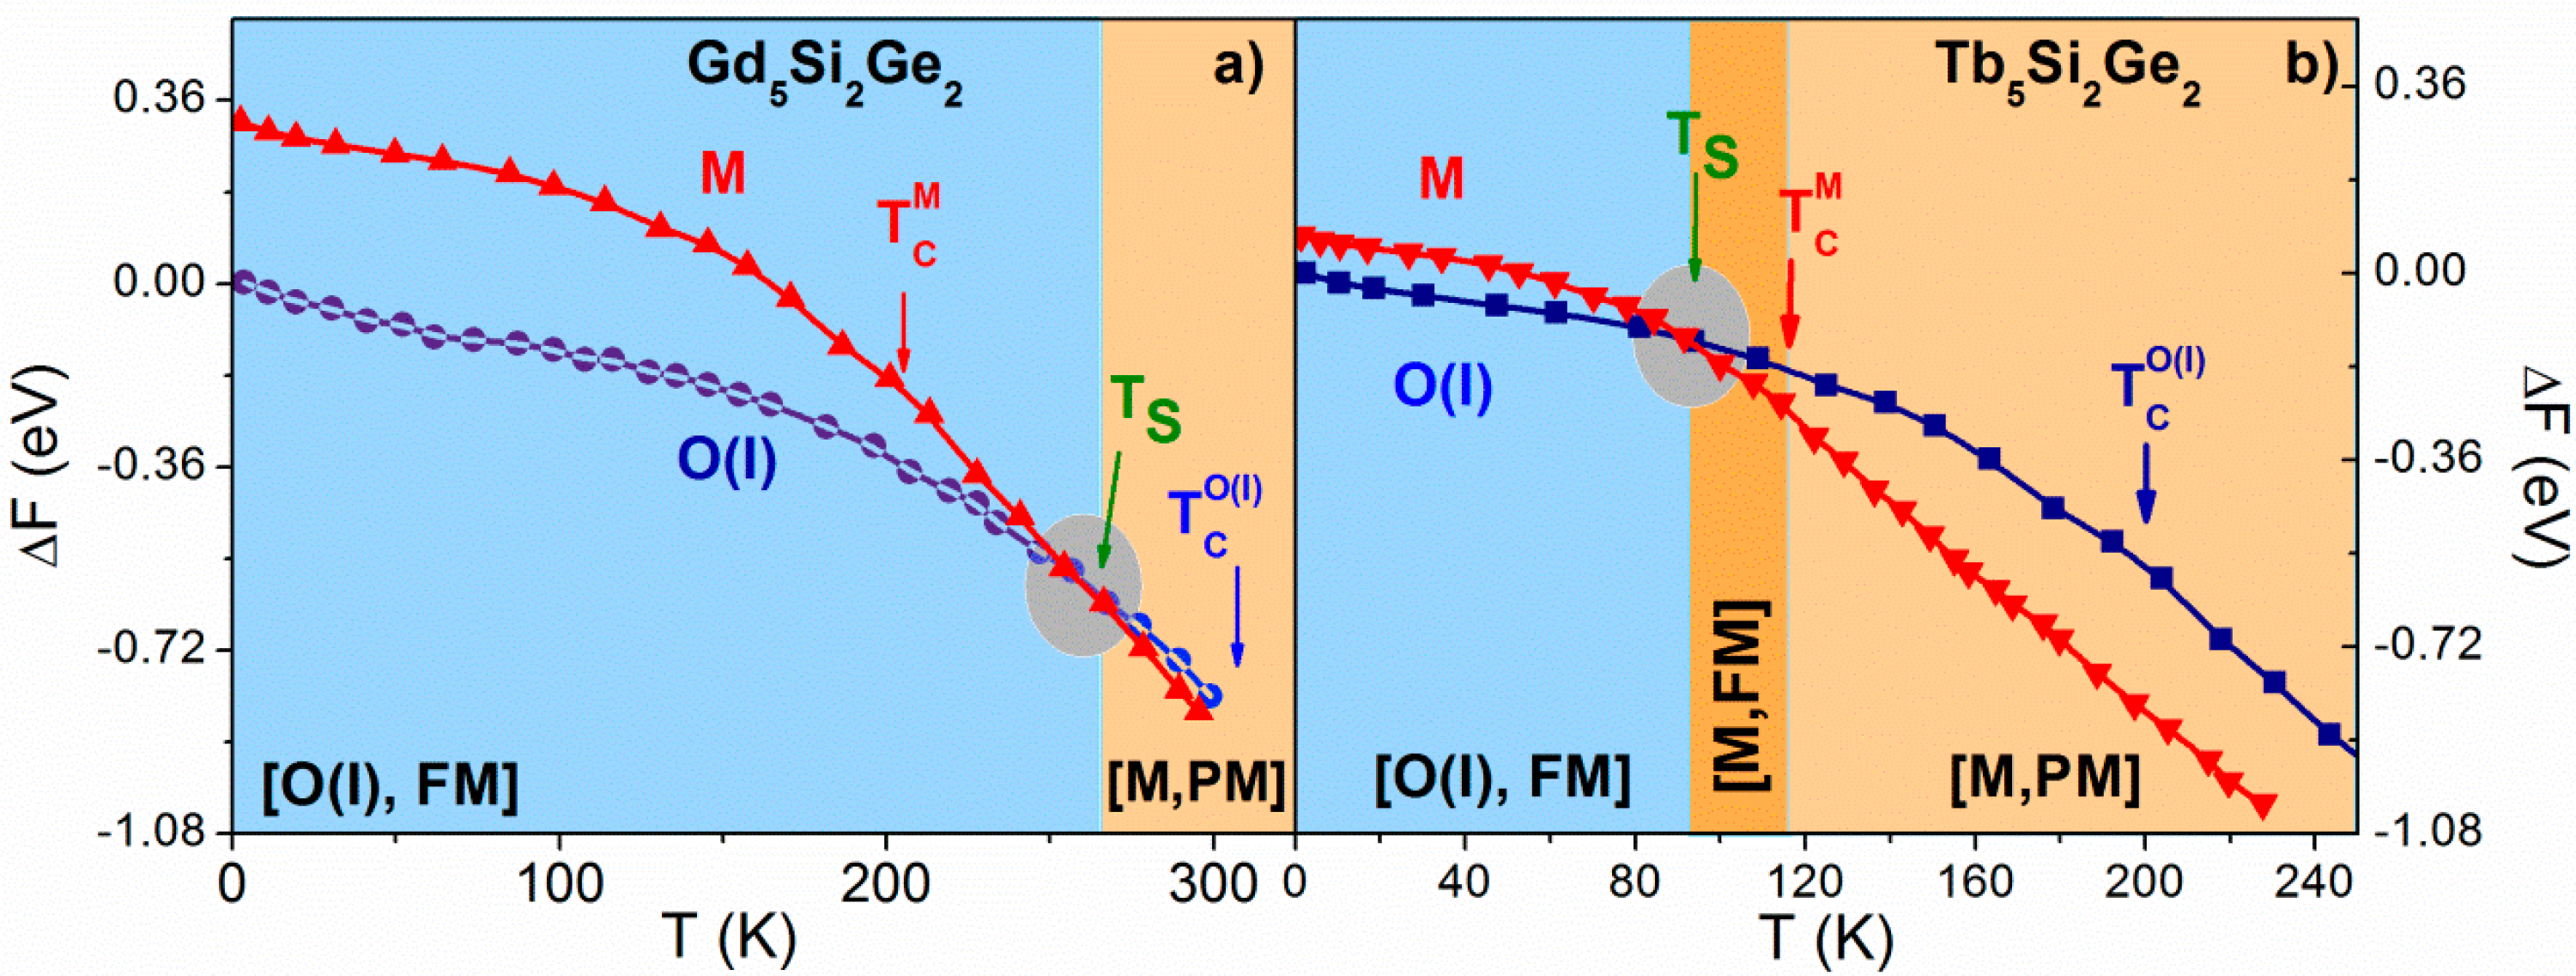
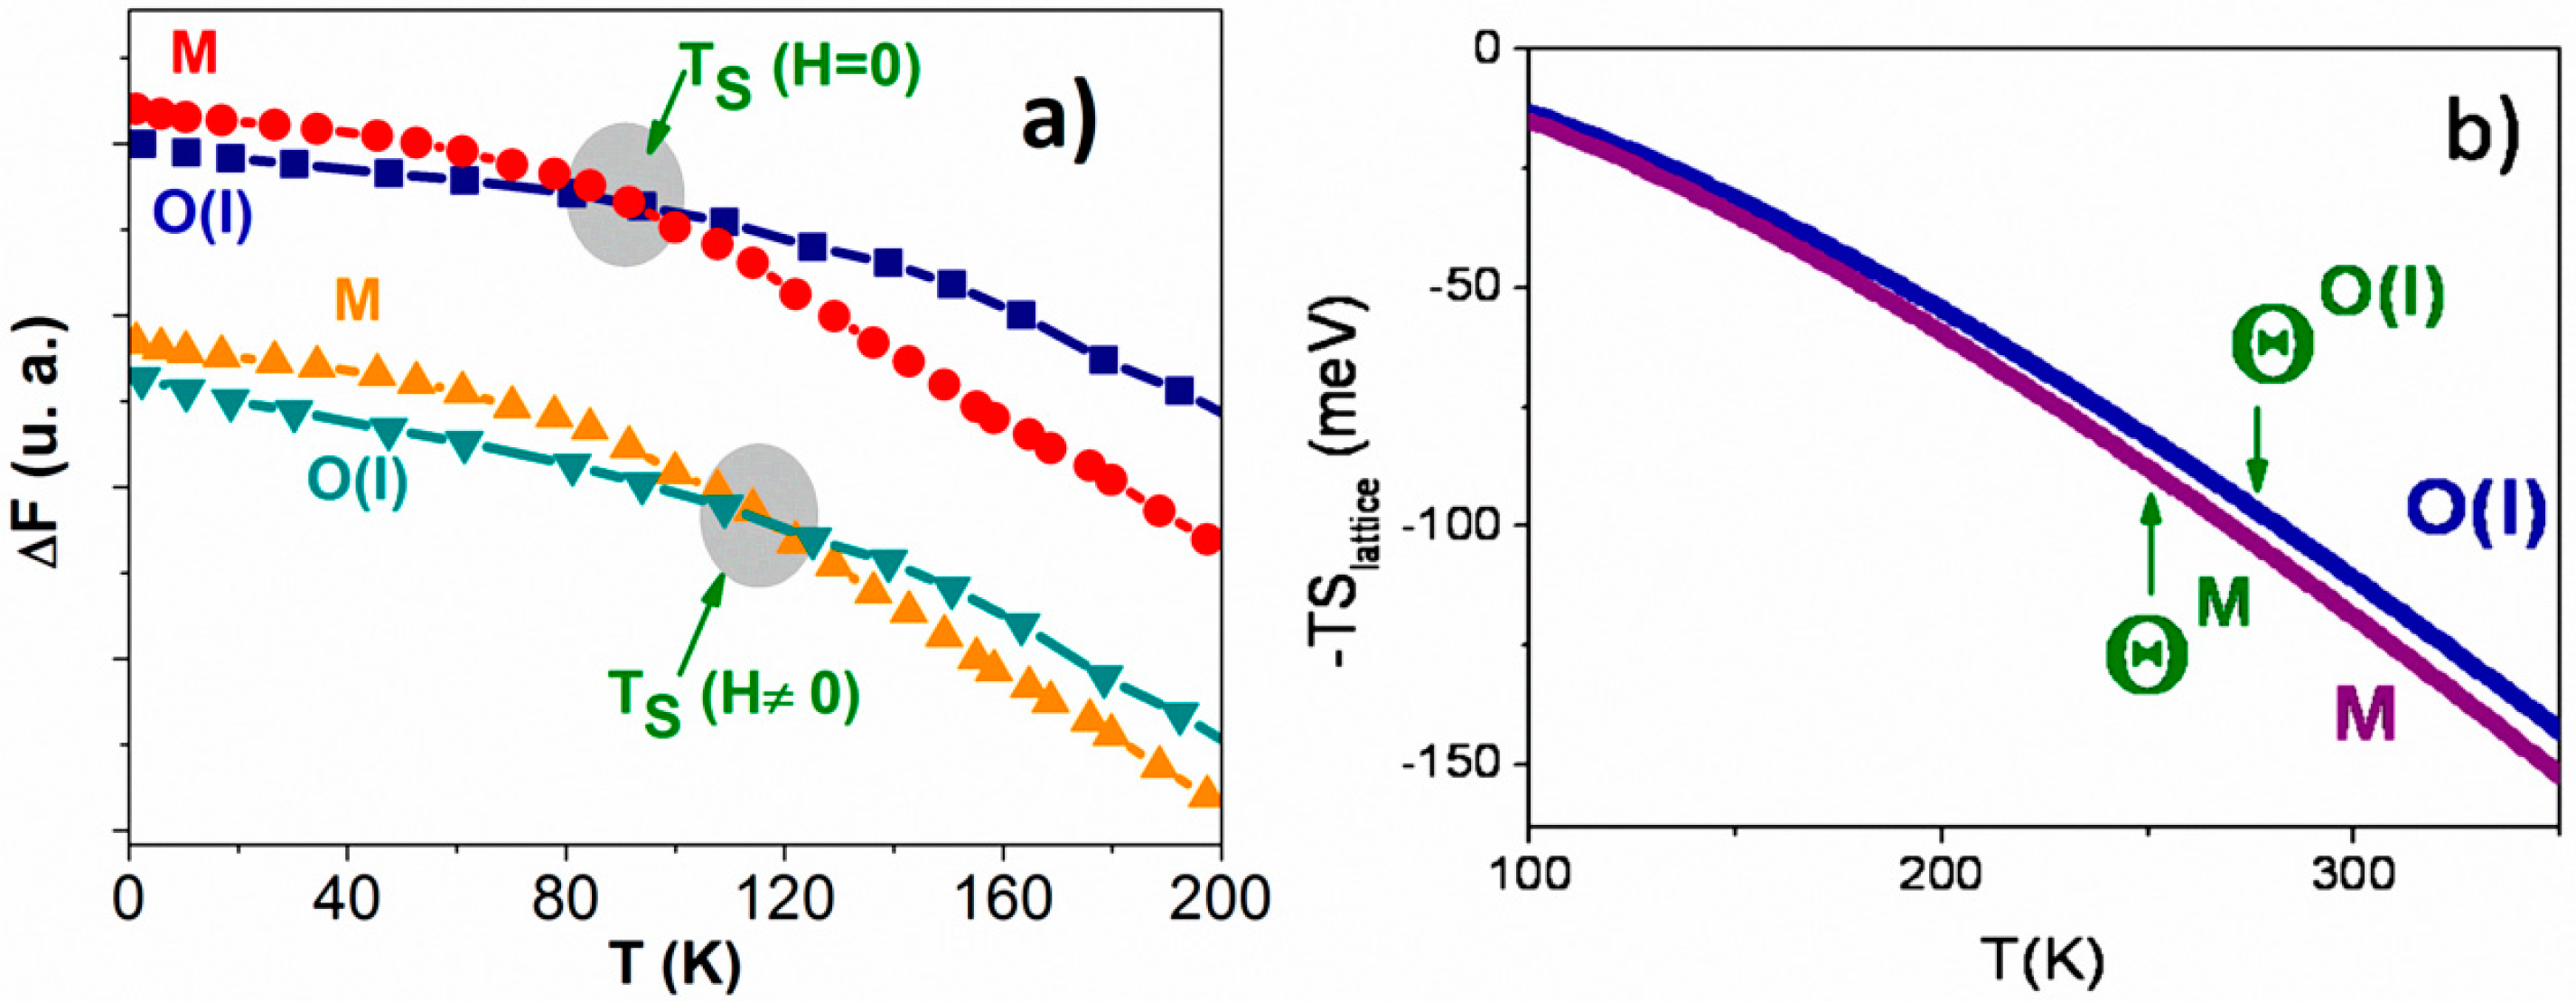
2.3. Free Energy Crossings of Real Systems
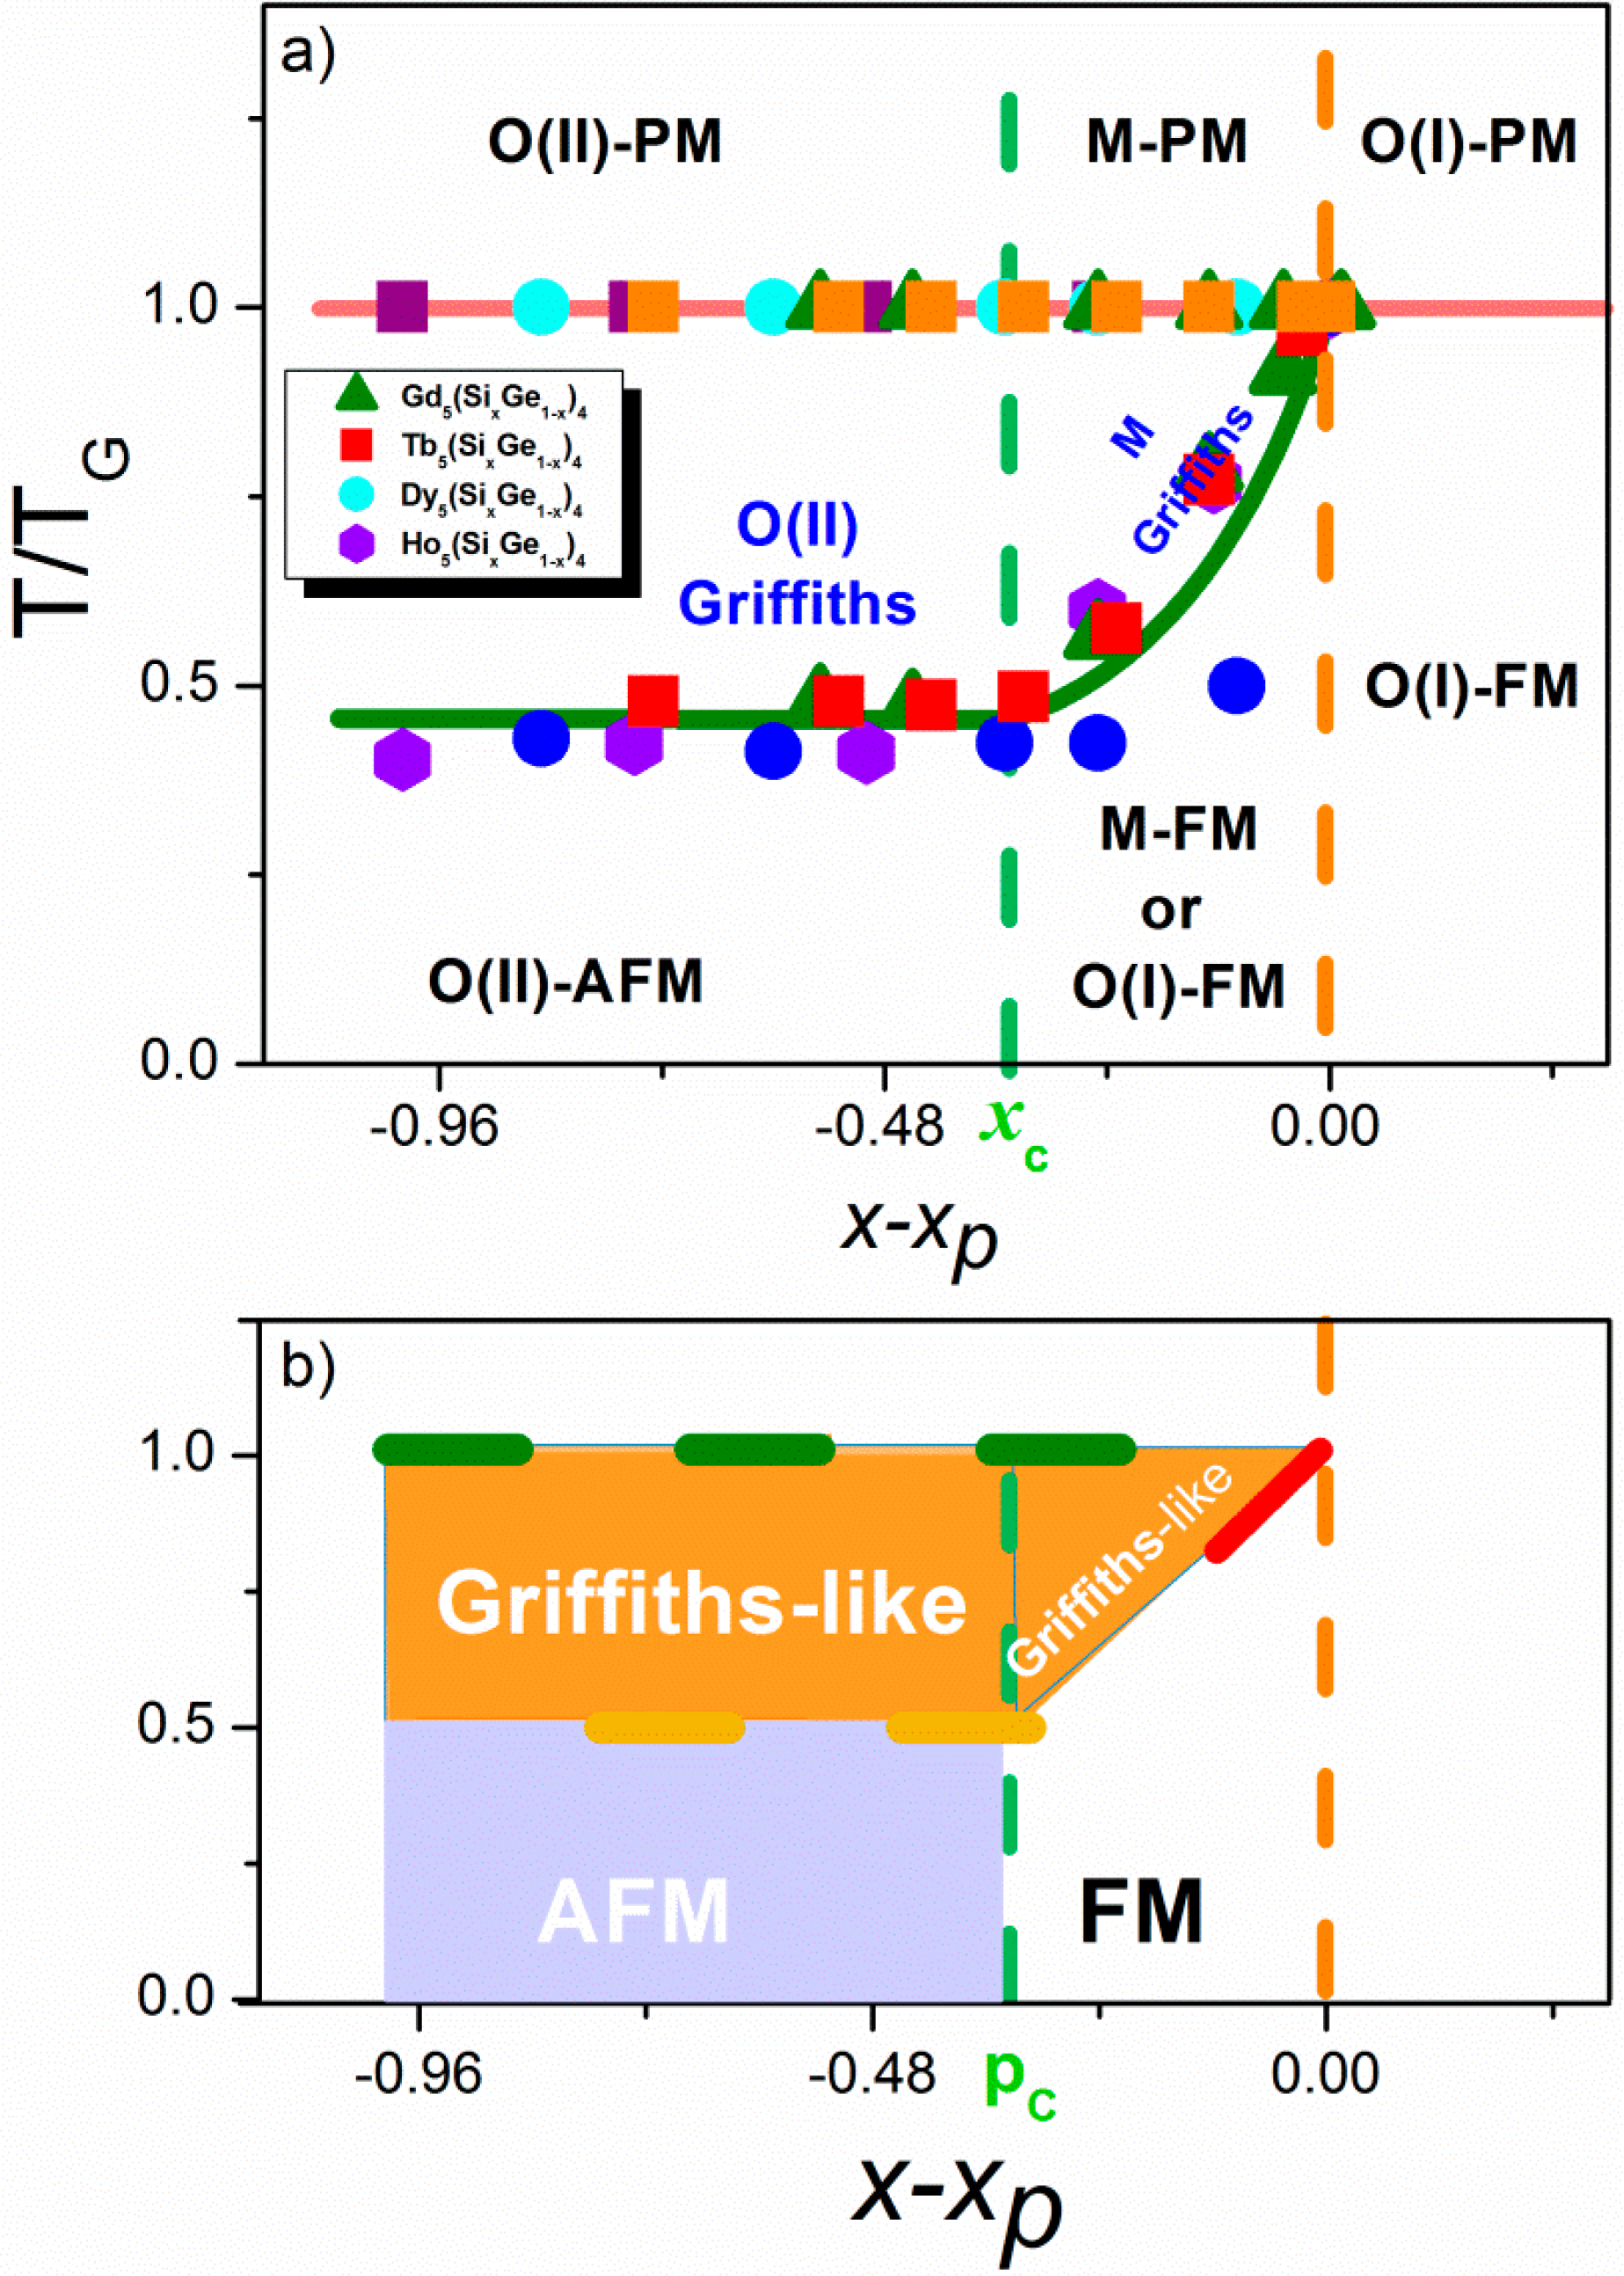
3. Is the Griffiths-like Phase a Requisite for a Giant Magnetocaloric Effect?
4. Conclusions
Acknowledgments
Author Contributions
Conflicts of Interest
References
- Miller, G.J. Complex rare-earth tetrelides, RE5(SixGe(1−x))4: New materials for magnetic refrigeration and a superb playground for solid state chemistry. Chem. Soc. Rev 2006, 35, 799–813. [Google Scholar]
- Smith, A. Who discovered the magnetocaloric effect? Eur. Phys. J. H 2013, 38, 507–517. [Google Scholar]
- Gschneidner, K.A., Jr.; Pecharsky, V.K.; Tsokol, A.O. Recent developments in magnetocaloric materials. Rep. Prog. Phys 2005, 68, 1479–1539. [Google Scholar]
- Giauque, W.; MacDougall, D. Attainment of Temperatures Below 1° Absolute by Demagnetization of Gd2(SO4)3·8H2O. Phys. Rev 1933, 43, 768–768. [Google Scholar]
- Brown, G.V. Magnetic heat pumping near room temperature. J. Appl. Phys 1976, 47, 3673. [Google Scholar]
- Gschneidner, K.A.; Pecharsky, V.K. Thirty years of near room temperature magnetic cooling: Where we are today and future prospects. Int. J. Refrig 2008, 31, 945–961. [Google Scholar]
- Brown, D.R.; Dirks, J.A.; Fernandez, N.; Stout, T.B. The Prospects of Alternatives to Vapor Compression Technology for Space Cooling and Food Refrigeration Applications. Energ. Eng 2012, 109, 7–20. [Google Scholar]
- Pecharsky, V.K.; Gschneidner, K.A. Giant Magnetocaloric Effect in Gd5(Si2Ge2). Phys. Rev. Lett 1997, 78, 3–6. [Google Scholar]
- Morellon, L.; Algarabel, P.A.; Ibarra, M.R.; Blasco, J.; Garcia-Landa, B.; Arnold, Z.; Albertini, F. Magnetic-field-induced structural phase transition in Gd5(Si1.8Ge2.2). Phys. Rev. B 1998, 58, 721–724. [Google Scholar]
- Pecharsky, V.K.; Holm, A.P.; Gschneidner, K.A.; Rink, R. Massive Magnetic-Field-Induced Structural Transformation in Gd5Ge4 and the Nature of the Giant Magnetocaloric Effect. Phys. Rev. Lett 2003, 91, 197204. [Google Scholar]
- Pasquale, M.; Sasso, C.; Lewis, L.; Giudici, L.; Lograsso, T.; Schlagel, D. Magnetostructural transition and magnetocaloric effect in Ni55Mn20Ga25 single crystals. Phys. Rev. B 2005, 72, 094435. [Google Scholar]
- Liu, J.; Gottschall, T.; Skokov, K.P.; Moore, J.D.; Gutfleisch, O. Giant magnetocaloric effect driven by structural transitions. Nat. Mater 2012, 11, 620–626. [Google Scholar]
- Trung, N.T.; Zhang, L.; Caron, L.; Buschow, K.H.J.; Brück, E. Giant magnetocaloric effects by tailoring the phase transitions. Appl. Phys. Lett 2010, 96, 172504. [Google Scholar]
- Trung, N.T.; Ou, Z.Q.; Gortenmulder, T.J.; Tegus, O.; Buschow, K.H.J.; Brück, E. Tunable thermal hysteresis in MnFe(P,Ge) compounds. Appl. Phys. Lett 2009, 94, 102513. [Google Scholar]
- Wada, H.; Tanabe, Y. Giant magnetocaloric effect of MnAs1−xSbx. Appl. Phys. Lett 2001, 79, 3302. [Google Scholar]
- Shen, B.G.; Sun, J.R.; Hu, F.X.; Zhang, H.W.; Cheng, Z.H. Recent Progress in Exploring Magnetocaloric Materials. Adv. Mater 2009, 21, 4545–4564. [Google Scholar]
- Lyubina, J.; Nenkov, K.; Schultz, L.; Gutfleisch, O. Multiple Metamagnetic Transitions in the Magnetic Refrigerant La(Fe,Si)13Hx. Phys. Rev. Lett 2008, 101, 177203. [Google Scholar]
- Ibarra, M.R.; Algarabel, P.A.; Marquina, C.; Blasco, J.; García, J. Large Magnetovolume Effect in Yttrium Doped La-Ca-Mn-O Perovskite. Phys. Rev. Lett 1995, 75, 3541–3544. [Google Scholar]
- Hadimani, R.L.; Bartlett, P.A.; Melikhov, Y.; Snyder, J.E.; Jiles, D.C. Field and temperature induced colossal strain in Gd5(SixGe1−x)4. J. Magn. Magn. Mater 2011, 323, 532–534. [Google Scholar]
- Morellon, L.; Stankiewicz, J.; García-Landa, B.; Algarabel, P.A.; Ibarra, M.R. Giant magnetoresistance near the magnetostructural transition in Gd5Si1.8Ge2.2. Appl. Phys. Lett 1998, 73, 3462–3464. [Google Scholar]
- Pecharsky, V.K.; Gschneidner, K.A.; Mudryk, Y.; Paudyal, D. Making the most of the magnetic and lattice entropy changes. J. Magn. Magn. Mater 2009, 321, 3541–3547. [Google Scholar]
- Pecharsky, V.K.; Gschneidner, K.A., Jr. Gd5(SixGe1−x)4: An Extremum Material. Adv. Mater 2001, 13, 683–686. [Google Scholar]
- Belo, J.H.; Pereira, A.M.; Araújo, J.P.; de la Cruz, C.; dos Santos, A.M.; Gonçalves, J.N.; Amaral, V.S.; Morellon, L.; Ibarra, M.R.; Algarabel, P.A.; et al. Tailoring the magnetism of Tb5Si2Ge2 compounds by La substitution. Phys. Rev. B 2012, 86, 014403. [Google Scholar]
- Morellon, L.; Arnold, Z.; Magen, C.; Ritter, C.; Prokhnenko, O.; Skorokhod, Y.; Algarabel, P.A.; Ibarra, M.R.; Kamarad, J. Pressure Enhancement of the Giant Magnetocaloric Effect in Tb5Si2Ge2. Phys. Rev. Lett 2004, 93, 137201. [Google Scholar]
- Paudyal, D.; Pecharsky, V.; Gschneidner, K.; Harmon, B. Electron correlation effects on the magnetostructural transition and magnetocaloric effect in Gd5Si2Ge2. Phys. Rev. B 2006, 73, 144406. [Google Scholar]
- Paudyal, D.; Mudryk, Y.; Pecharsky, V.K.; Gschneidner, K.A. Electronic structure, magnetic properties, and magnetostructural transition in Tb5Si2.2Ge1.8 from first principles. Phys. Rev. B 2011, 84, 014421. [Google Scholar]
- Pereira, A.M.; Kampert, E.; Moreira, J.M.; Zeitler, U.; Belo, J.H.; Magen, C.; Algarabel, P.A.; Morellon, L.; Ibarra, M.R.; Gonçalves, J.N.; et al. Unveiling the (De)coupling of magnetostructural transition nature in magnetocaloric R5Si2Ge2 (R = Tb, Gd) materials. Appl. Phys. Lett 2011, 99, 132510. [Google Scholar]
- Mudryk, Y.; Paudyal, D.; Pecharsky, V.K.; Gschneidner, K.A.; Misra, S.; Miller, G.J. Controlling Magnetism of a Complex Metallic System Using Atomic Individualism. Phys. Rev. Lett 2010, 105, 066401. [Google Scholar]
- Morellon, L.; Ritter, C.; Magen, C.; Algarabel, P.; Ibarra, M. Magnetic-martensitic transition of Tb5Si2Ge2 studied with neutron powder diffraction. Phys. Rev. B 2003, 68, 024417. [Google Scholar]
- Morellon, L.; Blasco, J.; Algarabel, P.A.; Ibarra, M.R. Nature of the first-order antiferromagnetic-ferromagnetic transition in the Ge-rich magnetocaloric compounds Gd5(SixGe1−x)4. Phys. Rev. B 2000, 62, 1022–1026. [Google Scholar]
- Levin, E.M.; Pecharsky, V.K.; Gschneidner, K.A. Unusual Magnetic Behavior in Gd5(Si1.5Ge2.5) and Gd5(Si2Ge2). Phys. Rev. B 2000, 62, 625–628. [Google Scholar]
- Casanova, F.; Batlle, X.; Labarta, A.; Marcos, J.; Mañosa, L.; Planes, A. Entropy change and magnetocaloric effect in Gd5(SixGe1−x)4. Phys. Rev. B 2002, 66, 100401. [Google Scholar]
- Magen, C.; Algarabel, P.A.; Morellon, L.; Araújo, J.P.; Ritter, C.; Ibarra, M.R.; Pereira, A.M.; Sousa, J.B. Observation of a Griffiths-like Phase in the Magnetocaloric Compound Tb5Si2Ge2. Phys. Rev. Lett 2006, 96, 167201. [Google Scholar]
- Arrott, A. Criterion for Ferromagnetism from Observations of Magnetic Isotherms. Phys. Rev 1957, 261, 2–4. [Google Scholar]
- Hadimani, R.L.; Melikhov, Y.; Schlagel, D.L.; Lograsso, T.A.; Jiles, D.C. Study of the Second-Order “Hidden” Phase Transition of the Monoclinic Phase in the Mixed Phase Region of Gd5(SixGe1−x)4. IEEE Trans. Magn 2012, 48, 4070–4073. [Google Scholar]
- Hadimani, R.L.; Melikhov, Y.; Snyder, J.E.; Jiles, D.C. Estimation of second order phase transition temperature of the orthorhombic phase of Gd5(SixGe1−x)4 using Arrott plots. J. Appl. Phys 2008, 103, 033906. [Google Scholar]
- Pereira, A.M.; dos Santos, A.M.; Magen, C.; Sousa, J.B.; Algarabel, P.A.; Ren, Y.; Ritter, C.; Morellon, L.; Ibarra, M.R.; Araújo, J.P. Understanding the role played by Fe on the tuning of magnetocaloric effect in Tb5Si2Ge2. Appl. Phys. Lett 2011, 98, 122501. [Google Scholar]
- Provenzano, V.; Shapiro, A.J.; Shull, R.D. Reduction of hysteresis losses in the magnetic refrigerant Gd5Ge2Si2 by the addition of iron. Nature 2004, 429, 853–857. [Google Scholar]
- Carvalho, A.M.G.; Alves, C.S.; de Campos, A.; Coelho, A.A.; Gama, S.; Gandra, F.C.G.; von Ranke, P.J.; Oliveira, N.A. The magnetic and magnetocaloric properties of Gd5Ge2Si2 compound under hydrostatic pressure. J. Appl. Phys 2005, 97. [Google Scholar] [CrossRef]
- Liu, G.J.; Sun, J.R.; Lin, J.; Xie, Y.W.; Zhao, T.Y.; Zhang, H.W.; Shen, B.G. Entropy changes due to the first-order phase transition in the Gd5SixGe4−x system. Appl. Phys. Lett 2006, 88, 212505. [Google Scholar]
- Gschneidner, K.A.; Mudryk, Y.; Pecharsky, V.K. On the nature of the magnetocaloric effect of the first-order magnetostructural transition. Scr. Mater 2012, 67, 572–577. [Google Scholar]
- Svitelskiy, O.; Suslov, A.; Schlagel, D.; Lograsso, T.; Gschneidner, K.; Pecharsky, V. Elastic properties of Gd5Si2Ge2 studied with an ultrasonic pulse-echo technique. Phys. Rev. B 2006, 74, 184105. [Google Scholar]
- Pecharsky, A.; Gschneidner, K.; Pecharsky, V.; Schlagel, D.; Lograsso, T. Phase relationships and structural, magnetic, and thermodynamic properties of alloys in the pseudobinary Er5Si4-Er5Ge4 system. Phys. Rev. B 2004, 70, 144419. [Google Scholar]
- Pecharsky, A.O.; Pecharsky, V.K.; Gschneidner, K.A. Phase relationships and low temperature heat capacities of alloys in the Y5Si4–Y5Ge4 pseudo binary system. J. Alloy. Compd 2004, 379, 127–134. [Google Scholar]
- Belo, J.H.; Amaral, J.S.; Pereira, A.M.; Amaral, V.S.; Araujo, J.P. On the Curie temperature dependency of the magnetocaloric effect. Appl. Phys. Lett 2012, 242407, 3–6. [Google Scholar]
- Griffiths, R.B. Nonanalytic Behavior Above the Critical Point in a Random Ising Ferromagnet. Phys. Rev. Lett 1969, 23, 17–19. [Google Scholar]
- Bray, A. Nature of the Griffiths phase. Phys. Rev. Lett 1987, 59, 586–589. [Google Scholar]
- Zou, J.D.; Liu, J.; Mudryk, Y.; Pecharsky, V.K.; Gschneidner, K.A. Ferromagnetic ordering and Griffiths-like phase behavior in Gd5Ge3.9Al0.1. J. Appl. Phys 2013, 114, 063904. [Google Scholar]
- Ouyang, Z.W. Griffiths-like behavior in Ge-rich magnetocaloric compounds Gd5(SixGe1−x)4. J. Appl. Phys 2010, 108, 033907. [Google Scholar]
- Pereira, A.M.; Morellon, L.; Magen, C.; Ventura, J.; Algarabel, P.A.; Ibarra, M.R.; Sousa, J.B.; Araújo, J.P. Griffiths-like phase of magnetocaloric R5(SixGe1−x)4 (R = Gd, Tb, Dy, and Ho). Phys. Rev. B 2010, 82, 172406. [Google Scholar]
- Turcaud, J.A.; Pereira, A.M.; Sandeman, K.G.; Amaral, J.S.; Morrison, K.; Berenov, A.; Daoud-Aladine, A.; Cohen, L.F. Spontaneous magnetization above Tc in La0.7Ca0.3MnO3 and La0.7Ba0.3MnO3 polycrystalline materials. Phys. Rev. B 2014, in press.. [Google Scholar]
- Burgy, J.; Mayr, M.; Martin-Mayor, V.; Moreo, A.; Dagotto, E. Colossal Effects in Transition Metal Oxides Caused by Intrinsic Inhomogeneities. Phys. Rev. Lett 2001, 87, 277202. [Google Scholar]
- Oliveira, G.N.P.; Pereira, A.M.; Lopes, A.M.L.; Amaral, J.S.; dos Santos, A.M.; Ren, Y.; Mendonça, T.M.; Sousa, C.T.; Amaral, V.S.; Correia, J.G.; et al. Dynamic off-centering of Cr3+ ions and short-range magneto-electric clusters in CdCr2S4. Phys. Rev. B 2012, 86, 224418. [Google Scholar]
- Michelmann, M.; Moshnyaga, V.; Samwer, K. Colossal magnetoelastic effects at the phase transition of (La0.6Pr0.4)0.7Ca0.3MnO3. Phys. Rev. B 2012, 85, 014424. [Google Scholar]
- Guo, S.; Young, D.; Macaluso, R.; Browne, D.; Henderson, N.; Chan, J.; Henry, L.; DiTusa, J. Discovery of the Griffiths Phase in the Itinerant Magnetic Semiconductor Fe1−xCoxS2. Phys. Rev. Lett 2008, 100, 017209. [Google Scholar]


© 2014 by the authors; licensee MDPI, Basel, Switzerland This article is an open access article distributed under the terms and conditions of the Creative Commons Attribution license (http://creativecommons.org/licenses/by/3.0/).
Share and Cite
Pires, A.L.; Belo, J.H.; Lopes, A.M.L.; Gomes, I.T.; Morellón, L.; Magen, C.; Algarabel, P.A.; Ibarra, M.R.; Pereira, A.M.; Araújo, J.P. Phase Competitions behind the Giant Magnetic Entropy Variation: Gd5Si2Ge2 and Tb5Si2Ge2 Case Studies. Entropy 2014, 16, 3813-3831. https://doi.org/10.3390/e16073813
Pires AL, Belo JH, Lopes AML, Gomes IT, Morellón L, Magen C, Algarabel PA, Ibarra MR, Pereira AM, Araújo JP. Phase Competitions behind the Giant Magnetic Entropy Variation: Gd5Si2Ge2 and Tb5Si2Ge2 Case Studies. Entropy. 2014; 16(7):3813-3831. https://doi.org/10.3390/e16073813
Chicago/Turabian StylePires, Ana Lúcia, João Horta Belo, Armandina Maria Lima Lopes, Isabel T. Gomes, Luis Morellón, Cesar Magen, Pedro Antonio Algarabel, Manuel Ricardo Ibarra, André Miguel Pereira, and João Pedro Araújo. 2014. "Phase Competitions behind the Giant Magnetic Entropy Variation: Gd5Si2Ge2 and Tb5Si2Ge2 Case Studies" Entropy 16, no. 7: 3813-3831. https://doi.org/10.3390/e16073813
APA StylePires, A. L., Belo, J. H., Lopes, A. M. L., Gomes, I. T., Morellón, L., Magen, C., Algarabel, P. A., Ibarra, M. R., Pereira, A. M., & Araújo, J. P. (2014). Phase Competitions behind the Giant Magnetic Entropy Variation: Gd5Si2Ge2 and Tb5Si2Ge2 Case Studies. Entropy, 16(7), 3813-3831. https://doi.org/10.3390/e16073813