1. Introduction
Image based diagnosis has been developed and widely used in medical fields for decades, according to some statistics, up until 2010, 5 billion medical imaging studies had been conducted worldwide [
1]. By analyzing a great deal of information yielded through imaging techniques such as X-ray Computerized Tomography (CT) and Magnetic Resonance Imaging (MRI), doctors reveal, diagnose, or examine disease for patients, examples including strokes [
2] and cancers [
3].
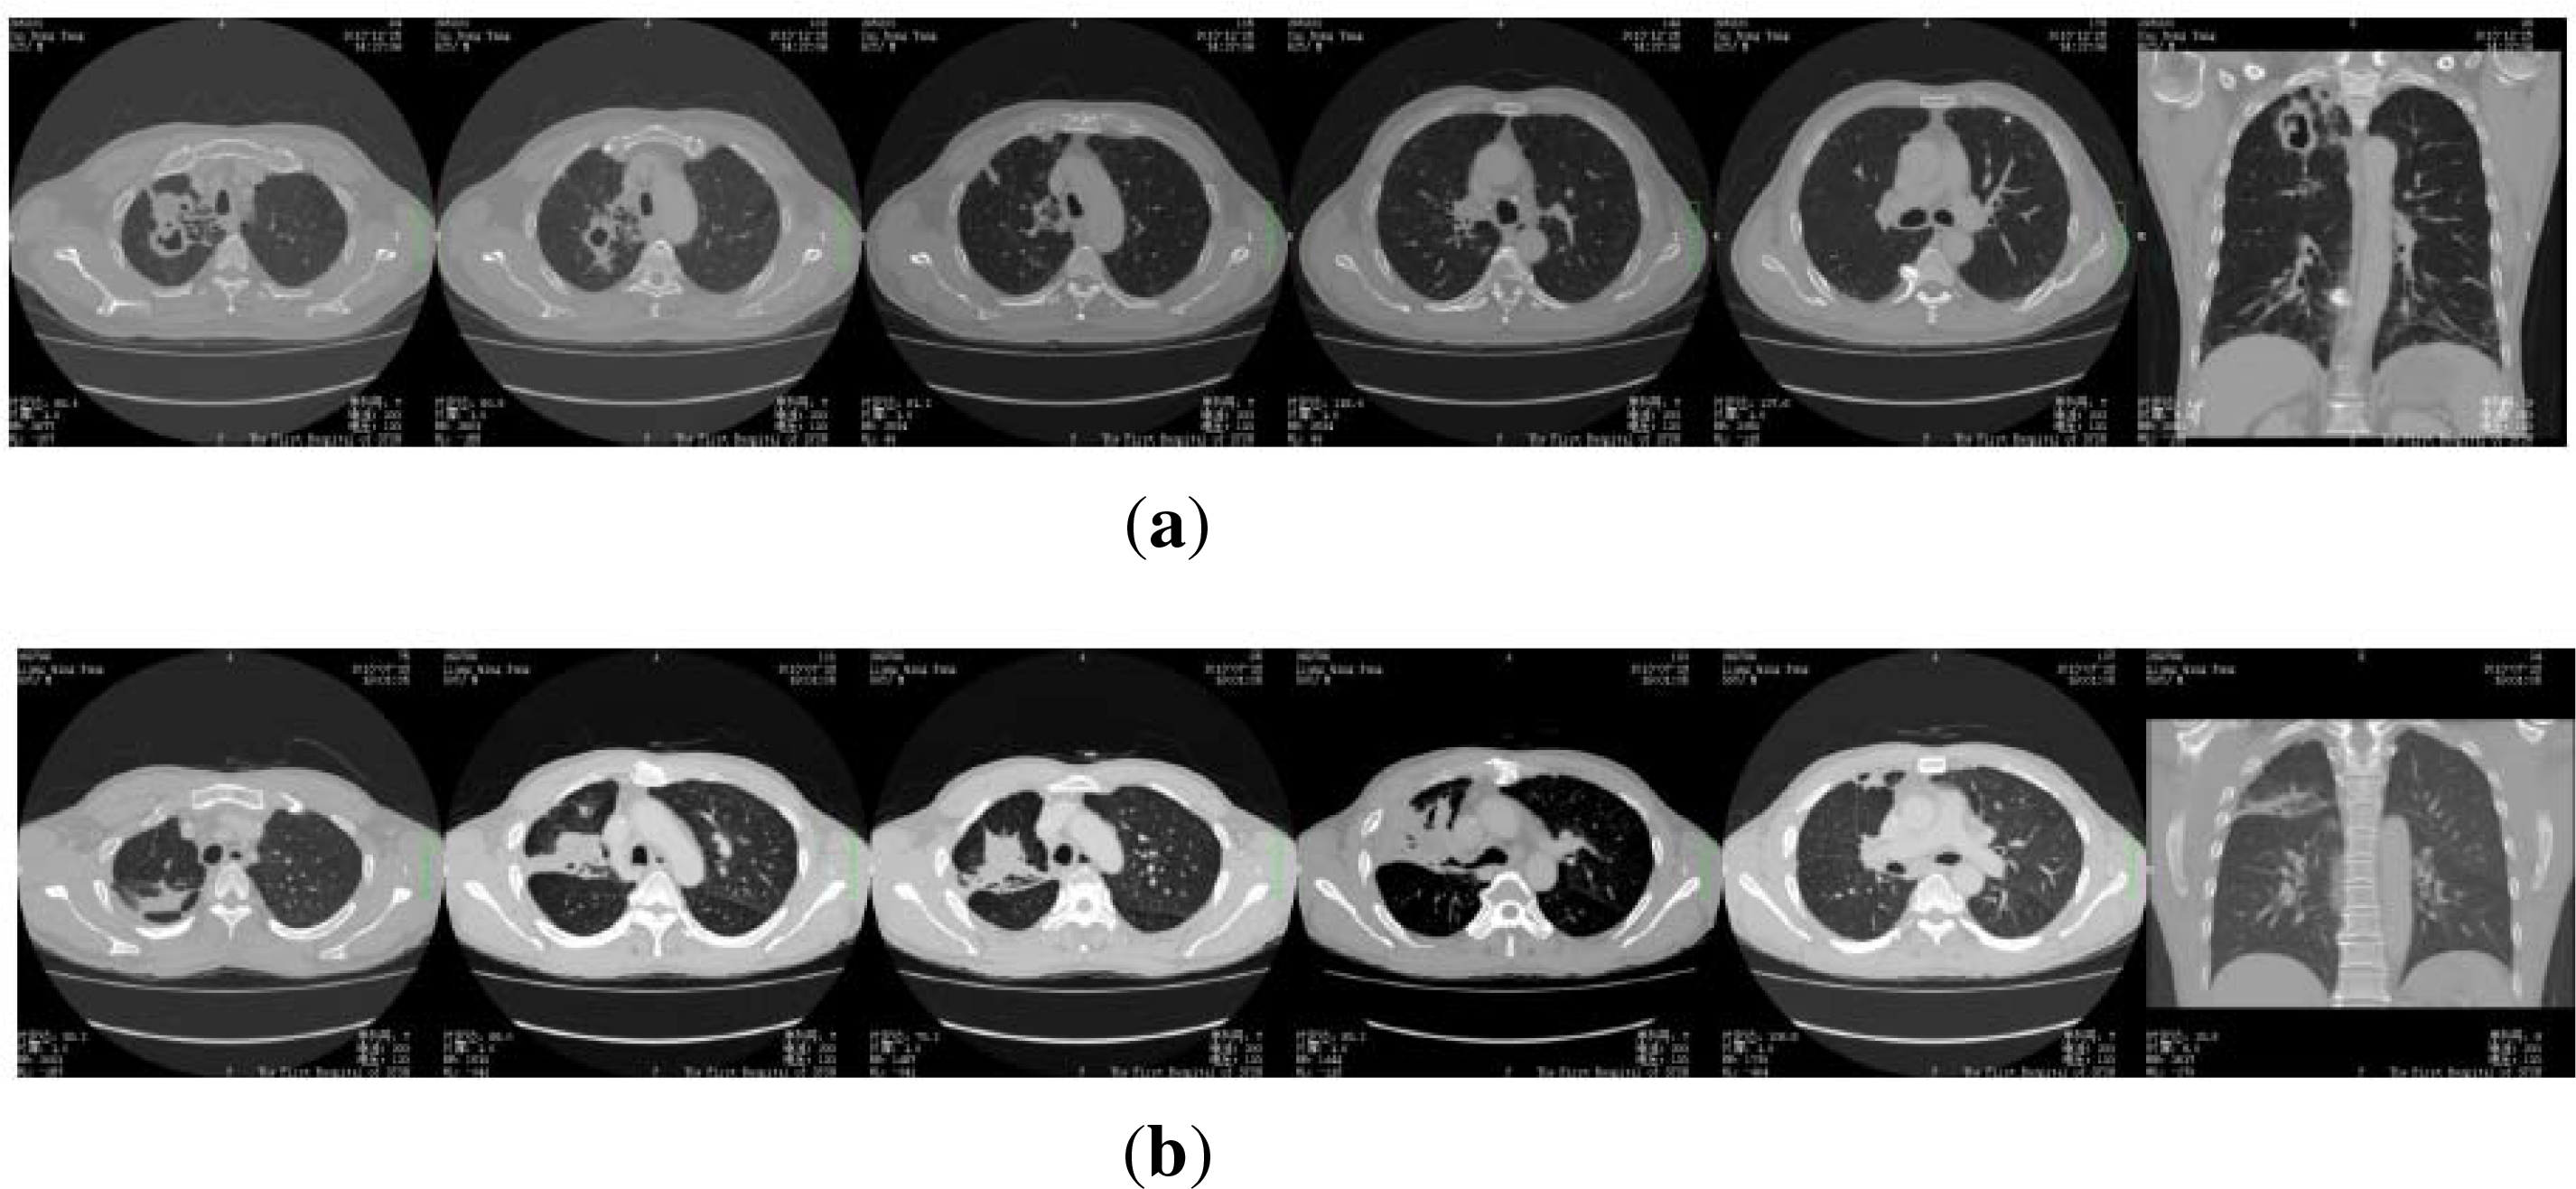
However, as well known, accurate analysis and interpretation of a medical image relies heavily on the knowledge and experience of experts. In cases of images that contain many details, the diagnosis process might become tedious and time consuming even for well-trained professionals. For illustration, let us study some CT images presented in
Figure 1, where the first row is from some lung cancer patients, and the second row is of the pulmonary abscess patients. We see the differences between the two rows of images are very subtle, so it is not easy to distinguish the two kinds of the patients from each other, even for some well educated junior doctors. For example, as mentioned below, we have recruited 13 graduate students to diagnose 50 patients according to their CT images, we find the result is far from optimistic: On average, every student only has 19 correct diagnoses.
Meanwhile, a brutal reality is true worldwide: well trained experts are rare. For example, according to some public reports, in China, until July of 2012, among the 1.3 billion population there were about 2 million doctors. In other words, the number of doctors per 1000 people was around 1.5. Although this is greater than 1.25, which is suggested as the lower bound by WHO (World Health Organization), only half of the doctor population holds a bachelor or higher degree in medicine. What is more, among the the total doctor population, the ratio of people with a master or higher degree is below 8%. In addition, because of various objective conditions such income and life, almost all the well-trained and experienced doctors gather in a very few highly developed cities of China, such as Beijing [
4], Shanghai [
5] and Guangzhou [
6]. Almost all of the other cities suffer from a severe shortage of high level doctors.
Because of the unbalanced distribution of the experts, for many hospitals, when they have patients who cannot be definitively diagnosed, they often need to ask for help from outside experts. This approach, despite the inefficiency and the extra cost, does not always work well, because the experts are often needed by their own business.
In the present article, we propose another attempt to approach the shortage of experts with respect to the context of medical image based diagnosis. Our basic idea is regarding the observation that what we lack are the
experts, but not the
general practitioners, so it is possible to release the experts from endless requests via making use of the general practitioners’s efforts. Our solution is the
crowdsourcing [
7] scheme, the details of which are presented in
Table 1.
At first glance, the procedure of
Table 1 looks very much like the expert consultation (ES) system. However, there are some fundamental differences between the two approaches: Firstly, the ES scheme often requires the participation of experts, while the crowdsourcing scheme only needs the general practitioners (but of course, experts are welcome.). Secondly, in the ES scheme, all the experts usually take part in the diagnosis together and achieve the unique conclusion in the end. In the crowdsourcing scheme, every doctor works independently and the final judgement is derived by some algorithm that takes the all doctors’ conclusions as input.
Our contribution is three fold, the summarization is as follows:
- (1)
We propose the crowdsourcing based diagnosis paradigm;
- (2)
We present a statistical consistency based learning algorithm, which ensembles all the doctors’ diagnosis conclusions and derived the final decision;
- (3)
We evaluate the proposed approach with the synthetic and real data.
The remainder of the paper is organized as follows. Section 2 discusses the related works on crowdsourcing; Section 3 describes a real medical image based diagnosis results set that is used in the work; in Section 4, we present our crowdsourcing based diagnosis method; Section 5 is devoted to the experiments, and Section 6 is the conclusion.
2. Crowdsourcing
To the best of our knowledge, the term
crowdsourcing was first proposed by Jeff Howe as the composition of the terms “wisdom of crowds” and “outsourcing” [
8,
9]. In essence, crowdsourcing is one type of Human as a Service (HuaaS), where a group of (not necessary expert) people (or workers) are asked to do a task of that often needs professional background, such as natural language processing [
10], movie recommendation [
11], optical character recognition [
12], image classification [
13,
14] and dermatology research [
15]. One of the most famous crowdsourcing examples is
Wikipedia, where thousands of users contributes the creation of the world’s largest encyclopedia every day. And some other well known instances include the Amazon Mechanical Turk platform [
16], the the Galaxy Zoo project [
17] and the Click Worker project [
18].
Since most of the crowdsourcing contributors are not domain experts, so their working results are often of relatively low quality. Hence, naturally, a central concern of crowdsourcing is
How to combine the individuals’ works to derive high quality results. The approaches, roughly speaking, can be categorized into two classes: The first category is the data content independent (DCI) method, where the ensemble algorithm only takes the individuals’ conclusions as input and makes the final judgement. Among all the DCI methods, the most used one is the majority voting algorithm [
10], which suggests that for every item of the task, the ground truth is the one that is elected by the most workers. Despite its simplicity, the majority voting algorithm is well recognized as the most stable one among various crowdsourcing algorithms [
7,
19,
20], and achieves surprising success in many crowdsourcing applications. However, for the naive majority voting algorithm and its variations, almost all of them need every task to be done multiple times by different workers. This requirement, when the actual cost is taken into account, is infeasible in many real applications. Addressed to the shortage of the DCI methods, as the second category algorithm, the data content dependent (DCD) method is proposed. A typical DCD policy usually consists of two stages: In the first stage, it learns the behavior of the workers from their working results,
i.e., for every worker
wi, it treats the items worked by
wi along with the working results as the training data and learns the predictor to simulate the behavior of
wi, then applies the learned model to act as
wi to make predictions on the other items [
21,
22]. In the second stage, the algorithm ensembles the all working results (both of the workers’ results and the prediction results) and makes the final judgements. To avoid the undertraining problem, the DCD approach often requires every worker to have large enough working results.
3. Data
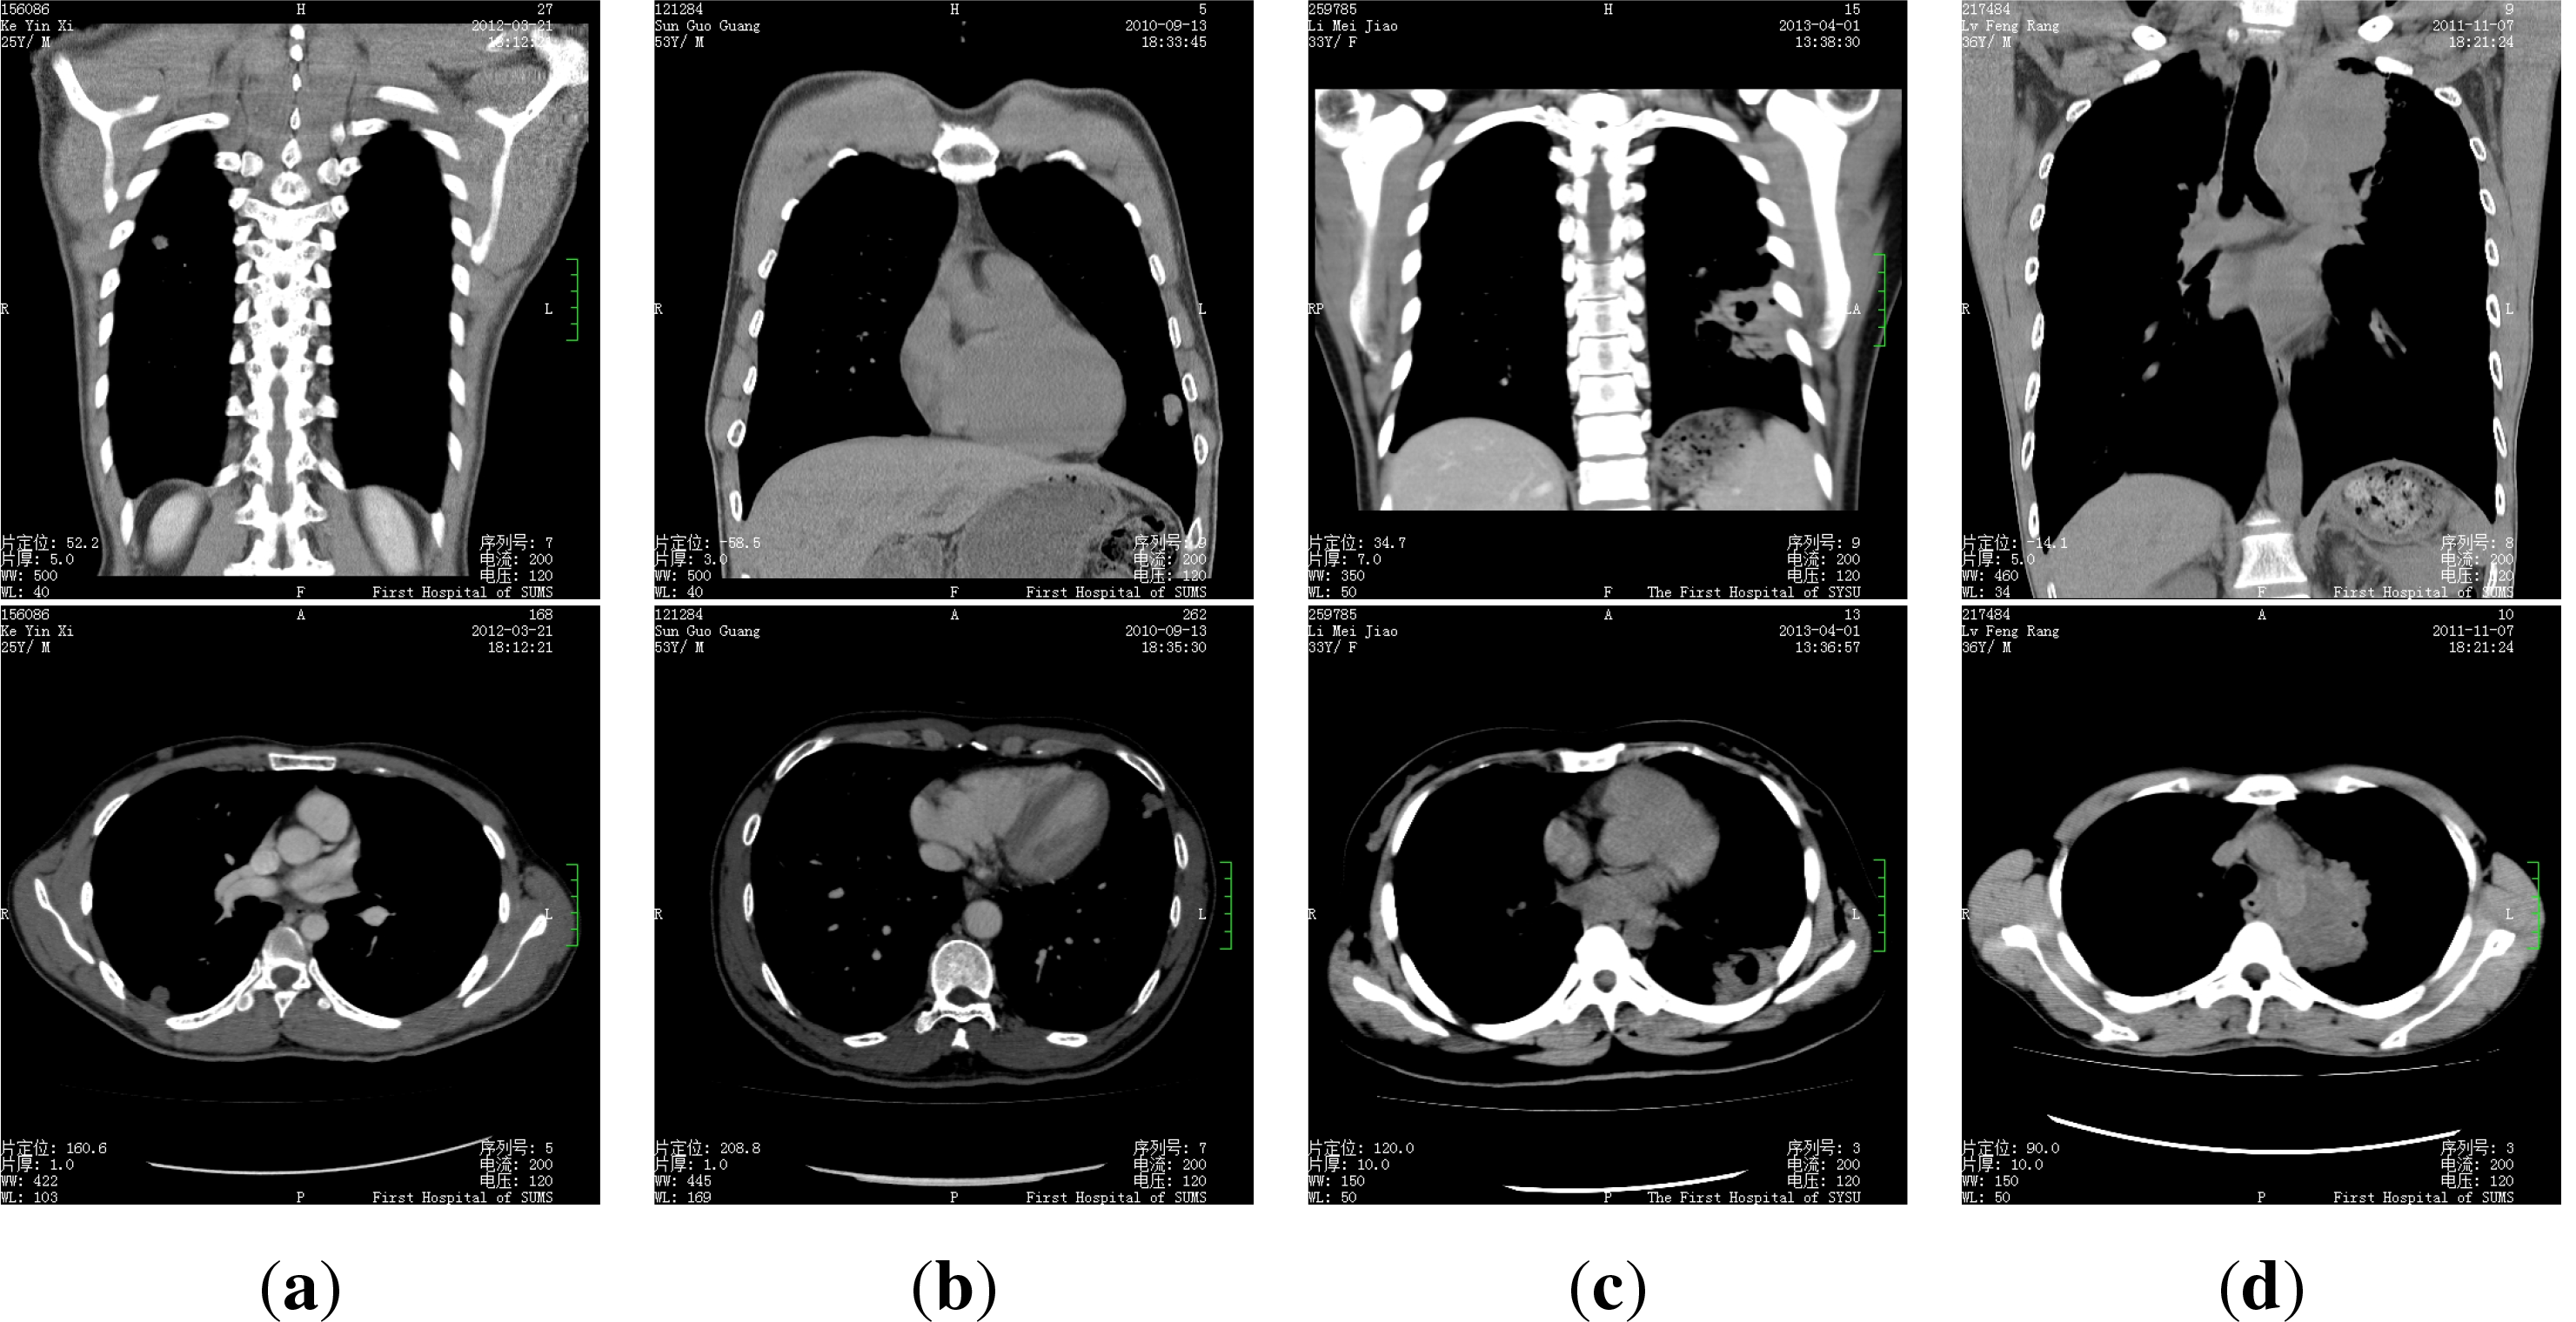
The dataset we use is composed of 50 patients’ CT medical images, for every patient there are 300–400 images. Every patient is in one of the four categories: pulmonary tuberculosis, lung cancer, pulmonary abscess and pulmonary metastasis, some samples of the images are presented in
Figure 2.
We recruit 13 volunteers to diagnose (or to label) the patients according to their images, all the volunteers are 2nd or 3rd year graduate students of the medical imaging major. We ask every student to make their diagnosis for every patient according to the images independently. The average accuracy of the volunteers is 39.54%, i.e., on average, every student only has 19 accurate diagnosis. Besides, the best volunteer achieved an accuracy of 50%, while the worst one only has a accuracy of 20%.
4. Method
In our problem, every worker only labels 50 patients, while for every patient there are more than 300 high resolution medical images, so it is easy to become trapped into the undertraining dilemma if we try to learn the worker’s behavior via their working results. As a result, we take the DCI policy to make diagnosis judgement.
Our idea is based on the statistical consistency of the patients’ diagnosis results: Denote the set of available doctors as {D1, D2,...,Dn}, the set of patients as {P1, P2, ..., Pm}, the set of possible illnesses (or, labels) as {I1, I2,..., Ik}. Let Si represent the set of diagnosis results of Pi (Throughout this paper, unlike conventional definitions, we allow a set to contain duplicate values.). We use 𝔇i to represent the distribution on Si. Specifically, we denote S0 = S1 ∪ S2 ∪ ...Sn, and 𝔇0 the distribution on S0. It is noteworthy that here we do not require the patients to be diagnosed by the all doctors, hence, the distributions 𝔇is are estimated only by the collected diagnosis data. For patient Pi, to determine which illness she has, our idea is to choose the one from 𝔗 which leads to the minimal changes to both the global distribution 𝔇0 and individual distribution 𝔇i.
4.1. Preliminaries
Throughout this paper we use upper case letters (e.g., X, Y, Z,...) to denote the random variables, and lower cases to represent the instances.
Our work is mainly based on Information Theory. Below we introduce some definitions and preliminary results used in this paper. Most of them can be found in [
23].
Let
be a distribution with
p(
X) as the probability density function (p.d.f) for
X ∼ , then
entropy of
X is defined as
Given a distribution
with
q(
X) as the p.d.f, we employ the Kullback–Leibler divergence to measure the distance between
and
, which is defined as
Our assumption of the proposed algorithm is as follows:
Assumption 1. For i ∈ {0, 1, 2,...,n}, the distribution 𝔇i is multinominal with probability {pi,1, pi,2, ..., pi,k}.
For every 0 ≤ i ≤ n, we use ni,j to denote the number of Ij in Si, let
, we have the following theorem:
Theorem 1.
Let,
,
be the solution to the following problemthen for j =1, 2,...,
k Proof of Theorem 1 According to Assumption (1),
Take logarithm on both sides of the equation above, we have
Noting that the term
is a constant and
Let
where
λ > 0 is fixed, then problem of
Equation (1) is equivalent to the following:
For
l =1, 2, ...,
k, let
we have
plug
Equation (7) into
Equation (5), we achieve
λ =
ni,0, hence we have the proof. □
4.2. Diagnosis with Crowdsourcing
Given the sets of the diagnosis results
S1,
S2, ...,
Sn, we pretend there is an extra
oracle doctor to make the final judgement for every patient. Denote the illness of
Pi given by the oracle as
Oi. For an arbitrary
X ∈ {
I1,
I2,...,
Ik}, noting that the distribution on
Si ∪{
X} will always differ from that on
Si, denote the distribution on
Si ∪{
X} as
, we assume
Oi is the one that most consistent with their existing diagnosis, or, formally,
Denote
Pri(
·) as the probability function of
𝔇i and
the function of
, noting that:
According to Theorem 1,
, hence, the last equation above is exactly the divergence
.
Now we seek the solution to
Equation (8), firstly, for
X =
Il(1 ≤
l ≤
k), we have
Noting that in
Equation (10), the term
is fixed, so
Since ln
Pri(
Si) is a constant, the target
Equation (8) is equivalent to the following:
where for
X =
Il,
In addition to
Equation (8), it’s noteworthy that the introduction of
Oi will also lead to changes to the global distribution 𝔇
0, these changes, should be as small as possible, too. Therefore, similar to
Equation (8), we have:
where we use
to denote the distribution on 𝔇
0 ∪ {
Oi}.
Denote
Pr0(
·) as the probability function of 𝔇
0 and
the function of
, analog to the procedure above, we also have:
where for
X =
Il,
With
Equations (16) and
(19), we have the final decision target:
where
λ > 0 is the tradeoff factor,
4.3. Algorithm
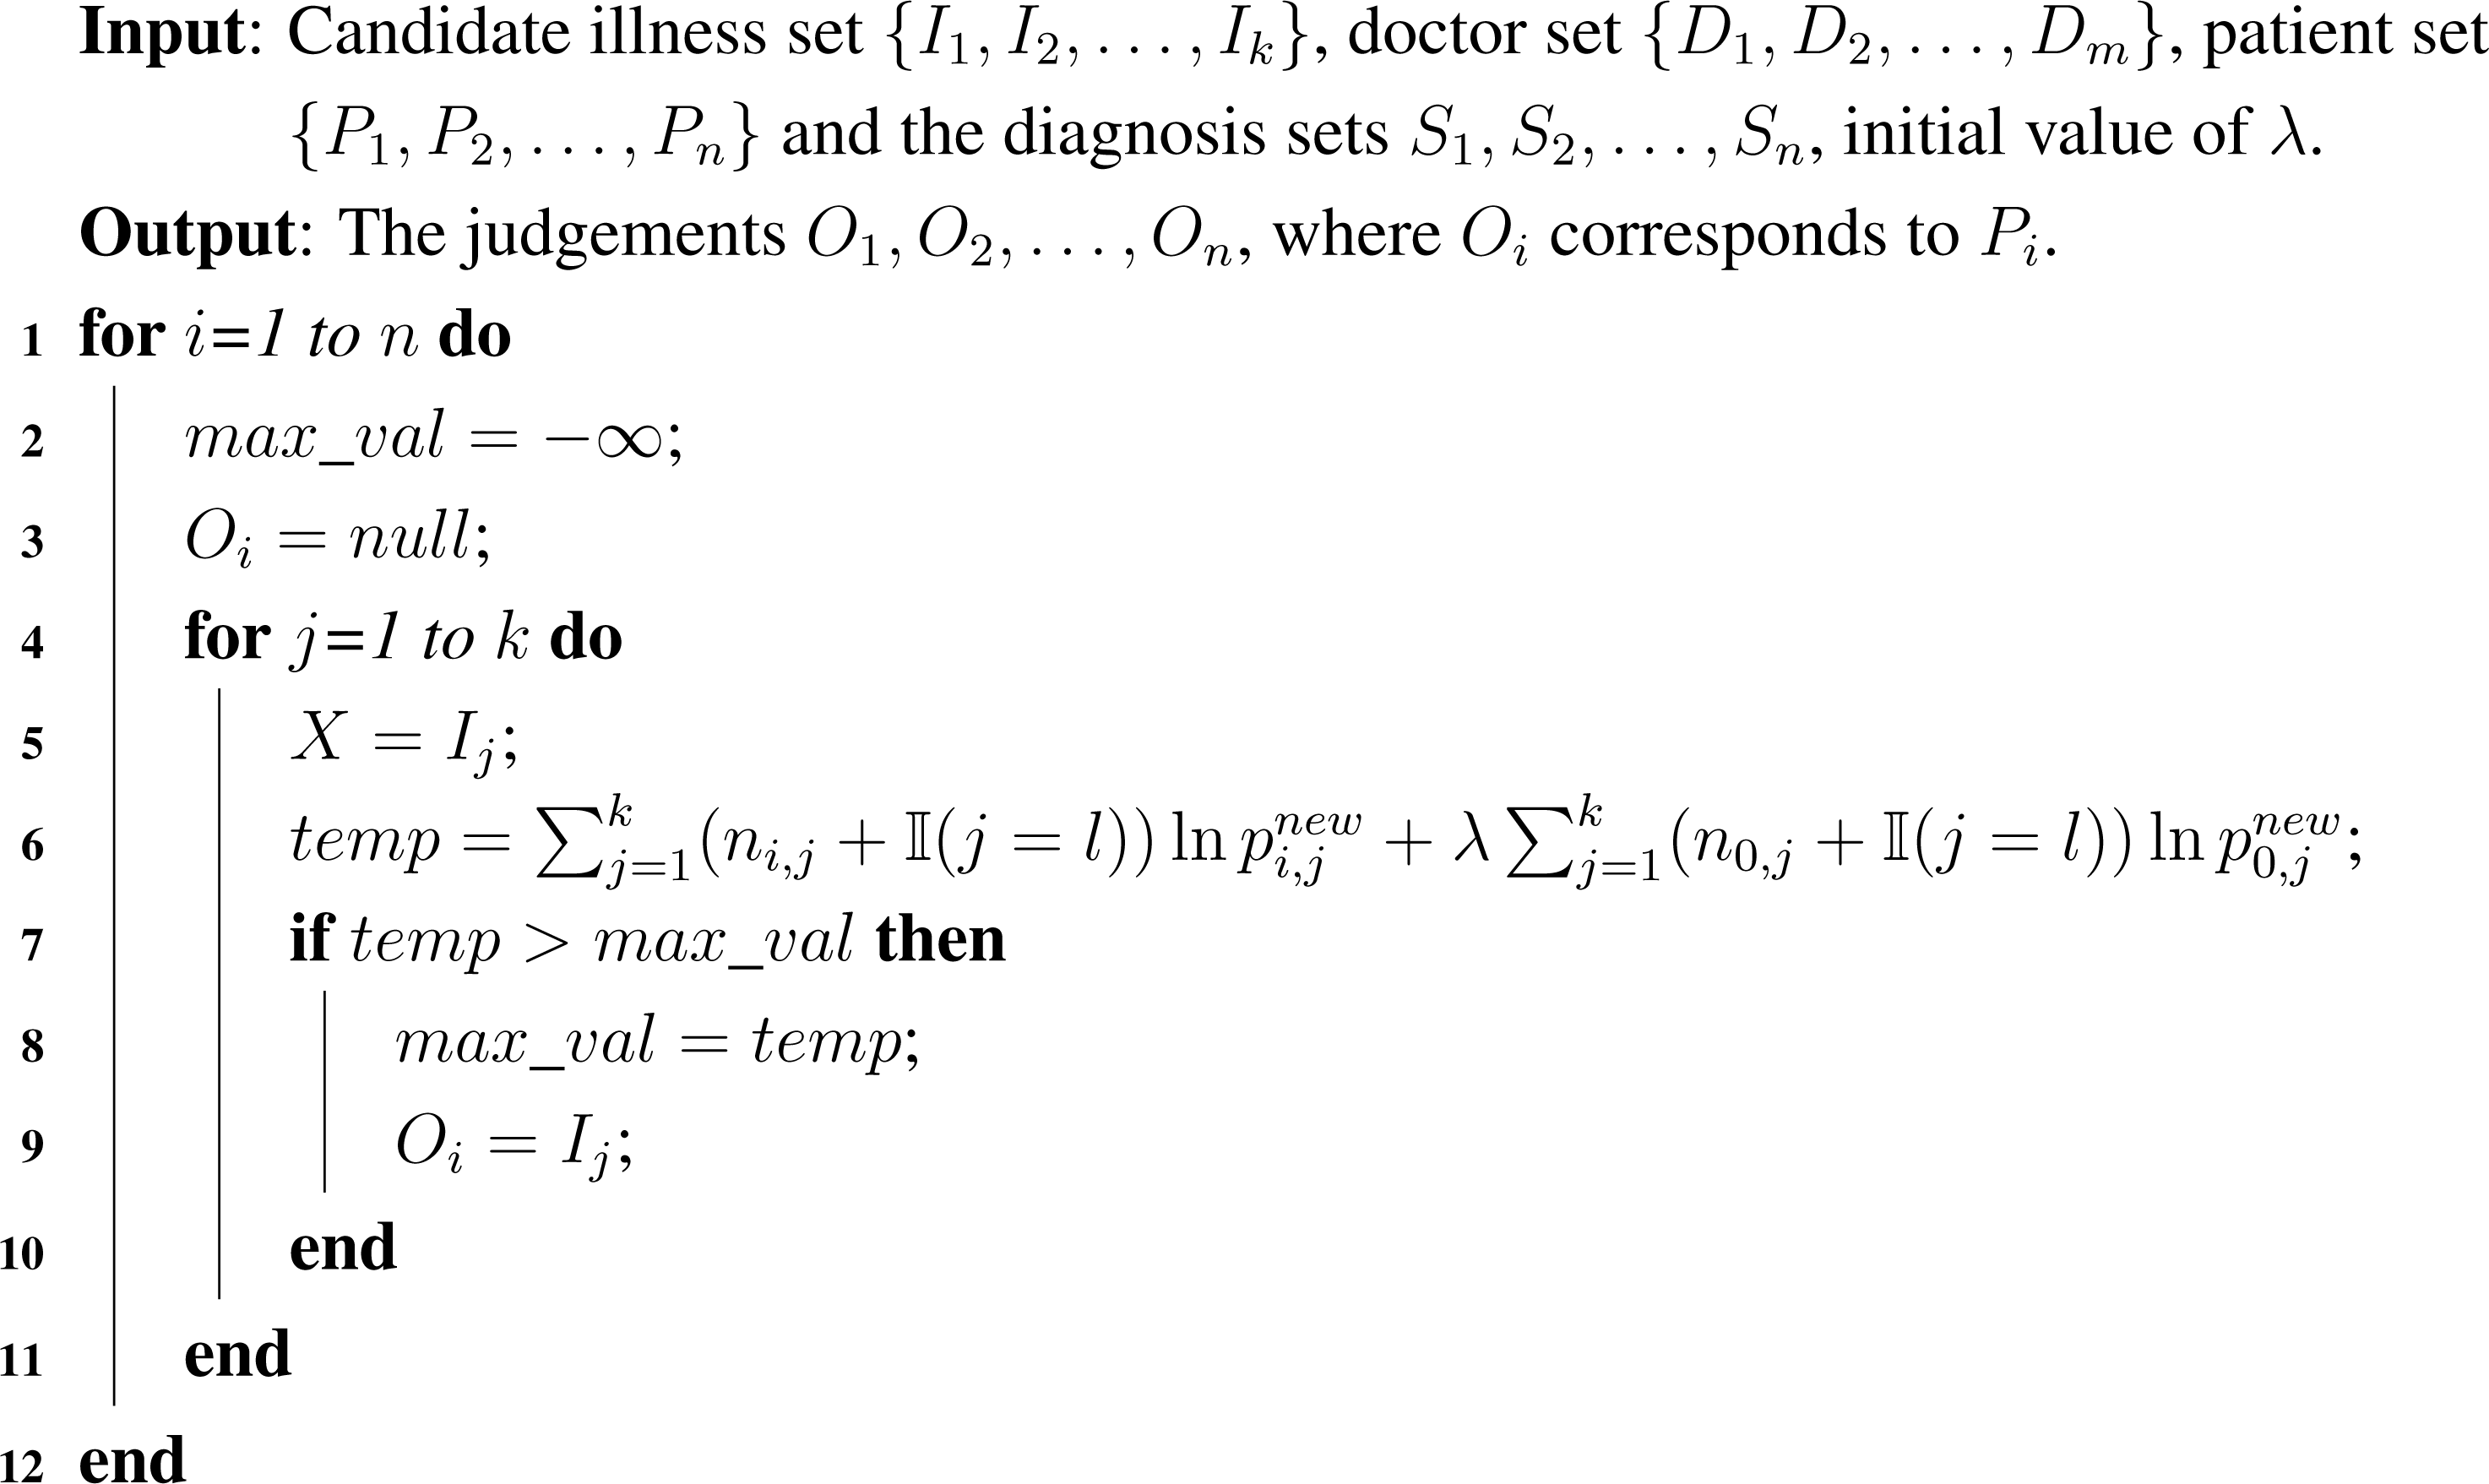
To ensemble the individuals’ judgements and make the final diagnosis for the patients, we adopt the enumeration policy,
i.e., for every patient, we enumerate the all possible illnesses and calculate the target values respectively. We take the one with the minimum value of
Equation (20) as the final judgement of the patient.
The details of the algorithm are presented in Algorithm 1, where line 6 is from
Equation (21). We see in the algorithm there
nk iterations, besides, in each iteration, to calculate the probability
pi,js (0 ≤
i ≤
n, 1 ≤
j ≤
k), we need at most
m scans to count the diagnosis given by the
m doctors to the patient, so the time complexity of the algorithm is
θ(
nmk).
Algorithm 1:.
Diagnose via Crowdsourcing.
Algorithm 1:.
Diagnose via Crowdsourcing.
5. Experiments
We conduct experiments on both of synthetic and real datasets to evaluate the proposed method. For comparison, we also compare the performance of our method with two other benchmark algorithms, including
majority voting(MV) and
follow the best doctor(FTBD). Where MV is a straightforward approach, which uses the most common label as the true label. From reported experimental results on real crowdsourcing data [
10], MV performs significantly better on average than the individual workers. FTBD refers to a natural alternative for the patients that when they receive more than one diagnosis from different doctors, they will tend to follow the best doctors’ diagnosis.
The detailed information of the real dataset is in Section 3, as to the constitution of the synthetic dataset, we adopt a 30 × 30 matrix R to represent the diagnosis results that are given by 30 doctors to 30 patients, where the rows correspond to the patients and columns to the doctors, hence, every entry Ri,j is the diagnosis doctor Dj gives to patient Pi. We assume there are in total three illnesses I1, I2 and I3, where every patient has equal probability to have one of the illnesses, so for each illness there are 10 patients with it. We observe that in real life every doctor often has some special diseases she has a good knowledge of, hence, for doctor Dj(1 ≤ j ≤ 30) we draw a random number x ∼ Laplace(0, 1), where, when the patient has the (
)th illness, we assume Dj makes right the diagnosis with probability 1 − |x|, and makes the wrong diagnosis to conclude that the patient has an arbitrary one of the other two illnesses with equal probability (i.e.,
).
We summarize the prediction performance in
Tables 2 and
5, where the results on the synthetic data are presented in
Tables 2 and
3, and the results on the real data are in
Tables 4 and
5.
Tables 2 and
4 are for the prediction accuracy results, where we see our proposed algorithm outperforms the comparison methods on the both datasets.
Tables 2 and
4 are the summarization of the confusion matrix of the results, where, for every algorithm, the (
i,
j)
th entry corresponds to the percentage value of the patients who are of illness
i and diagnosed to be with illness
j. For example, in
Table 3, the top left entry (
I1,
I1) = 0.80 indicates that 80% of the
I1 patients are diagnosed correctly by the MV algorithm.
Another issue remained to be discussed is to address the value of
λ. In our experiments, for the
ith patient
Pi, we calculate their
λ value as follows:
Our intuitation of the definition is as follow: Denote Σ
1 as the number of diagnosis to the all patients, Σ
2 as the Number of diagnosis to
Pi, it’s clear that Σ
1 ≫ Σ
2, so after the introduction of
Oi, the divergence
is always far greater than
, for compensation, we define
λ as above.
6. Conclusions
Addressing the high level medical experts shortage problem, we present a crowdsourcing based scheme. Unlike the popular expert consultation systems, our approach aims at exploiting the power of the general practitioners’ efforts. We propose a multiple diagnosis results ensemble policy, which is based on the statistical consistency w.r.t. the distribution of the results. We evaluate the proposed method on both the synthetic and real datasets. Results show it outperforms the comparison algorithms.
It is noteworthy that, although our algorithm yields better performance than the benchmarks in the empirical studies, and even the accuracy on the synthetic data is acceptable in practice, the results on the real data still remain not as high as expected. We think a main reason for this should be attributed to the limitation of the training data, because, in our experiment, all the volunteers are from the same department of the same medical school. Therefore, because of the reflection of their academic background, the diversity of their diagnosis results will be smaller than that of the real situation, or, in other words, the diagnosis results of different volunteers tends to be identical to each other. So when one volunteer has misdiagnosed a patient, it is most likely that many other volunteers will make the same mistake on the same patient, too. As a result, in the extreme case, no matter what the ensemble policy is, it is simply identical to the superposition of multiple duplicates. So, in our subsequent work, on the one side, we will try to introduce some small sample statistical technologies to improve the performance of the algorithm, on the other side, we will keep on collecting more real data from different sources to enlarge the ground truth base.


