1. Introduction
Compared to petroleum or electric systems, high pressure air has the advantages of no pollution, high power density, cheapness, reliable performance, recycling use, and being easy to maintain [
1,
2]. It has been applied to industrial automation, robot driving, compressed air powered vehicles, and even some special industries such as aeronautics, astronautics, and weapons design [
3]. Typically, the charging and discharging performance and exergy analysis [
4] are based on the equations of state. However, in high-pressure pneumatic dynamic thermodynamic processes, the pressure is much higher than the air critical pressure and the temperature can deviate significantly from the Boyle temperature. Since the thermodynamic properties based on the ideal gas are not authentic [
5], the deviations in the mass and energy balances in thermodynamic process may not be acceptable. In this paper, the specific residual thermodynamic energy and specific residual enthalpy will be derived to compensate for the real gas effect.
Extensive studies have been conducted on high pressure pneumatic systems [
6,
7]. In these works, most of the thermodynamic property calculations are still based on the ideal gas assumption, although the specific thermodynamic energy and specific enthalpy of an ideal gas and a real gas can differ considerably under high pressure and low temperature conditions. In this study, we will also examine the deviation between the state variables computed by the real gas equation and ideal gas assumption.
Many semi-empirical formulas have been proposed to describe the properties of real gases, including the van der Waals equation [
5], Redlich-Kwong (R-K) equation [
8], Soave-Redlich-Kwong (S-R-K) equation [
9], Benedict-Webb-Rubin (B-W-R) equation [
10], and Peng-Robinson (P-R) equation [
11,
12]. With the development of the corresponding states principles, these equations are applicable to all kinds of gases within a certain pressure and temperature range. However, the precision of some of these equations is not satisfactory, or when calculating the thermodynamic variables by using high order nonlinear equations, like the S-R-K and P-R equations, it will lead to the extra problem of solving transcendental equations, which appearance is not desirable. The SAFT-type equation of state [
13] is accurate enough to calculate thermodynamic variables of air, while the mathematical expression of the derived functions are complex.
2. Derivation and Determination of Real Gas Equation of State for High Pressure Air
According to the corresponding state law, the compressibility factor which indicates the deviation of real gas from ideal gas can be obtained from the table of corresponding states [
14]:
The compressibility factor is a function of the corresponding pressure and temperature. The compressibility factor value of an ideal gas is 1. For most gases, the P-Z curves can be approximately considered to be linear when the pressure P < 0.5Pc or the temperature T > 5Tc, and the compressibility factor Z is nearly 1. However, under high pressure conditions over 0.5Pc, or low temperature conditions below 5Tc, a reliable and simple real gas equation of state should be derived to fit the data.
The virial coefficients which are basic thermodynamic properties represent the non-ideal behavior of real gases. The importance of the virial coefficients lies in the fact that they are related directly to the interactions between molecules. The second virial coefficient represents the deviation behavior from ideality due to interactions between pairs of molecules, the third virial coefficient gives the effects of interactions of molecular triplets, and so on. The fourth and higher virial coefficients usually contribute little to the densities of gases and have relatively large uncertainties. Therefore, the accurate knowledge of the virial coefficients is of great significance. In order to improve the accuracy of calculation, most effort has been focused on obtaining the second [
15,
16] and third virial coefficients [
17,
18].
The volume serial form of the virial equation which is truncated to the third virial coefficient can be written as:
After the introduction of the critical pressure
Pc, the critical temperature
Tc, acentric factor
ω, and the extended corresponding states variable
θ [
19], the second and third virial coefficients of the corresponding state can be expressed as:
where Br0(Tr), Cr0(Tr) are obtained by fitting data for small spherical molecules (ω = 0); Br1(Tr), Cr1(Tr) are obtained from data for larger, non-spherical, non-polar molecules (ω ≠ 0); Br2(Tr), Cr2(Tr) are obtained from data for non-hydrogen bonding polar molecules; and Tr = T/Tc.
In this paper, the real gas is assumed to be air in chemical equilibrium [
20]. The National Institute of Standards and Technology (NIST) provides a basic model of air [
21], which consists of nitrogen, oxygen, and argon. These are non polar molecules, the
Br2(
Tr), and
Cr2(
Tr) of dry air are 0, and the critical parameters of air are:
Tc = 132.45K,
Pc = 3.77MPa. The improved formulas of
Br0(
Tr),
Br1(
Tr),
Cr0(
Tr), and
Cr1(
Tr) given by references [
22–
24] are:
The Peng-Robinson (P-R) equation,
Equation (9), is an improvement on the van der Waals equation. It was proposed in 1976 [
12,
13]:
where
, r = 0.48 + 1.574w − 0.176w2, and
.
In the general high pressure pneumatic system, the pressure can reach 30 MPa, and the temperature range is about 250 K<
T <400 K. Compared with the Nelson-Obert’s generalized compressibility chart [
1], the P-R equation is more precise than the S-R-K equation in the compressibility factor calculation of air [
1]. In this paper we calculate the compressibility factor, using improved virial and P-R equations. The results of some feature points are shown in
Table 1. The data for air fitted in this paper are provided by the real properties database of National Institute of Standards and Technology (NIST) [
25], as shown in
Table 2.
The error results when calculating the compressibility factor within the pressure range of 0.101325 MPa <
P < 30 MPa at the temperatures of 400 K, 300 K and 260 K, respectively, are shown as
Table 3. From
Table 3, it is found that the precision of improved virial equation is better than P-R equation compared to the NIST database.
Compared with the P-R equation, the precision of the improved virial equation is better. The precision can meet the requirements of general engineering computation. Therefore, the improved virial equation is adopted to calculate compressibility factor, and in this paper the thermodynamic variables will be derived based on the improved virial equation of state.
Figure 1 shows the relationship between the pressure and density of high pressure air under different temperature conditions using different equations of state. It is found that the improved virial equation shows good agreement with the NIST data.
3. Modeling Thermodynamic Variables
The dynamic thermodynamic analysis under high pressure conditions such as mass flow rate, charging and discharging processes, and exergy analysis in the pneumatic system are of particular interest in many applications. Therefore, to investigate the thermal behaviors in thermodynamic processes, which can be used to predict the gas pressure, temperature and flow rate, it is essential to derive the thermodynamic variables on the basis of real gas equation states. In this section, the real analytical expressions of specific thermodynamic energy and specific enthalpy will be derived for high pressure air.
3.1. Residual Functions
In the calculation of real thermodynamic property variables, the ideal value can be calculated first, then the residual function will subtracted from the ideal value. The definition of residual function can be expressed as:
where Fre denotes the residual of a arbitrary extensive properties or specific properties, that is, the difference between the properties of ideal gas and real gas, F* denotes the properties of ideal gas, and F denotes the properties of real gas.
The differential form of specific thermodynamic energy for real gas is:
We have:
The residual specific thermodynamic energy for a real gas is obtained by integrating the equation above from v* = ∞ (ideal gas state) to v (real gas state) along the isotherm:
The specific enthalpy for a real gas is defined as:
and the specific enthalpy for an ideal gas can be expressed by:
Combination of the above three equations will lead to:
3.2 Thermodynamic Variables of Ideal Gas
The specific thermodynamic energy and specific enthalpy of ideal gas can be written as:
For ideal gas, isochoric heat capacity can be expressed by:
where α = 3.653, β = −1.337 × 10⁻³, γ = 3.294 × 10⁻⁶, δ = −1.913 × 10⁻⁹, and ɛ = 0.2763 × 10¹².
3.3 Thermodynamic Variables of Real Gas
Based on the improved virial equation and substituting
Equations (13),
(16),
(17) and
(18) into
Equation (10), respectively, the analytical expressions of specific thermodynamic energy and specific enthalpy for real gas are obtained as follows:
4. Modeling of Pneumatic Catapult
Figure 2 shows the working principle of a high pressure pneumatic catapult, and
Figure 3 is the schematic diagram of the lifting ejection mechanism which is a schematic structural diagram of the three-step piston cylinder in
Figure 1 and component 6 in
Figure 4. There
da is the diameter of the piston rod,
dc is the diameter of piston,
Sa is an effective thrust area of the third stage cylinder,
Lb represents the second cylinder, and
Lc represents the third stage cylinder.
The working principle of the lifting ejection system can be described as follows: as the launching process starts, the controlled valve immediately responds and opens, and high-pressure gas flows into the low pressure chamber; the second stage of the cylinder pushes the piston to move forward, then the first stage of the cylinder pushes the piston to move forward after the second stage moves to the end; missile moves with lifting beam, then lifting beam collides with the buffer, and missile flies out of the launch tube.
In the course of the pneumatic ejection, taking the subsonic and sonic flow into account, mass flow equation can be written as:
where subscripts 1 and 2 indicate high-pressure chamber and low pressure chamber respectively, μx is flow correction factor, A denotes the equivalent cross-sectional area of orifice, and k denotes the adiabatic index.
According to mass and energy conservation laws, and the flow equation in the high-pressure chamber and low pressure chamber, the following relations can be established:
where me is the quality of missile, Pa denotes the atmospheric pressure, g is the acceleration of gravity, v2 is the speed of missile, and st denotes effective thrust area.
Let X1=ρ1, X2=T1, X3=m2, X4=T2, X5=l, X6=v2, the closed pneumatic equations can be established as:
5. Simulation Analysis of the Pneumatic Ejection
The system parameters of above mathematical model and thermo-physical parameters are as shown in
Table 4. The five-step four-order Runge-Kutta method is used to calculate the pneumatic ejection process based on ideal gas equation and real gas equation respectively. The basic idea of five-step four-order Runge-Kutta method is expressed as:
where t0 indicates time step, and j represents the current time step.
5.1. Comparative Analysis of Dynamic Thermodynamic Processes
Figures 5–
9 show the dynamic variation comparison of the main thermodynamic variables in the ejection process. When air flows from high pressure chamber to low pressure chamber in the throttling process, the temperature will change with the pressure drop. The throttling process is assumed to be an isenthalpic process. From
Figure 5, we can see that the high pressure air flows into the low pressure chamber, the temperature in the high pressure chamber decreases all the time. In the initial stage, the temperature of the low-pressure chamber increases immediately, and then decreases gradually when the missile moves upward. Also, from
Figure 5, we can see that the real temperature in the high chamber decreases faster than the ideal temperature before 0.2 s. This can be explained from the following two aspects: firstly,
Figure 9 shows that the gas mass based on real gas and ideal gas flowing into the low pressure chamber are nearly equal; secondly,
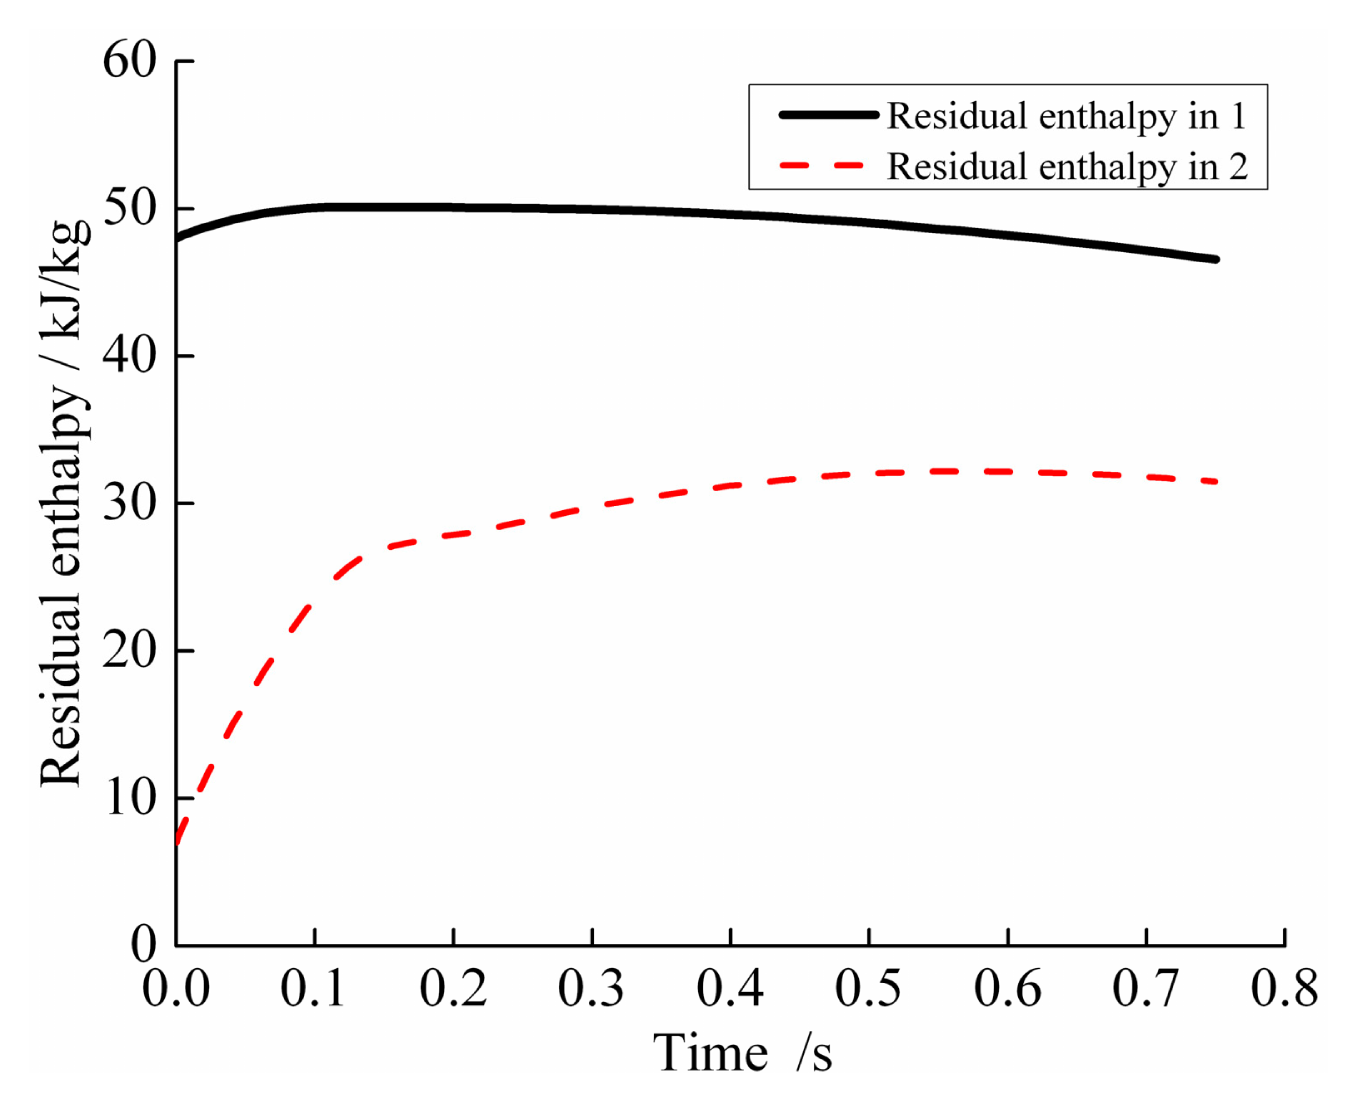
Figure 7 shows that the residual enthalpy in high pressure chamber is positive, the real enthalpy of high pressure air is obviously less than ideal one. As a result, the real temperature in the high chamber decreases faster before 0.2 s.
From
Figure 5, we know the temperature in the low pressure chamber increases immediately, and then decreases slowly when the missile moves upward. It shows that the real temperature of gas in the low pressure is always lower than ideal one, which indicates that the real gas effects decelerates the temperature increasing rates in the low pressure chamber in the early stage, and accelerates the rate of decrease of the temperature with the missile moving upward.
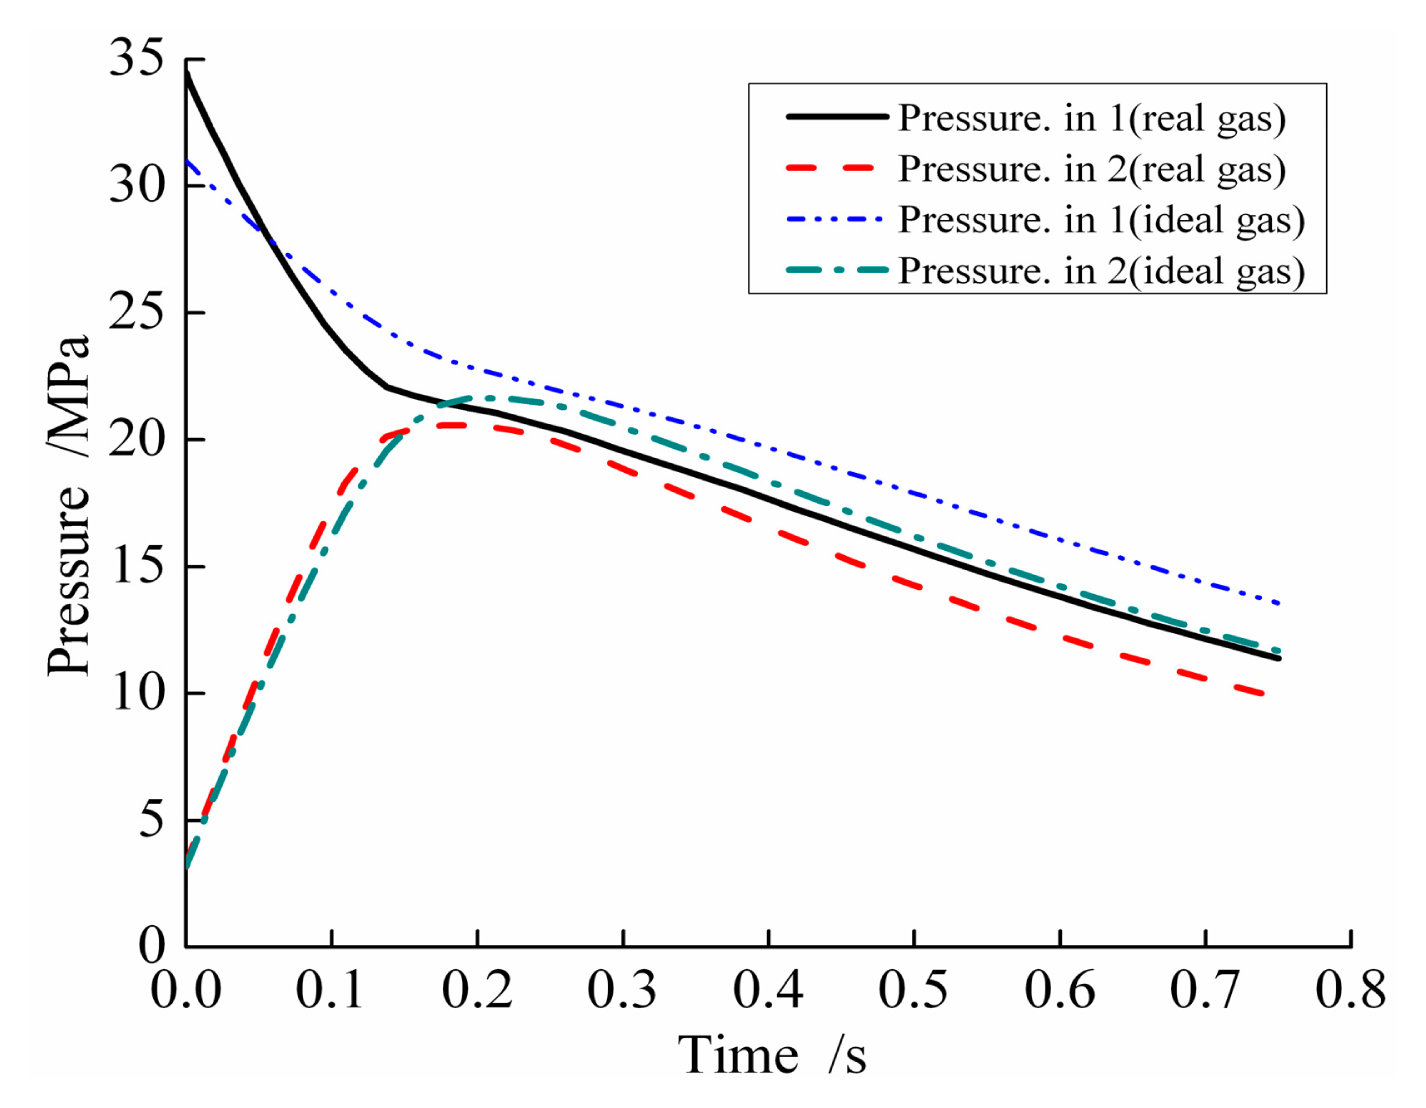
Figure 6 shows the pressure variations in the high pressure chamber and low pressure chamber. We can see that the hyperbaric always deflates, and the pressure continues to decay. High pressure air flows into low pressure chamber that the pressure in the low pressure chamber increases before the missile starts to move, and decreases as the missile moves upward. The real pressure decay rate is greater than the ideal decay rate. This is due to the following facts: firstly, from the analysis above, we know that the real temperature in the high chamber decreases faster than the ideal one; secondly, the real gas mass flowing out of high pressure chamber is nearly the same as the ideal mass. The first factor is the dominant factor which makes the phenomenon happened. The ideal value of temperature in the hyperbaric pressure chamber is much greater than the actual value which is similar to low pressure chamber.
From
Figure 7, we can see that the specific enthalpy in the hyperbaric chamber increases first and then decreases slightly, while the specific enthalpy in the low pressure chamber rises rapidly, and then increases slowly. When the pressure getting higher, the distance between molecules becomes smaller and the intermolecular interaction becomes stronger, as a result, the specific enthalpy gets larger and it deviates more from the ideal gas state. While the temperature increases, the situation is totally different: longer distance between molecules makes the intermolecular forces smaller, so the specific enthalpy gets smaller and it is more close to the ideal gas state. For the high pressure chamber, with gas flowing into low pressure chamber, pressure decays, and temperature decreases rapidly.
Figure 7 shows the specific enthalpy in the high pressure chamber drops slightly, which indicates that the pressure drop is the main factor. For the low pressure chamber, the pressure and temperature increase first, and decrease with the gas pushing the missile upwards.
Figure 7 shows the specific enthalpy in the low pressure chamber increases rapidly first and then increases slightly, which indicates that the pressure increase is the main factor in the early stage, and the temperature decrease is the main factor in the later round.
Figure 8 shows the dynamic variation of pressure compression factors in the hyperbaric chamber and low pressure chamber. The maximum compression factor reaches 1.1013 and 1.0486, respectively. From
Equation (1) we can see that the compressibility factor is determined by temperature and pressure. As shown in
Figure 5 and
Figure 8, the compressibility factor variation law is similar to the pressure one which indicates that the pressure dominates the changing regulation of the compression factor.
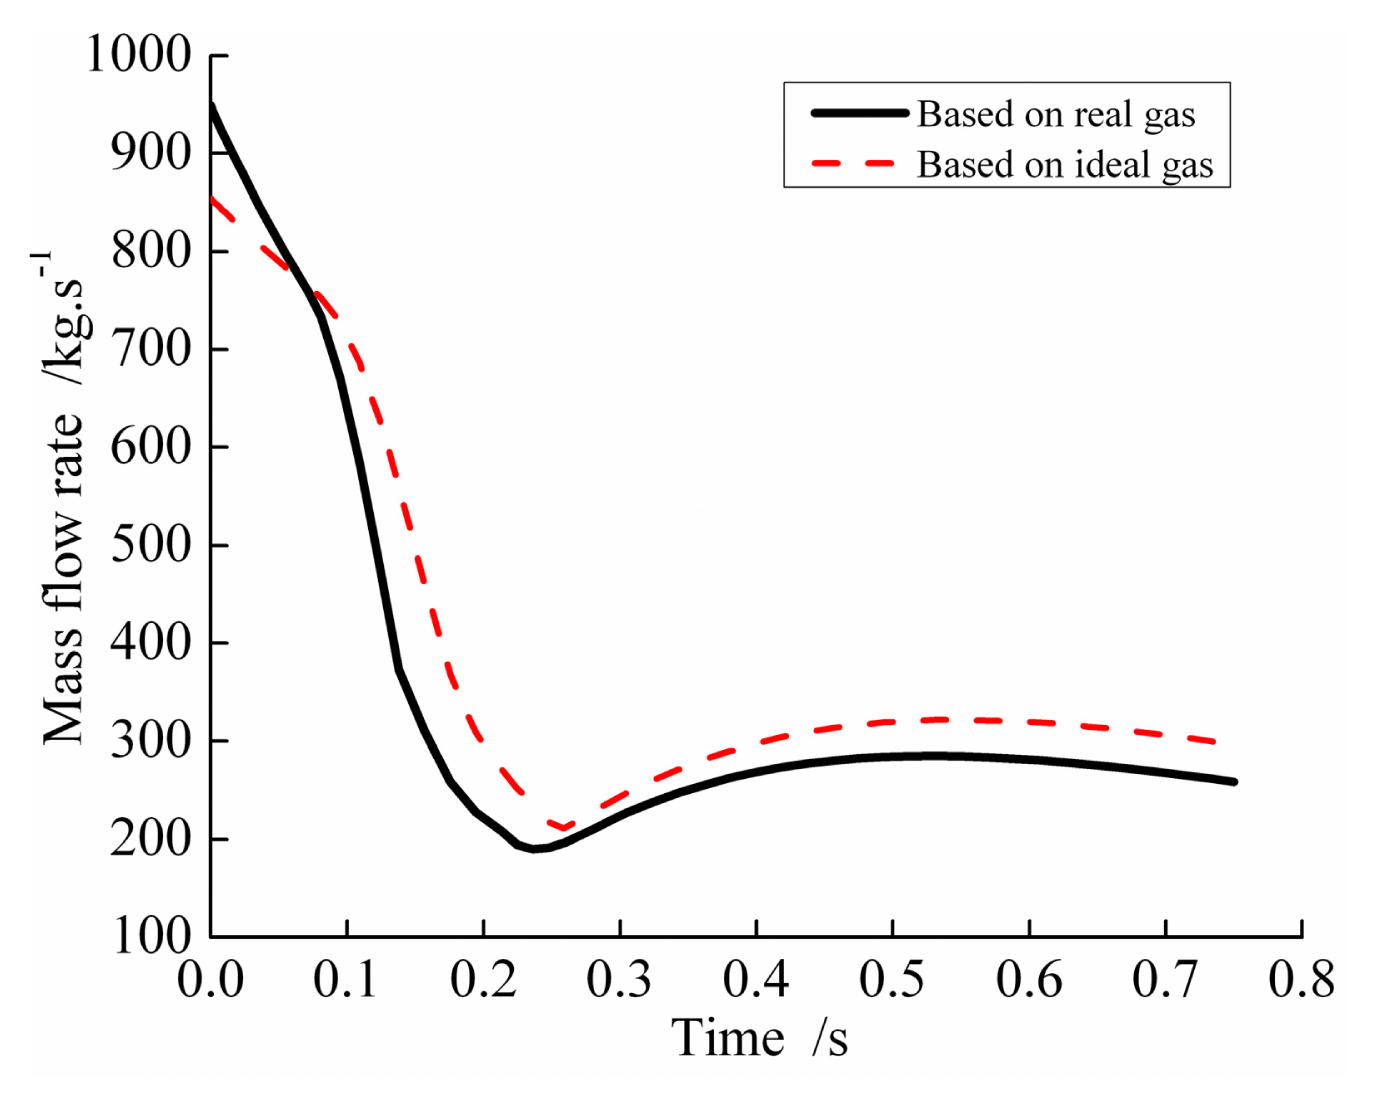
Figure 9 shows the mass flow rate declines rapidly at first, and then rises slowly. It is also noticed in
Figure 9 that the real gas effect accelerates the rate of decrease of the mass flow in the early stage, and decelerates the rates of increase in the later period.
6. Conclusions
In this paper, the improved virial equation of state is used to describe the thermodynamic properties of high pressure air by fitting the NIST data. The compressibility factor is utilized to evaluate the precision of the equation of state. Compared with the NIST data, the compressibility factor value obtained from the improved virial equation has a maximum error of 1.33%, 2.47% and 4.23% within the pressure ranges of 0.101325 MPa < P < 30 MPa at the temperatures of 400 K, 300 K and 260 K, respectively, and the precision of the improved virial equation of state is better than that of the existing P-R and S-R-K equations.
Also, the analytical expression for thermodynamic variables, such as the specific residual thermodynamic energy and specific residual enthalpy are presented to compensate the real gas effects, based on the improved virial equation of state. The study on dynamic thermodynamic analyses, mass flow rate, charging and discharging processes, and exergy analysis are of particular importance in high pressure air applications. In addition, based on the real thermodynamic variables, the internal ballistics mathematical model for a pneumatic ejection system is established, with the real gas effects considered. Numerical simulations are also performed.
The detailed dynamic thermodynamic processes for discharging processes in the hyperbaric chamber and charging processes in the low pressure chamber are analyzed. The comparison of the numerical results indicate that the value of residual enthalpy is high, the state of the working fluid deviates from the ideal gas, and the compressibility of working fluid is strong, as the compression factor reaches 1.107. The real gas effects accelerate the pressure and temperature rates of decrease in the hyperbaric pressure chamber, and decelerate the rates of increase in the low pressure chamber.


