1. Introduction
Granular soils are used as engineering materials in a wide variety of applications from pavements to structural fills to granular filters to dams. The engineering performance of these soils in their different applications depends upon achieving a stable internal granular structure in their compacted condition (see e.g., [
1–
10]). Internal instability may result in various types of particle migrations like erosion, piping and suffosion in the case of flowing water (see e.g., [
10–
15]). However, internal stability is not entirely ensured by the compaction process, with many well-compacted materials being prone to particle instability, due to the inherent behaviors determined by their distribution of particle sizes [
2].
Particle size distributions are characterized by sieve analyses, to produce a frequency distribution of sizes, which is expressed as a cumulative frequency distribution known as a grading curve. The grading curve contains a large amount of data, which makes is use in the evaluation of soil properties awkward [
1]. To simplify the evaluation of soil behavior using grading data, rules based on a few nominated particle diameters to represent the entire grading curve are used. There are many suggestions in the literature to identify succesptibility of soils to internal instabilities, generally using geometrical criteria based on some limited number of grading curve data, usually specified in terms of particular diameters
Dx (or
dx), which represent the particle diameter for which
x% of grains (by weight) are smaller.
Grain structure instability through internal erosion involves the loss of particles under seepage flow, with or without the matrix of coarse soil particles becoming unstable. Instability of the coarser particles leads to the growth of large internal voids, known as piping [
6,
9,
11,
13,
14]. If the matrix of coarse soil particles is stable under seepage flow then suffosion (detachment and transportation of small particles by flow of water through the largest voids of the soil) may occur if the grading is adverse and the hydraulic gradient exceeds a certain critical value [
8–
10,
15]. According to Khomenko [
10], the term “suffosion” is Russian in origin and was introduced to describe the process of removal and transport of small soil particles through pores. The succeptibility to suffosion can be assessed by the graphical approach of Lubockov [
15] where a grain size distribution is compared with empirical upper and lower bound thresholds. However, this approach is not valid for gap-graded grain size distributions.
Piping, suffosion and underground erosion give rise to a wide range of surface expressions including caves, subsidence hollows, collapse sinks, and swallow holes, landslides and sand boils [
10]. These may be of engineering significance when they occur due to problems with hydraulic infrastructure or with natural groundwater flow in urban areas. They may be encountered in case of heavy rains at slopes with removed biological cover, due to the unstable underlying material, and have serious consequences in relation to dams and flood mitigation structures in rivers.
In the construction of earth dams or earth cores in rockfill dams, different granular earth materials are often compacted in adjacent layers. In adverse situations, the grains of one layer can be washed through the pores of another, causing them to become eroded. It is desirable, however, that adjacent materials should act as filters for each other, including the base materials upon which the construction takes place [
3–
5]. To assess the potential for erosion from adjacent soil layers, there are several well-known filtering rules but these are based on only one or two pairs of grading curve points [
1,
16–
19]. These are acceptable for relatively uniform granular filters and granular base (protected) soils. The criterion
D15/d85 < 9 ([
4]; where
D and
d denote the filter and base soils, respectively) proves to be satisfactory in these cases. However, doubt may arise in their application to broadly-graded filters and also to broadly-graded or silt-clay base materials. However, in many cases, the use of such filters is necessary, and silty-clay base soils are unavoidable.
Another issue arising in the engineering of granular soils is segregation. Particulate solids tend to segregate due to the differences in the size, shape and other characteristics of the particles of which they are composed. The process of segregation occurs during processes where the particles are able to flow freely, such as tipping and spilling. The likelihood of backward erosion is greater for segregated soil than for non-segregated soil in embankments. Segregation is also a problem of broadly graded filters, which may lead to excessive erosion. Segregation while placing samples into laboratory test equipment is also a problem. Compacted earth dam and core material should resist segregation; however, broadly graded silt-sand-gravel soils are subject to segregation during placement in dams or levees. According to the existing rules, the amount of segregation can be decreased if the uniformity coefficient is smaller than about 20 [
20]. Sherard [
4] considers that the tendency to segregate can be linked to
d90.
In this paper, data from a series of simple and effective soil testing programs (including information from the testing programs of Lőrincz [
1] and Sherard [
4]), performed on artificial mixtures of natural sand grains, are elaborated. The results of these are used in an efficient way (considering some results in the literature including the self-filtering theory of Kézdi [
8,
9]) to explore the various soil structure instability phenomena, and to give a set of rules for granular soils (an internal stability rule, a filtering rule and a segregation rule) based on the theory of grading entropy [
1]. Also, a criterion is given to decide if the segregation of a given mixture is negligible or excessive.
The application of these rules is demonstrated through the example of the failure in 1993 of the Gouhou dam with internally unstable dam material, by testing the reliability of the existing filter rules in the literature, and by presenting a method to construct non-segregating, artificial mixtures of natural soil grains.
The paper concludes by discussing how the rules derived in this paper differ from most existing rules in that the grading entropy parameters (see e.g., [
1–
3,
7]) are formulated to utilize the whole grading curve data instead of some limited number of grading curve points and how they can be implemented numerically, without any constraint on the shape of the grading curve.
2. Grading Entropy
2.1. Statistical Entropy and Its Application to the Grading Curve
Consider
M elements in
m statistical cells (
Mi is the number of the elements in the
i-th cell). The statistical entropy
Ss is ([
16]):
where
s is the specific entropy or the entropy of an element given by:
In
Equation (2),
b is the base of the logarithm, and
αi is the relative frequency of the
i-th cell, given by:
2.2. Statistical Cells (Fractions and Elementary Cells)
Two statistical cell systems are used in the definition of the grading entropy [
1]. The fractions are defined by successive multiplication with a multiplication factor of 2, starting from an arbitrary
d0 (primary statistical cells) as follows (
j = 1, 2, …; see
Table 1):
where fractions are numbered by
j (serial number),
d0 is the the elementary cell width. The number of the fractions
N is defined in terms of the difference of the absolute serial numbers of finest and coarsest fractions:
A uniform (“elementary”) cell system is defined in which the cell width is
d0. It is assumed, that the distribution in these is uniform and it is the same within a fraction. The number of the elementary cells
Ci in the fraction
i is equal to:
The relative frequency of any elementary cell in fraction
i is equal to:
where
xi is the relative frequency of fraction
i.
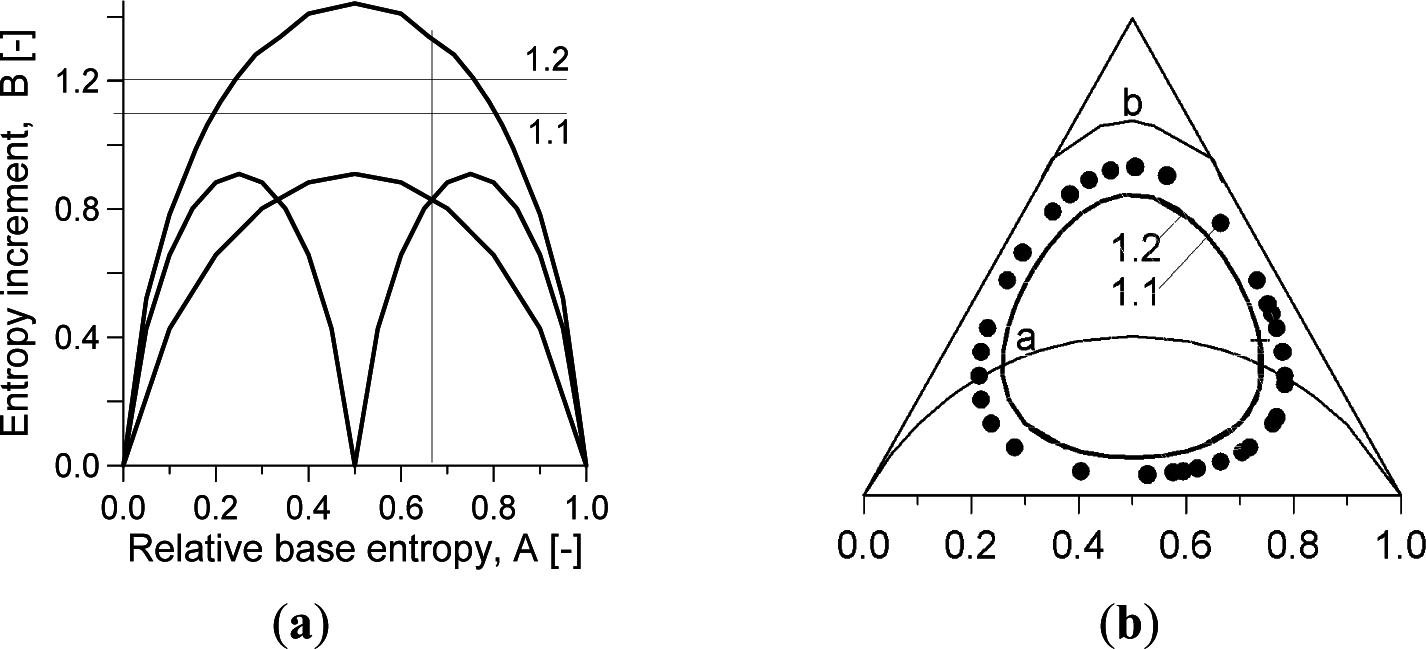
Now consider the simple situation of two statistical cells, with relative frequencies of
α1 and
α2 = 1−
α1. If the base of the logarithm is set to 2 in
Equation (2) then the maximal specific entropy of this system is equal to 1 at the point where the relative frequencies are equal to
α1 =
α2 = 0.5. This function, being similar to a half-ellipse, (see
Figure 1a), will determine all the important lines of the entropy diagrams. The specific entropy is written as follows:
2.3. Simplex Representation
The space of the possible grading curves can be defined as the set of the discrete probability distribution functions, where there are N fractions and the minimum grain diameter is dmin.
There is a natural one-to-one relationship between the relative frequencies of the fractions of the possible grading curves with
N fractions and the barycentre coordinates of the points of an
N-1 dimensional closed simplex, since the following equation is met for the relative frequency of the fractions
xi (
i = 1, …, N):
which is the defining equation of the
N-1 dimensional closed simplex. The inner points (where the relative frequency of every fraction is greater than zero; denoted by Δ) constitute the open simplex.
This curve appears in the image of every edge of the simplex.
The structure of the continuous sub-simplexes of a large simplex is shown in
Figure 1b. This structure appears in the image of the maximum lines of the continuous sub-simplexes in the entropy diagram.
2.4. The Grading Entropy and the Entropy Coordinates
The grading entropy
S is the statistical entropy of the grading curve in terms of the elementary statistical cells. It is derived by inserting the relative frequency of the secondary cell
αi from
Equation (7) into
Equation (8) to give:
The grading entropy
S is split into two parts: base entropy
So and the entropy increment
ΔS:
The base entropy
S0 is as follows:
where
S0i is the grading entropy of the
k-th fraction. The values of
S0i, shown in the bottom row of
Table 1, are defined as:
and, therefore:
It follows that the entropies of the fractions are integers and the base entropy S0 is the mean value of the entropy of the fractions, weighted by the relative frequencies of the fractions xi (i = 1, …, N).
The entropy increment Δ
S is given by:
The entropy increment ΔS is the statistical entropy of the grading curve in terms of the primary cells (fractions). It is the concave and symmetric function of its variables. The maximum of the entropy increment ΔS has a one-to-one relationship with the number of fractions in the grading curve N.
The entropy coordinates have normalized forms as well, being the relative base entropy
A and as the normalised entropy increment
B. The normalised base entropy, the so-called relative base entropy
A, is defined as:
and, therefore:
where
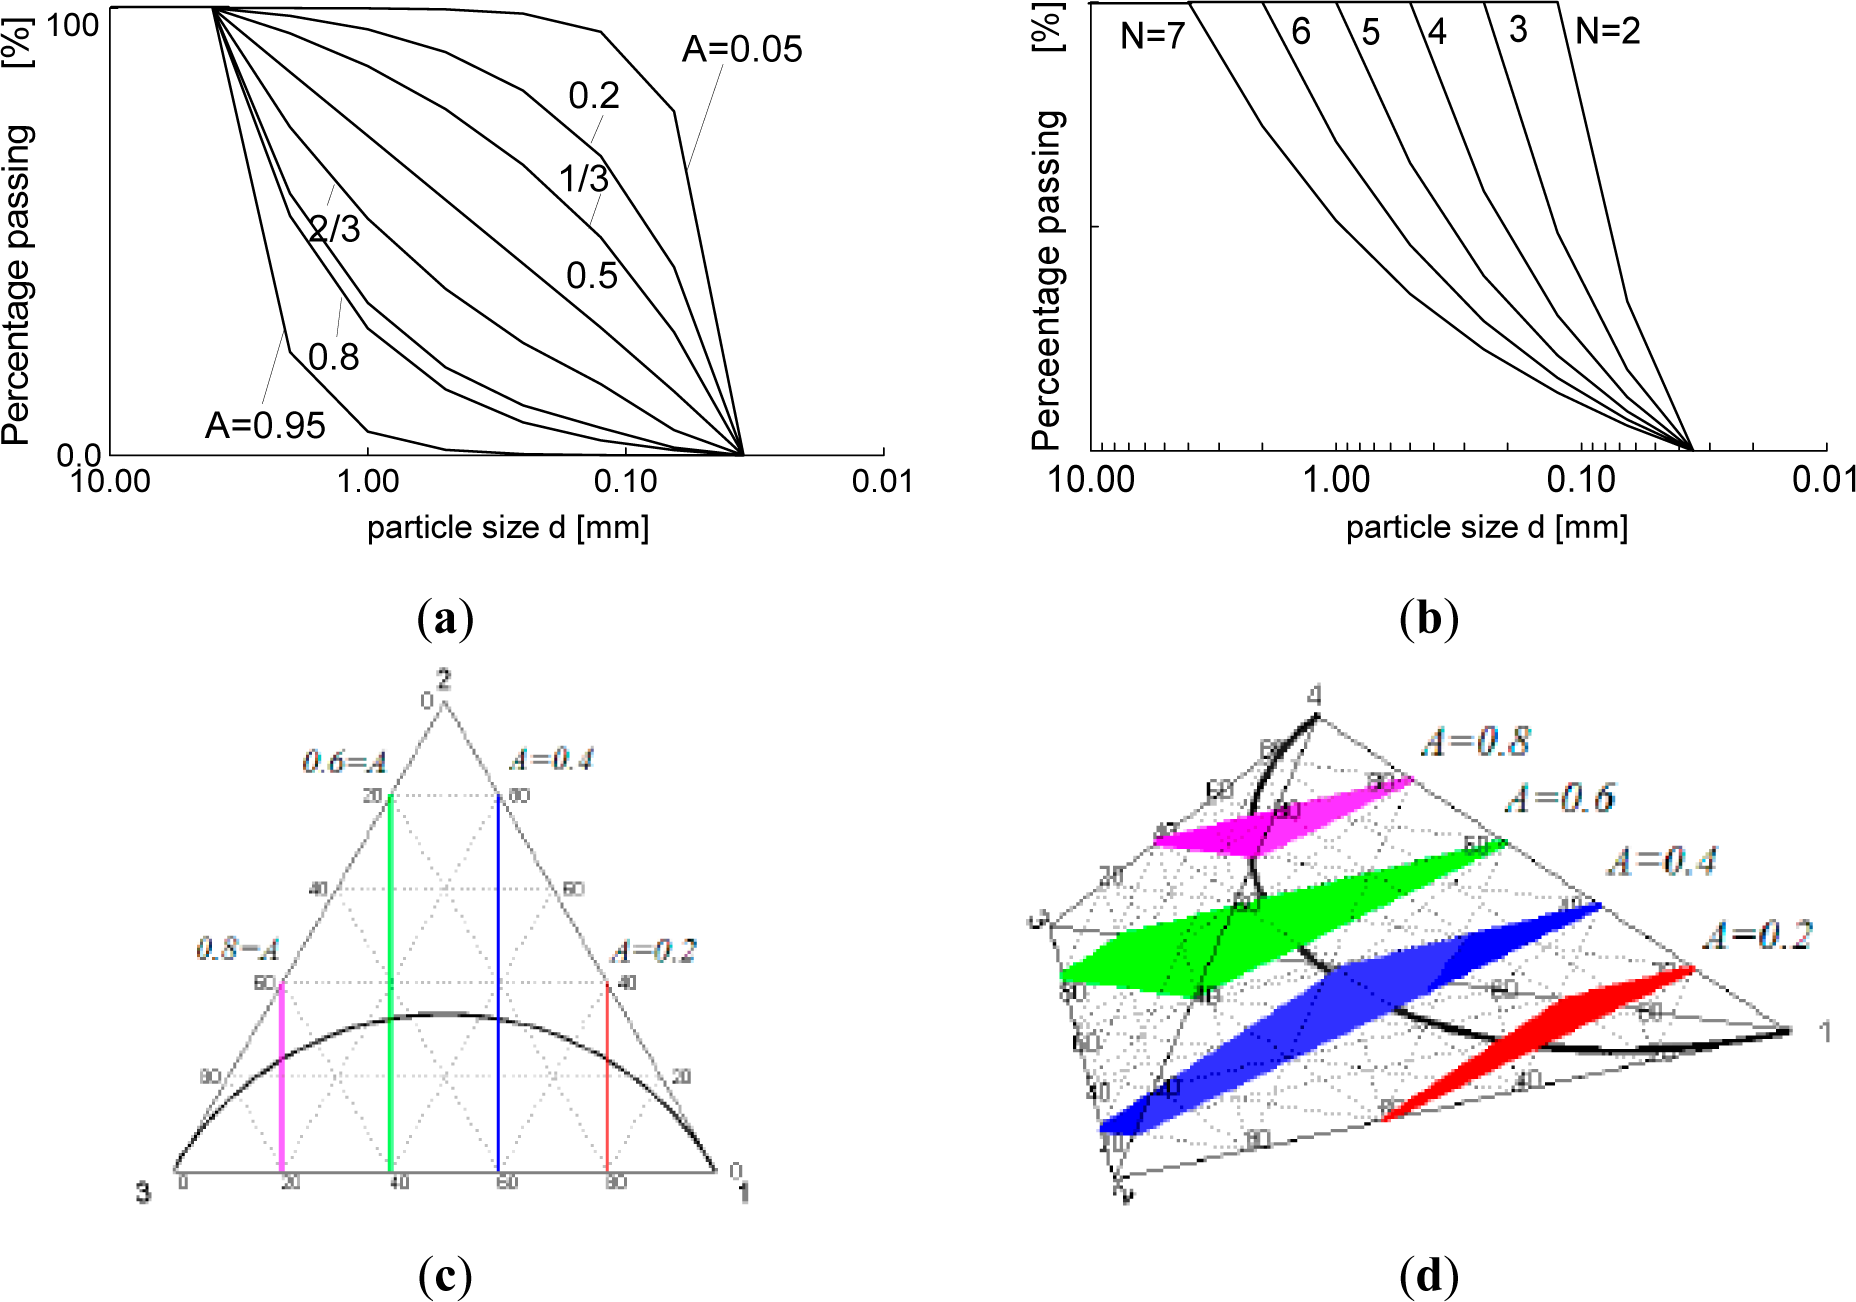
S0min and
S0max are the entropies of the smallest and largest fractions in the mixture, respectively. The (normalised) base entropy is a linear function which defines parallel hyperplanes in the space generated by the simplex. (
Figure 1c,d).
The normalised entropy increment is:
With regard to the fraction definition, the concept is basically insensitive to the selection of the minimum grain diameter d0. For granular soils, the smallest particles are caused by crushing which can produce particles which are limited to the size of some microns. For plastic (clay) soils, the size can be much smaller. The size of the SiO4 tetrahedron (2−22 mm) is adopted here. If the minimum grain diameter d0 is defined differently, the normalized entropy coordinates are unchanged. The range of A and B is independent of N (B varies between 0 and 1/ln2; A varies between 0 and 1). By contrast, the range of the entropy coordinates is dependent on N (ΔS varies between 0 and lnN/ln2; S0 varies between S0min and S0max).
2.5. Entropy Diagrams
Perhaps the greatest advantage afforded by the grading entropy concept is that the entire information of particle size distributions (grading curves) can be described using the entropy coordinates: that is, by a single point on an entropy diagram. Soils with different grain size distributions can be represented and compared with each-other in entropy diagrams (maps) where the (normalised) base entropy is the abscissa and the (normalised) entropy increment is the ordinate.
Four kinds of maps can be defined for a specified simplex Δ, determined by the number of the fractions N and the serial number of the smallest fraction imin. The non-normalized entropy map with coordinates [So, ΔS], the normalized entropy map with coordinates [A, B] and the two partly normalized entropy maps with a mixture of normalised and non-normalised coordinates; i.e., [So, B] or [A, ΔS].
Since the normalized and the non-normalized coordinates differ by a constant factor, it is enough to investigate one map only. These maps between the
N-1 dimensional simplex for fixed
N, and the two dimensional space of the entropy coordinates, are continuous on the open simplex and can continuously be extended to the closed simplex. Therefore, the images are compact, like the simplex. It follows then, that the image has a maximum and a minimum value for every possible value of
A or
So. These ideas are illustrated in the diagrams of
Figures 2 and
3.
The maximum normalized entropy increment
B, for a given normalized base entropy
A, assigns a single “average” or optimal grading curve with finite fractal distribution for each given
N. This maps to a point of the maximum
B line and it can be computed by conditional optimization, fixing the value of
A for a given
N and finding the mixture with maximum
B value (
Figure 4). The solution of the conditional optimization problem for a fixed
N and
A is the grading curve given by:
and:
where parameter
a is the root of the following equation:
Following from the Descartes rule of signs, polynomial
y has one (and only one) positive root for
a. As
A varies within its range [0, 1], the
a varies continuously between 0 and ∞ in a one-to-one, monotonic way. The unique grading curve is called an optimal grading curve, and it has finite fractal distribution with fractal dimension
n given by:
On a semi-logarithmic plot, the shape of the optimal grading curves is convex if
A <
0.5 and it is concave if
A > 0.5. Having no inflexion points (see
Figure 2d), out of the possible grading curves, the optimal grading curve with a specified
A has the shortest curve length.
The normalisation with respect to a coordinate results in the range being fixed in that direction. The image of the normalized entropy map contains a single unit, as the images of all continuous simplices nearly coincide. The image of the non- normalized entropy map contains several units, one unit for each continuous sub-simplex, reflecting the structure of the continuous sub-simplexes of a large simplex. This is illustrated in
Figure 5 for soils with up to seven fractions.
2.6. The Meaning of the Entropy Coordinates
The base entropy
S0 is the weighted mean of the fraction entropies. It is monotonically and uniquely related to the mean grain size, since it is basically equal to the mean fraction serial number,
imean:
The relative base entropy
A, is monotonically and uniquely related to the normalized mean grain size (there is no such a parameter in practice, although conceptually it is important), since it is basically equal to the mean fraction serial number (or normalized mean fraction number)
kmean:
Its value expresses the position of the mean diameter between the smallest fraction and the largest fraction. It varies between zero and one and its value is equal to 0.5 if the relative frequencies of all the fractions xj are equal.
The entropy increment Δ
S is a measure of the disorder of the grain system, which originates from the mixing of the fractions. However, there is another meaning for it. According to
Figure 5, the entropy increment Δ
S, as a function over the simplex, has a kind of contractive property. The major part of the inner simplex maps close to the maximum entropy increment value. Taking into account the contractive property of the entropy map, the value of
ΔS is typically close to ln
N/ln2 reflecting the number of fractions
N.
The lattice of the continuous sub-simplexes of the simplex (the one unit integers are the serial number of fractions, the k-unit integers denote k-component mixtures: k ≤ N) appears in the entropy diagrams, in the image of the optimal lines of the continuous sub- simplexes. Moreover, since the map is contractive, the image of the grading curves is situated at a point which depends on the base entropy S0 or imean which is the abstract mean grain diameter (or mean fraction number).
3. Elaboration of the Grading Entropy-based Rules
3.1. Approach
The grading entropy concept [
1] has been used to establish three “rules”: a grain structure stability criterion, a filter criterion and a segregation rule. Two parameters were carefully formulated from the entropy coordinates for each rule separately, considering the basic possible ways in which the statistical entropy of the soil grading might be affected by the different physical phenomena involved. The chosen entropy parameters for each mixture were plotted on entropy diagrams, differentiating points which exhibited different physical behavior so that domains of particular behavior in the figure could be used to define the rules (criteria).
For each rule, simple soil testing programs were designed and executed by using artificial mixtures of natural sand grains [
1]. In addition, other information (e.g., existing data such as [
4]) was collected from the available literature. For the grain structure stability criterion, simple flow or suffosion tests were carried out. Segregation susceptibility was investiged by some segregation tests [
1]. Filtering rules were derived from the data of filtration tests made by Lőrincz [
1] and Sherard [
4], and by reinterpreting some of the results of the suffosion tests, as is described in the next section.
3.2. General Knowledge Implied in the Rules
Two principles from the general knowledge of particle stability were used in the formulation of this work. The first, for the elaboration of the particle migration criterion, was the principle that two empty size fractions in a graded soil material may cause significant particle movement, referred to as self-suffosion (and hence, the suffosion test were mostly made on gap-graded soils to observe this effect). The second, for the elaboration of the filter criterion, was the principle that there can be no more than two empty particle size fractions between the filter and the base soil, before the base soil cannot be retained by the filter.
Although one principle applies to self suffosion in a single soil and the other to suffosion of particles from a finer (base) soil to a coarser (filter) soil, they are similar in that they both identify the onset of soil structure instability when gaps in the soil grading become excessive. The two principles are further related in the self-filtering theory of Kézdi [
9], which is extensively used in internal stability problems (see e.g., [
8]). This theory states that if the grading curve for a particular soil can be cut into two parts at any possible point, with the coarser part considered as the filter and the finer part as the base soil, with the base soil part being filtered at each point, then there will be no suffosion within the soil. Kezdi used the Terzaghi criterion [
16] for this purpose. The following filter rule for uniform (single fraction) filters and uniform (single fraction) granular base soils (
i.e., the finer soil to be protected) can be derived from the Terzaghi criterion for broadly-graded soils:
Dmin and dmax denote the minimum fraction size of the filter and the maximum fraction size of the base soil, respectively.
On the basis of these ideas, in this work it was assumed that if suffosion occurs in a suffosion test on an artificial gap-graded soil, then if that same soil were divided into two parts at the grading gap, the base soil part cannot be filtered in a filtering test by the filter soil part. In other words, the outcome of a suffosion test on a gap-graded soil can also be considered as an outcome of a filter test on the same soil divided to be a filter and a base soil.
Geometrical Explanation of Suffosion
In this section the mean of the ratio of the radius of the unit spheres and the radius of the maximum small sphere passing the pores is determined and, it is found that this value is typically close to 4. According to the fraction definition shown by
Equation (4), this means two empty fractions between the unit radius spheres and the wandering spheres.
Consider a loose and a dense packing of uniformly-sized, unit radius spheres (R), and the maximum size of a smaller sphere rmax which can pass through the voids between them in each case. The loosest regularly-packed state exists when the unit radius spheres are arranged in a primitive cubic lattice, where spheres are stacked in layers to form a square pattern within each layer, and with spheres perfectly aligned on above the other in successive layers. In this case, the largest spheres that can permeate the space between them have a radius (rmax) of
units (the smallest pore is on the face of the cube), and the ratio is R/rmax = 1/0.414 = 2.41 (the largest pore diameter is
units on the space diagonal, but whilst such a diameter sphere can occupy the space, it is unable to move from it).
The densest state is the so-called hexagonal close packed state, when the unit radius spheres are situated in a regular tetrahedral arrangement. (Hales [
17] proved that no denser structure exists, however, the random unit radius sphere packings may have similar density [
18]). In this case, the largest spheres that can permeate the space between them have a radius (
rmax) of
(the smallest pore is on the triangle) and the ratio is
R/
rmax = 1/0.1547= 6.45. (In the octahedron the largest pore size is
situated on the square, in the tetrahedron the largest pore size is
, situated on the halving plane generated by an edge and the midpoint of the parallel edge).
Since the extreme values of R/rmax are 2.41 and 6.45, with an average value of R/rmax = 4.4, it is reasonable that in a typical state, R/rmax might be approximately equal to 4. In a fraction size structure based on a multiplication factor of two (the size of the next biggest fraction is twice that of the last) a ratio of 4 is equivalent to two size fraction. Therefore, suffosion may occur typically where there are two empty fractions and the precise limit of the safe and unsafe domains can be studied using gap-graded grading curves.
3.3. Internal Stability and Particle Migration Rule from the Test Data of Lőrincz
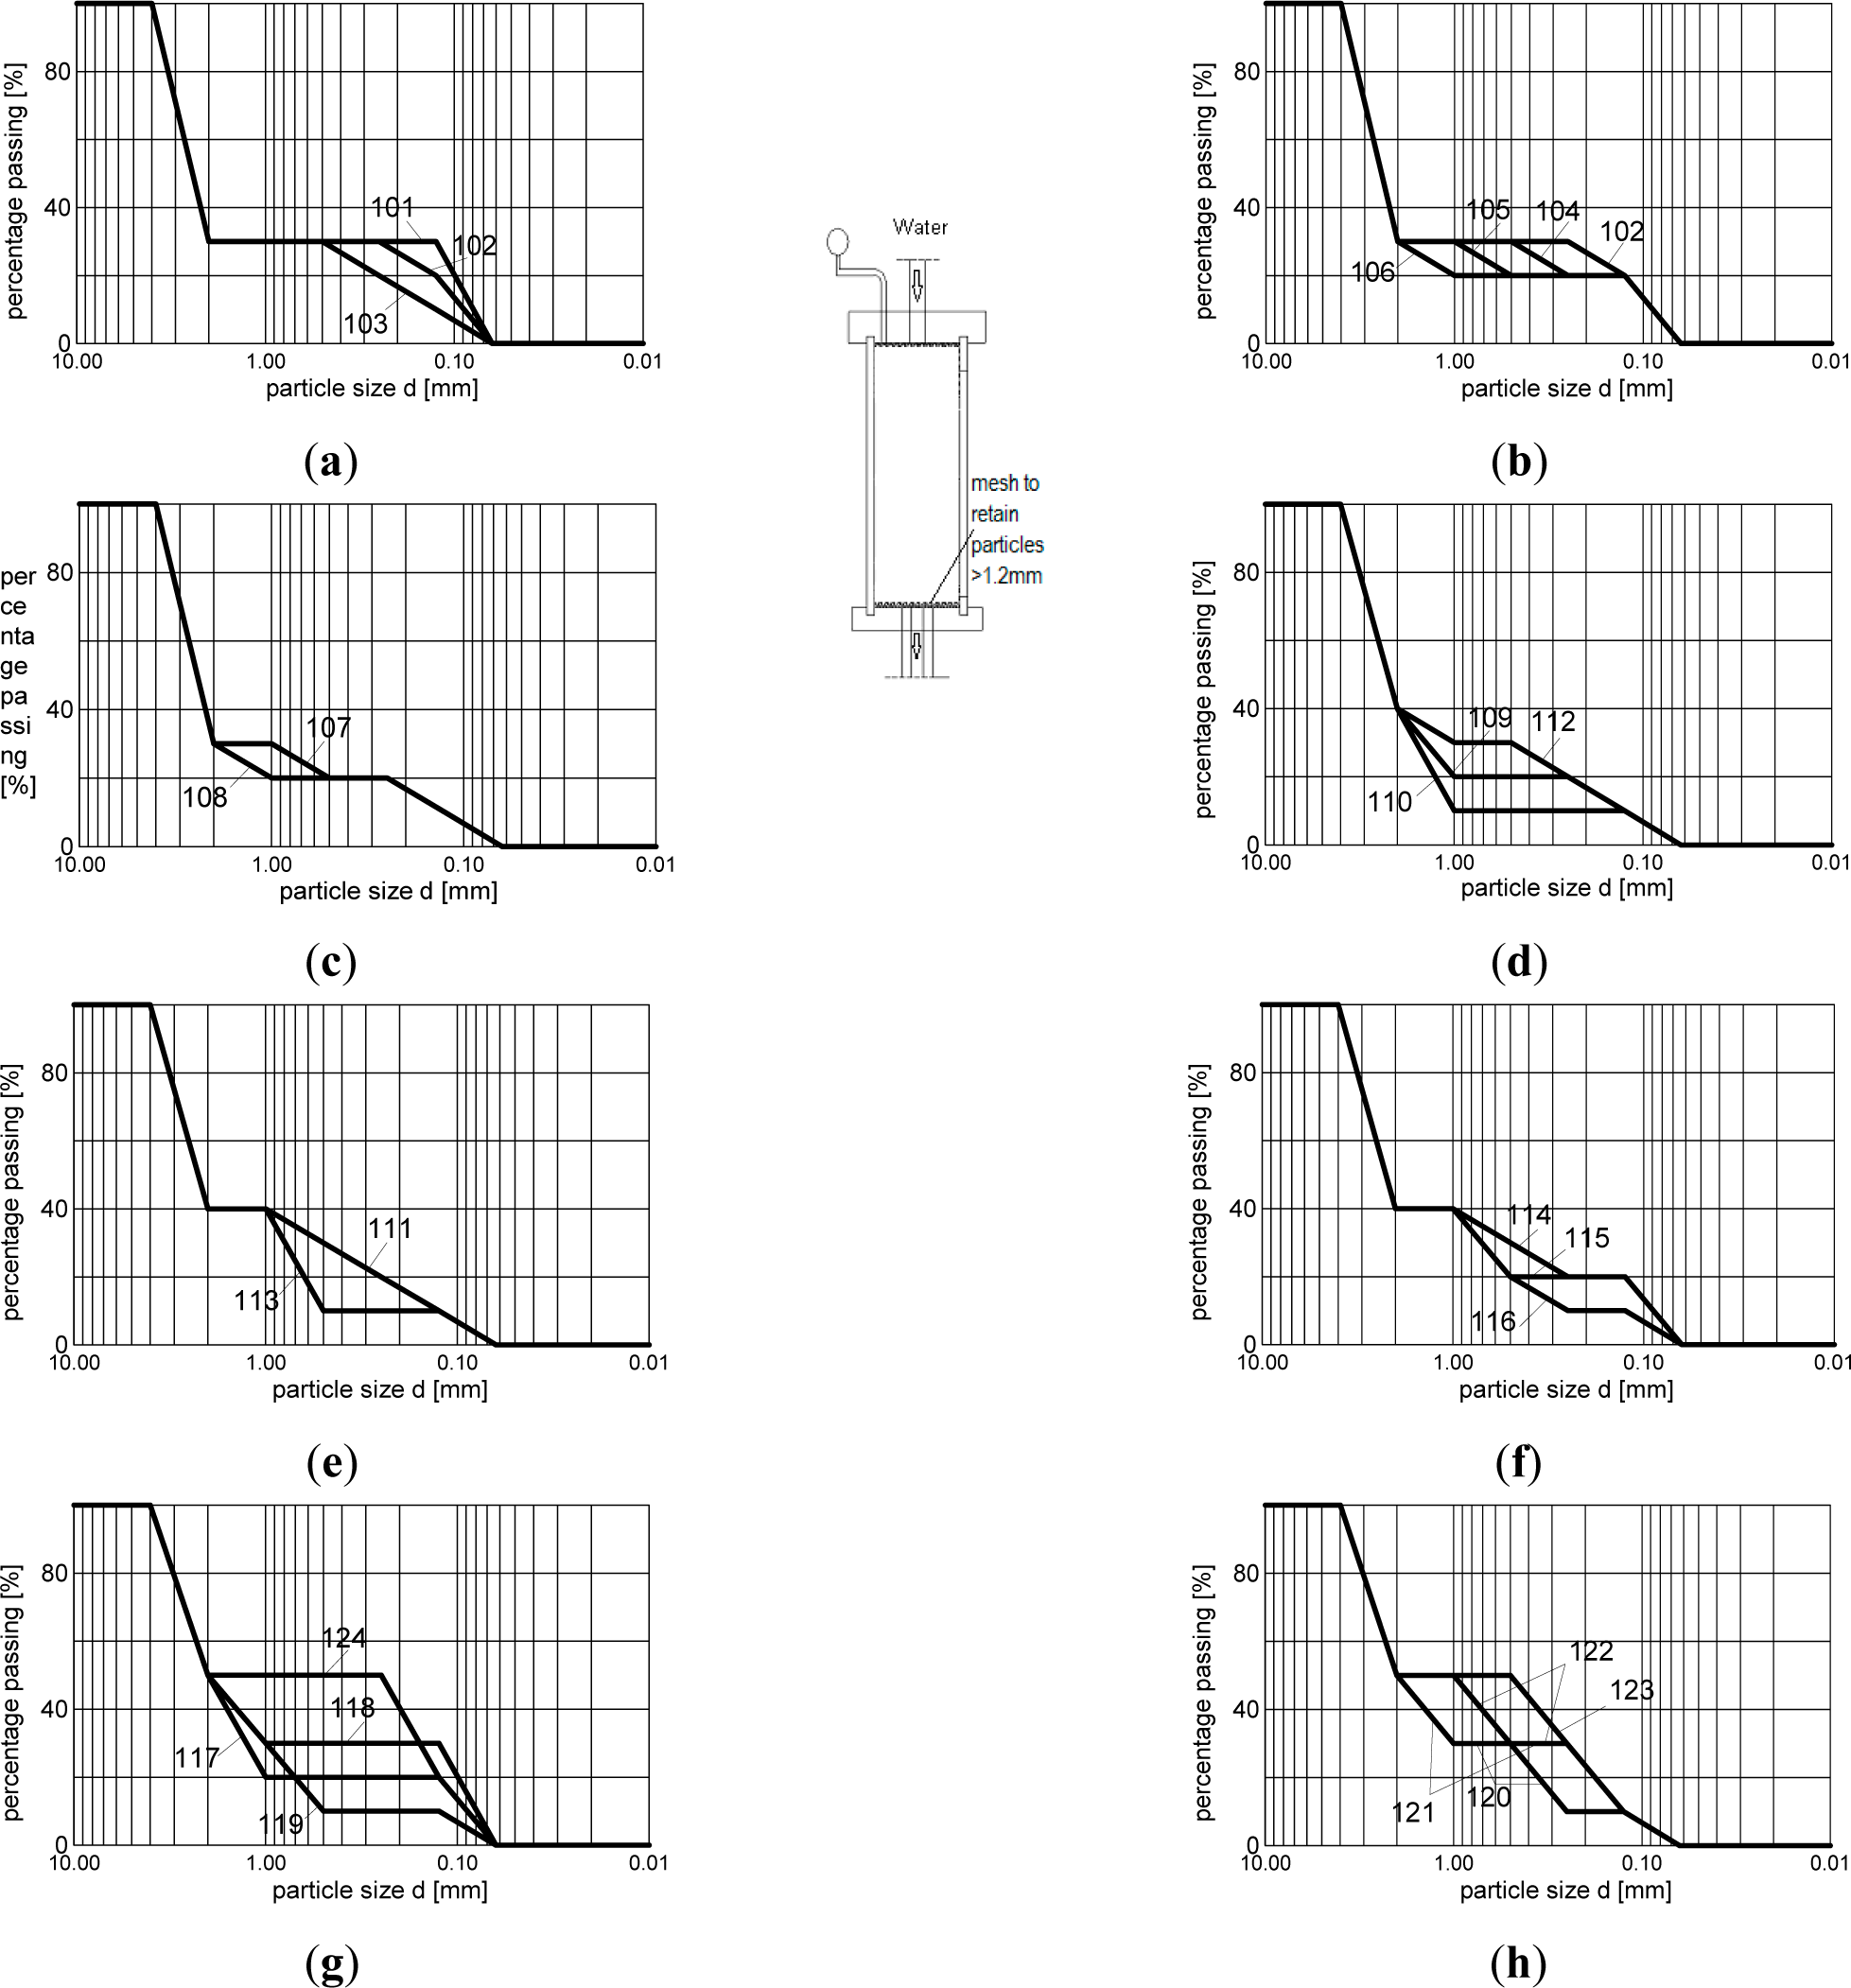
For the elaboration of the particle migration criterion, some vertical water flow (suffosion) tests were carried out by Lőrincz [
1]. In these tests, the soil was placed into a cylindrical permeameter (20 cm height and 10 cm diameter; shown in the inset in
Figure 6 bounded at the bottom by a mesh which permits passage of particles smaller than 1.2 mm, but retain particles larger than 1.2 mm. A downward hydraulic gradient
i of between 4 and 5 is applied. By separating the sample into two parts at the end of the test, and performing size distribution analyses, any particle movements can be detected. Some typical curves for the samples used in the suffosion tests are presented in
Figure 6.
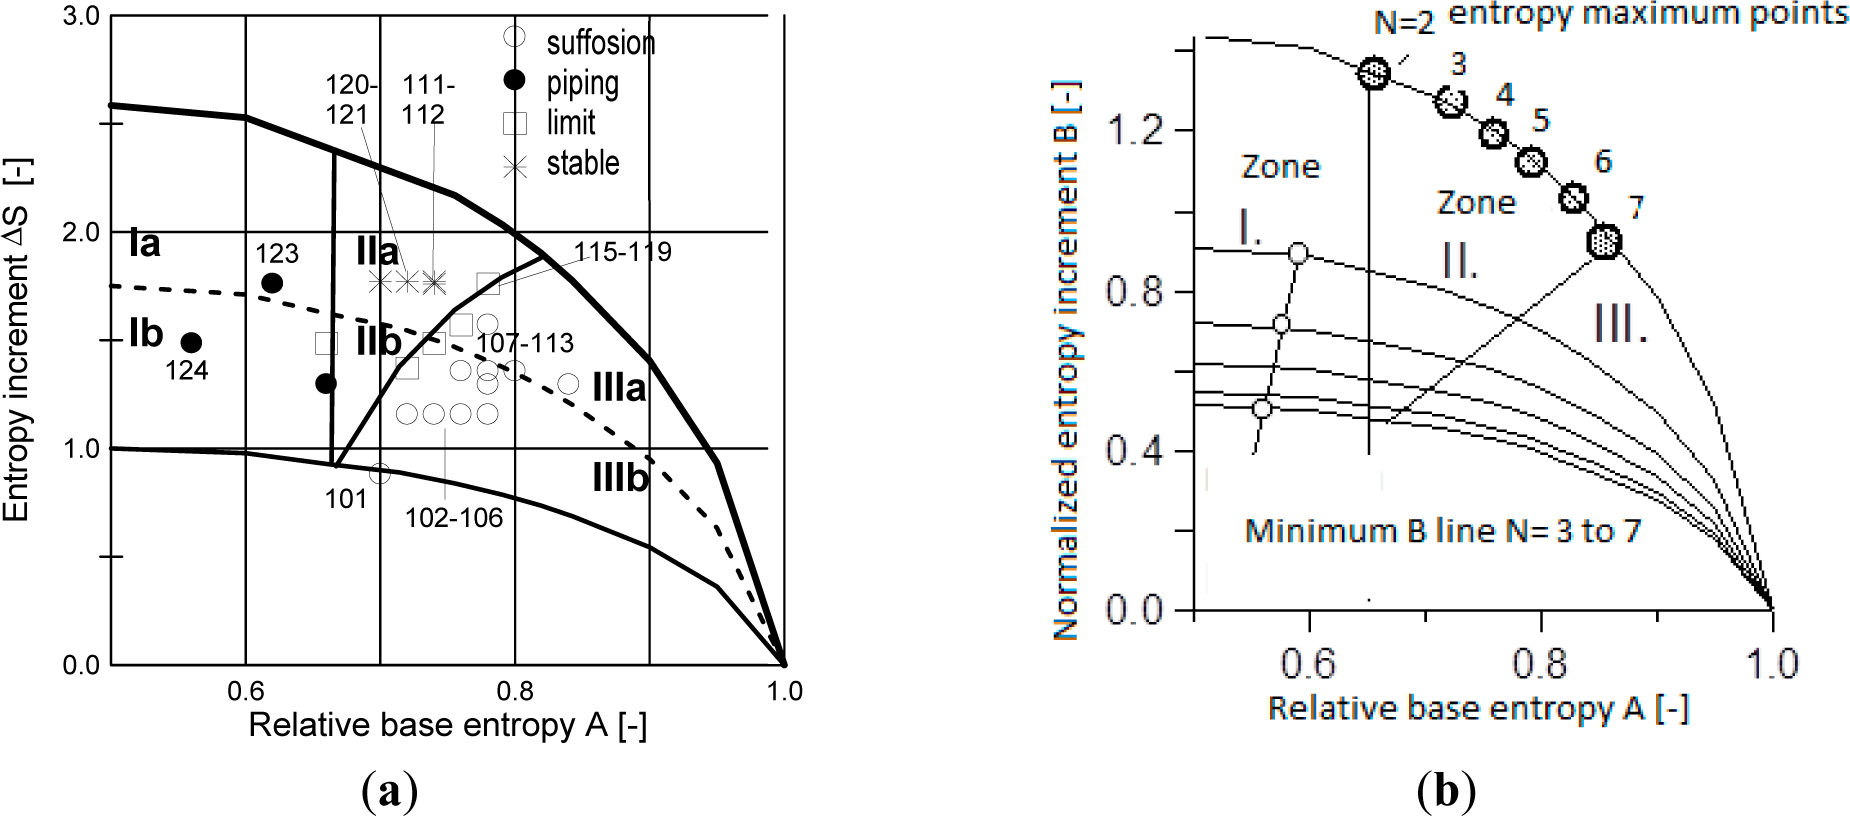
In some of the tests, stable grain structures were observed (there was no particle erosion or migration); in others there was migration of finer particles (suffosion) and in others, piping was observed. The results are represented in
Figure 7a on, a partly normalised entropy diagram, with entropy coordinates
A and
ΔS. The different sample responses are represented by different symbols and the criterion was separately set up for each specified
N value.
The grouping of the different responses, indicated by the different symbols in
Figure 7a, allows the soil structure stability zones to be identified in the entropy diagram. If
A < 2/3 (Zone I), the structure of the large grains is unstable, and smaller particles can be dislodged so that piping or total erosion may occur. This result can be interpreted as corresponding to a phenomenon where the coarser particles “float” in the matrix of the finer ones, and become destabilized when the finer particles are removed.
If A > 2/3 the coarser particles form a resistant skeleton, and total erosion cannot occur. In Zone II, the structure of smaller and larger particles is inherently stable, and there are no particle movements: the larger particles retain the smaller particles, and the smaller particles support the larger ones.
In Zone III, the fines may migrate in the presence of seepage flow (“suffosion”), but they are unable to cause collapse of the structural skeleton of coarser particles.
In
Figure 7a, the lower part of the diagram, where gap-graded grading curves with self-suffosion are mapped, is indicated by letter
b. The division curve—between zones II and III—connects the maximum entropy points where
N is less than the
N value related to the diagram. The identified stability zones are shown on the normalized diagram in
Figure 7b. It can be seen that they depend on
N, since the minimum
B line and the line between zones II and III are dependent on
N; the self-suffosion zone is not represented.
3.4. Filter Criterion
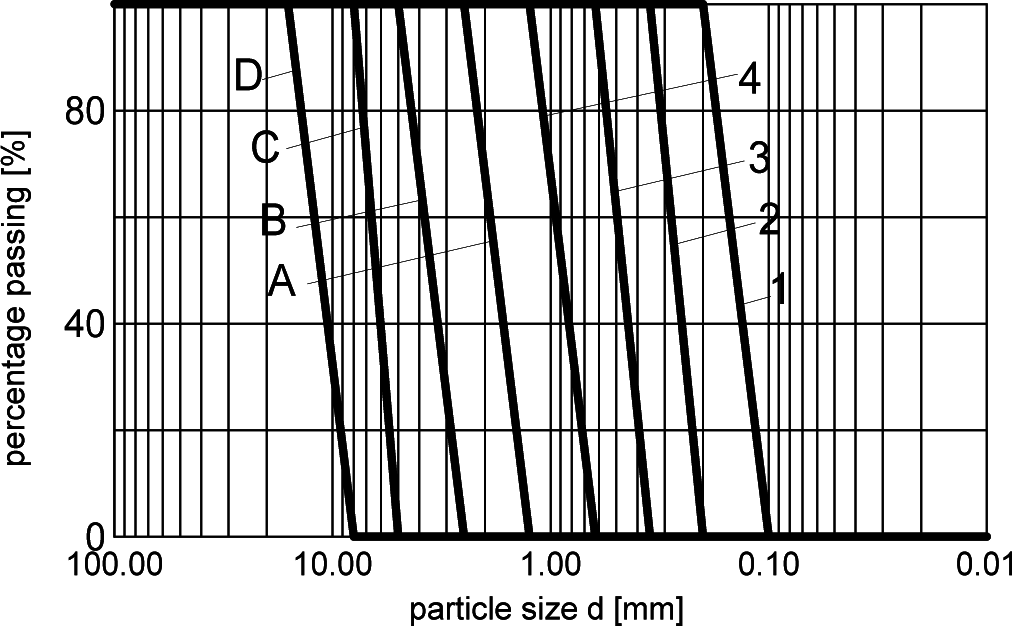
The development of a criterion to decide if a mixture acts as a filter for an adjacent layer (
i.e., for the base soil) was based on two series of tests: those of Sherard [
4] and those of Lőrincz [
1]. The gradings of the soils tested by Sherard are shown in
Figure 8 and the grading of the soils tested by Lőrincz are shown in
Figure 9. In each series of tests, a layer of filter was placed on top of a layer of base soil in a cylindrical permeameter, similar to that used in the suffosion tests, and similar downward hydraulic gradients of between 4 and 5 were applied. The arrangement used in the tests of Sherard is shown in
Figure 8a. In addition, the gap-graded soils tested in the suffosion tests described in the previous section were re-analysed using the principles discussed in Section 3.2 related to the self-filtering theory of Kézdi [
9]. That is, the gradings were divided into two parts at the gap, and the coarser part was regarded as the filter and the finer part regarded as the base soil. In this way the outcomes of the suffosion tests of Lőrincz [
1] could be re-analysed to give additional information for the filter rule.
Two grading entropy-based variables were defined to characterize the grading curves. The first variable is the logarithm of the difference between base entropies of the filter and base soils, ln(Sof−Sob), which describes the distance between the mean diameters of the filter and the base soils. The second variable is the sum of the filter and base soil entropy increments, ΔSf + ΔSb, which expresses the sum of the two N values (i.e., the total number of fractions in the two grading curves), since the maximum value of ΔS is dependent on N (i.e., lnN/ln2) and most mixtures of soils with a specified ΔS value map generally close to the maximum point of the maximum ΔS line.
Plotting the test results in this coordinate system, a straight line approximation can be drawn to separate the “safe” and “unsafe” areas. The filtering rule for “safe” filtering arrangements is thus given by the equation of this line as follows:
The point where ΔS = 0 is fixed on the basis of the one fraction case, from the assumption that in the limit state, two empty size fractions do exist between the filtering fraction and the filtered fraction. Note also that the straight line approximation for large coordinate values is estimated on the basis of one sample point only.
3.5. Segregation Criterion
To decide if a mixture is prone to segregation or not, the following laboratory testing approach was used. In the typical laboratory test to determine the maximum void ratio (which corresponds to the loosest condition), a granular soil is poured into a funnel which delivers it at a steady rate into a cylinder (usually 10 cm high and 10 cm diameter). The spout of the funnel is held to be just above the soil surface as it rises. To test for segregation, maximum void ratio tests were made on many different mixtures of soil fractions. Gradings of the tested mixtures are represented in
Figure 11. In each case, the test started with about double the quantity that would fill a 10 cm diameter, 10 cm high cylinder. It was mixed carefully before being placed into the funnel. After half of the material had fallen from the funnel to fill the cylinder, the grading of the sample captured by the cylinder was measured. The tendency to segregate whilst running from the funnel was assessed from the difference between the gradings of the initial and poured samples, expressed in terms of differences of the base entropy
S0, the entropy increment Δ
S and the total grading entropy
S, using the calculated data given in
Appendix A1.
The results were represented as a function of the relative base entropy
A in
Figure 12. According to the results of the segregation tests, significant segregation is unlikely to occur, if the relative base entropy
A of the soil is between the limits of 0.4 and 0.7. Outside this range, soils may be prone to segregate.
5. Discussion and Conclusions
5.1. The Grading Entropy Coordinates
The grading entropy parameters have simple physical meanings: the base entropy is basically equal to an abstract mean grain diameter; the relative base entropy A reflects where the mean grain diameter is situated within the range of the particle diameters. It can be considered as a measure of the internal stability by the simple fact that if the proportion of the large particles is great enough (the normalised mean fraction number is close enough to the maximum particle size) then large grains may form a skeleton.
The entropy increment describes the disorder of the grading curve. Due to the contractive property of the map, it measures how much the relative frequency of the fractions are equal, that is, how much the soil behaviour is really influenced by all of its N fractions. For those grading curves, in which all N fractions are well represented, the entropy increment is typically close to lnN/ln2.
The entropy coordinates are useful for the elaboration of the rules since: (i) they incorporate and combine all of the measured grading test data, (ii) they are pseudo-metrics which can characterize the difference between two grading curves, such as variations in the grading curves of the homogenised and segregated mixtures or the gap between the filter and base soils, (iii) they classify the soils in a manner which reflects the mean diameter and the fraction number on the entropy diagram.
5.2. The Internal Stability Rule
Structural instability in a soil is described by the criterion that A < 2/3, and in these situations, the coarse grains are unable to form a skeleton, and the finer grains are unable to lock themselves or the coarser grains into a stable arrangement. When subjected to a hydraulic gradient, smaller grains may be carried from the soil leaving the larger grains to collapse and follow them, resulting in the growth of a self-perpetuating void. The growth of this void, usually in the increasing direction of the hydraulic gradient, leads to the formation of a pipe, which can ultimately lead to a piping failure.
Overall soil stability is described by the criterion that A > 2/3. In soils which meet this criterion, the matrix of coarser soil particles is stable and able to form a resistant skeleton. The physical significance of this criterion is that a relatively high value for A means that the normalised mean fraction number is close enough to the maximum particle size, and the proportion of the large particles is great enough form a skeleton. Soils which satisfy the A > 2/3 criterion may be prone to localized migration of smaller particles by suffosion, and a separated zone is identified in the entropy diagram to recognize these soils. However, suffosion is unlikely to have a significant effect on the overall stability of a soil.
The dam in the Gouhou reservoir failed during its first water filling. Observations of the failure are consistent with failure due to piping. In this paper, support for this hypothesis has been provided the application of the particle migration criterion to the materials used in the construction of the dam. The lesson learned from this case study is that even high quality rock-fills may have unstable structure (A < 2/3) which means that cannot achieve a stable skeleton composed of its largest grains.
A very important question arises in regard to the stability of a single fraction which does not lie in a unique position on the entropy diagram. The case of a single fraction is unclear. It is not sure that the formation of the stable structure is ensured, although the condition of a single fraction in an engineering material seldom arises, as the grains are usually crushed to some degree during construction. However, uniform, very good quality stone fills with no particle crushing during construction may be unstable and more research is needed to better understand this situation.
Another issue which lies beyond the present discussion, but which requires further research, is whether materials which have an unstable structure according to the grading entropy criterion may also be prone to erosion when exposed to water flow at the ground surface.
5.3. The Filter Rule
Filtration problems for uniform filters and granular bases (i.e., soils to be protected by the filters) have long been solved to a reasonable extent. Where doubt may arise is their application to broadly-graded filters or to broadly-graded or silt-clay base materials. This paper gives a unified filter rule for any filter, based on the idea that the grading entropy coordinates can be used in metrics which characterize the difference between two grading curves; i.e., the distance between the filter and base soils. It includes the basic observation that the entropy increment ΔS characterizes the fraction number N which is essential for broadly-graded filters.
At present, the available filter rules are related to single fraction and broadly-graded filters and several rules are available. In each case, these are based on a only few parameters from the grading curve. The rule established in this paper is a general filter rule based on the data of the whole grading curve. Using the general filter rule elaborated here, the existing rules were tested. It was found that Terzaghi’s filter rule, Bertram’s rule [
25] and the rule recommended by the U.S. Bureau of Reclamation (USBR) for uniform filters are reliable, but the mixed filter rule of the USBR [
24] and Cistin [
26] may not be reliable.
5.4. The Segregation Rule
Broadly-graded silt-sand-gravel soils are prone to segregation during placement of earthworks or in the formation of laboratory test specimens. A segregation criterion has been elaborated on the basis of flow tests. Using this rule, and the equations of grading entropy presented in this paper, non-segregating artificial compositions of natural grains can be constructed.
5.5. The Use of the Rules
All of the grading entropy-based criteria can easily be implemented into any laboratory test evaluation software and are simple to use. A similar opportunity exists for the approach which can be used for the computation of non-segregating mixtures. A basic requirement is that the grading curve information should be reliable. The rules presented here were elaborated on the basis of simple soil tests made on relatively coarse granular mixtures (only). The criteria apply unconditionally for soils where the solid fraction is composed of non-clay minerals, but the same criteria may be valid for silt-clayey soils if the grading curve information is reliable. For soils with solid fraction composed of clay minerals it is necessary that the composition of the water used for grading test is identical to the chemical composition of the ground water ([
27–
30]) so that an appropriate degree of particle agglomeration is reflected in the measurements.
5.6. Suggestions for Further Research
It is suggested that the mean grain diameter and normalized grain diameter could be introduced as parameters into everyday geotechnical practice since these have a physical meaning and can be related to other parameters and properties. The base entropy S0 and the relative base entropy A have one-to-one relationships with the mean grain diameter and normalized grain diameter. Using the concept of the fraction serial number, an abstract, mean or mean normalized fraction number can be defined in terms of the fraction serial number i, denoted by imean and kmean respectively.
The relative base entropy A measures where the mean grain diameter is situated within the range of the particle diameters. It was found that it can be considered as a measure of the internal stability by the simple fact that if the proportion of the large particles is great enough (the normalised mean fraction number is close enough to the maximum particle size) then large grains may form a skeleton.
The Discrete Element Method (DEM) would be a useful tool for further research, and work is suggested on several aspects such as (i) the internal stability criterion concerning the formation of the stable structure, (ii) the internal stability criterion for the one fraction case, and (iii) the reason for the similarity between the internal stability criterion and the segregation criterion (i.e., the significance of the A = 2/3 point).
Further experimental research is suggested on the appropriateness of the straight line approximation of the filter rule for coarse grained mixtures and on the relationship between the internal stability criteria and erosion criteria.


