Article

Local Band Spectral Entropy Based on Wavelet Packet Applied to Surface EMG Signals Analysis

Key Lab of Measurement Technology and Instrumentation of Hebei Province, Institute of Electric Engineering, Yanshan University, Qinhuangdao 066004, China
*
Author to whom correspondence should be addressed.
These authors contributed equally to this work.
Entropy 2016, 18(2), 41; https://doi.org/10.3390/e18020041
Submission received: 18 September 2015 / Revised: 31 December 2015 / Accepted: 18 January 2016 / Published: 26 January 2016

Abstract

:
An efficient analytical method for electromyogram (EMG) signals is of great significance to research the inherent mechanism of a motor-control system. In this paper, we proposed an improved approach named wavelet-packet-based local band spectral entropy (WP-LBSE) by introducing the concept of frequency band local-energy (ELF) into the wavelet packet entropy, in order to characterize the time-varying complexity of the EMG signals in the local frequency band. The EMG data were recorded from the biceps brachii (BB) muscle and triceps brachii (TB) muscle at 40°, 100° and 180° of elbow flexion by 10 healthy participants. Significant differences existed among any pair of the three patterns (p < 0.05). The WP-LBSE values of the EMG signals in BB muscle and TB muscle demonstrated a decreased tendency from 40° to 180° of elbow flexion, while the distributions of spectral energy were decreased to a stable state as time periods progressed under the same pattern. The result of this present work is helpful to describe the time-varying complexity characteristics of the EMG signals under different joint angles, and is meaningful to research the dynamic variation of the activated motor units and muscle fibers in the motor-control system.

1. Introduction

Surface electromyogram (EMG) activities have been reported that can represent the inherent characteristics and movement intention in motor-control systems, which are widely used in the field of prosthesis control [1,2], rehabilitation [3,4], muscle fatigue analysis [5,6] and clinical diagnosis [7,8]. An accurate and efficient analytical method, therefore, is of great significance to differentiate the motor patterns and explore the potential mechanism for motor control and function evaluation.
Over last few years, lots of techniques, such as root mean square (RMS) [9], short-time Fourier transform (STFT) [10] and mean power frequency (MPF) [11], have been applied to analyze the energy features of the EMG signals in the time or frequency domain. The simple time domain or frequency domain feature methods contribute to the online anaysis and classification of the EMG signals due to their lower computational complexity and less time consumption, but they have some limitations in the process of non-stationary signal and feature extraction in high resolution [12], which lose sight of the mirror changes in motor unit action potentials (MUAPs). According to the physiological properties of the EMG signal, the discriminable features often hide in some narrower frequency bands [13]. Therefore, techniques need to be developed for further analysis of the non-stationary signal with high resolution.
The theories of wavelet transform (WT) and wavelet packet transform (WPT) [14,15,16,17,18], as an effective tool to describe the local-band characteristics, are introduced to decompose the EMG signals into several sub-bands or sequences of coefficients in different time-frequency resolutions. In particular the wavelet packet transform is widely applied due to the high resolusion in high and low frequency. The application of the WPT combining the spectral energy distribution, named the WPE, further reveals the temporal energy distribution in the considered sub-bands of the EMG signals [19,20] and accounts for different properties in various motion patterns [21], These methods can exploit the discriminable features in the local frequecy band.
Additionally, multivariate techniques and nonlinear methods have been developed in recent years. The independent component analysis (ICA) [22,23], the principal component analysis (PCA) [24,25] and the nonegative matrix factorization (NMF) [26] have been widely used for the EMG channel minimization [27,28,29] and classification [29,30,31,32,33]; the correlation dimension [34], the maximum Lyapunov Exponent [35], the complexity [36] and the information entropy [37] have been applied into the nonlinear analysis of the EMG signals. Especially, the exrtensive entropy-based measures, such as the Kolmogorov–Sinai (K-S) entropy [38], the approximate entropy (ApEn) [39,40] and the sample entropy (SampEn) [41,42], have achieved many applications in bioelectricity signals processing. These methods can describe the order/disorder features in all the frequency ranges, but lose the insight of the information in a specific frequency band. The combination of the wavelet or wavelet packet with information entroy, named wavelet entropy (WE) [43] or wavelet packet entropy (WPTE) [44] can describe the complex features in the local frequency band, and has been applied for feature extraction and pattern classification. However, this combination has limitation in describing the time-variation characteristics in the local frequency band. In order to resolve this problem, the concept of frequency band local-energy (ELF) which can denote the energy distribution with time variation in each frequency-bandis widely adopted in fault diagnosis [45] and endpoint detection [46]. Therefore, the combination of wavelet packet, frequency band local-energy and information entropy could have mutual compensation functions in analyzing the time-varying complexity characteristics of the EMG signals in the local frquency band. To account for the hypothesis that the firing of the motor units and the discharge of muscle fibers play an important role in modulating the contraction of muscle groups to generte different motor patterns, a novel algotithmic model is designed to describe the time-varying complexity features of the EMG signals and to provide new insight into the physiological systems.
This study attempts to explore the potiental mechnism of the motor control under different motor patterns using the proposed novel approach named wavelet-packet-based local band spectral entropy (WP-LBSE) by introducing the concept of ELF into the wavelet packet entropy. This study involves the investigation of the EMG signals recorded from the flexor muscle (biceps brachii (BB)) and extensor muscle (triceps brachii (TB)) under three motor patterns (elbow flexion at 40°, 100° and 180°) by 10 healthy participants. This studies can provide new insgiht into the time-varying complexity characteristics of the EMG signals in the local frequency band and add to the understanding of the mechanisms underlying the motor control. The results demonstrate the efficiency and reliability of this new algorithm.

2. Experimental Section

2.1. Participants

Ten healthy subjects (six males, mean age, 25.2 ± 2.3 years; ranging from 22 to 28 year old) without any history of neurological disease were enrolled in the study. These subjects were tested according to the Oldfield questionnaire [47]. The experiment, in which all subjects participated, was in accordance with the Declaration of Helsinki and the whole experiment obtained the consent and approval from the local ethics committee. All subjects who participated had no similar experimental experiences before.

2.2. Data Recording and Experimental Paradigm

2.2.1. Experiment Paradigm

During the experimental session, the subjects sat in an electrically shielded, dimly lit room. All subjects were instructed to perform elbow movement at different angles with their dominant arms on the fixed flat as shown in Figure 1A. The fixed flat was a frame with four crossed bars and there was a hole to place the electrode to acquire the signals, so the EMG signals from the TB muscle cannot be disturbed by the flat. Firstly, their arms were placed with the elbow flexion at 100°, which was defined as the intermediate reference position (see Figure 1B). Based on the reference plane, the elbow flexion at 180° corresponded to the full elbow extension (Figure 1C) and the elbow flexion at 40° corresponded to the full elbow flexion (Figure 1D). To enhance the activities of muscle, all subjects were required to finish an action with 1.5 kg dumbbell in their hands. Each pattern maintained 5 s contraction with 5 s rest in between, and the whole movement included ten sessions. The ten sessions for the same pattern were carried out one after another without any mixture of different patterns. Thirty data sets of EMG signals were recorded in total.
Figure 1. Experimental setup. (A) Schematic diagram of EMG signal acquisition experiment showed the position of elbow flexion and electrodes placement; (B) 100° intermediate state; (C) 180° of elbow extension; (D) 40° of elbow flexion.
Entropy 18 00041 g001

2.2.2. Data Recording

The surface EMG was digitized at a sampling frequency (1000 Hz) and amplified (2000×) by a Trigno™ Wireless EMG (Delsys Inc., Natick, MA, USA). Off-line data were further processed and analyzed in the MATLAB (R2013b) environment. The EMG signals were acquired from the BB muscle and TB muscle. The electrodes were placed on the muscle belly along with the muscle fibers. The skin at the electrodes sites were prepared by shaving and rubbing with alcohol.

2.3. Data Analysis

2.3.1. Data Preprocessing

EMG signals are very easily contaminated by baseline drift, slight tremors and the power line interference (50 Hz and its higher harmonics). In order to remove the artifacts in EMG signals, a preprocessing scheme was designed in this study. The slight tremors (>250 Hz) were isolated by a 1–250 Hz band-pass filter (digital 8th-order Butterworth) and the baseline drift was removed by an adaptive high-pass filter (digital 8th-order Butterworth). Then the power line interference was suppressed using independent component analysis (ICA). The signal to noise ratio (SNR) of the preprocessed EMG signals is 23.46 dB according to the calculation method [48].

2.3.2. Wavelet-Packet-Based Local Band Spectral Entropy

In this paper, preprocessed signals were decomposed into N-th resolution levels based on the WPT, and 2 N subspaces in frequency domain can be obtained correspondingly. The sub-signal at the j-th subspace on the N-th level can be reconstructed by:
S N j ( t ) = k D k N , j ψ j , k ( t )       N , k Z      j = 1 , 2 , , 2 N
where D k N , j is the wavelet packet coefficient at the j-th subspaces on the N-th level and ψ j , k ( t ) is the wavelet function. The reconstructed signal S N j ( t ) is also divided into m parts in time domain, and the energy of each frequency band in different time periods, called frequency band local energy, is calculated. Then a sequence of energy, { E N j m ( k ) | k = 1 , 2 , , 2 N m } is obtained.
The total energy in each time period is:
E m = k = 2 N ( m 1 ) + 1 2 N m E N j m ( k )
In consequence, the relative energy at the j-th subspaces in the m-th period of time is:
p N j m ( k ) = E N j m ( k ) E m
where p N j m ( k ) quantifies the probability distribution of the frequency spectral energy in different time intervals.
Shannon entropy is introduced to analyze the complexity of the EMG signal and reduce the feature dimensions of frequency band local-energy. Then the frequency spectral energy distribution in different time periods of EMG signal is measured as follows:
E n m = k = 2 N ( m 1 ) + 1 2 N m p N j m ( k ) ln p N j m ( k )
where Enm is the WP-LBSE value in the m-th time interval, which can describe the nonlinear, time-varying and complex energy distribution of EMG signals. The same processes were carried out for all the preprocessed EMG signals of three motor patterns (40°, 100° and 180° of elbow flexion).

2.4. Statistical Analysis

SPSS Version 19.0 (SPSS Inc., Chicago, IL, USA) was used for the statistical data analysis. The WP-LBSE values under the three motor patterns were compared by the paired sample t-tests to distinguish the differences. The statistical significance was set at p < 0.05.

3. Results and Discussion

3.1. Results

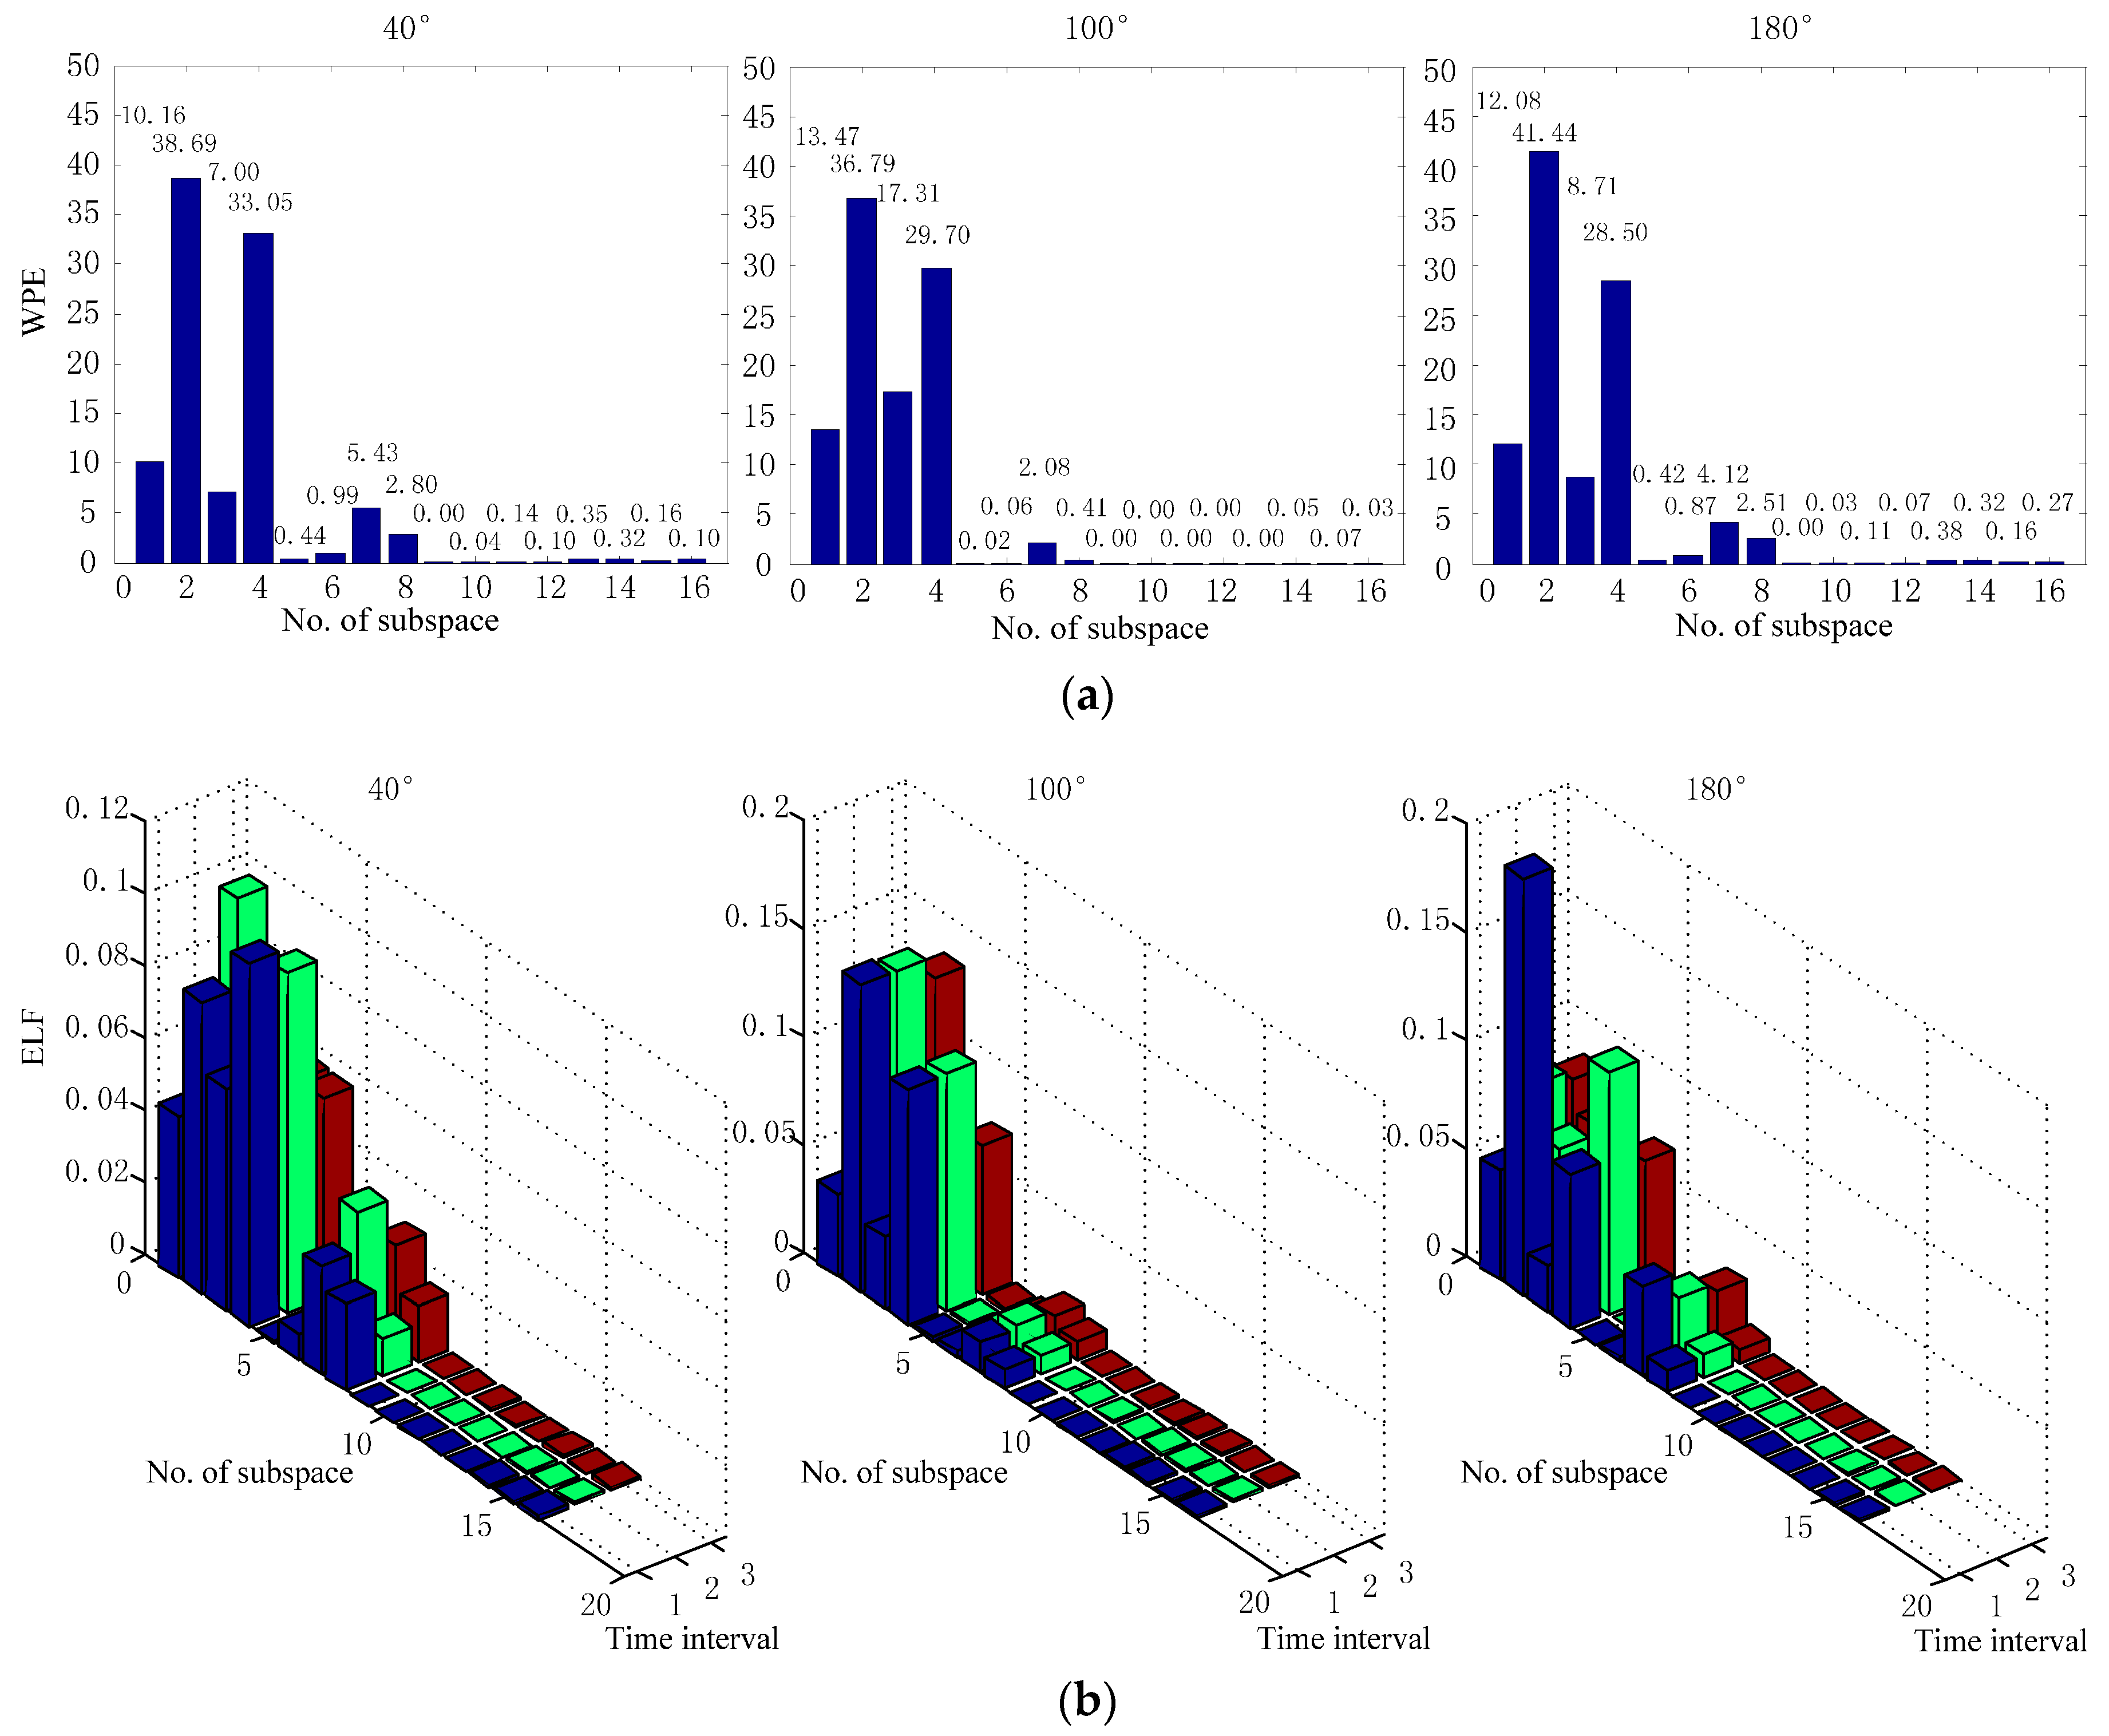
3.1.1. Wavelet Packet Energy and Frequency Band Local-Energy

In this paper, the EMG signals recorded from the BB muscle and TB muscle under three patterns (elbow flexion at 40°, 100° and 180°) were analyzed according to the above procedures. Considering the EMG signals without clear physical significance in specific frequency, we need to choose appropriate WPT resolution levels. Previous studies on the WPT applied in EMG analysis mainly choose resolution levels between three and five [12]. In our study, the resolution levels were chosen from three to seven for further analysis. The analytical results in different resolution levels showed that the relative energy in each subspace under four resolution levels was significantly different from the others. However, there was no significant difference between the relative energies in adjacent subspaces when the EMG signals were divided into five, six or seven resolution levels. As a result, the preprocessed EMG signals were decomposed into four resolution levels and the whole bands were correspondingly divided into 16 frequency subspaces. The wavelet-packet energy (WPE) of each subspace was calculated as depicted in Figure 2a. Next, the reconstructed signal in each subspace was divided into three time intervals, and the frequency band local-energy of the EMG signals was also calculated as showed in Figure 2b.
Figure 2. The WPE and frequency band local-energy of EMG signal under three action states (40°, 100° and 180°of elbow flexion).(a) is WPE calculated by the WPT method. (b) shows the frequency band local-energy.
Entropy 18 00041 g002
The three motor patterns yielded almost the same distributed regularity covering all the frequency bands, as shown in Figure 2a. Further analysis showed that the WPE for each EMG signal was dominant in the range of 1–125 Hz (1st, 2nd, 3rd and 4th subspaces). Statistic analysis indicated that there was no significant difference among different joint angles (t = 0.285, p > 0.05). Figure 2b shows that the frequency band local-energy was most dispersive at the elbow angle of 40°, but concentrated at the elbow angle of 180°. In addition, the distributions of the spectral energy were decreased to a stable state as time progressed under the same pattern. For example, the frequency band local-energy of the EMG signals in the first time interval under 180° of elbow extension mainly focused on 31.25–62.5 Hz (2nd subspace) band and 93.75–125 Hz (4th subspace) band ranges, but the spectral energy of the other two time-intervals was more dispersive. An analogous case occurred in the TB muscle.

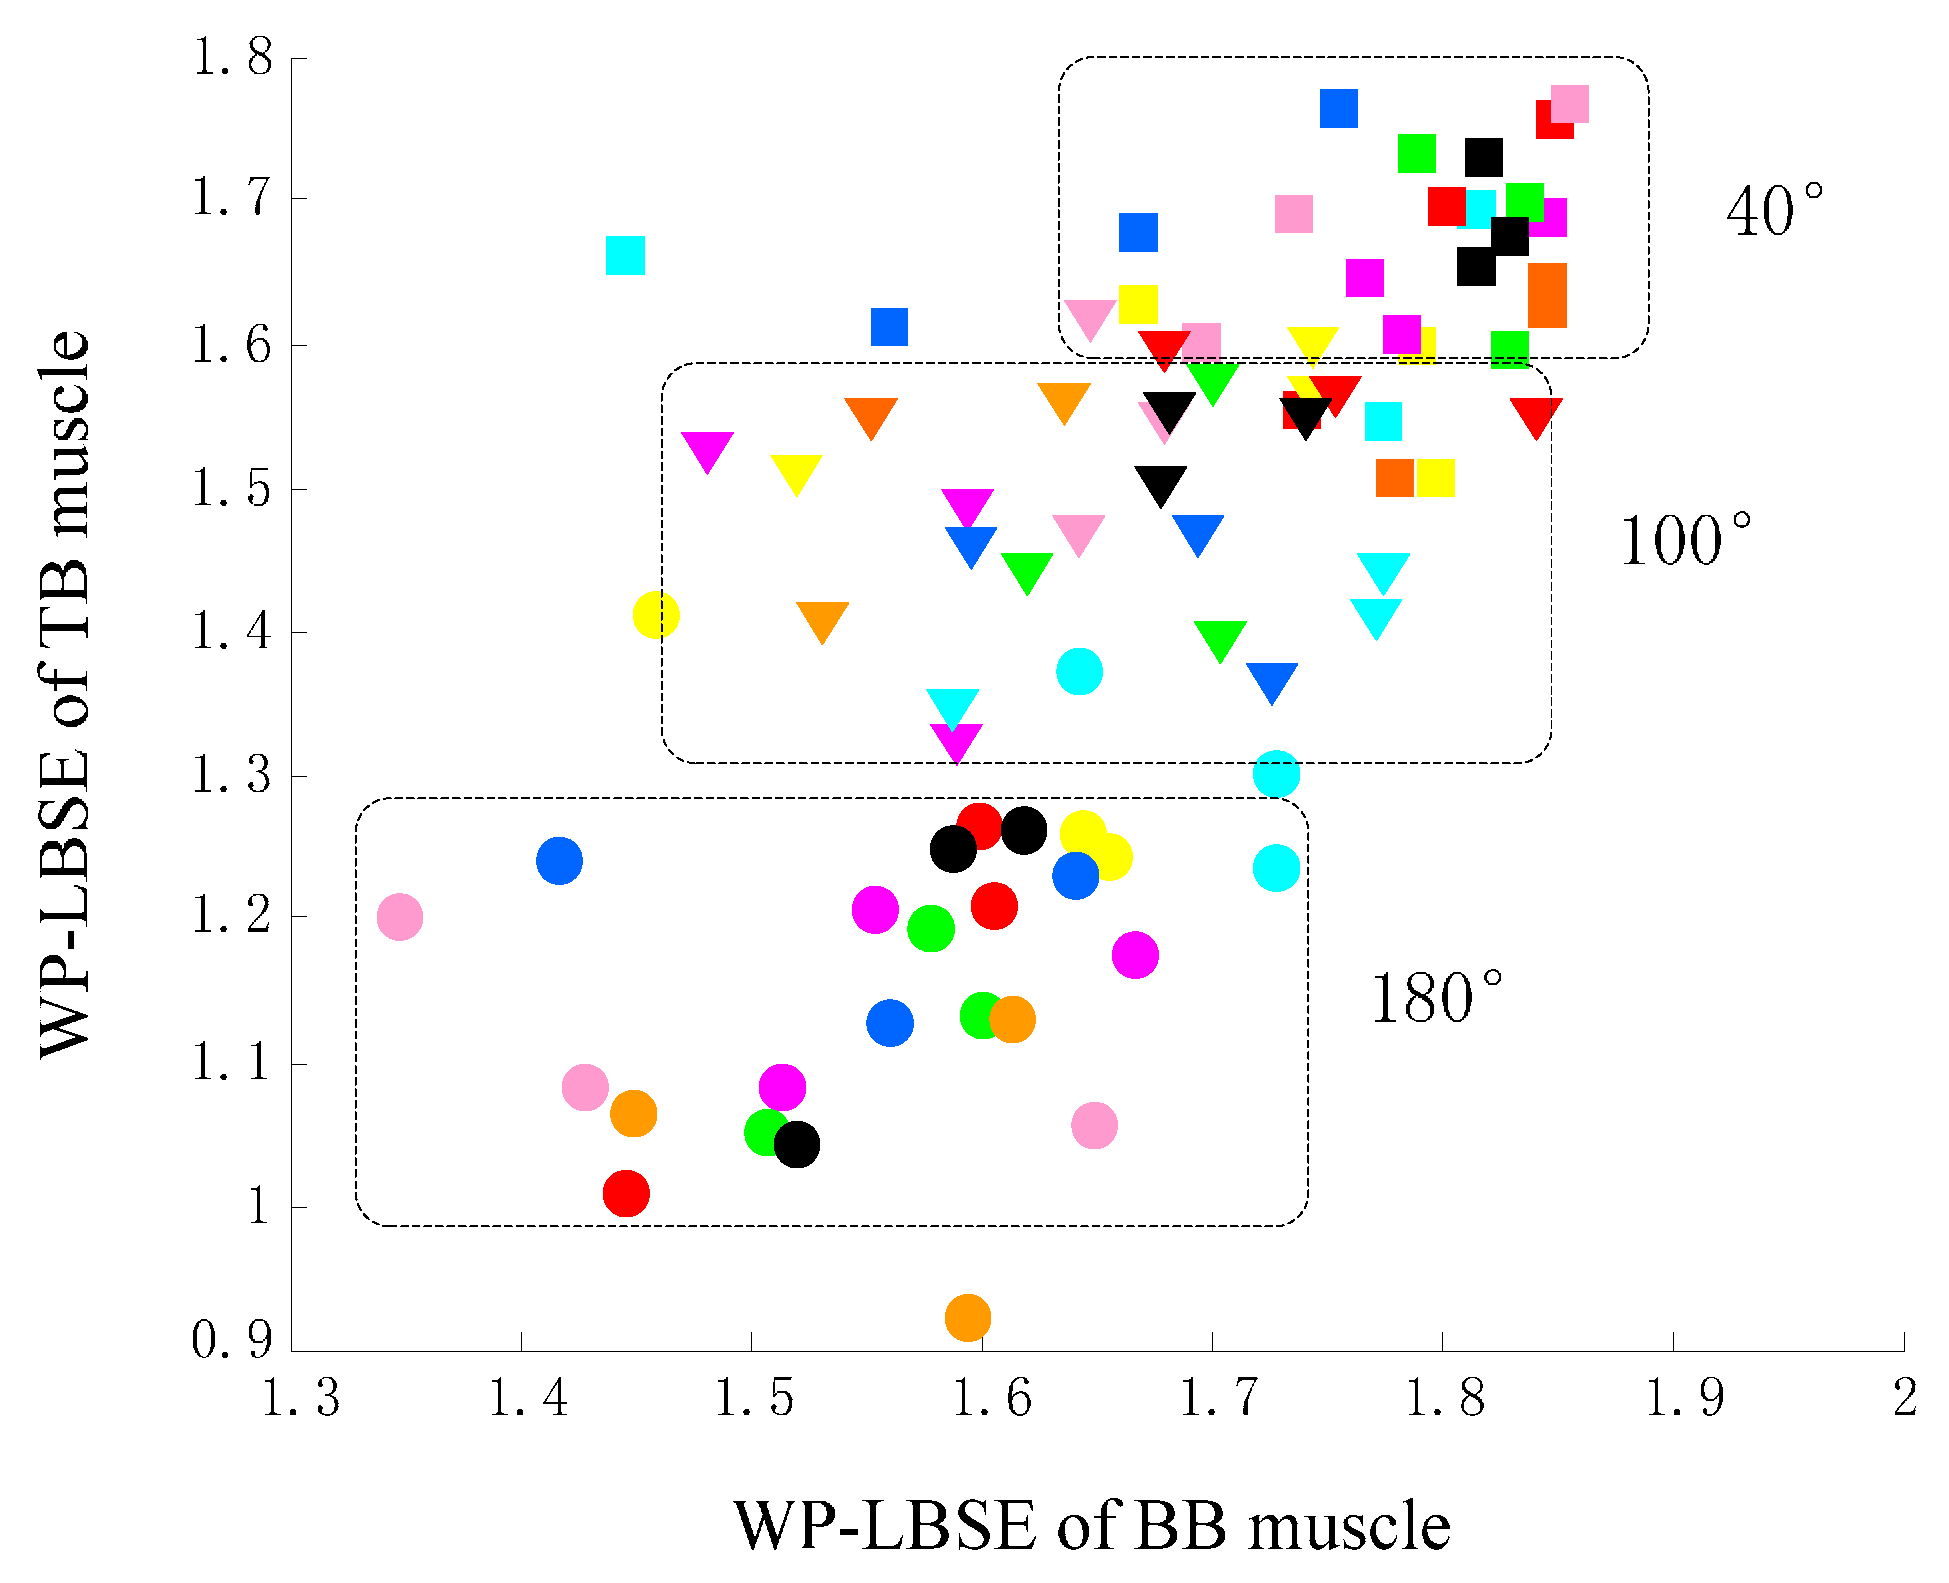
3.1.2. WP-LBSE Distribution

The scatter diagram of WP-LBSE under 40°, 100° and 180°of elbow flexion in Figure 3 showed the feature vectors constituted by the WP-LBSE in BB muscle and TB muscle under three patterns. The same color indicated the WP-LBSE values for the same subject, and the same shape showed the WP-LBSE values for the same patterns. In each pattern, there were three same marks. Visualization of the discrimination among groups was provided by plotting the individual vectors for three patterns. The vector distributions under 40° (full elbow flexion), 100° (intermediate reference position) and 180° (full elbow extension) were [1.65–1.85, 1.60–1.80], [1.45–1.80, 1.35–1.55] and [1.40–1.75, 1.00–1.30], respectively. The mean values of the vector distributions under 40° were significantly higher than that under 100° (p = 0.0093) and 180° (p = 0.0067).
Figure 3. Scatter diagram of WP-LBSE of EMG signals in BB muscle and TB muscle under three motor patterns (40°, 100° and 180°of elbow flexion).
Entropy 18 00041 g003
Concurrently, the line graphs of the WP-LBSE in each time-interval for each subject were plotted as shown in Figure 4. Figure 4 intuitively depicts a more rapid decline and shows significant differences among the three states (t = 10.31, p < 0.01), especially the WP-LBSE of the EMG signals in TB muscle.
Figure 4. The tendency graphs of WP-LBSE in BB muscle and TB muscle in three time intervals were showed respectively. The WP-LBSEs of each subject were showed under three joint angles (40°, 100° and 180° of elbow flexion).
Entropy 18 00041 g004

3.2. Relationship between the WP-LBSE and the Angles

The error bars of the average WP-LBSE values across all subjects are shown in Figure 5 in three time intervals under different angles. Figure 5a intuitively depicts a significant decline of the mean WP-LBSE values from 40° to 80° of elbow flexion, though they were overlapped with each other. In addition, there was a decreasing tendency from time interval 1 to time interval 3, which meant the variation of the complexity of the EMG signals in the local frequency band during the process of maintaining the motion state. The line graph of the mean WP-LBSE values in Figure 5b further showed that there were significant differences among the different motor patterns.
Figure 5. Correlation between the mean WP-LBSE values and the angles. (a) Error bar of the average WP-LBSE values across all subjects in three time intervals under three angles; (b) Line graph of the mean WP-LBSE values across all subjects in three time intervals under three angles.
Entropy 18 00041 g005

4. Discussion

In this paper, a novel technique, named WP-LBSE, was proposed to describe the time-varying complexity characteristics of the EMG signals collected from the BB muscle and TB muscle about elbow movement under different joint angles. Compared with the WPE and the frequency band local-energy method, the WP-LBSE has been proved to be helpful for quantitatively describing the time-varying complexity characteristics of the EMG signals in the local frequency band. The quantification of multi-aspect characteristics and the variation tendency of the WP-LBSE values expounded the changes of the firing of motor units and discharge of muscle fibers in motor control.
In our study, the WPE values under the three motion patterns yielded almost the same distributed regularity in the frequency bands, and were dominant in the range of 1–125 Hz as shown in Figure 2a. It is difficult to describe the discriminable features in the local frequency bands [13]. The result is inconsistent with the literature which claimed that the angles have a significant effect on the median frequencies of BB and TB muscles [49].
The ELF values based on the WPE showed that the distributions of relative energy decreased to a stable state with time periods going on under the same pattern (Figure 2b). These changes may be related to the motoneurons innervated by the central command. A thorough elucidation has showed that both the α and γ motoneurons are active during movement and posture [50,51,52]. Dynamic α and γ motoneurons are mainly responsible for movement, while static α and γ motoneurons are related to posture maintenance [53]. The activated dynamic γ neuron will enhance the Ia afferent neurons during the initially dynamic movement, then the activated γ neuron will shift to be static neurons to increase the perception of II afferent neurons for the muscle length. These explanations demonstrate the time-dependent of the neurophysiological system under single motor task. In our study, the change of the EMG spectral energy corroborated well for these time-varying characteristics of the motor system. In addition, each motor pattern from the onset to the end can be divided into a series of dynamic movements and static postures, and the shift of the γ neurons might account well for the tendency to stability of spectral energy of the EMG signals in each motor patterns. With respect to the decrease of the EMG spectral energy, it might be related to the strength of the activated γ motoneurons. The dynamic γ motoneurons may need more strength within a little time to reach the required level, while the static γ motoneurons need less strength to modulate the accurate and subtle position.
The centrally encoded joint angle information is conveyed to the periphery by a plausible function of γ fusimotor control through regulating spindle sensitivity, so that the Ia signaling from spindle afferents is kept faithfully proportional to the joint angle during the movement and muscle contraction [54]. In our study, significant difference on the mean WP-LPSE values in each time interval exists among different angles of elbow flexion (Figure 3 and Figure 4). The WP-LBSE of the EMG signals in the BB muscle and TB muscle demonstrates a decreased tendency of from 40° to 180° of elbow flexion (Figure 5). The difference indicates that the complexity in the EMG signals has a declined tendency from flexion to extension. The decreased complexity might derive from the multifactor effects. The integration of the centrally encoded 40° angle information of elbow flexion is likely more complicated than that of the 180° angle. In addition, the muscles under 40° angle need more motor units to maintain and adjust the discharge of the muscle fibers or reinforces the shorter fibers [55], as a result, the firing of the motor units and the discharge of muscle fibers might be more complex than that under 180° angle. The conclusion is consistently fitted with the literature as Chen et al. [56] reported. This supports the hypothesis that the firing of the motor units and the discharge of the muscle fibers play a direct role in modulating the contraction of muscle groups to generate different motor patterns.

5. Conclusions

In this study, the proposed method introducing the concept of ELF into the wavelet packet entropy, WP-LBSE, has been proved a suitable approach to quantify the time-varying complexity characteristics of the EMG signals in the local frequency band. The variation tendency of the WP-LBSE values in each time interval is obtained under different motion patterns (40°, 100° and 180° of elbow flexion). The quantification of multi-aspect characteristics in the EMG signals expounds the functional modulation of the firing of motoneurons (α and γ) and the discharge of the fusimotor in motor control. This study is significant in understanding the potential mechanism in the motor-control system and could be helpful to evaluate the motion function for rehabilitation.

Acknowledgments

This work was supported by the National Nature Science Foundation of China under Grants 61271142, Natural Science Foundation of Hebei, China under Grants F2015203372 and Youth Natural Science Foundation for Hebei Higher Education, China under Grants QN2014074. The authors would like to acknowledge all participants of the EMG-acquisition experiment, and thank the contribution and guidance of the members in our lab.

Author Contributions

Ping Xie and Xiao-Ling Chen were responsible for the design of the research. Xiao-Ling Chen, Huan Liu and Yi-Hao Du were charge of collecting and analyzing the EEG and EMG data. Xiao-Ling Chen, Huan Liu and Yan Song were responsible for reviewing relevant literatures. Xiao-Ling Chen, Ping Xie and Yan Song drafted and integrated the manuscript in progress. All authors have read and approved the final manuscript.

Conflicts of Interest

The authors declare no conflict of interest.

References

  1. Dalley, S.A.; Varol, H.A.; Goldfarb, M. A method for the control of multigrasp myoelectric prosthetic hands. IEEE Trans. Neural Syst. Rehabil. Eng. 2012, 20, 58–67. [Google Scholar] [CrossRef] [PubMed]
  2. Oskoei, M.A.; Hu, H. Myoelectric control systems—A survey. Biomed. Signal Process. Control 2007, 2, 275–294. [Google Scholar] [CrossRef]
  3. Dipietro, L.; Ferraro, M.; Palazzolo, J.J.; Krebs, H.I.; Volpe, B.T.; Hogan, N. Customized interactive robotic treatment for stroke: EMG-triggered therapy. IEEE Trans. Neural Syst. Rehabil. Eng. 2005, 13, 325–334. [Google Scholar] [CrossRef] [PubMed]
  4. Stein, J.; Narendran, K.; McBean, J.; Krebs, K.; Hughes, R. Electromyography-controlled exoskeletal upper-limb-powered orthosis for exercise training after stroke. Am. J. Phys. Med. Rehabil. 2007, 86, 255–261. [Google Scholar] [CrossRef] [PubMed]
  5. Bilodeau, M.; Schindler-Ivens, S.; Williams, D.; Chandran, R.; Sharma, S. EMG frequency content changes with increasing force and during fatigue in the quadriceps femoris muscle of men and women. J. Electromyogr. Kinesiol. 2003, 13, 83–92. [Google Scholar] [CrossRef]
  6. Jenkins, N.D.; Housh, T.J.; Buckner, S.L.; Bergstrom, H.C.; Cochrane, K.C.; Smith, C.M.; Hill, E.C.; Schmidt, R.J.; Cramer, J.T. Individual Responses for Muscle Activation, Repetitions, and Volume during Three Sets to Failure of High- (80% 1RM) versus Low-Load (30% 1RM) Forearm Flexion Resistance Exercise. Sports 2015, 3, 269–280. [Google Scholar] [CrossRef]
  7. Zhou, P.; Barkhaus, P.E.; Zhang, X.; Rymer, W.Z. Characterizing the complexity of spontaneous motor unit patterns of amyotrophic lateral sclerosis using approximate entropy. J. Neural Eng. 2011, 8, 066010. [Google Scholar] [CrossRef] [PubMed]
  8. Zhang, X.; Chen, X.; Barkhaus, P.E.; Zhou, P. Multiscale entropy analysis of different spontaneous motor unit discharge patterns. IEEE J. Biomed. Health Inform. 2013, 17, 470–476. [Google Scholar] [CrossRef] [PubMed]
  9. Fukuda, T.Y.; Echeimberg, J.O.; Pompeu, J.E.; Lucareli, P.R.G.; Garbelotti, S.; Gimenes, R.O.; Apolinário, A. Root mean square value of the electromyographic signal in the isometric torque of the quadriceps, hamstrings and brachial biceps muscles in female subjects. J. Appl. Res. 2010, 10, 32–39. [Google Scholar]
  10. Hannaford, B.; Lehman, S. Short time Fourier analysis of the electromyogram: Fast movements and constant contraction. IEEE Trans. Biomed. Eng. 1986, 12, 1173–1181. [Google Scholar] [CrossRef] [PubMed]
  11. Green, L.A.; McGuire, J.; Gabriel, D.A. Flexor carpi radialis surface EMG electrode placement for evoked and voluntary measures. Muscle Nerve 2015, 25, 818–825. [Google Scholar] [CrossRef] [PubMed]
  12. Canal, M.R. Comparison of wavelet and short time Fourier transform methods in the analysis of EMG signals. J. Med. Syst. 2010, 34, 91–94. [Google Scholar] [CrossRef] [PubMed]
  13. Xu, Z.; Xiao, S. Digital filter design for peak detection of surface EMG. J. Electromyogr. Kinesiol. 2000, 10, 275–281. [Google Scholar] [CrossRef]
  14. Englehart, K.; Hudgins, B.; Parker, P.; Stevenson, M. Improving Myoelectric Signal Classification Using Wavelet Packets and Principal Components Analysis. In Proceedings of the 21st Annual International Conference of the IEEE Engineesing in Medicine and Biology Society, Atlanta, GA, USA, 13–16 October 1999.
  15. Englehart, K.; Hudgins, B.; Parker, P.A.; Stevenson, M. Classification of the myoelectric signal using time-frequency based representations. Med. Eng. Phys. 1999, 21, 431–438. [Google Scholar] [CrossRef]
  16. Karlsson, S.; Yu, J.; Akay, M. Enhancement of spectral analysis of myoelectric signals during static contractions using wavelet methods. IEEE Trans. Biomed. Eng. 1999, 46, 670–684. [Google Scholar] [CrossRef] [PubMed]
  17. Englehart, K.; Hudgin, B.; Parker, P. A wavelet-based continuous classification scheme for multifunction myoelectric control. IEEE Trans. Biomed. Eng. 2001, 48, 302–311. [Google Scholar] [CrossRef] [PubMed]
  18. Englehart, K.; Hudgins, B. A robust, real-time control scheme for multifunction myoelectric control. IEEE Trans. Biomed. Eng. 2003, 50, 848–854. [Google Scholar] [CrossRef] [PubMed]
  19. Yen, G.G.; Lin, K.-C. Wavelet packet feature extraction for vibration monitoring. IEEE Trans. Ind. Electron. 2000, 47, 650–667. [Google Scholar] [CrossRef]
  20. Kiatpanichagij, K.; Afzulpurkar, N. Use of supervised discretization with PCA in wavelet packet transformation-based surface electromyogram classification. Biomed. Signal Process. Control 2009, 4, 127–138. [Google Scholar] [CrossRef]
  21. Hu, X.; Ren, X. Identification of Surface EMG Signals Using Wavelet Packet Entropy. In Proceedings of the 6th WSEAS International Conference on Wavelet Analysis & Multirate Systems, Bucharest, Romania, 16–18 October 2006.
  22. Jutten, C.; Herault, J. Blind separation of sources, part I: An adaptive algorithm based on neuromimetic architecture. Signal Process. 1991, 24, 1–10. [Google Scholar] [CrossRef]
  23. Comon, P. Independent component analysis, a new concept? Signal Process. 1994, 36, 287–314. [Google Scholar] [CrossRef] [Green Version]
  24. Wold, S.; Esbensen, K.; Geladi, P. Principal component analysis. Chemom. Intell. Lab. Syst. 1987, 2, 37–52. [Google Scholar] [CrossRef]
  25. Jolliffe, I. Principal Component Analysis; Springer: Berlin/Heidelberg, Germany, 2002; pp. 135–169. [Google Scholar]
  26. Lee, D.D.; Seung, H.S. Algorithms for non-negative matrix factorization. Adv. Neural Inf. Process.Syst. 2001, 32, 556–562. [Google Scholar]
  27. Liu, J. Feature dimensionality reduction for myoelectric pattern recognition: A comparison study of feature selection and feature projection methods. Med. Eng. Phys. 2014, 36, 1716–1720. [Google Scholar] [CrossRef] [PubMed]
  28. Naik, G.R.; Baker, K.G.; Nguyen, H.T. Dependency independency measure for posterior and anterior EMG sensors used in simple and complex finger flexion movements: Evaluation using SDICA. IEEE J. Biomed. Health Inf. 2014, 19, 1689–1696. [Google Scholar] [CrossRef] [PubMed]
  29. Riillo, F.; Quitadamo, L.; Cavrini, F.; Gruppioni, E.; Pinto, C.; Pastò, N.C.; Sbernini, L.; Albero, L.; Saggio, G. Optimization of EMG-based hand gesture recognition: Supervised vs. unsupervised data preprocessing on healthy subjects and transradial amputees. Biomed. Signal Process. Control 2014, 14, 117–125. [Google Scholar] [CrossRef]
  30. Naik, G.R.; Kumar, D.K. Identification of hand and finger movements using multi run ICA of surface electromyogram. J. Med. Syst. 2012, 36, 841–851. [Google Scholar] [CrossRef] [PubMed]
  31. Naik, G.R.; Kumar, D.K.; Palaniswami, M. Signal processing evaluation of myoelectric sensor placement in low-level gestures: Sensitivity analysis using independent component analysis. Expert Syst. 2014, 31, 91–99. [Google Scholar] [CrossRef]
  32. Geethanjali, P. Comparative study of pca in classification of multichannel EMG signals. Australas. Phys. Eng. Sci. Med. 2015, 38, 331–343. [Google Scholar] [CrossRef] [PubMed]
  33. Naik, G.R.; Nguyen, H.T. Nonnegative matrix factorization for the identification of EMG finger movements: Evaluation using matrix analysis. IEEE J. Biomed. Health Inf. 2015, 19, 478–485. [Google Scholar] [CrossRef] [PubMed]
  34. Broock, W.; Scheinkman, J.A.; Dechert, W.D.; LeBaron, B. A test for independence based on the correlation dimension. Econom. Rev. 1996, 15, 197–235. [Google Scholar] [CrossRef]
  35. Wolf, A.; Swift, J.B.; Swinney, H.L.; Vastano, J.A. Determining Lyapunov exponents from a time series. Physica D 1985, 16, 285–317. [Google Scholar] [CrossRef]
  36. McCabe, T.J. A complexity measure. IEEE Trans. Softw. Eng. 1976, 4, 308–320. [Google Scholar] [CrossRef]
  37. Białynicki-Birula, I.; Mycielski, J. Uncertainty relations for information entropy in wave mechanics. Commun. Math. Phys. 1975, 44, 129–132. [Google Scholar] [CrossRef]
  38. Faure, P.; Korn, H. A new method to estimate the Kolmogorov entropy from recurrence plots: Its application to neuronal signals. Physica D 1998, 122, 265–279. [Google Scholar] [CrossRef]
  39. Pincus, S.M. Approximate entropy as a measure of irregularity for psychiatric serial metrics. Bipolar Disord. 2006, 8, 430–440. [Google Scholar] [CrossRef] [PubMed]
  40. Pincus, S.M.; Goldberger, A.L. Physiological time-series analysis: What does regularity quantify? Am. J. Physiol. Heart Circ. Physiol. 1994, 266, H1643–H1656. [Google Scholar]
  41. Richman, J.S.; Moorman, J.R. Physiological time-series analysis using approximate entropy and sample entropy. Am. J. Physiol. Heart Circ. Physiol. 2000, 278, H2039–H2049. [Google Scholar] [PubMed]
  42. Liang, Z.; Wang, Y.; Sun, X.; Li, D.; Voss, L.J.; Sleigh, J.W.; Hagihira, S.; Li, X. EEG entropy measures in anesthesia. Front. Comput. Neurosci. 2015, 9. [Google Scholar] [CrossRef] [PubMed]
  43. Rosso, O.A.; Blanco, S.; Yordanova, J.; Kolev, V.; Figliola, A.; Schürmann, M.; Başar, E. Wavelet entropy: A new tool for analysis of short duration brain electrical signals. J. Neurosci. Methods 2001, 105, 65–75. [Google Scholar] [CrossRef]
  44. Hu, X.; Wang, Z.; Ren, X. Classification of surface EMG signal using relative wavelet packet energy. Comput. Methods Programs Biomed. 2005, 79, 189–195. [Google Scholar] [CrossRef] [PubMed]
  45. Wang, F.; Ma, X.; Zou, Y.; Zhang, Z. Local power feature extraction method of frequency bands based on wavelet packet decomposition. Trans. Chin. Soc. Agric. Mach. 2004, 5, 177–180. [Google Scholar]
  46. Wu, B.-F.; Wang, K.-C. Robust endpoint detection algorithm based on the adaptive band-partitioning spectral entropy in adverse environments. IEEE Trans. Speech Audio Process. 2005, 13, 762–775. [Google Scholar]
  47. Oldfield, R.C. The assessment and analysis of handedness: The edinburgh inventory. Neuropsychologia 1971, 9, 97–113. [Google Scholar] [CrossRef]
  48. Wong, J.W. Signal-to-Noise Ratio (SNR). In Encyclopedia of Radiation Oncology; Brady, L.W., Yeager, T.Y., Eds.; Springer: Berlin/Heidelberg, Germany, 2013; pp. 789–790. [Google Scholar]
  49. Komi, P.V.; Tesch, P. EMG frequency spectrum, muscle structure, and fatigue during dynamic contractions in man. Eur. J. Appl. Physiol. Occup. Physiol. 1979, 42, 41–50. [Google Scholar] [CrossRef] [PubMed]
  50. Prochazka, A.; Ellaway, P. Sensory systems in the control of movement. Compr. Physiol. 2012, 2, 2615–2627. [Google Scholar] [PubMed]
  51. Granit, R. The functional role of the muscle spindles? Facts and hypotheses. Brain 1975, 98, 531–556. [Google Scholar] [CrossRef] [PubMed]
  52. Mattews, P. Muscle spindles and their motor control. Physiol. Rev. 1964, 44, 219–288. [Google Scholar]
  53. Li, S.; Zhuang, C.; Hao, M.; He, X.; Marquez, J.C.; Niu, C.M.; Lan, N. Coordinated alpha and gamma control of muscles and spindles in movement and posture. Front. Comput. Neurosci. 2015, 9, 1–15. [Google Scholar] [CrossRef] [PubMed]
  54. Lan, N.; He, X. Fusimotor control of spindle sensitivity regulates central and peripheral coding of joint angles. Front. Comput. Neurosci. 2012, 6, 1–13. [Google Scholar] [CrossRef] [PubMed]
  55. Farina, D.; Merletti, R.; Nazzaro, M.; Caruso, I. Effect of joint angle on EMG variables in leg and thigh muscles. IEEE Eng. Med. Biol. Mag. 2001, 20, 62–71. [Google Scholar] [CrossRef] [PubMed]
  56. Chen, W.-T.; Wang, Z.-Z.; Ren, X.-M. Characterization of surface EMG signals using improved approximate entropy. J. Zhejiang Univ. Sci. B 2006, 7, 844–848. [Google Scholar] [CrossRef] [PubMed]

