
Temporal Predictability of Online Behavior in Foursquare

School of Electronic and Information Engineering, Beihang University, Beijing 100191, China
*
Author to whom correspondence should be addressed.
Entropy 2016, 18(8), 296; https://doi.org/10.3390/e18080296
Submission received: 16 June 2016
/
Revised: 2 August 2016
/
Accepted: 8 August 2016
/
Published: 12 August 2016
(This article belongs to the Section Information Theory, Probability and Statistics)
Abstract
:With the widespread use of Internet technologies, online behaviors play a more and more important role in humans’ daily lives. Knowing the times when humans perform their next online activities can be quite valuable for developing better online services, which prompts us to wonder whether the times of users’ next online activities are predictable. In this paper, we investigate the temporal predictability in human online activities through exploiting the dataset from the social network Foursquare. Through discretizing the inter-event times of users’ Foursquare activities into symbols, we map each user’s inter-event time sequence to a sequence of inter-event time symbols. By applying the information-theoretic method to the sequences of inter-event time symbols, we show that for a user’s Foursquare activities, knowing the time interval between the current activity and the previous activity decreases the entropy of the time interval between the next activity and current activity, i.e., the time of the user’s next Foursquare activity is predictable. Much of the predictability is explained by the equal-interval repeat; that is, users perform consecutive Foursquare activities with approximately equal time intervals. On the other hand, the unequal-interval preference, i.e., the preference of performing Foursquare activities with a fixed time interval after another given time interval, is also an origin for predictability. Furthermore, our results reveal that the Foursquare activities on weekdays have a higher temporal predictability than those on weekends and that users’ Foursquare activity is more temporally predictable if his/her previous activity is performed in a location that he/she visits more frequently.
1. Introduction
Understanding human activities has been considered a long-term fundamental and vital task for decades. It can provide deep insights for analyzing many social, technological and economic phenomena [1,2,3,4,5]. Despite much effort dedicated to the research of human activities, the quantitative understanding has been impeded for a long time because of the lack of data recording human activities. Thanks to the recent developments in sensing technologies, varieties of massive fine-grained datasets about human behaviors have become available which offer an unprecedented opportunity in the study of human activities. From the analyses of the datasets, one of the remarkable discoveries is that many human activities in real life are predictable. For instance, the studies show that humans’ next location to visit [6,7,8], next face-to-face conversation partner [9], next cellphone call partner [10], next store for shopping [11], next time to return to a certain place [12] and next speed state while driving a car [13] can all be predicted by exploiting the history of the behavior process, i.e., there is a predictability existing in the behavioral patterns. Several methods have been proposed to forecast human behaviors. For example, in [14,15] the Markov chain–based model is used to predict the next location in humans’ mobility trajectories. In [16], the researchers employ a negative binomial regression model to predict the number of times an individual moves between different rooms in their home. The prediction methods above all investigate the spatial patterns of human behaviors while in this paper we focus on human behavior’s temporal pattern. The predictability present in humans’ real lives is induced by spatial and temporal constraints, such as the disposition of roads in urban settings or the timing of daily routines [17].
With the rapid development of Internet technologies, especially the mobile Internet technologies, many activities that humans perform in real life can be done on the web nowadays. For example, a person can purchase products, study courses and chat with friends on the Internet. Furthermore, Internet technologies increasingly provide novel services and applications for humans’ daily lives, such as online games, posting a personal status and checking in at certain places. The widespread uses of Internet technologies make online activities become a more and more important part of humans’ daily lives. Differing from activities in real life, humans can perform nearly any online activity in any place at any time due to the high coverage of Internet access and the mass popularization of smart devices (e.g., smart phone, smart pad), i.e., humans face much fewer constraints when performing activities on the web than in real life. This difference raises the question of whether humans’ online activities are predictable as well.
Quite recently, a few studies have pointed out that online activities also have predictability. It is revealed that the uncertainty about the next email partner of a user is decreased by knowing the current one [10]. In online games, knowing the current action can decrease the uncertainty about the next action of the player [18]. For the commenting partner as well as choosing the location of online check-ins, it is also shown that knowing the current action can decrease the uncertainty about the next one [17,19]. Furthermore, it is shown in [20,21] that users’ rating and browsing trajectories on websites also have a high degree of predictability. The above studies indicate that for humans’ next online activities, what action the user performs and where the action is performed both are predictable.
What, where and when are the three essential components in describing human activities. However, current studies on online activities all focus on the predictability of what action the user performs or where the action is performed. Whether the time when the user performs the online activity is predictable is still unclear. Exploring the temporal predictability in online activities not only can provide a deeper understanding on the temporal characteristics of online behaviors, but it can also help model human online activities for applications where the activity time plays an important role, such as controlling computer viruses [22,23,24], scheduling Internet resources [25,26,27], emergency detection [28,29], publishing information [30,31] and identification of anomalous users [32,33].
In this paper, we explore the temporal predictability in human online activities using the dataset collected from the social network Foursquare. Foursquare is the largest and most popular location-based social network. Using Foursquare, people can explore and share points of interest as well as interact with friends through online check-ins at physical places. The dataset employed in this study includes 2,073,740 check-in records generated by 18,107 users during 10 months. As predicting the time of the next activity of a user is equivalent to predicting the time interval between his/her next activity and the current one, our work focuses on the predictability of the time interval between the next activity and the current one. To this end, we map the inter-event time sequence of a user’s Foursquare activities to a sequence of inter-event time symbols and analyze it using the information-theoretic method. Our results show that for Foursquare activities, knowing the time interval between the current activity and the previous activity decreases the entropy of the time interval between the next activity and the current activity, which indicates that the time of the next Foursquare activity is predictable. The predictability is mainly originated from the equal-interval repeat; that is, the user performs consecutive Foursquare activities with an approximately equal time interval. The unequal-interval preference, i.e., the preference of performing Foursquare activities with a fixed time interval after another given one, is also an origin of predictability. Finally, it is revealed that Foursquare activities on weekdays have a higher temporal predictability than those on weekends and that the user’s Foursquare activity is more temporally predictable if the previous one was performed in locations with a higher visit frequency.
2. Data and Methods
We conduct our investigation by using a dataset from the social network Foursquare. Foursquare is the largest and most popular location-based social network with over 55 million users as of March 2015 [34]. It allows users to explore and share points of interest as well as to interact with friends through online check-ins at physical places. In our study, the data are collected from 8 March 2010 to 21 January 2011. The length of data sampling is 319 days. For each check-in record, the dataset provides the user-id identifying which user performs the check-in, the time of the check-in and the location-id identifying the location where the check-in is performed. To effectively uncover the temporal predictability in a user’s Foursquare activities, we filter out the users with scarce activities or those participating in the social network only for a short time. To be specific, hereafter we focus on the users whose active period, i.e., the time span between the user’s first and last check-in, is over 180 days, and whose total number of check-in records is more than 800 in the observational period. The selection criterion results in 43 users that are used in the following study. For each user, after listing all his/her check-in records chronologically, we are able to obtain his/her sequence of inter-event times which are the time intervals between consecutive check-ins performed by the user. For the sake of simplicity, we map each user’s sequence of inter-event times, which are continuous values, into a sequence of symbols by discretization. Then, we measure the information entropy of the symbol sequences to quantify the temporal predictability present in the data. In the remainder of this section, we present the discretization method and information entropy measures employed.
For discretizing continuous values, equal-width discretization is a commonly used method [12,35]. It obtains the minimum and maximum value of the continuous values to be discretized and partitions the range between the minimum value and the maximum value into several equal-width intervals. The continuous values entering the same interval are discretized to the same symbol while the continuous values entering different intervals are discretized to different symbols. For example, if the minimum and maximum of the continuous values are 0 and 100 and the number of intervals is set to 10, then the 10 equal-width intervals obtained are [0, 10], (10, 20], …, (80, 90], (90, 100]. The continuous values of 5, 6 and 7 all enter the interval of [0, 10] and thus they are discretized to the same symbol. The continuous value of 15 enters the interval of (10, 20] and thus it is discretized to another symbol. However, the users’ inter-event times to be discretized here are distributed in a highly non-uniform manner. In Figure 1a we present the distribution of the inter-event times for the 43 users. As can be seen, most of the inter-event times are relatively short, while a few inter-event times are longer by orders of magnitude. When partitioning the range of these inter-event times with equal-width intervals, the intervals for long inter-event times will have a very small number of cases, i.e., the inter-event times entering the intervals for long inter-event times are scarce. These intervals with scarce inter-event times lead to the scarcity of the corresponding symbols. The statistics of these scarce symbols cannot reflect the symbols’ probabilities reliably, which renders a serious bias in the following estimation of entropy for each user. So, equal-width discretization is not used in this study.
To address the problem above, we introduce equal-frequency discretization. Differing from equal-width discretization, it partitions the range of the continuous values into k intervals in such a way that each interval contains the same number of continuous values. k is a predefined parameter and in most cases it is set to 10 [36]. When applying equal-frequency discretization to the users’ inter-event times, the symbols obtained have equal frequency. As each user’s inter-event time distribution is similar to the distribution from all users (see, e.g., Figure 1b), for each user, the frequencies of each symbol are not very far from each other, i.e., it is avoided that some symbols are very scarce for a user. Therefore, the statistics of the symbols obtained from equal-frequency discretization can reflect probabilities more reliably and then can provide a more accurate entropy estimation for each user. Using the equal-frequency discretization, we obtain 10 intervals [t0, t1), [t1, t2), …, [t8, t9), [t9, t10), where t0 and t10 are the minimum and maximum of the 43 users’ inter-event times, respectively. By discretizing the inter-event times entering interval [ti−1, ti) (or [ti−1, ti]) to symbol i, we map each user’s inter-event time sequence to a sequence of inter-event time symbols.
To reveal the temporal predictability, we define three entropies for each user’s inter-event time symbol sequence. First, we define the random entropy for user A as Equation (1):
where MA represents the number of different inter-event time symbols for the user; quantifies the degree of randomness for the user if each inter-event time symbol is chosen with equal probability. Second, we define the uncorrelated entropy as Equation (2):
where pA(i) represents the probability that user A chooses symbol i in the sequence of inter-event time symbols. Compared to , takes the heterogeneity among pA(i) into account. Third, we define the conditional entropy as Equation (3):
where pA(i/j) represents the conditional probability that user A chooses symbol i immediately after choosing symbol j in his/her inter-event time symbol sequence. Compared to , additionally considers the correlations between two consecutive inter-event time symbols. For each user, the inequalities 0 ≤ ≤ are satisfied. We quantify the temporal predictability using the mutual information as Equation (4):
IA is equal to the amount of information one can gain about the next inter-event time symbol by knowing the current one. If there is no correlation between two consecutive inter-event time symbols, is equal to and IA takes the minimum value of 0. In this case, knowing the current inter-event time symbol does not help to predict the next one at all. If the next inter-event time symbol is completely determined by the current one, = 0 and IA takes the maximum value of .
3. Results
3.1. Temporal Predictability of Foursquare Online Activity
To explore whether the time of a user’s Foursquare activity is predictable, we calculate the three entropies for each user’s inter-event time symbol sequence. The histograms of H0, H1 and H2 for the 43 users are shown in Figure 2. The gap between the values of H0 and H1 indicates that a user exhibits a preference when choosing inter-event time symbols, while the difference between H1 and H2 suggests a correlation between two consecutive inter-event time symbols, i.e., there are dependences existing in consecutive inter-event times in users’ Foursquare activities. We compare the values of H1 and H2 for each individual in Figure 3. The straight line corresponds to H1 being equal to H2. As can be seen, all the dots are below the straight line which indicates that the mutual information I = H1 − H2 is positive for all users. This result indicates that for user’s Foursquare activities, knowing the time interval between his/her current activity and his/her previous activity decreases the uncertainty about the time interval between the next activity and the current activity, i.e., the time of a user’s next Foursquare activity is predictable.
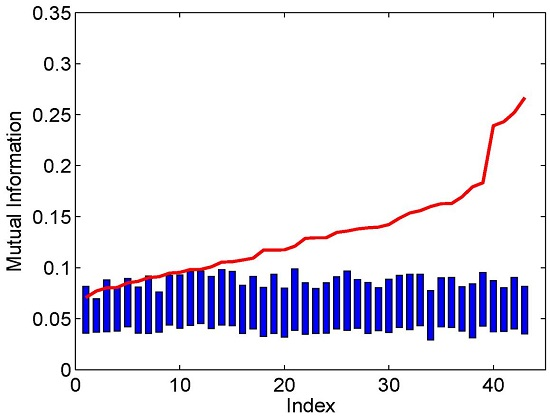
We now examine the validity of the positive mutual information observed. Generally, the finite size effect decreases and by different amounts such that the estimated IA is inherited with a positive bias [37]. To confirm that the observed positive mutual information is not due to the finite size effect, the bootstrap method is performed as follows. For each user we make a shuffled sequence by drawing the inter-event time symbols randomly one by one from the original sequence without replacement. If there are correlations between two consecutive symbols in the original sequence, the shuffled sequence breaking the order will thus have a lower IA since the correlations are destroyed. For each user, we repeat the shuffling procedure 1000 times and compare the mutual information in the shuffled sequences with that in the original sequence in Figure 4. The red line represents the mutual information in original sequences in increasing order while the lower and upper ends of the error bar, respectively, represent the smallest value and the 95th percentile of the mutual information in the shuffled sequences for each user. As can be seen, the value of the mutual information in the original sequence generally lies well above the upper end of the error bar, which suggests that the mutual information in the original sequence is significantly larger than that in shuffled sequences with equal length. We can then conclude that the positive mutual information observed in a user’s inter-event time symbol sequence is not due to the finite size effect.
3.2. Origins of the Temporal Predictability
The temporal predictability present in the data comes from two strong regularities observed in users’ inter-event time symbol sequences. One is that an inter-event time symbol can appear in a user’s inter-event time symbol sequence several times consecutively. This regularity corresponds to the behavioral pattern that humans tend to perform consecutive Foursquare activities with approximately equal time intervals. For example, some users prefer to perform their online check-ins during free time after work. If the user has free time after work with online check-ins for consecutive days, the consecutive inter-event times resulting from these online check-ins are all within 24 h approximately. We call this behavioral pattern the equal-interval repeat. The other regularity observed in the sequences is that a fixed inter-event time symbol often follows another given one. This regularity corresponds to the behavioral pattern that humans have a preference for performing Foursquare activities with a fixed time interval after another given time interval. For example, some users like to perform online check-ins at their lunch and supper times. If the user has lunch and supper with online check-ins at about 12 p.m. and 6 p.m. for several consecutive days, the time intervals of about six hours and 18 h from these check-ins will appear following each other alternatively, which leads to the conclusion that a time interval of about 18 h will follow the interval of about 6 h several times and vice versa. We call this behavioral pattern the unequal-interval preference. In what follows we show that the temporal predictability present in the data is mainly originated from the equal-interval repeat while the unequal-interval preference is also an origin for the predictability.
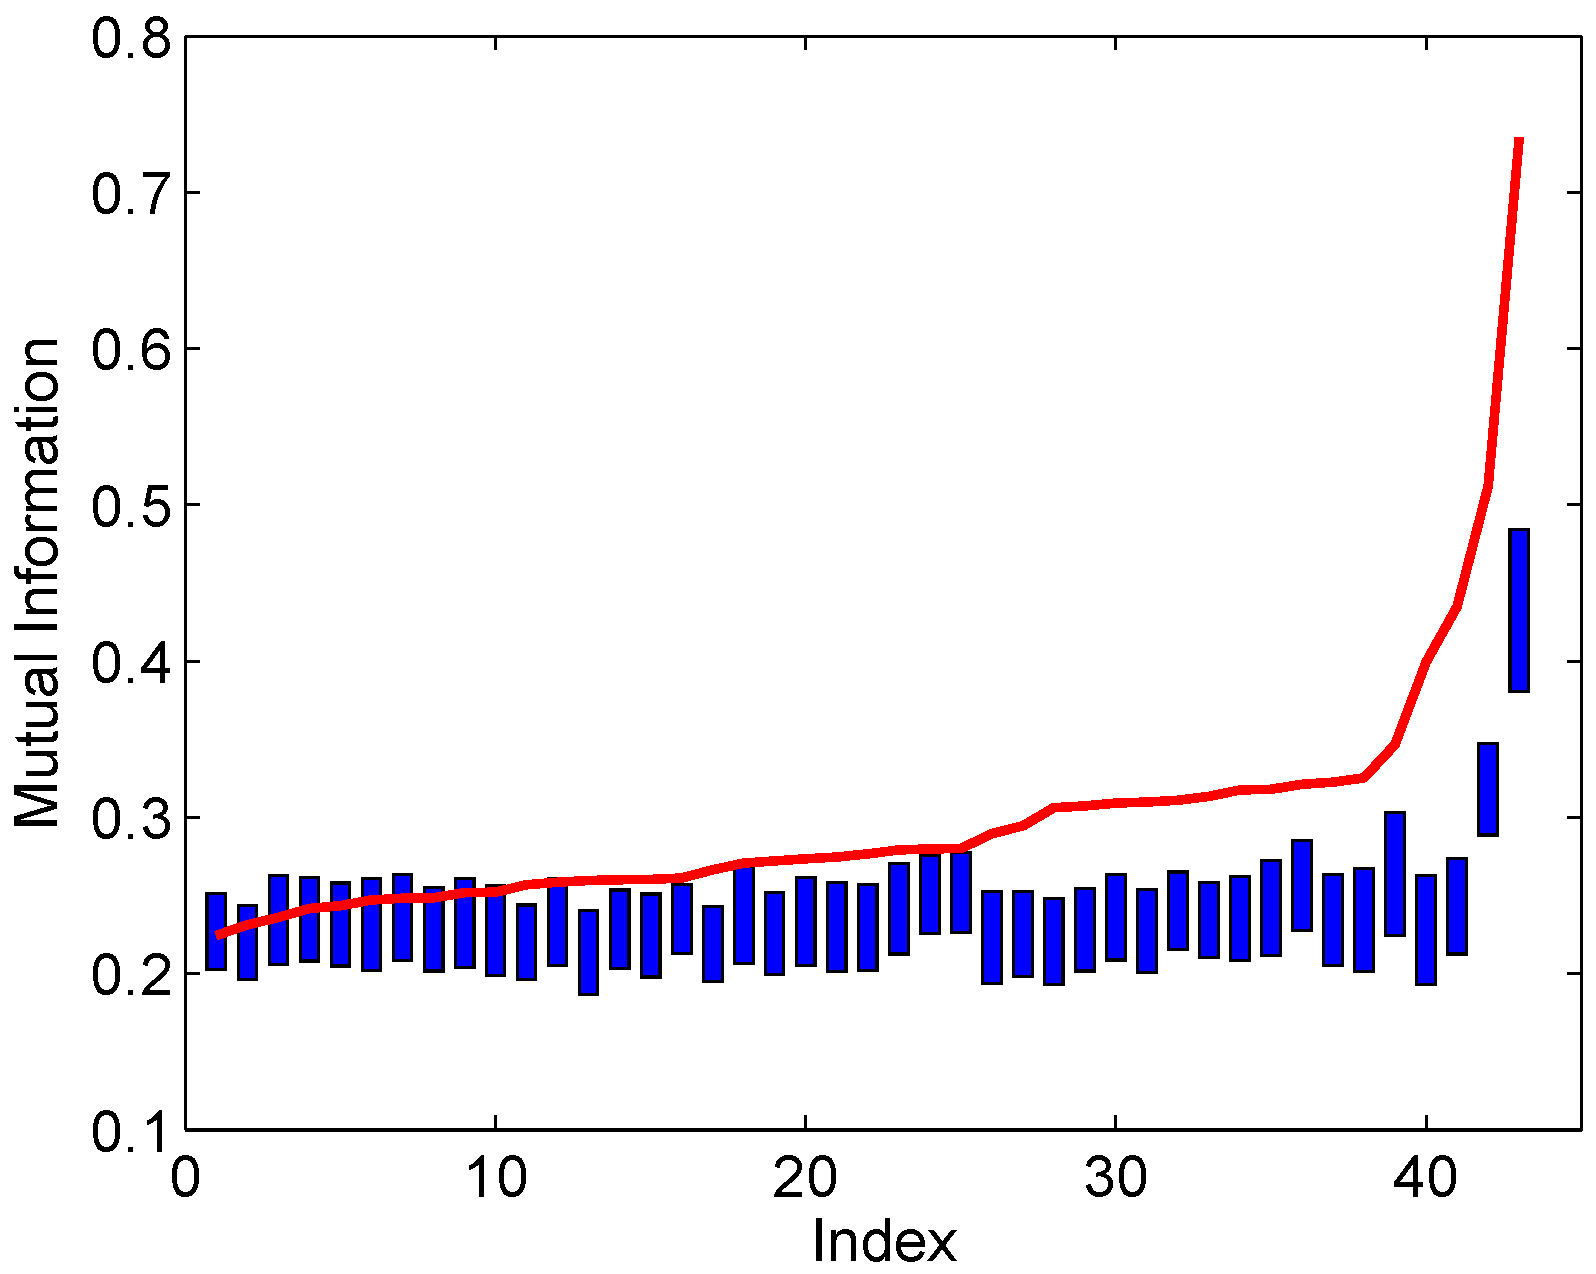
We examine the origin of the equal-interval repeat for temporal predictability by measuring the mutual information in the randomized inter-event time symbol sequences for each user. The randomization of a user’s inter-event time symbol sequence is realized as follows. First we denote each group of consecutive identical symbols in the sequence as a super-symbol. The symbols that are different from both its adjacent symbols are also denoted as super-symbols. For instance, the sequence {1, 1, 1, 2, 1, 1, 3, 3, 4} yields five super-symbols: “1, 1, 1”, “2”, “1, 1”, “3, 3” and “4”. Then we generate the randomized sequence by sampling from the user’s super-symbols that are denoted. Since adjacent super-symbols in the original sequence consist of different symbols, we sample from the super-symbols with a replacement under the condition that the super-symbols consisting of the same symbols are not chosen consecutively. We repeat the sampling until the generated sequence contains at least the same number of symbols as the original sequence, and then we read out the randomized sequence having the same length as the original one. Since the randomized sequence preserves the groups of consecutive identical symbols present in the original sequence but arranges their orders in a random manner, it reflects the temporal predictability caused by the equal-interval repeat in the original sequence. For each user, we calculate the mean and standard deviation of the mutual information from 1000 randomized sequences and compare them with the mutual information in the original sequence in Figure 5. The mean mutual information of the randomized sequences accounts for 83% of the original mutual information on average. This result suggests that the temporal predictability is mainly originated from the equal-interval repeat, i.e., performing consecutive Foursquare activities with approximately equal time intervals is the main reason for the temporal predictability.
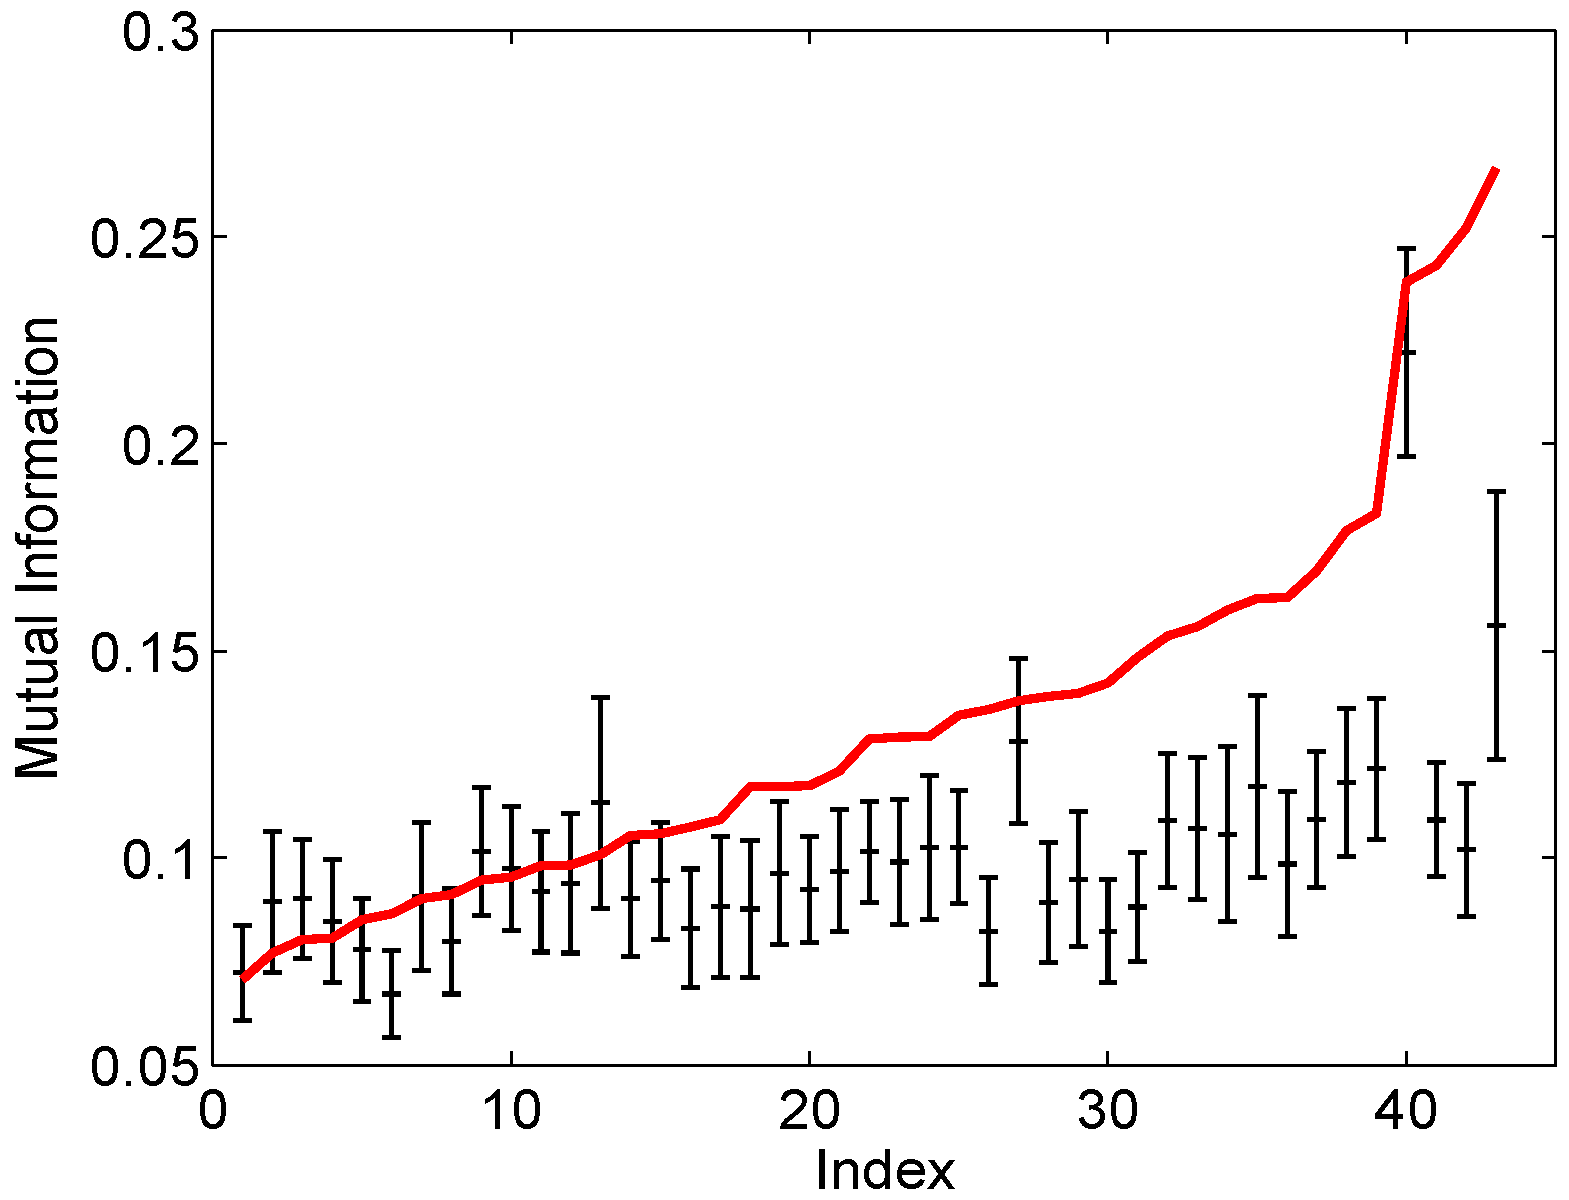
To check the origin of the unequal-interval preference for temporal predictability, we generate a modified sequence of inter-event time symbols and calculate the mutual information in it for each user. The modified sequence is generated by merging consecutive identical symbols in the original sequence into one symbol. For instance, the original sequence {1, 1, 1, 2, 1, 1, 3, 3, 4} yields the modified sequence {1, 2, 1, 3, 4}. The modified sequences without consecutive identical inter-event time symbols allow us to eliminate the origin of the equal-interval repeat for the temporal predictability and uncover the temporal predictability originating from the unequal-interval preference. In Figure 6 we present the value of the mutual information from the modified sequence for each user. The positive mutual information indicates that there is a predictability existing in the modified sequence. Similarly, to confirm that the observed positive mutual information is not due to the finite size effect, we perform the bootstrap method by shuffling the modified sequence. As can be seen in Figure 6, the mutual information of the modified sequence generally lies above or near the upper end of the error bar, which implies that the mutual information in the modified sequence is, in general, larger than that in the shuffled modified sequence and thus indicates that the observed positive mutual information is not due to the finite size effect. The above results reveal that the unequal-interval preference, i.e., the preference of performing Foursquare activities with a fixed time interval after another given time interval, is also an origin of the temporal predictability.
3.3. Effect of Weekday-Weekend Difference and Location’s Visit Frequency on the Temporal Predictability
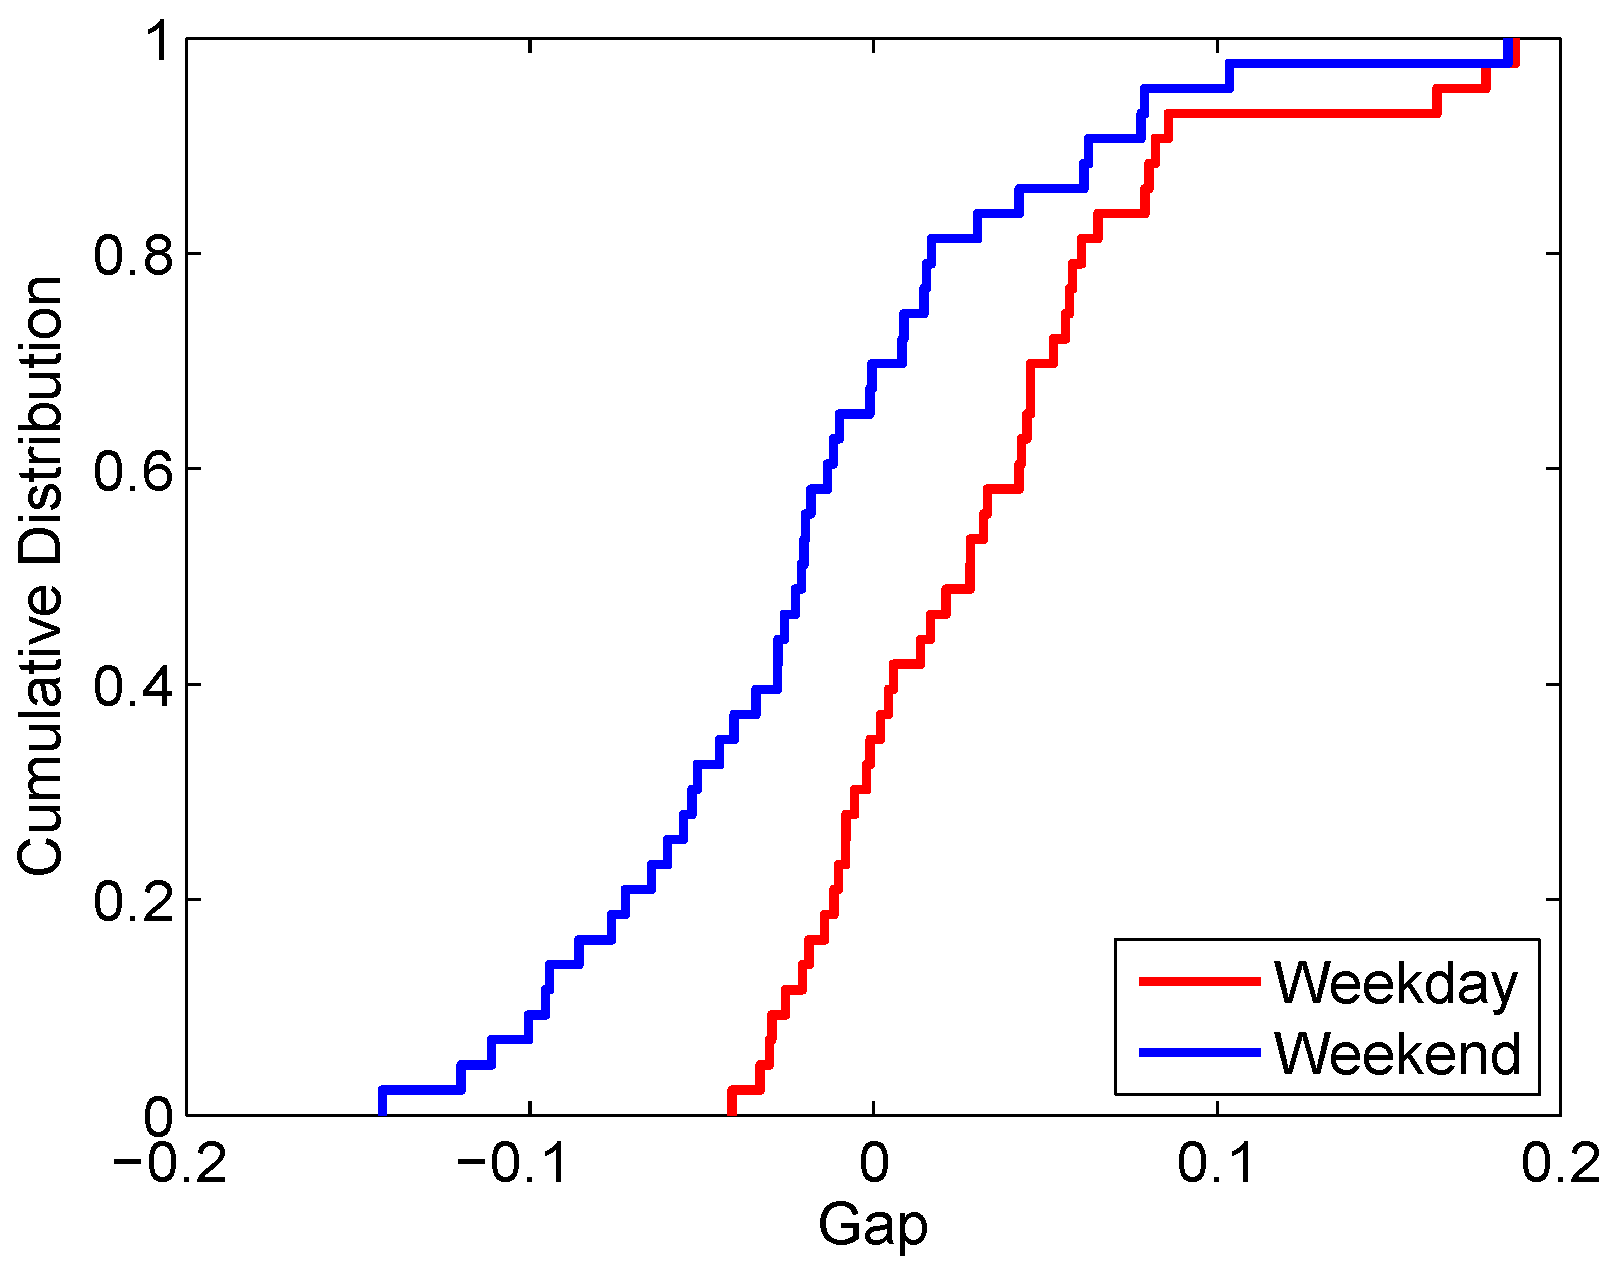
To gain a deeper understanding of the temporal predictability in Foursquare activities, we explore the effect of a weekday-weekend difference on the predictability. Intuitively, the work and study schedules during weekdays may induce a different activity pattern and consequently different temporal predictability compared to that on weekends. To uncover the weekday-weekend difference’s effect on predictability, we divide each user’s check-in records into two groups: one is the check-in records performed on weekdays and the other is the records on weekends. For each group of check-in records, we calculate the mutual information present in the data as before, and thus for each user we have his/her Iweekday and Iweekend reflecting the user’s weekday and weekend temporal predictability, respectively. However, we do not directly compare Iweekday with Iweekend because the length of a user’s inter-event time symbol sequence for weekday activities is different from that for weekend activities and the amount of mutual information generally depends on the length of the sequence [37]. Instead, we introduce the gap between the mutual information of the inter-event time symbol sequence and the 95th percentile mutual information of its shuffled sequences, defined by Gweekday = Iweekday − Iweekday0.95 and Gweekend = Iweekend − Iweekend0.95, which allow for a comparison of predictability for sequences with different lengths [17]. A larger gap indicates higher predictability in the sequence. We obtain each user’s Gweekday as well as Gweekend and illustrate the cumulative distributions of Gweekday and Gweekend for the users in Figure 7. As can be seen, the users’ Gweekday are generally larger than the Gweekend. This result indicates that for human Foursquare activities the temporal predictability on weekdays is, in general, higher than that on weekends.
In the Foursquare dataset, each check-in record provides a location-id identifying the location where the check-in is performed. The location here corresponds to the physical place at which the user performs the check-in, such as a coffeehouse, a bookstore or a restaurant. In the following, we examine the dependence of an activity’s temporal predictability on the visit frequency of the location where the previous activity was performed. This problem is related to the temporal prediction taking the information on locations into account [38,39]. Here, we only focus on the user’s top three most-visited locations since the numbers of records associated with other locations are small, which may induce big fluctuations in the results. For a user, to measure the temporal predictability of his/her activity when the previous one was performed in the user’s first most-visited location, from the user’s inter-event time symbol sequence we extract the pairs of consecutive symbols (each pair of consecutive symbols corresponds to three consecutive check-in events) where the middle check-in event is performed at his/her first most-visited location. Using the extracted pairs of inter-event time symbols, we calculate the mutual information Ifirst measuring the entropy about the latter inter-event time symbol decreased by knowing the former one, which characterizes the temporal predictability of his/her activity when the previous one is performed in the user’s first most-visited location. Similarly, for each user, we obtain his/her Isecond and Ithird, characterizing the temporal predictability of his/her activity when the previous check-in was performed in the user’s second and third most-visited location, respectively. As previously mentioned, instead of comparing the mutual information directly, we calculate the gap values to compare the predictability. For instance, for a user we define his/her gap Gfirst as the difference between his/her mutual information Ifirst and the 95th percentile of mutual information calculated from the extracted symbol pairs corresponding to his/her first most-visited location after shuffling, i.e., matching the former and latter symbols in a random manner. Similarly, we obtain each user’s Gsecond and Gthird and illustrate the cumulative distribution of the gaps for the users in Figure 8. It can be seen that the gaps corresponding to locations with higher visit frequency present larger values. This result implies that in human Foursquare activities, a user’s activity is more temporally predictable if his/her previous activity was performed in the locations with a higher visit frequency.
4. Conclusions
In this paper, we investigate the temporal predictability of human online behavior in the social network Foursquare. Our results show that for Foursquare activities, knowing the time interval between a user’s current activity and previous activity can decrease the entropy of the time interval between the next activity and the current activity, i.e., the time of a user’s next Foursquare activity is predictable. The temporal predictability is mainly explained by the equal-interval repeat; that is, humans perform consecutive Foursquare activities with approximately equal time intervals, while the unequal-interval preference, i.e., the preference of performing Foursquare activities with a fixed time interval after another given time interval, is also an origin of the predictability. We also find that the time of Foursquare activities is more predictable on weekdays than on weekends and that users’ Foursquare activity is more temporally predictable if his/her previous activity is performed at the location that he/she visits more frequently. Our findings are valuable for developing predictive algorithms and models which can be incorporated into practical online services and applications. Although in this study we only consider the correlation between the two consecutive inter-event times, i.e., the second-order correlation, the temporal predictability uncovered implies that there are strong potential predictive powers that exist in the temporal patterns of human online activities. Further efforts could be made to investigate how predictable the time of online activities can be by taking higher-order correlations into account and to explore the relationship between predictability and prediction precision for devising actual temporal prediction algorithms of human online activity.
Acknowledgments
This research is supported by the Program for New Century Excellent Talents at the University from the Ministry of Education of China (NCET) and the National Key Technology R&D Program of China (Grant No. 2015BAG15B01). Data in this study is available upon request.
Author Contributions
Wang Chen and Qiang Gao conceived and designed the experiments; Wang Chen performed the experiments; Wang Chen and Qiang Gao analyzed the data; Qiang Gao contributed analysis tools; Wang Chen, Qiang Gao and Huagang Xiong wrote the paper. All authors have read and approved the final manuscript.
Conflicts of Interest
The authors declare no conflict of interest.
References
- Barabasi, A.L. The origin of bursts and heavy tails in human dynamics. Nature 2005, 435, 207–211. [Google Scholar] [CrossRef] [PubMed]
- Brockmann, D.; Hufnagel, L.; Geisel, T. The scaling laws of human travel. Nature 2006, 439, 462–465. [Google Scholar] [CrossRef] [PubMed]
- Kovanen, L.; Kaski, K.; Kertész, J.; Saramäki, J. Temporal motifs reveal homophily, gender-specific patterns, and group talk in call sequences. Proc. Natl. Acad. Sci. USA 2013, 110, 18070–18075. [Google Scholar] [CrossRef] [PubMed]
- Centola, D. The spread of behavior in an online social network experiment. Science 2010, 329, 1194–1197. [Google Scholar] [CrossRef] [PubMed]
- Balcan, D.; Colizza, V.; Gonçalves, B.; Hu, H.; Ramasco, J.J.; Vespignani, A. Multiscale mobility networks and the spatial spreading of infectious diseases. Proc. Natl. Acad. Sci. USA 2009, 106, 21484–21489. [Google Scholar] [CrossRef] [PubMed]
- Song, C.; Qu, Z.; Blumm, N.; Barabási, A.L. Limits of predictability in human mobility. Science 2010, 327, 1018–1021. [Google Scholar] [CrossRef] [PubMed]
- Lu, X.; Bengtsson, L.; Holme, P. Predictability of population displacement after the 2010 Haiti earthquake. Proc. Natl. Acad. Sci. USA 2012, 109, 11576–11581. [Google Scholar] [CrossRef] [PubMed]
- Zhao, Z.D.; Cai, S.M.; Lu, Y. Non-Markovian character in human mobility: Online and offline. Chaos 2015, 25, 063106. [Google Scholar] [CrossRef] [PubMed]
- Takaguchi, T.; Nakamura, M.; Sato, N.; Yano, K.; Masuda, N. Predictability of conversation partners. Phys. Rev. X 2011, 1, 011008. [Google Scholar] [CrossRef]
- Zhang, L.; Liu, Y.; Wu, Y.; Xiao, J. Analysis of the origin of predictability in human communications. Physica A 2014, 393, 513–518. [Google Scholar] [CrossRef]
- Krumme, C.; Llorente, A.; Cebrian, M.; Moro, E. The predictability of consumer visitation patterns. Sci. Rep. 2013, 3. [Google Scholar] [CrossRef] [PubMed]
- Baumann, P.; Kleiminger, W.; Santini, S. How long are you staying: Predicting residence time from human mobility traces. In Proceedings of the 19th ACM International Conference on Mobile Computing and Networking, Miami, FL, USA, 30 September–4 October 2013; pp. 231–234.
- Wang, J.; Mao, Y.; Li, J.; Xiong, Z.; Wang, W.X. Predictability of road traffic and congestion in urban areas. PLoS ONE 2015, 10, e0121825. [Google Scholar] [CrossRef] [PubMed]
- Qin, S.M.; Verkasalo, H.; Mohtaschemi, M.; Hartonen, T.; Alava, M. Patterns, entropy, and predictability of human mobility and life. PLoS ONE 2012, 7, e51353. [Google Scholar] [CrossRef] [PubMed]
- Lu, X.; Wetter, E.; Bharti, N.; Tatem, A.J.; Bengtsson, L. Approaching the limit of predictability in human mobility. Sci. Rep. 2013, 3. [Google Scholar] [CrossRef] [PubMed]
- Austin, D.; Cross, R.M.; Hayes, T.; Kaye, J. Regularity and predictability of human mobility in personal space. PLoS ONE 2014, 9, e90256. [Google Scholar] [CrossRef] [PubMed]
- Wang, C.; Huberman, B.A. How random are online social interactions. Sci. Rep. 2012, 2. [Google Scholar] [CrossRef] [PubMed]
- Sinatra, R.; Szell, M. Entropy and the predictability of online life. Entropy 2014, 16, 543–556. [Google Scholar] [CrossRef]
- Lian, D.; Zhu, Y.; Xie, X.; Chen, E. Analyzing location predictability on location-based social networks. In Proceedings of the 2014 Pacific-Asia Conference on Knowledge Discovery and Data Mining, Tainan, Taiwan, 13–16 May 2014; pp. 102–113.
- Zhao, Z.D.; Yang, Z.; Zhang, Z.; Zhou, T.; Huang, Z.G.; Lai, Y.C. Emergence of scaling in human-interest dynamics. Sci. Rep. 2013, 3. [Google Scholar] [CrossRef] [PubMed]
- Chierichetti, F.; Kumar, R.; Raghavan, P.; Sarlos, T. Are web users really markovian? In Proceedings of the 2012 ACM International Conference on World Wide Web, Lyon, France, 16–20 April 2012; pp. 609–618.
- Kleinberg, J. Computing: The wireless epidemic. Nature 2007, 449, 287–288. [Google Scholar] [CrossRef] [PubMed]
- Karsai, M.; Kivelä, M.; Pan, R.K.; Kaski, K.; Kertész, J.; Barabasi, A.L.; Saramäki, J. Small but slow world: How network topology and burstiness slow down spreading. Phys. Rev. E 2011, 83, 025102. [Google Scholar] [CrossRef] [PubMed]
- Yang, X.; Yang, X. The spread of computer viruses over a reduced scale-free network. Physica A 2014, 396, 173–184. [Google Scholar] [CrossRef]
- Cortez, P.; Rio, M.; Rocha, M.; Sousa, P. Multiscale Internet traffic forecasting using neural networks and time series methods. Expert Syst. 2012, 29, 143–155. [Google Scholar]
- Yin, H.; Lin, C.; Sebastien, B.; Li, B.; Min, G. Network traffic prediction based on a new time series model. Int. J. Commun. Syst. 2005, 18, 711–729. [Google Scholar] [CrossRef]
- Yin, H.; Jiang, Y.; Lin, C.; Luo, Y.; Liu, Y. Big data: Transforming the design philosophy of future internet. IEEE Netw. 2014, 28, 14–19. [Google Scholar] [CrossRef]
- Altshuler, Y.; Fire, M.; Shmueli, E.; Elovici, Y.; Bruckstein, A.; Pentland, A.S.; Lazer, D. The social amplifier-reaction of human communities to emergencies. J. Stat. Phys. 2013, 152, 399–418. [Google Scholar] [CrossRef]
- Bagrow, J.P.; Wang, D.; Barabasi, A.L. Collective response of human populations to large-scale emergencies. PLoS ONE 2011, 6, e17680. [Google Scholar] [CrossRef] [PubMed]
- Teng, J.; Zhang, B.; Li, X.; Bai, X.; Xuan, D. E-shadow: Lubricating social interaction using mobile phones. IEEE Trans. Comput. 2014, 63, 1422–1433. [Google Scholar] [CrossRef]
- Wang, Y.; Xie, L.; Zheng, B.; Lee, K.C. High utility K-anonymization for social network publishing. Knowl. Inf. Syst. 2014, 41, 697–725. [Google Scholar] [CrossRef]
- Dey, L. Anomaly detection from call data records. In Proceedings of 2009 International Conference on Pattern Recognition and Machine Intelligence, New Delhi, India, 16–20 December 2009; pp. 237–242.
- Jiang, Z.Q.; Xie, W.J.; Li, M.X.; Podobnik, B.; Zhou, W.X.; Stanley, H.E. Calling patterns in human communication dynamics. Proc. Natl. Acad. Sci. USA 2013, 110, 1600–1605. [Google Scholar] [CrossRef] [PubMed]
- Guha, S.; Wicker, S.B. Spatial subterfuge: An experience sampling study to predict deceptive location disclosures. In Proceedings of the 2015 ACM International Joint Conference on Pervasive and UbiQuitous Computing, Osaka, Japan, 7–11 September 2015; pp. 1131–1135.
- Li, Y.; Ren, W.; Jin, D.; Hui, P.; Zeng, L.; Wu, D. Potential predictability of vehicular staying time for large-scale urban environment. IEEE Trans. Veh. Technol. 2014, 63, 322–333. [Google Scholar] [CrossRef]
- Boulle, M. Optimal bin number for equal frequency discretizations in supervized learning. Intell. Data Anal. 2005, 9, 175–188. [Google Scholar]
- Panzeri, S.; Senatore, R.; Montemurro, M.A.; Petersen, R.S. Correcting for the sampling bias problem in spike train information measures. J. Neurophysiol. 2007, 98, 1064–1072. [Google Scholar] [CrossRef] [PubMed]
- Song, L.; Deshpande, U.; Kozat, U.C.; Kotz, D.; Jain, R. Predictability of WLAN mobility and its effects on bandwidth provisioning. In Proceedings of the 25th IEEE International Conference on Computer Communications, Hong Kong, China, 26 April–1 May 2006.
- Scellato, S.; Musolesi, M.; Mascolo, C.; Latora, V.; Campbell, A.T. NextPlace: A spatio-temporal prediction framework for pervasive systems. In Proceedings of the 9th International Conference on Pervasive Computing, Istanbul, Turkey, 20–23 May 2011; pp. 152–169.
Figure 1.
Distribution of inter-event times of Foursquare check-ins for all the 43 users (a) and one typical user (b).
Figure 1.
Distribution of inter-event times of Foursquare check-ins for all the 43 users (a) and one typical user (b).

Figure 2.
Frequency count of measured H0, H1 and H2 for the 43 users.

Figure 3.
Relationship between the measured H1 and H2 for the 43 users. Black dots correspond to different users’ sequences of inter-event time symbols.
Figure 3.
Relationship between the measured H1 and H2 for the 43 users. Black dots correspond to different users’ sequences of inter-event time symbols.

Figure 4.
Mutual information (IA) in the original sequence and the statistics of mutual information in the shuffled sequences for the 43 users. The red line represents the mutual information IA in original sequences in increasing order. The lower and upper ends of the blue columns are the smallest value and 95th percentile of the mutual information of the shuffled sequences for each user. The index represents the user numbered by the order of the mutual information in its original sequence.

Figure 5.
Original mutual information and statistics of the mutual information from randomized sequences preserving consecutive identical symbols for the 43 users. The red line represents the mutual information in the original sequences in increasing order. The error bars indicate one standard deviation around the mean of the mutual information from randomized sequences. The ticks at the middle of the error bars indicate the means. The index represents the user numbered by the order of the mutual information in its original sequence.

Figure 6.
Mutual information of modified sequences and statistics of mutual information from shuffled modified sequence for the 43 users. The red line represents the mutual information from the modified sequences for each user in increasing order. The lower and upper ends of the blue columns are the smallest value and 95th percentile of the mutual information from the shuffled modified sequences for each user. The index represents the user numbered by the order of the mutual information in its modified sequence.

Figure 7.
Cumulative distribution of Gweekday and Gweekend for the 43 users.

Figure 8.
Cumulative distribution of Gfirst, Gsecond and Gthird for the 43 users.

© 2016 by the authors; licensee MDPI, Basel, Switzerland. This article is an open access article distributed under the terms and conditions of the Creative Commons Attribution (CC-BY) license (http://creativecommons.org/licenses/by/4.0/).
Share and Cite
MDPI and ACS Style
Chen, W.; Gao, Q.; Xiong, H. Temporal Predictability of Online Behavior in Foursquare. Entropy 2016, 18, 296. https://doi.org/10.3390/e18080296
AMA Style
Chen W, Gao Q, Xiong H. Temporal Predictability of Online Behavior in Foursquare. Entropy. 2016; 18(8):296. https://doi.org/10.3390/e18080296
Chicago/Turabian StyleChen, Wang, Qiang Gao, and Huagang Xiong. 2016. "Temporal Predictability of Online Behavior in Foursquare" Entropy 18, no. 8: 296. https://doi.org/10.3390/e18080296
Note that from the first issue of 2016, this journal uses article numbers instead of page numbers. See further details here.