Article

Real-Time Robust Voice Activity Detection Using the Upper Envelope Weighted Entropy Measure and the Dual-Rate Adaptive Nonlinear Filter

by
Wei Qing Ong
1,*,
Alan Wee Chiat Tan
1,
V. Vijayakumar Vengadasalam
1,
Cheah Heng Tan
2 and
Thean Hai Ooi
2
1
Faculty of Engineering and Technology, Multimedia University, Jalan Ayer Keroh Lama, Melaka 75450, Malaysia
2
Motorola Solutions Malaysia Sdn. Bhd., Plot 2 Technoplex Industrial Park, Mukim 12 SWD, Bayan Lepas, Penang 11900, Malaysia
*
Author to whom correspondence should be addressed.
Entropy 2017, 19(11), 487; https://doi.org/10.3390/e19110487
Submission received: 19 June 2017 / Revised: 1 September 2017 / Accepted: 8 September 2017 / Published: 28 October 2017
(This article belongs to the Special Issue Entropy in Signal Analysis)

Abstract

:
Voice activity detection (VAD) is a vital process in voice communication systems to avoid unnecessary coding and transmission of noise. Most of the existing VAD algorithms continue to suffer high false alarm rates and low sensitivity when the signal-to-noise ratio (SNR) is low, at 0 dB and below. Others are developed to operate in offline mode or are impractical for implementation in actual devices due to high computational complexity. This paper proposes the upper envelope weighted entropy (UEWE) measure as a means to enable high separation of speech and non-speech segments in voice communication. The asymmetric nonlinear filter (ANF) is employed in UEWE to extract the adaptive weight factor that is subsequently used to compensate the noise effect. In addition, this paper also introduces a dual-rate adaptive nonlinear filter (DANF) with high adaptivity to rapid time-varying noise for computation of the decision threshold. Performance comparison with standard and recent VADs shows that the proposed algorithm is superior especially in real-time practical applications.

1. Introduction

1.1. Voice Activity Detection

Voice activity detection (VAD) is a process in which speech and non-speech segments in an audio signal are detected. Non-speech segments include silences, unwanted utterances or background noise from crowds, machinery, aircraft, in the interior of moving vehicles, etc. [1]. Voice activity detection is an important component in speech signal processing for speech recognition and noise reduction. Its application covers a variety of areas such as mobile telecommunication systems and hearing aid devices. In mobile telecommunication systems, voice activity detectors help to increase system capacity and enhance overall speech coding quality. Another application of VAD is to avoid unnecessary coding and transmission of non-speech packets in the Voice over Internet Protocol (VoIP) [2]. The accuracy of a voice activity detection algorithm is affected by the amount of noise in a speech signal, which is measured by the signal-to-noise ratio (SNR). The non-stationary background noise also affects the performance of VAD.

1.2. Discriminative Features and Classification

Much research has been conducted to develop robust VAD algorithms to fulfill specific needs in various applications. These algorithms utilize distinctive spectro-temporal features to distinguish between speech and non-speech segments. Similar features have been used for musical timbre analysis [3]. A voice activity detector basically consists of two main processes, namely feature extraction and classification. Some of the popular features in speech processing are zero crossing rate [4], energy [5], signal-to-noise ratio, spectral flatness [6], correlation [7], etc. Instead of modeling the dynamic noise features using support vector machine (SVM) trained on noise-labeled training data [8], some recent VADs focus on the extraction of robust speech features such as the formant frequencies of eight English vowels [9].
In existing VADs, three classification algorithms are used, namely the rule-based algorithm, statistical modeling or the machine learning approach. Some conventional VADs incorporated the zero-crossing rate or energy-related feature with the rule-based algorithm [10]. Some VADs, such as G.729B [11] and VAD for AMR [12], which are commercially available, employ rule-based classification algorithms with pre-determined thresholds or trained models [13]. Rule-based classification algorithms are most suitable when the features show clear discrimination between speech and non-speech segments [14]. Statistical models are superior to rule-based classification algorithms when the segments are not clearly demarcated. There are several popular statistical models in VAD systems such as the likelihood ratio test (LRT) [15]. Tan et al. modified the LRT-based model by selecting discrete Fourier transform bins that consist of harmonic spectral peaks to determine the likelihood ratio. Based on the investigation by He et al., the LRT-based VAD suffers from false triggering in the detection of non-verbal vocalized acoustic signals, i.e., non-speech sounds produced during breathing, coughing or other similar activities. Other commonly-used statistical models in VADs are the hidden Markov models (HMMs) [16] and Gaussian mixture models (GMMs) [17]. In recent years, impressive results in VAD have been obtained using machine learning approaches such as deep neural network [18], deep learning [19] and support vector machine. Among these algorithms, support vector machines are the most popular classifiers that incorporate Mel frequency cepstral coefficients (MFCCs) as the discriminative feature for robust VAD development [20,21].

1.3. VAD Systems and Performance Measurement

The classification algorithms for VADs can be constructed using supervised, semi-supervised or unsupervised learning systems. These three learning systems differ in terms of their dependency on labeled training data. Voice activity detection algorithms trained on labeled speech and noise data are known as supervised learning systems. The aforementioned support vector machine is one of the supervised learning systems that was trained to obtain the optimum decision hyperplane for classification. In semi-supervised learning systems, training is achieved using speech or noise data, e.g., in formant-based VAD, the threshold is determined using initial non-speech segments [9]. Both supervised and semi-supervised learning systems require labeled training data, which could be costly when the size of training data increases. VADs based on supervised and semi-supervised learning systems are not robust against noise types that were not used in the training stage. It is unrealistic to construct a training database of every possible noise type. Hence, the unsupervised learning system is preferable since the training does not require labeled data. Unsupervised VAD simply relies on ongoing analysis of the signals as in [22] in which the adaptive threshold is derived using unlabeled data.
Performance parameters of voice activity detection algorithms are detection accuracy, robustness and speed. The detection accuracy quantifies the ability of the VAD algorithm to correctly detect speech and non-speech components in a given audio signal. Robustness is a measure of the ability of a VAD algorithm to maintain accurate performance for different types and levels of signal degradation. In practical applications, high-speed VADs are preferred. Most of the VADs suffer from the trade-off between speed and detection accuracy. VAD for adaptive multi-rate Option 2 (AMR-VAD2) is fast, and simple features are extracted based on the mapping of the channel SNR to a pre-defined voice metric table. In their feature extraction algorithm, the summation of voice metrics would be higher for channels that contain higher SNR [12]. A revised version of AMR-VAD2, which is known as low-resource VAD (LR-VAD), was proposed in [23] to optimize AMR-VAD2 for implementation in DSP systems. The authors simplified AMR-VAD2 by eliminating the long-term prediction flag. The robustness and detection accuracy of both AMR-VAD2 and LR-VAD decrease when SNR drops. In this case, the sound level of speech is close to the background noise floor level in a highly degraded speech signal. Similarly, Yoo et al. proposed a simple formant-based VAD that extracts the peak-neighbor difference (PND) where peaks are localized using formant frequencies [9]. However, the formant-based VAD is not robust against noise because the average energy of peaks from the immediate surrounding areas increases as SNR decreases, resulting in a low peak-neighbor difference and low detection accuracy. To improve the detection accuracy of non-stationary noise, Aneeja and Yegnanarayana proposed the single frequency filtering (SFF) approach for amplitude envelope extraction. The feature extracted using SFF survives in a highly degraded signal. However, its envelope computation is complex due to the large number of frequency channels required. The SFF-based VAD can be improved by replacing the SFF extraction approach with gammatone filter banks with the reduced channel numbers [24]. Besides using the gammatone filters, the mean and variance computation in SFF-based VAD are replaced with the entropy measure to improve the discrimination power of features. Similar to the SFF approach, GE-VAD uses a weight factor to compensate the effect of the noise floor. The authors in [25] assumed that the noise floor of the SFF amplitude envelope can be modeled using the lowest twenty percent of the samples. This approach is inappropriate for continuous real-time VADs. Further, VADs with weight factors obtained using this assumption are not robust in audio signals with time-varying noise.

1.4. The Contributions of This Article

A review of existing VAD algorithms shows that the presence of non-stationary noises especially at low SNRs results in low detection accuracy. A number of these VADs are designed for offline applications. In this paper, we aim to develop a real-time robust voice activity detection algorithm with high detection accuracy for voice command devices. We have implemented an unsupervised learning system to avoid dependency on labeled training data.
As in our earlier paper [24], this paper also uses gammatone filter and extract weighted entropy at the front-end of the VAD to extract features that contain frequency-sensitive information of the signal. Unlike [24], which relies on the sampled signal to establish a constant noise floor and weight factors, this paper uses the asymmetric nonlinear filter (ANF) to generate adaptive weight factors. ANF is used as an upper envelope detector in the calculation of adaptive weight factors, which is subsequently used to obtain the weighted entropy. This upper envelope weighted entropy (UEWE) can be used to identify speech and non-speech segments of the gammatone-filtered signal.
In addition to UEWE, we also proposed the dual-rate adaptive nonlinear filter (DANF) for decision threshold computation. At low SNR, it is a challenge to set an appropriate decision threshold due to the high noise floor level. The difficulty is compounded by short intermediate pauses between two sets of continuous utterances. In UEWE, short pauses in the potential speech regions are prone to have a higher noise floor level than long noise intervals. If the decision thresholds of a long noise interval and potential speech regions are obtained in the same manner, some of the speech segments may be detected as noise. DANF has been developed to simultaneously apply the correct decision threshold during long noise intervals and potential speech regions.
The remaining parts of this paper are organized in the following manner. Section 2 discusses the techniques and implementation of the proposed VAD algorithm. Section 3 presents the results of the proposed and existing VAD algorithms. Section 4 discusses the performance evaluation, and Section 5 summarizes the paper.

2. Proposed Voice Activity Detection Algorithm

This section details the motivations and implementation procedure of the upper envelope weighted entropy (UEWE) measure and the dual-rate adaptive nonlinear filter (DANF) of the proposed algorithm. In Section 2.1, the theoretical basis of UEWE and DANF is discussed, and Section 2.2 describes the implementation procedures of the proposed algorithm.

2.1. Background and Motivation

In this section, we present an overview of the proposed VAD and the description of each technique implemented in the UEWE measure and DANF. Figure 1 shows the architecture of the proposed VAD algorithm.
In this proposed VAD, the UEWE measure is used to extract robust discriminative features of the signal, while DANF is used to compute an adaptive threshold at the dual-changing rate. The various techniques used for feature extraction and the classification procedures of speech and non-speech segments are discussed below.

2.1.1. Gammatone Filter

In the human ear, the cochlea is the identifier for constituent frequencies embedded in any given audio sample. The cochlea is composed of the basilar membrane with different thicknesses and widths along its length, and it functions as a frequency analyzer. Different frequencies resonate maximally at different positions of the basilar membrane [26]. In other words, the basilar membrane is tonotopically organized. The gammatone filter was popularized by Johannesma in 1972 [27] and has found wide use in speech recognition [28,29], musical timbre analysis [3], etc. The gammatone filter bank simulates the frequency analysis capability of the basilar membrane by having several gammatone filters with different center frequencies. The gammatone filter is a linear filter described by an impulse response formed by multiplying the gamma distribution with a sinusoidal tone as shown in Equation (1).
g ( t ) = a t n 1 e 2 π b t cos ( 2 π f c t + ϕ )
where f c is the center frequency in Hz, a is the amplitude (gain), ϕ is the phase of the carrier in radians, n is the order of the filter, t is time in seconds and b is the bandwidth of the filter in Hz, and its value is given in Equation (2).
b = 1.019 × 24.7 ( 4.37 × 10 3 f c + 1 )
In [25], signal amplitude envelopes are computed at equally-distributed center frequencies with a constant bandwidth of 20 Hz. This distribution of center frequencies does not realistically represent the resonances present in the basilar membrane. To simulate the motion of the basilar membrane, center frequencies of the gammatone filter bank are equally distributed on the equivalent rectangular bandwidth scale (ERB-rate scale) as defined below,
E R B S ( f c ) = 21.4 · log 10 ( 1 + 4.37 · f c / 1000 )
Similar to the frequency-to-place transformation that takes place in the basilar membrane, the convolution of the gammatone filter bank and speech signals produces output-specific frequencies and responds strongly to particular frequency bands of the gammatone filter bank. Similar to a bandpass filter, the gammatone filter retains only frequency components that fall within the band. Thus, each band specified by its center frequency represents a specific location on the basilar membrane. Characteristics of speech and noise differ in terms of their constituent frequencies. The noise spectrum is typically flat, whereas the speech spectrum is usually localized in the lower frequency band and has peaks at the respective formant frequencies. Thus, the gammatone filter bank can be applied in the extraction of useful frequency-sensitive information.

2.1.2. Asymmetric Nonlinear Filter

In this section, we discuss noise compensation using the asymmetric nonlinear filter (ANF). Unlike most of the conventional noise suppression methods, which filter noise with a fixed value estimated from the noise floor [25], an adaptive noise filtering approach is more appropriate in filtering a time-varying noise floor. The asymmetric nonlinear filter is one of the approaches used to estimate the changing noise floor, which is necessary for noise suppression. The asymmetric nonlinear filter is represented in α o u t [ m , n ] and output α o u t [ m , n ] , respectively.
α o u t [ m , n ] = λ i α o u t [ m 1 , n ] + ( 1 λ i ) α i n [ m , n ] , if α i n [ m , n ] α o u t [ m 1 , n ] λ j α o u t [ m 1 , n ] + ( 1 λ j ) α i n [ m , n ] , if α i n [ m , n ] < α o u t [ m 1 , n ]
where m is the frame index, n is the channel index and λ i and λ j are constants. By having two conditional filter designs, the asymmetric nonlinear filter is able to track the fast-changing speech energy or the slower time-varying noise floor depending on the value of λ i and λ j from Equation (4). When λ i < λ j , the nonlinear filter is tuned to track the upper envelope of the fast-changing speech energy. When λ i λ j , the filter tracks the slower-varying noise floor or the lower envelope. Figure 2 illustrates the two modes of tuning of the asymmetric nonlinear filter.
The asymmetric nonlinear filter was utilized in [30] as a lower envelope detector. Noise suppression is carried out using the spectral subtraction technique in which the estimated noise floor was subtracted from the instantaneous power. The effectiveness of noise suppression using spectral subtraction relies on the accuracy of the noise floor level estimated by the lower envelope detector. One of the drawbacks of spectral subtraction using the asymmetric nonlinear filter is that the accuracy of lower envelope detection suffers from a trade-off between estimated noise floor maximization and the minimization of fast changing speech energy especially in cases in which the noise floor varies rapidly. If λ j is set high enough to cover an uneven noise floor, it is likely that the fast-changing speech energy would also be partially tracked as noise floor. On the other hand, if λ j is reduced to avoid any tracking of speech energy, the estimated noise floor-level would not be sufficient for the suppression, as shown in Regions A and B of Figure 2b. Furthermore, the nature of the noise floor varies from one noise type to another, compounding the difficulty in determining an optimal value for both λ i and λ j . In our model, instead of using spectral subtraction to compensate noise effects, we have used the asymmetric nonlinear filter as an upper envelope detector to obtain a weight factor to compensate the noise effect in real time. The advantage of using the asymmetric nonlinear filter as an upper envelope detector is that the upper envelope of the speech energy can be traced in real time with hangover effect.

2.1.3. Entropy as a Information-Theoretic Measures

The characteristic of speech and noise in terms of their distribution across frequency is utilized as a discriminative feature for voice activity detection. Entropy is an information-theoretic measurement that measures variability based on the probability of event occurrences. Entropy has been used to compute the long-term signal variability (LTSV), which measures the amount of non-stationarity [1,31]. Entropy has also been used to quantify disorder in a spectral domain based on the assumption of speech being more organized than noise [32,33]. Entropy has also found use in a speaker recognition system as approximate entropy [34] and in the biomedical field as the refined multi-scale Hilbert–Huang spectral entropy [35]. Shannon’s entropy for information source measurement is defined in Equation (5).
H ( x ) = i = 0 n 1 P ( x i ) log 2 P ( x i )
where P ( x i ) is the probability function of the i-th element of variable x of length n.
In our approach, the upper envelope weighted entropy is measured to discriminate speech and noise segments. In Section 2.1.1, we have mentioned that the responses of speech and noise regions to gammatone filter frequencies differ in terms of their distribution, as speech has higher resonances at certain frequency bands, whereas the noise has a more even distribution. Hence, entropy is an appropriate measure to provide a good discrimination parameter for speech and non-speech segments of the filtered signal across frequency bands. This application of entropy differs from the approach taken in the LTSV measure [1], where entropy is used to compute signal variability across time. Entropy is a more suitable measure for the computation of signal variability across frequencies instead of time. Entropy depends on the probability of each event, but does not capture the spread and magnitude of a signal. The application of the entropy measure in our approach will be further discussed in Section 2.2.

2.1.4. Dual-Rate Adaptive Nonlinear Filter

As shown in Figure 3, practical VAD applications usually contain non-speech intervals before and after an utterance usually exist.
From Figure 3 and Figure 4, we observe that the signal in intervals shown as Region A has a similar amplitude as parts of the speech signal shown as Region B, especially in low SNR scenarios, which makes it hard to identify an ideal threshold that can be used to correctly classify speech and non-speech segments. In addition, we can also observe from Figure 4 that short intermediate pauses (non-speech segments) exist between sentences in Region B. Although the noise floor level of Region A is relatively constant, the amplitude of the short intermediate pauses in Region B is generally higher than Region A. If the decision threshold is set high enough to accommodate Region A and the intermediate pauses in Region B, parts of the speech segments in Region B would also be classified as noise. To circumvent this scenario, the dual-rate adaptive nonlinear filter (DANF) that computes an adaptive decision threshold at two different rates of change, one for Region A and another for Region B, is introduced. The functional block diagram of DANF is as shown in Figure 5.
The decision threshold for Region A is set to the input, γ m , while the decision threshold for Region B is computed using the asymmetric nonlinear filter (ANF). A simple binary switch controller, u m , with two states, i.e., off (zero) and on (one), is used to determine the switching between Region A and Region B, respectively. The controller is turned on when γ m is higher than the transition threshold, T m . The ANF is used as a lower envelope detector to aptly separate speech segments and short intermediate pauses (if any) in Region B into speech and non-speech classes, respectively. The filter output, which is the decision threshold θ m of the current m-th frame, is fed back to the ANF for the next filter cycle. The output of the DANF ( θ m ) is fed into the decision logic circuit to produce the final VAD decision.

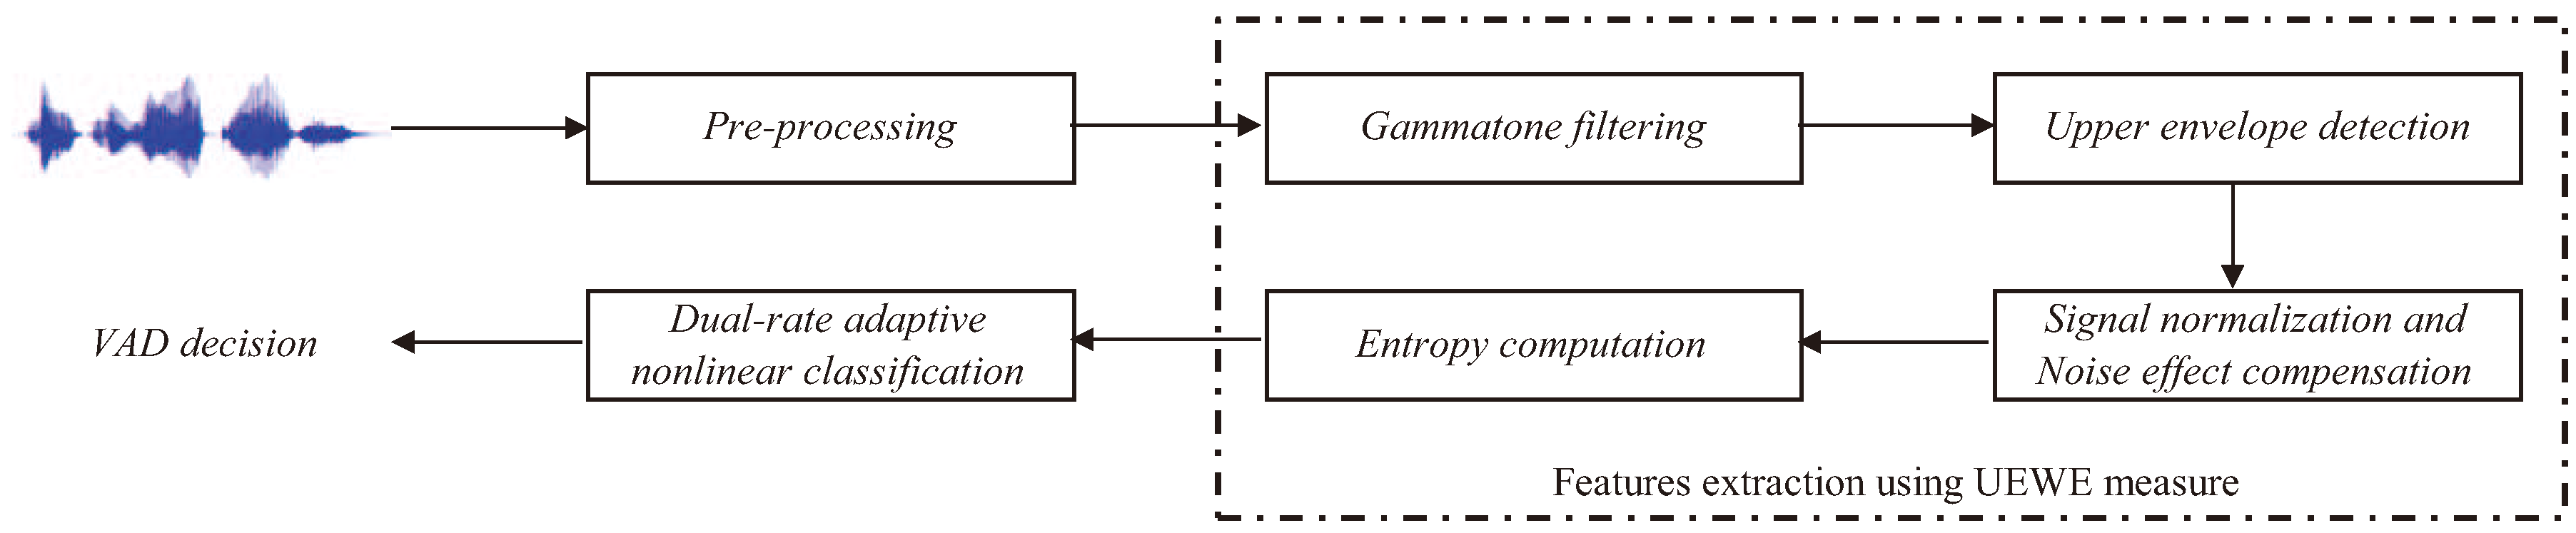
2.2. The Proposed Voice Activity Detection Algorithm

In this section, we present the implementation details of the proposed voice activity detection algorithm. The following procedures apply for each speech frame of size N. Let s m ( n ) be the discrete-time speech samples in the m-th frame (also the current frame) where n = 0 , 1 , , N 1 . Steps 2–6 describe the implementation of UEWE measure in the proposed VAD, whereas Steps 7–9 describe the speech/non-speech classification procedure using DANF.
Step 1
Pre-emphasis: Signal s m ( n ) is pre-emphasized, and the resultant signal is denoted as x m ( n ) = s m ( n ) ζ · s m ( n 1 ) , where ζ is the pre-emphasis factor.
Step 2
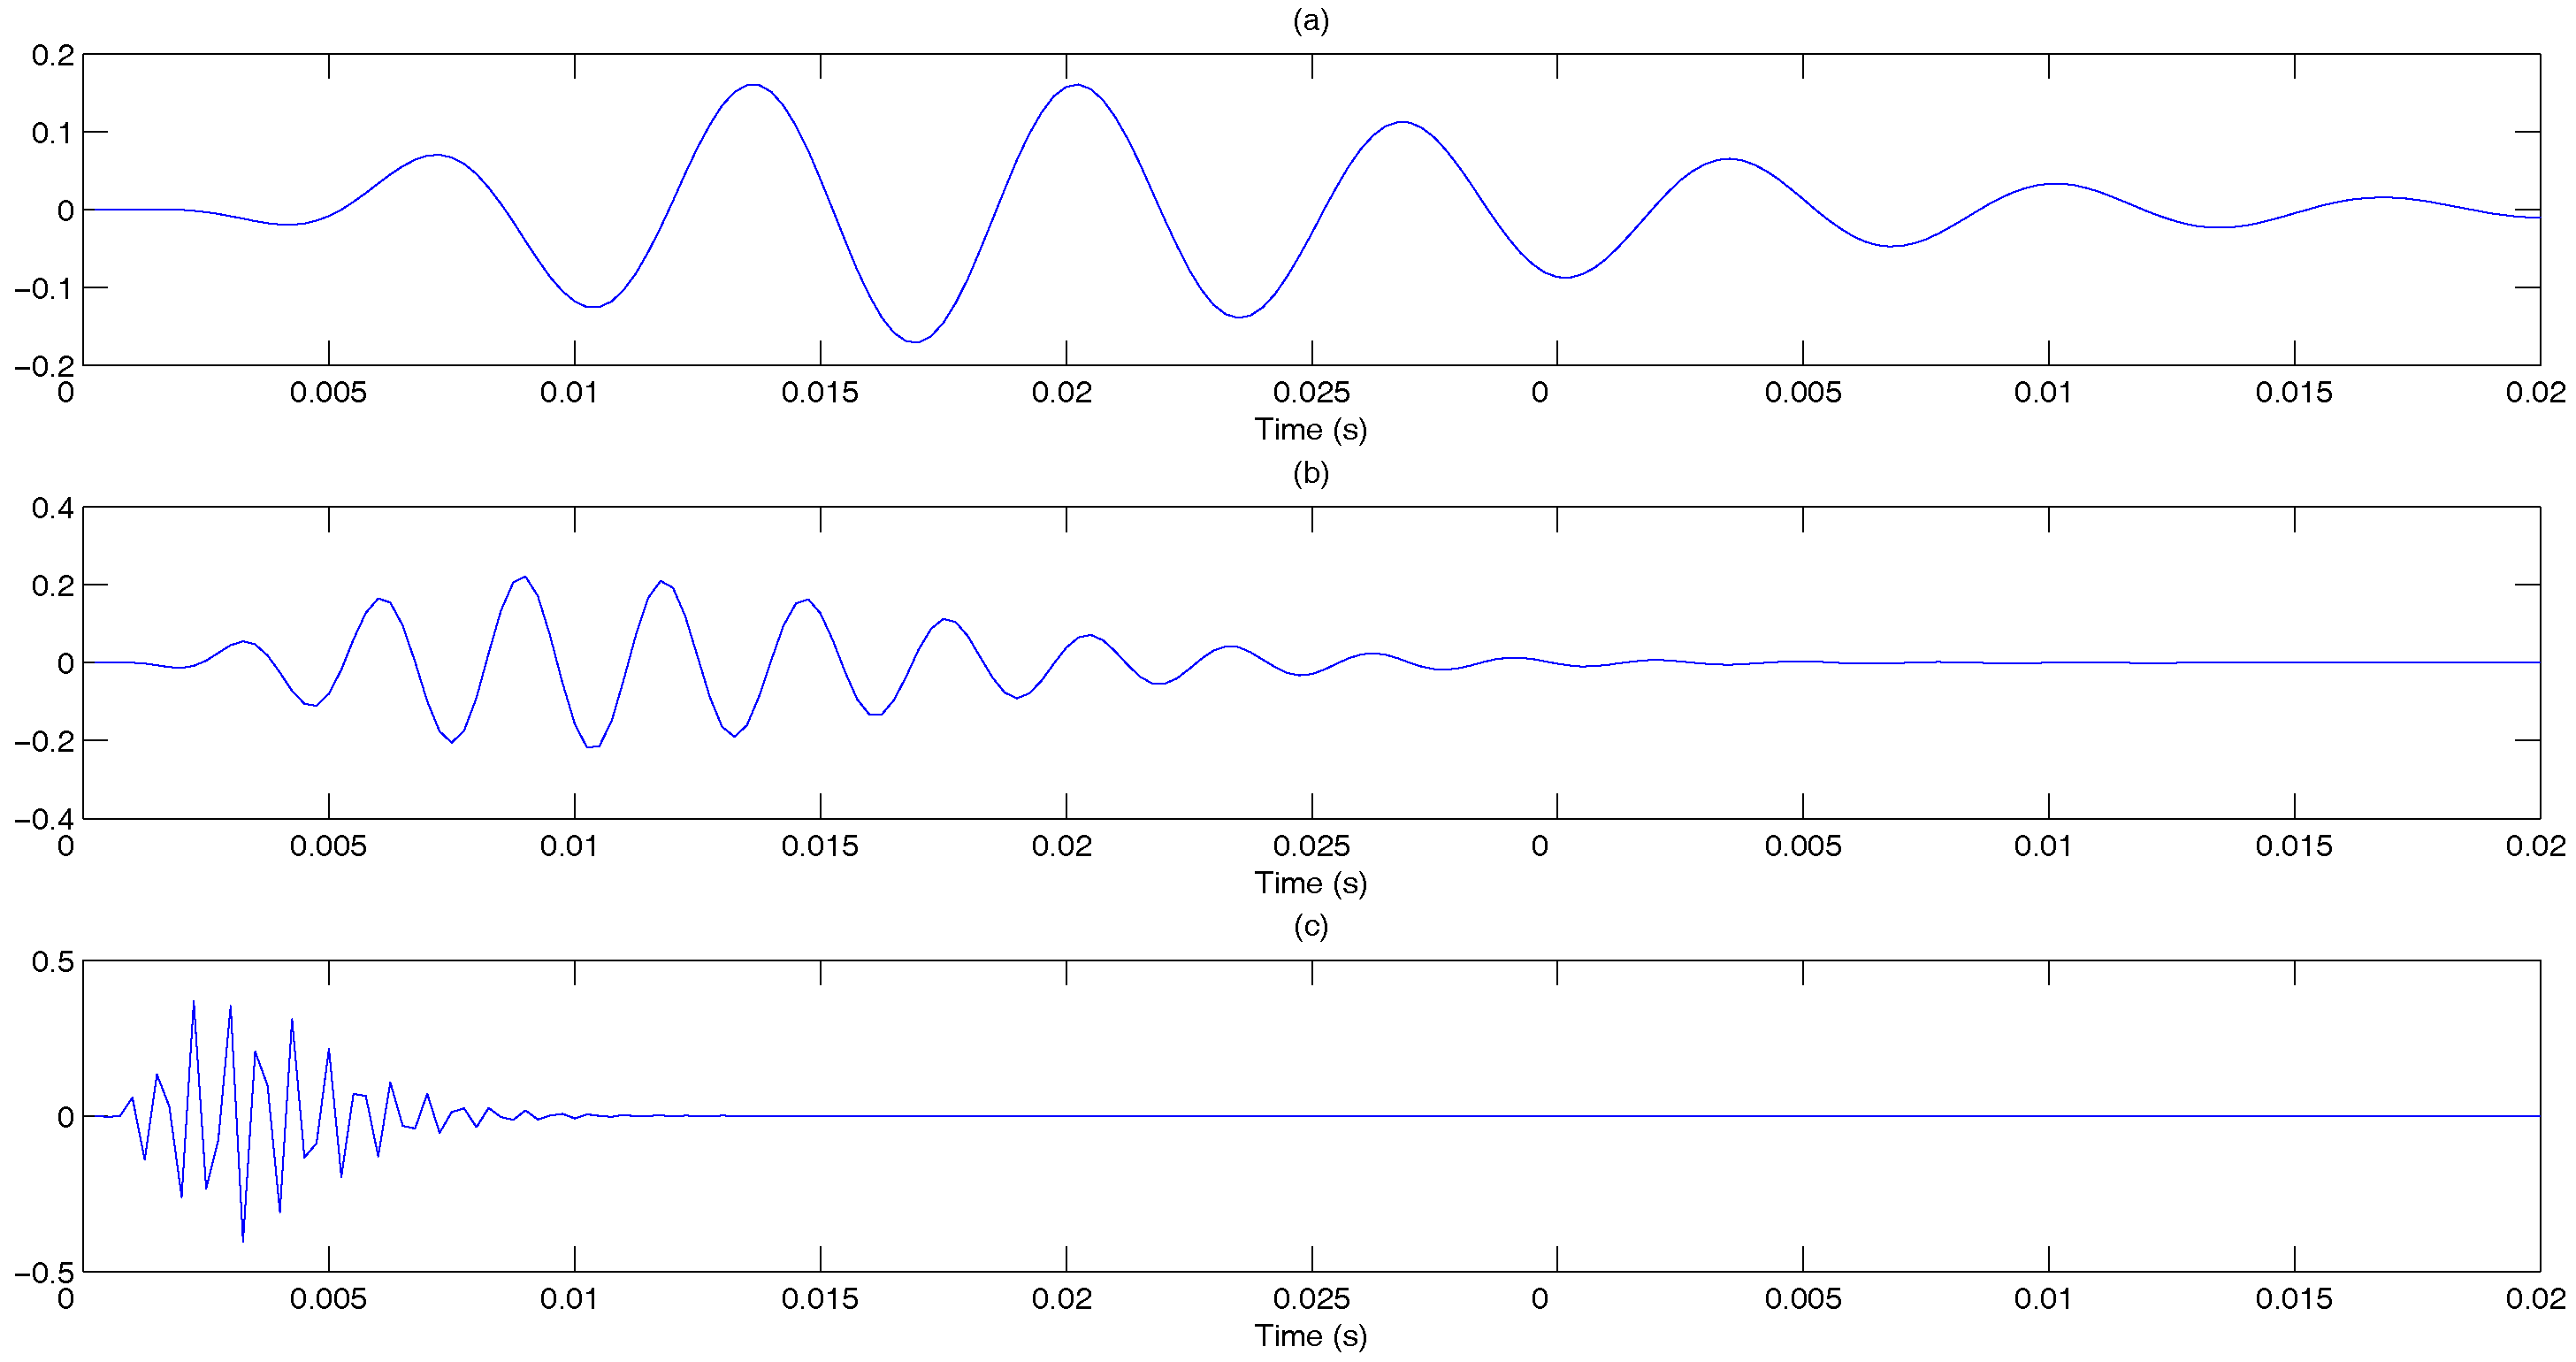
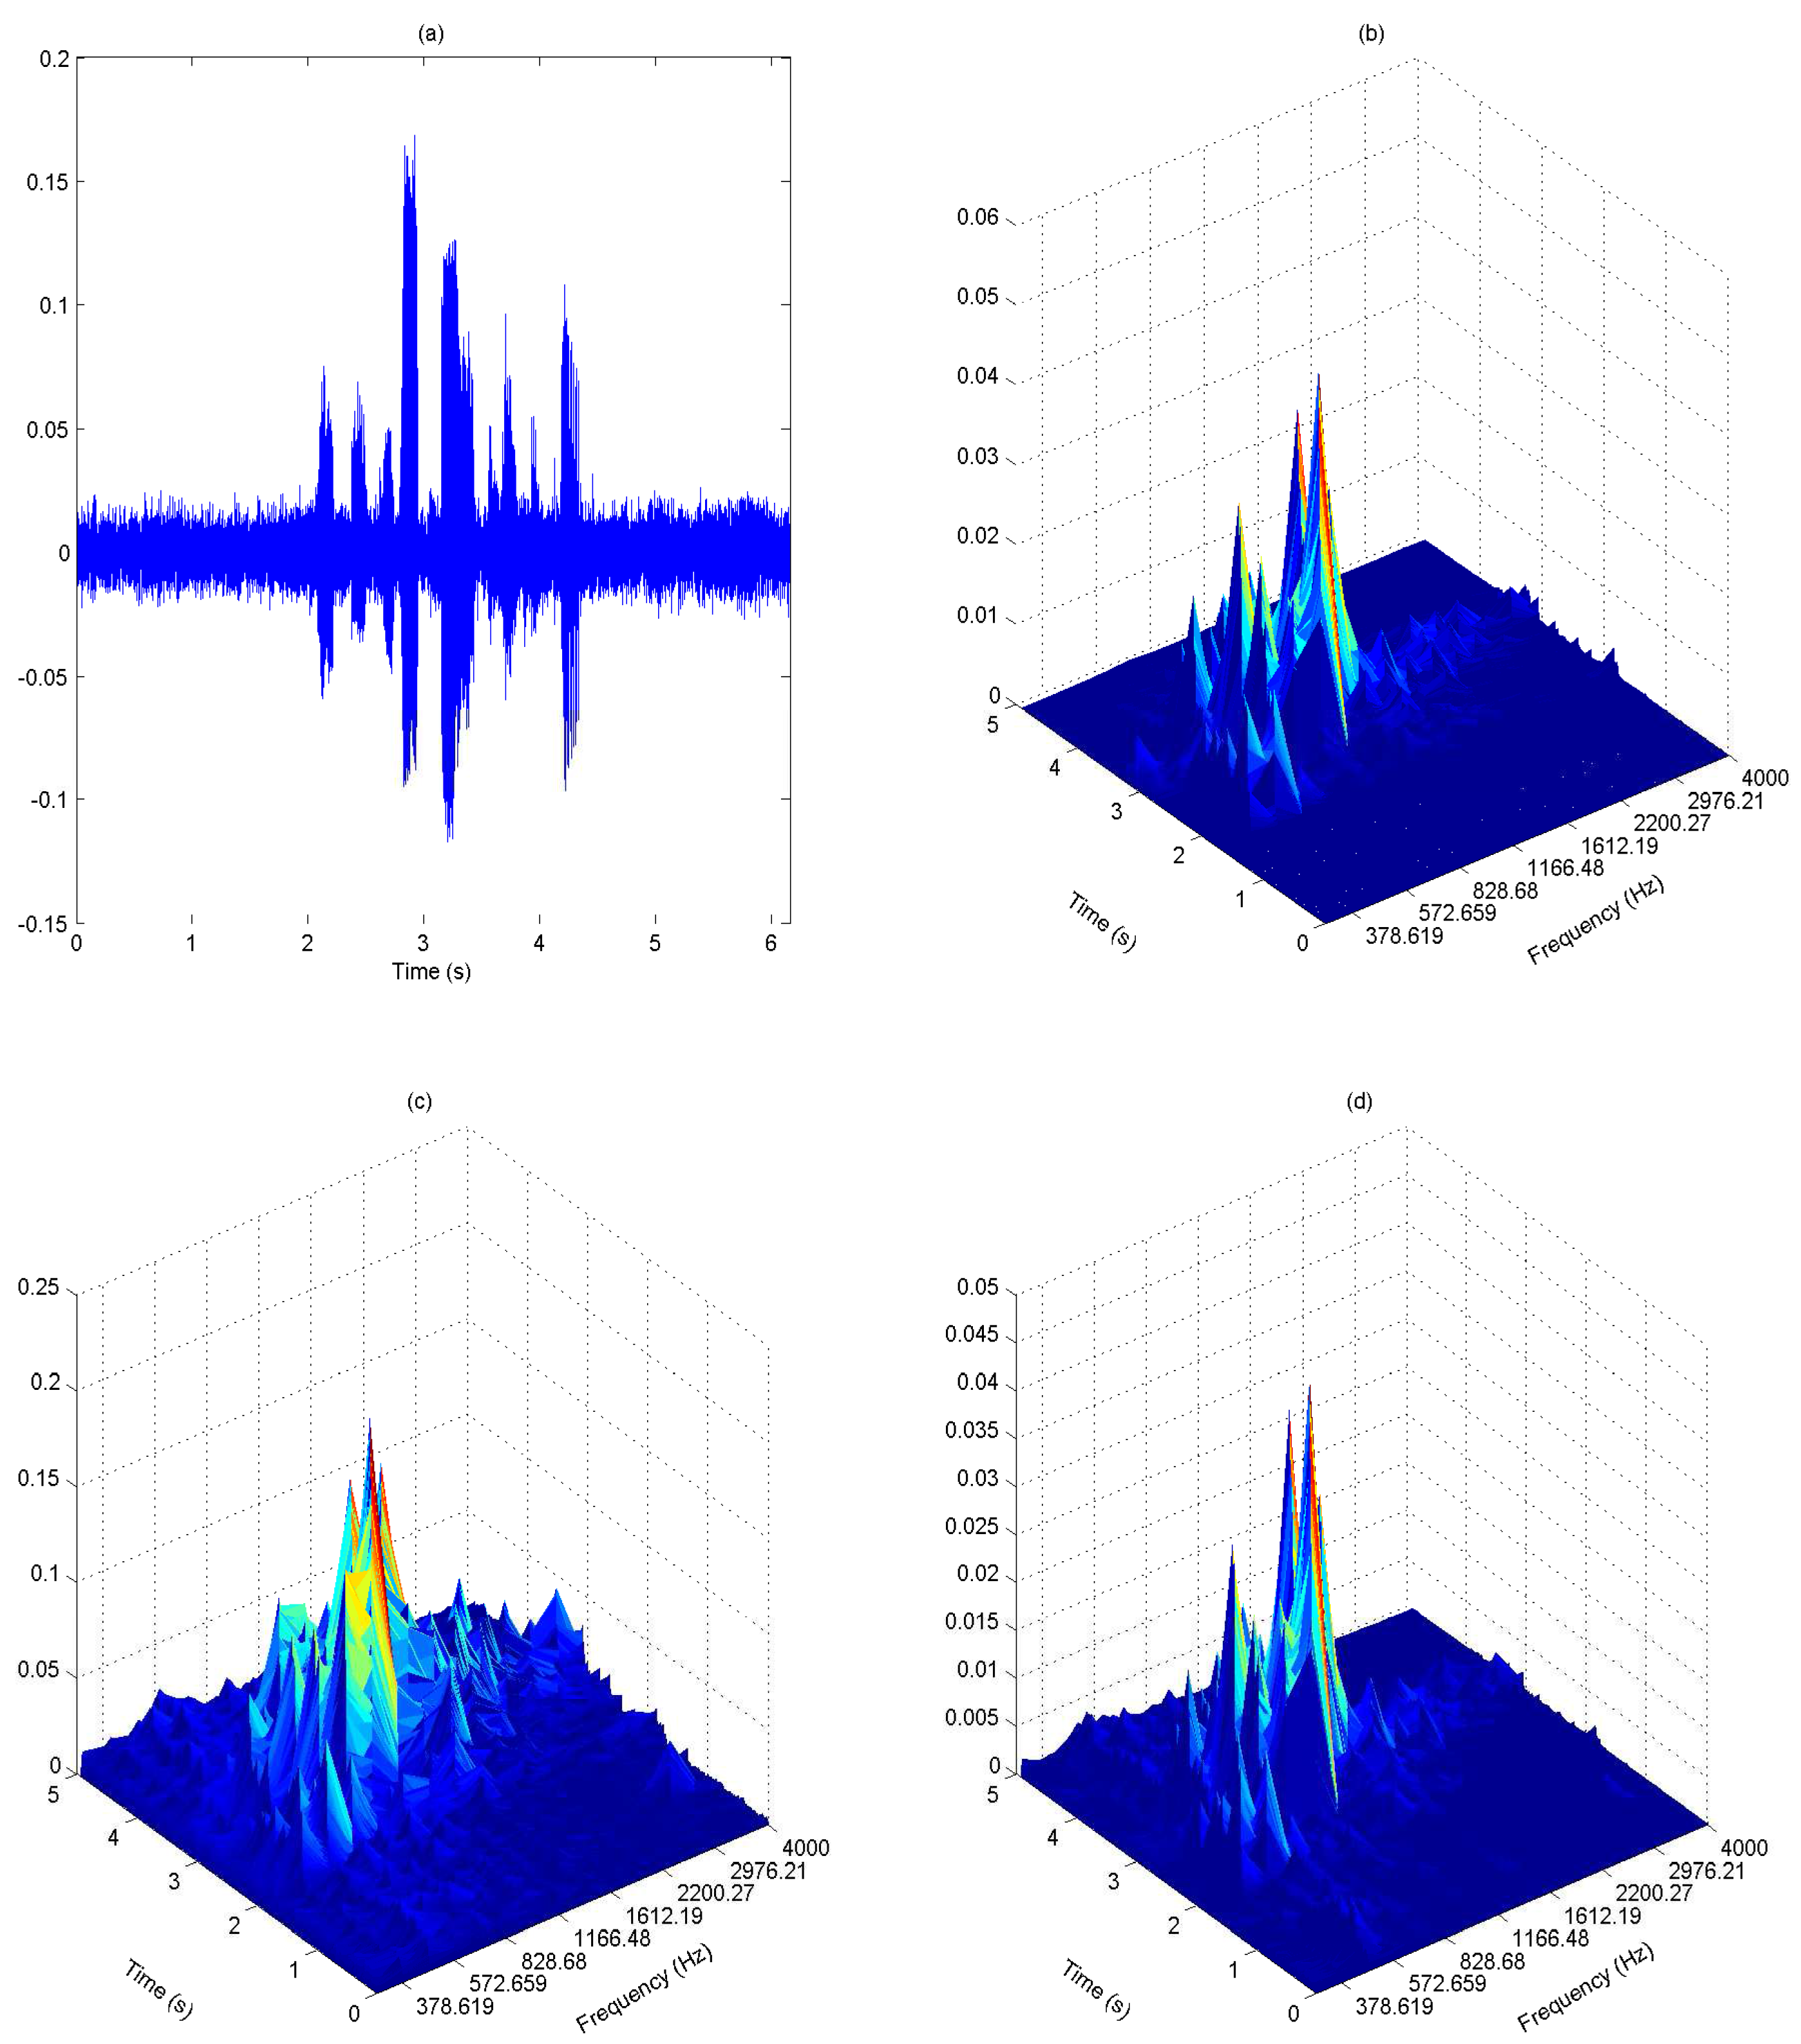
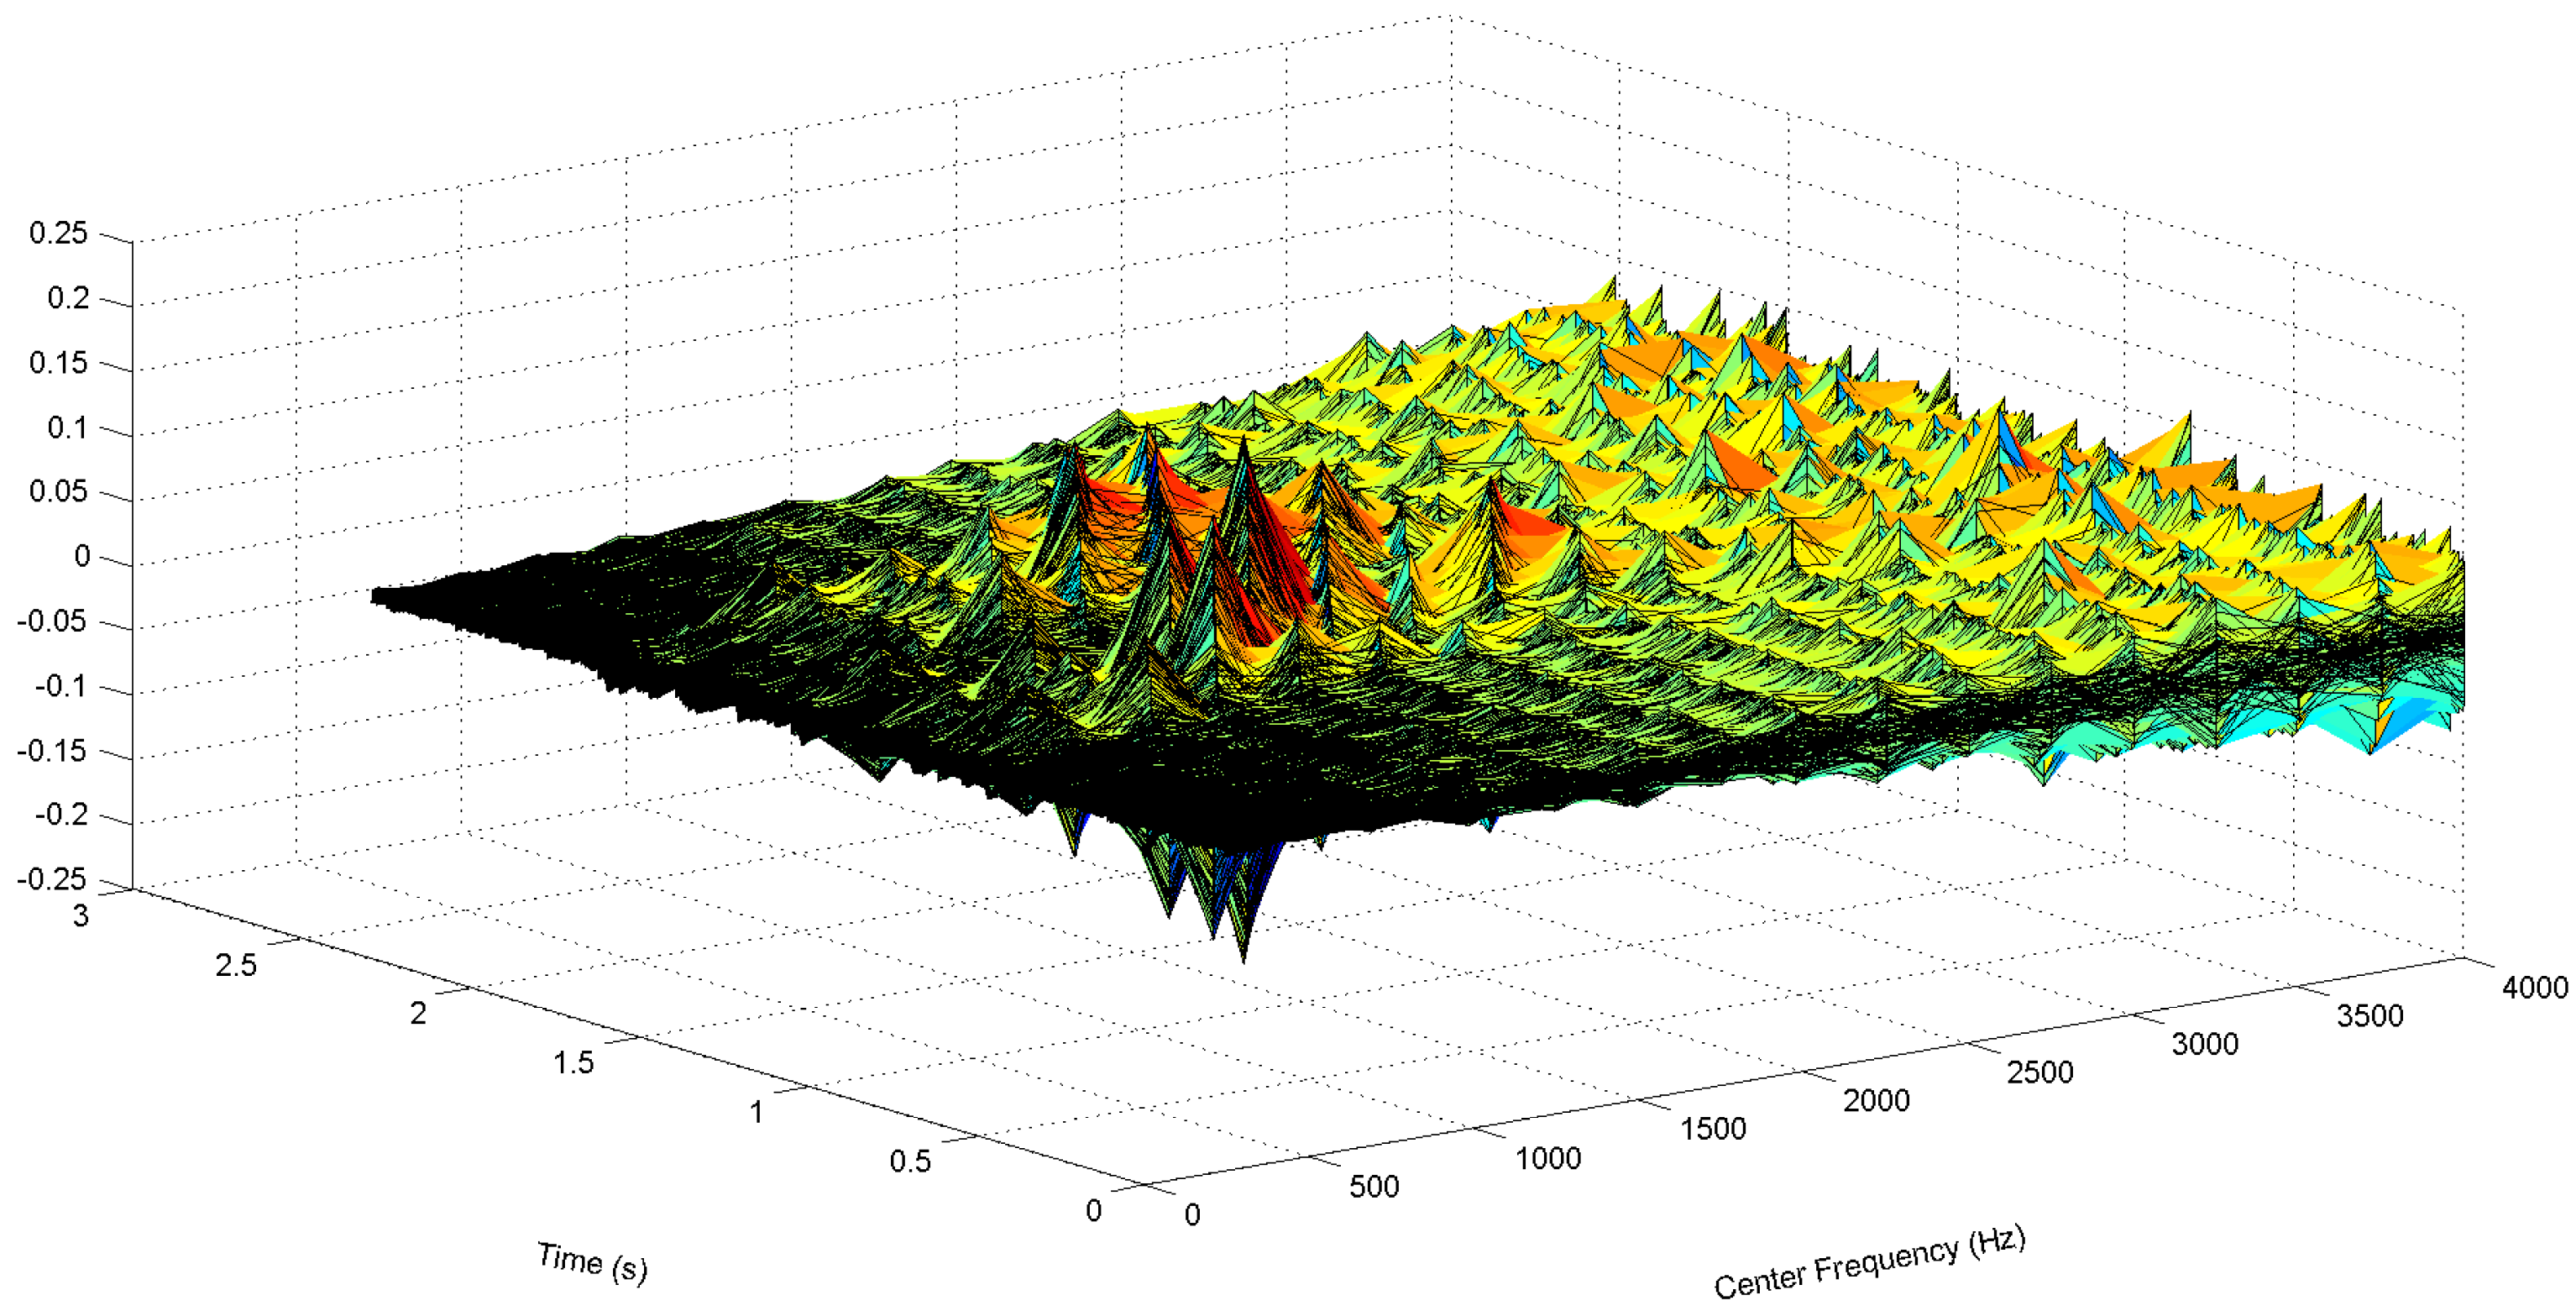
Gammatone filtering: A K channel gammatone filter bank, where each filter has length L, is constructed based on Equations (1)–(3). The impulse response of the k-th gammatone filter is denoted as G k ( l ) , where l = 0 , , L 1 , with center frequency f c ( k ) , where the frequencies f c ( 1 ) , …, f c ( k ) , …, f c ( K ) are equally distributed on the ERB-rate scale to cover the useful speech spectral bands. Figure 6 shows the plots of the gammatone impulse response at three different center frequencies. The pre-emphasized signal x m ( n ) is then passed through each gammatone filter, and the output is denoted as:
y k , m ( n ) = l = 0 L 1 G k ( l ) x m ( n l )
and illustrated in Figure 7.
Step 3
Signal envelope: The envelope of signal y k , m ( n ) is obtained by taking the magnitude of the gammatone filtered signal.
e k , m ( n ) = | y k , m ( n ) |
Step 4
Weight function: The average value of e k , m ( n ) in a frame is calculated according to Equation (8).
e ¯ k , m = n = 0 N 1 e k , m ( n ) N
Then, the weight factor w k , m is computed using the asymmetric nonlinear filter to track the upper envelope of e ¯ k , m , i.e.,
w k , m = λ i w k , m 1 + ( 1 λ i ) e ¯ k , m , if e ¯ k , m w k , m 1 λ j w k , m 1 + ( 1 λ j ) e ¯ k , m , if e ¯ k , m < w k , m 1
where 1 > λ j > λ i > 0 .
Step 5
Signal normalization and noise effect compensation: The envelope e k , m ( n ) is normalized across the K frequency bands to obtain:
e k , m ( n ) ¯ = e k , m ( n ) k = 1 K e k , m ( n )
This is then multiplied with the weight factor w k , m to compensate noise effect at each frequency band, i.e.,
p k , m ( n ) = e k , m ( n ) ¯ × w k , m
We observe from Figure 8 that the speech signal has better representation in the weighted envelopes as compared to the gammatone filter output envelope. The speech region has a relatively higher magnitude than the noise region in the weighted envelopes. They are represented with higher magnitude at certain frequencies, while the magnitude of the noise region is evenly spread across the frequency.
Step 6
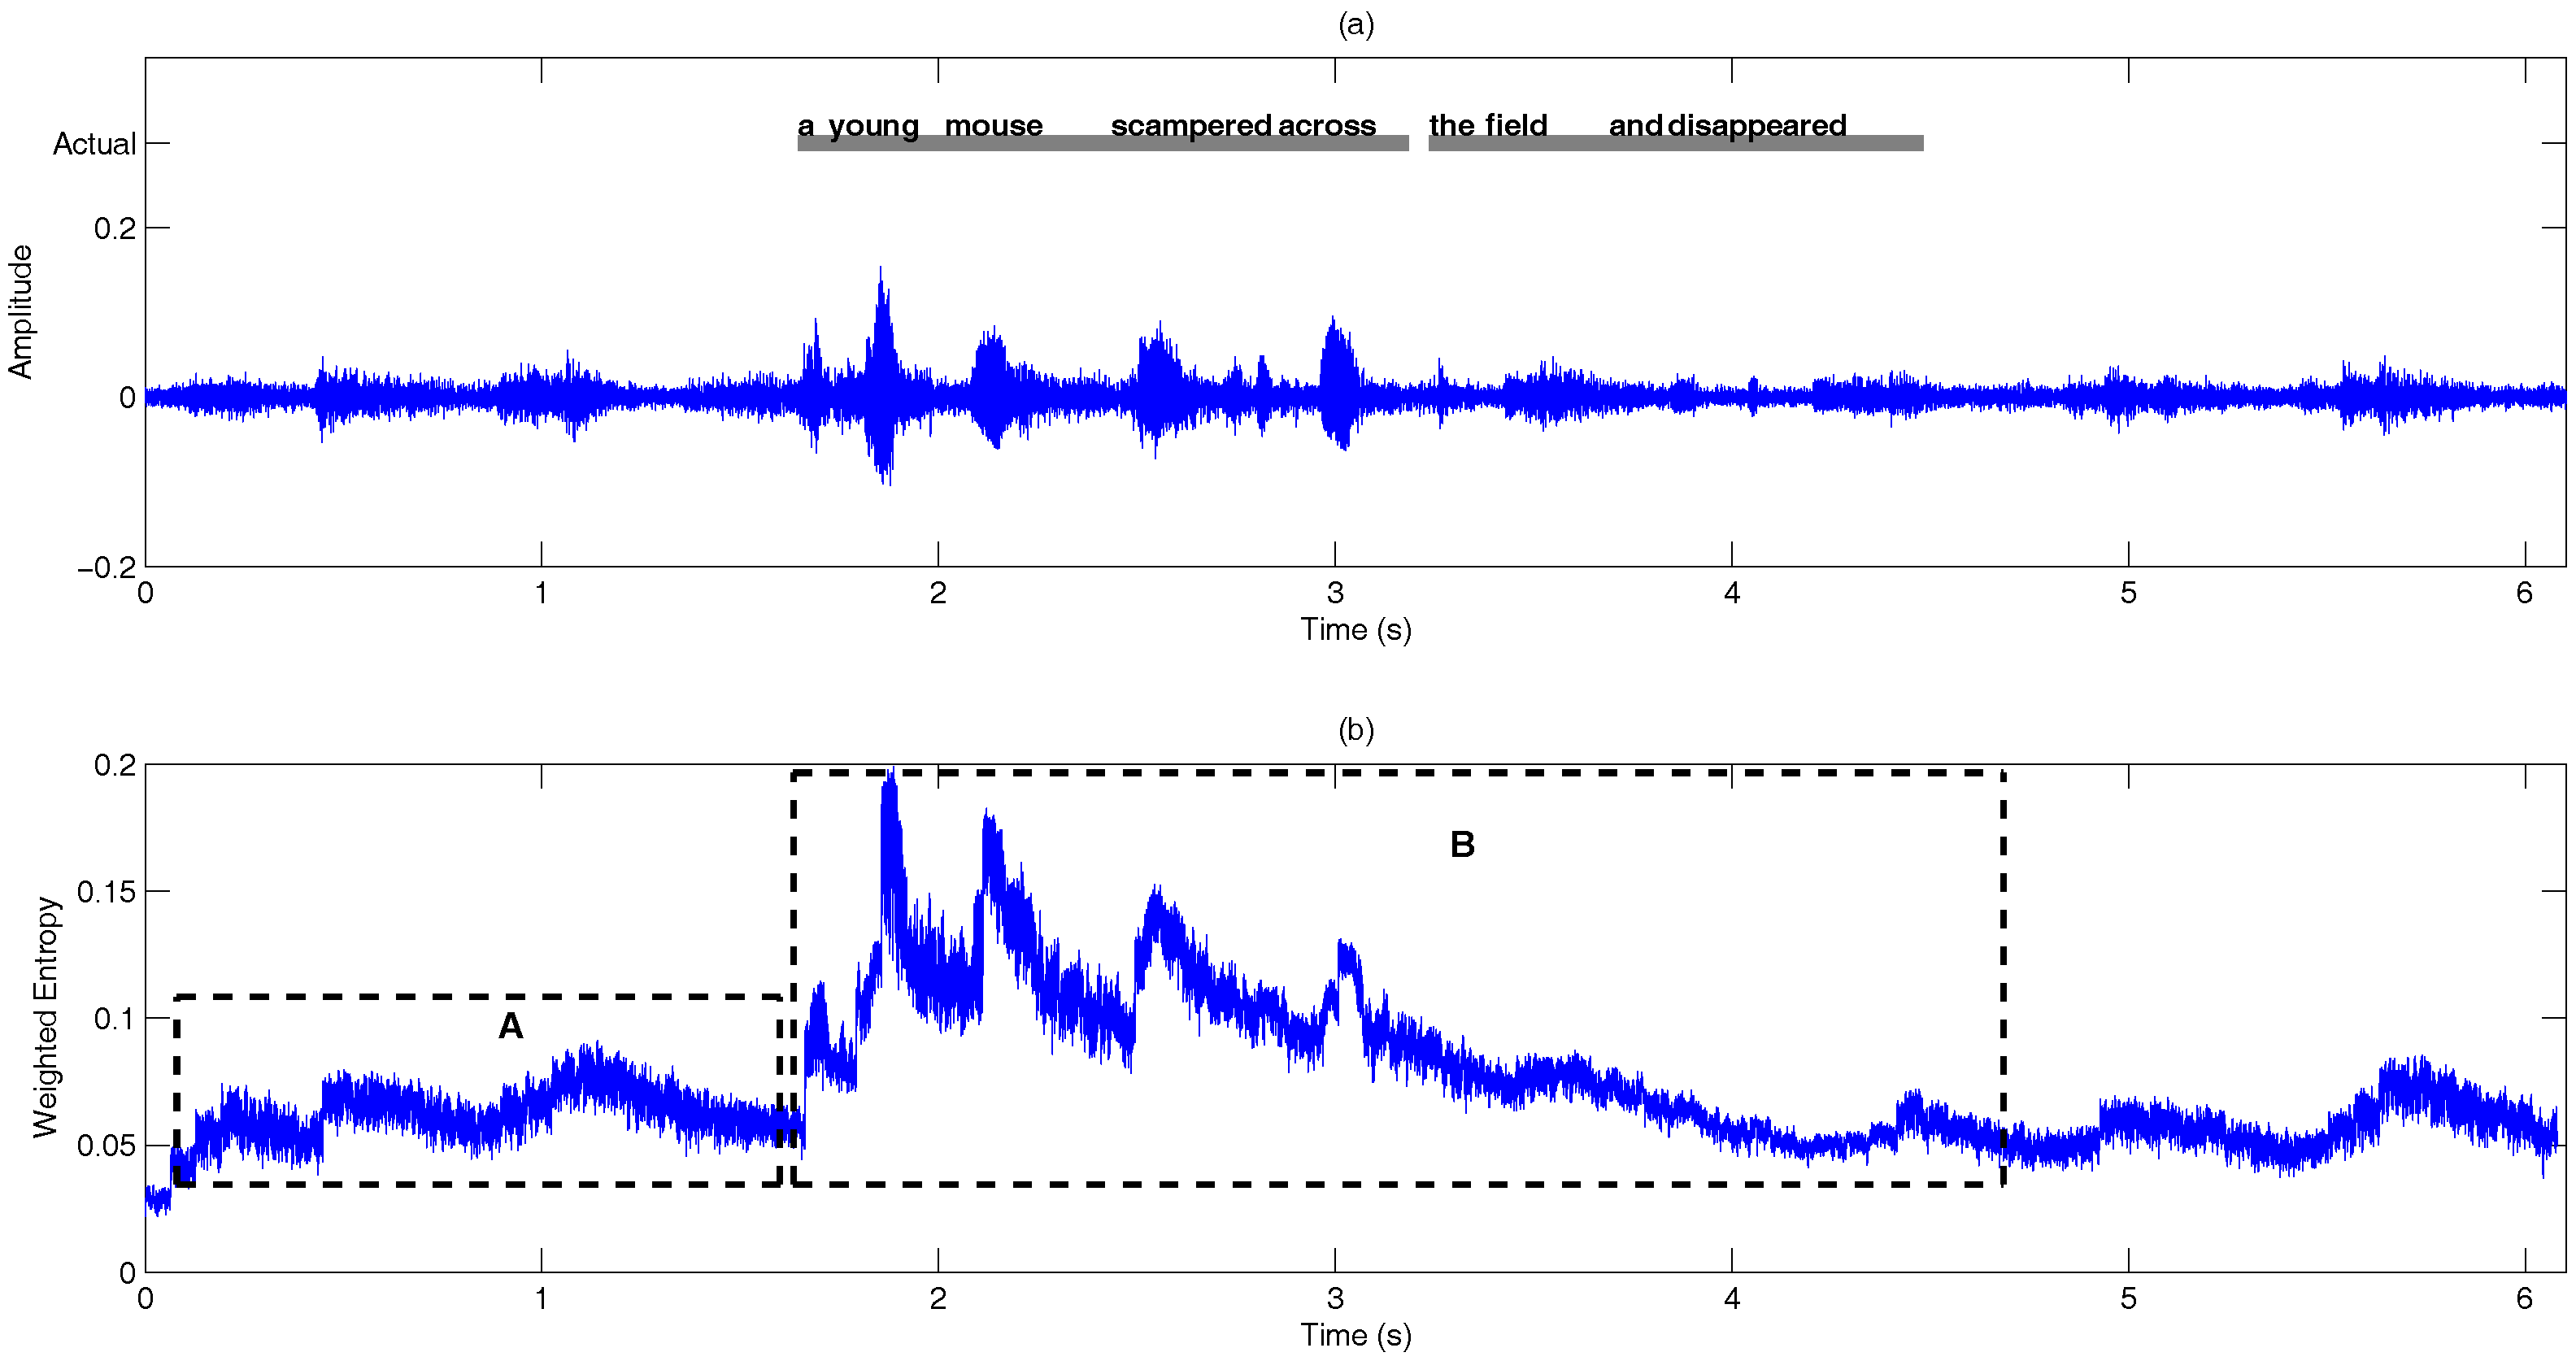
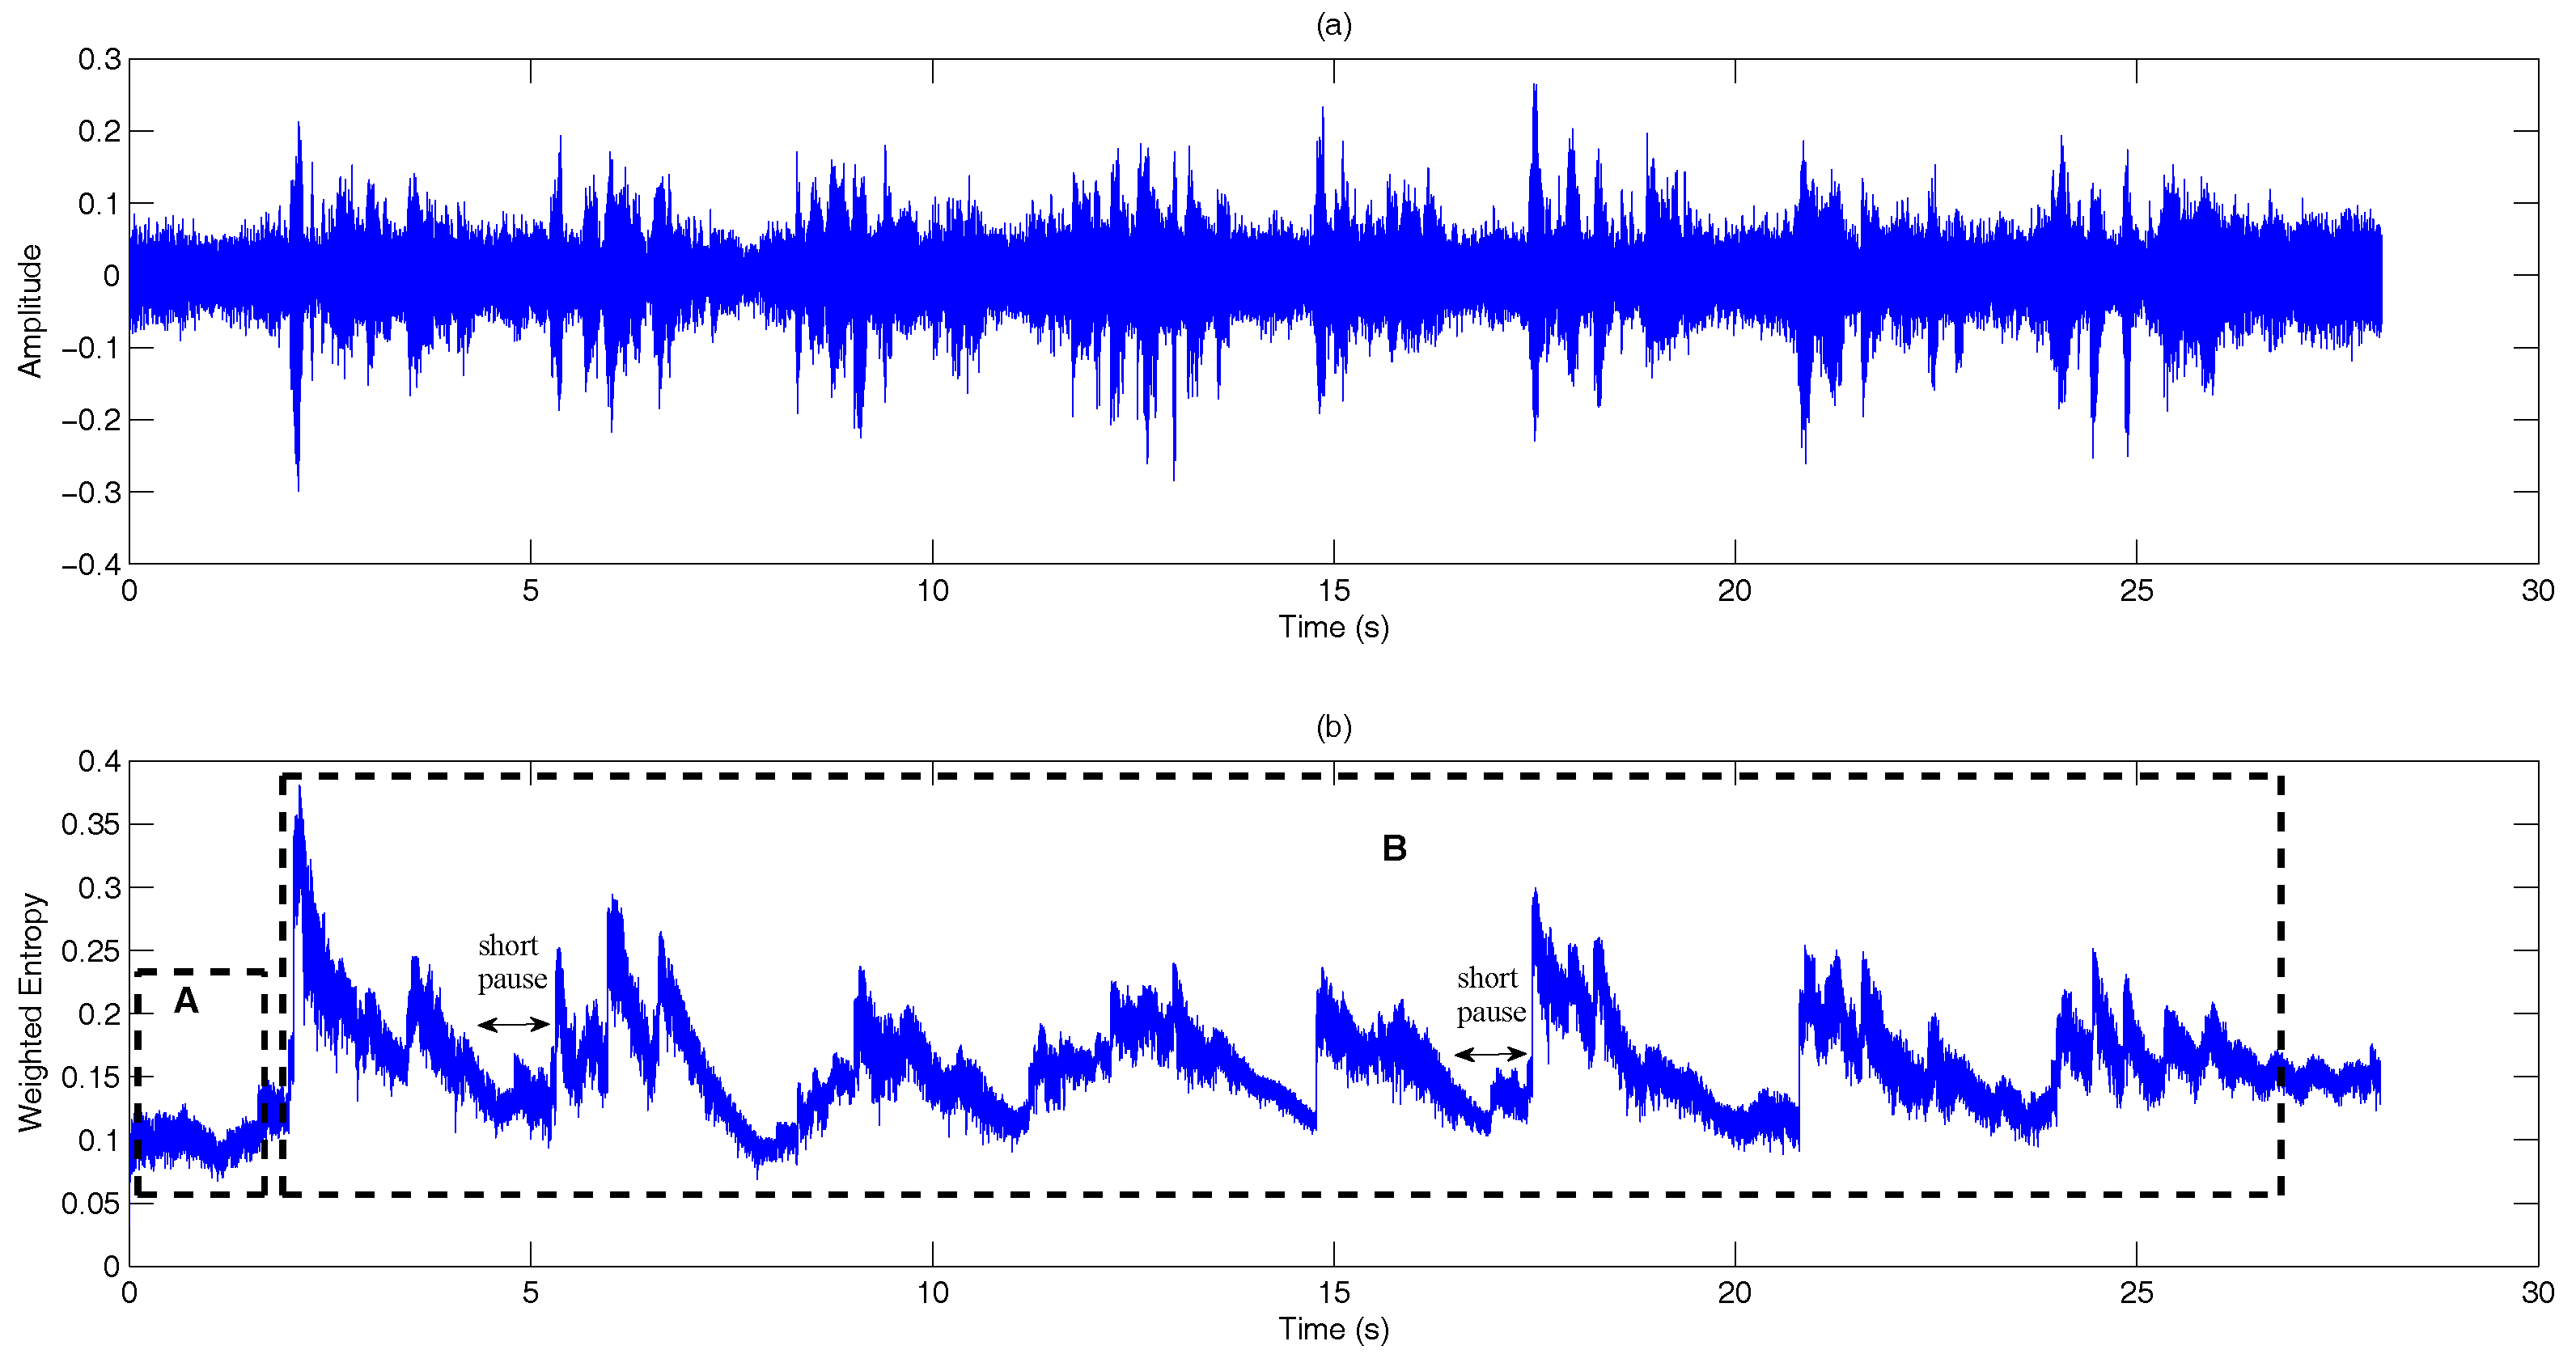
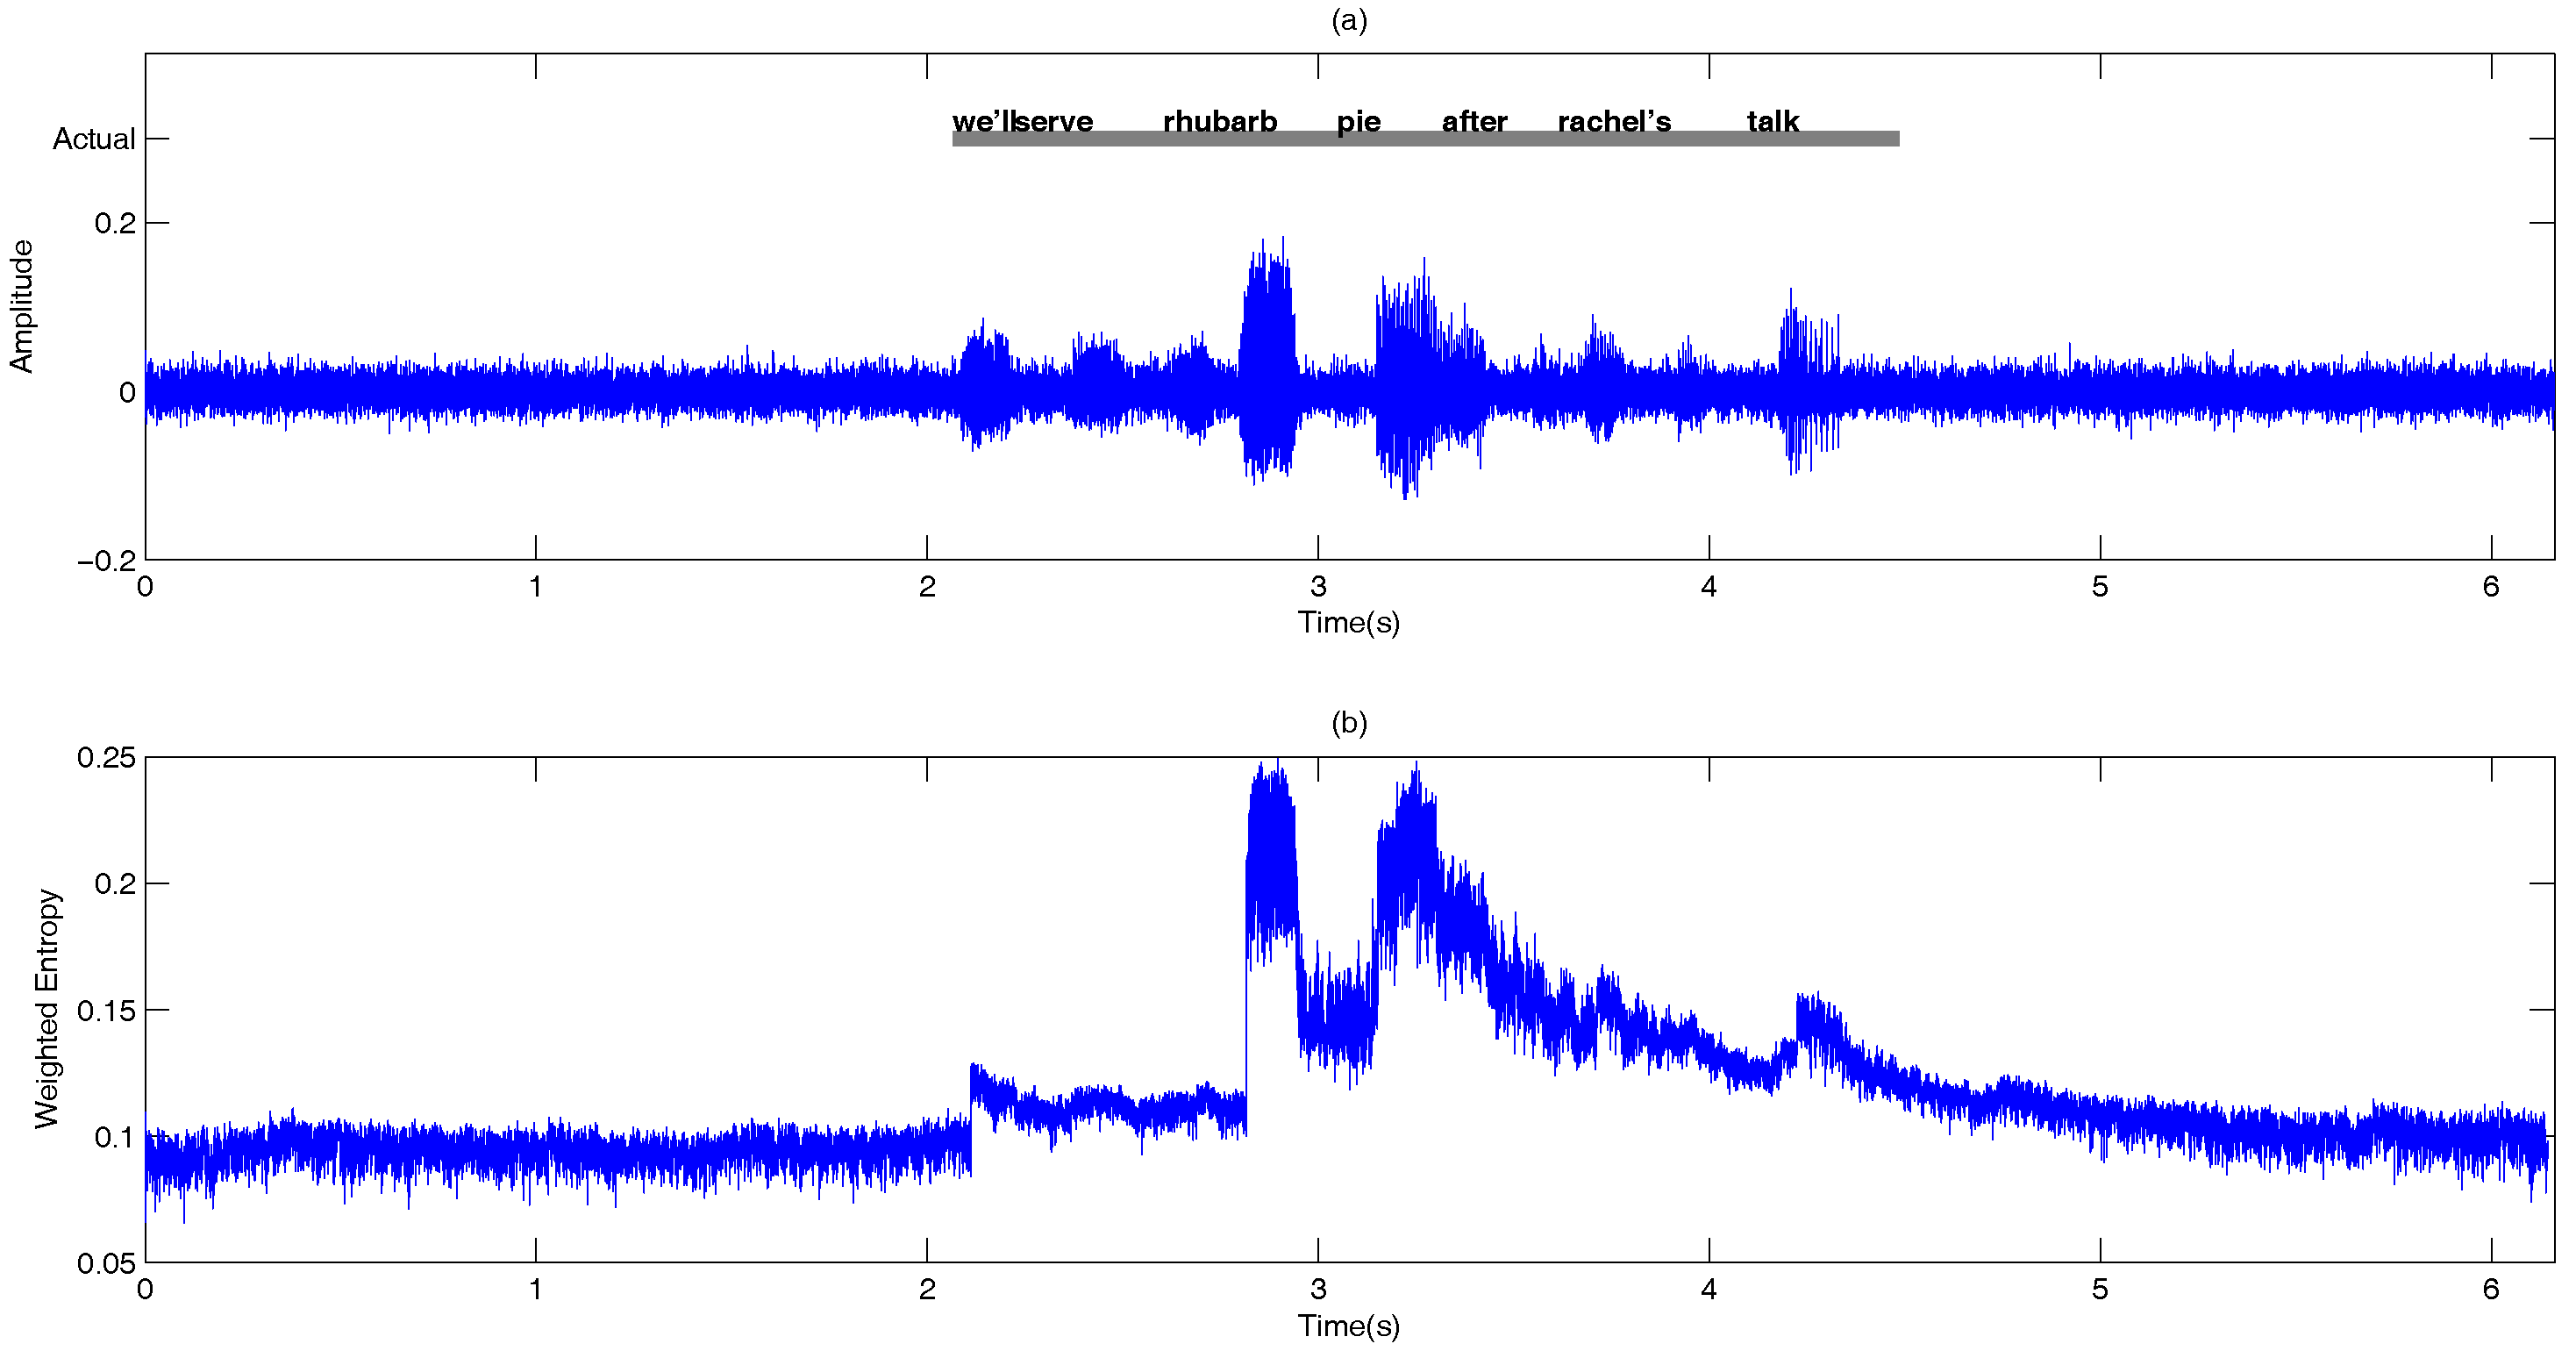
Information-theoretic measures: The entropy of p k , m ( n ) is measured across frequency according to:
H m ( n ) = k = 1 K p k , m ( n ) log 2 p k , m ( n )
Figure 9 shows the entropy of the noise-compensated signal envelope for speech signal degraded by crowd noise at 0 dB SNR. We can observe from the figure that speech and noise regions have significant differences in terms of their entropy values, and this can be exploited as an appropriate discriminative feature to decide the presence or absence of speech.
Step 7
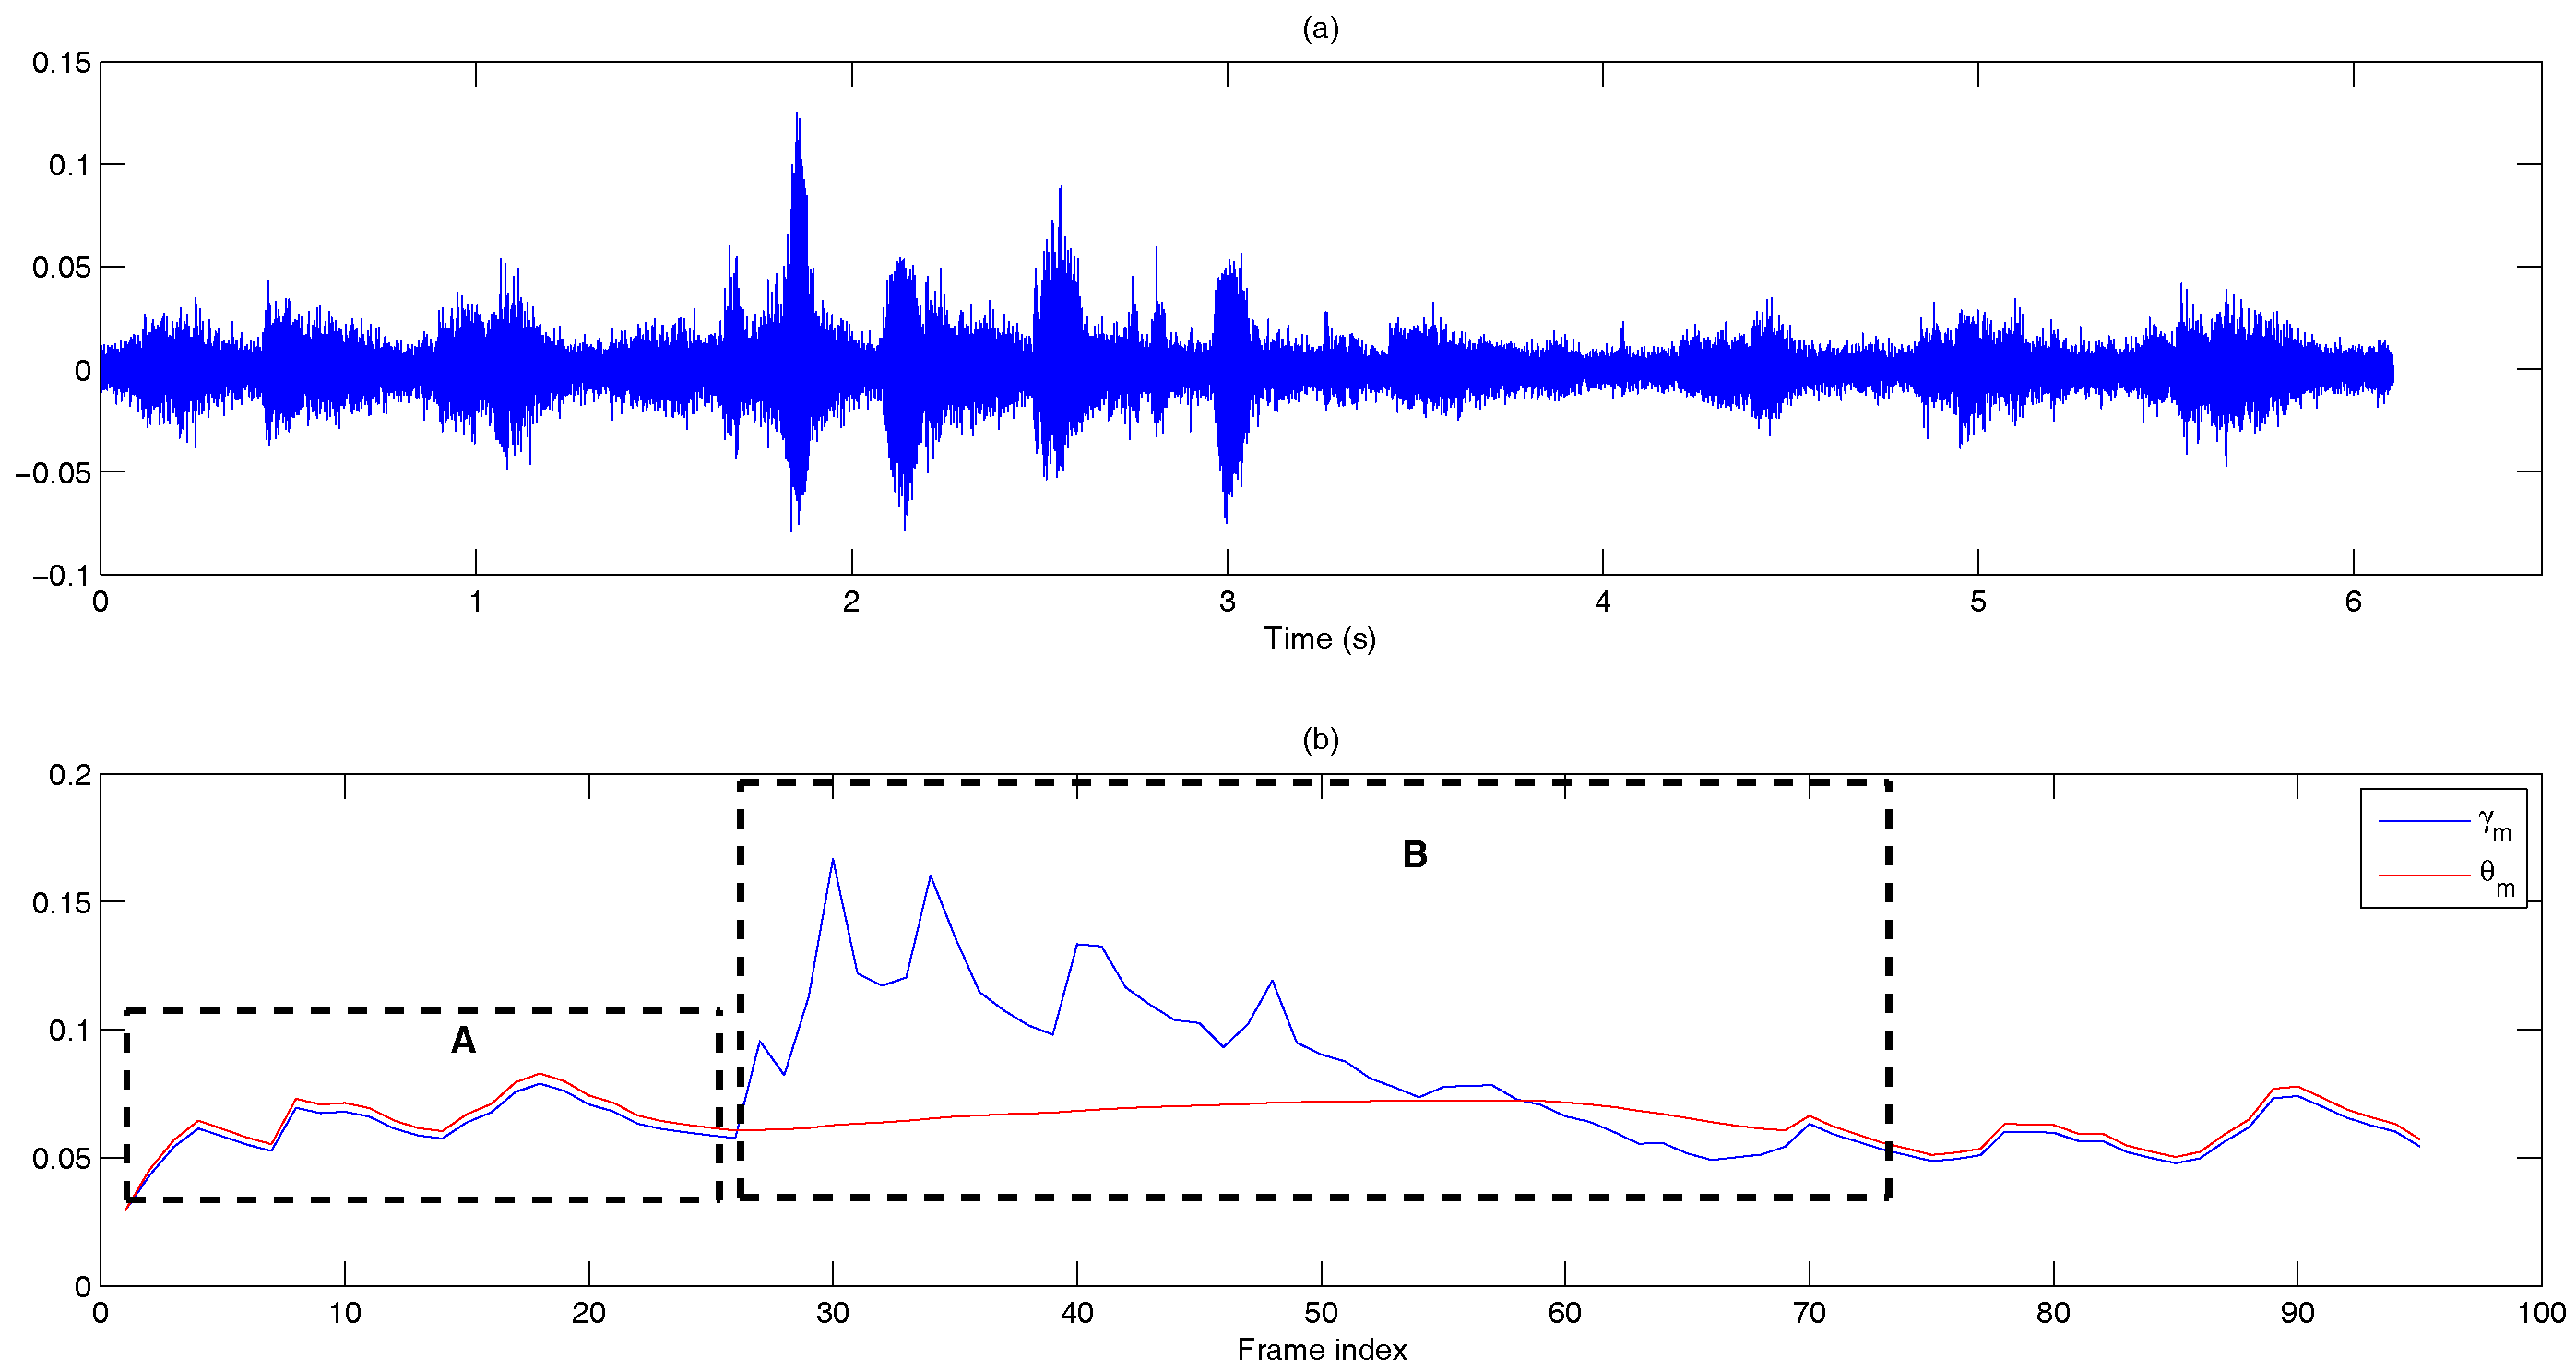
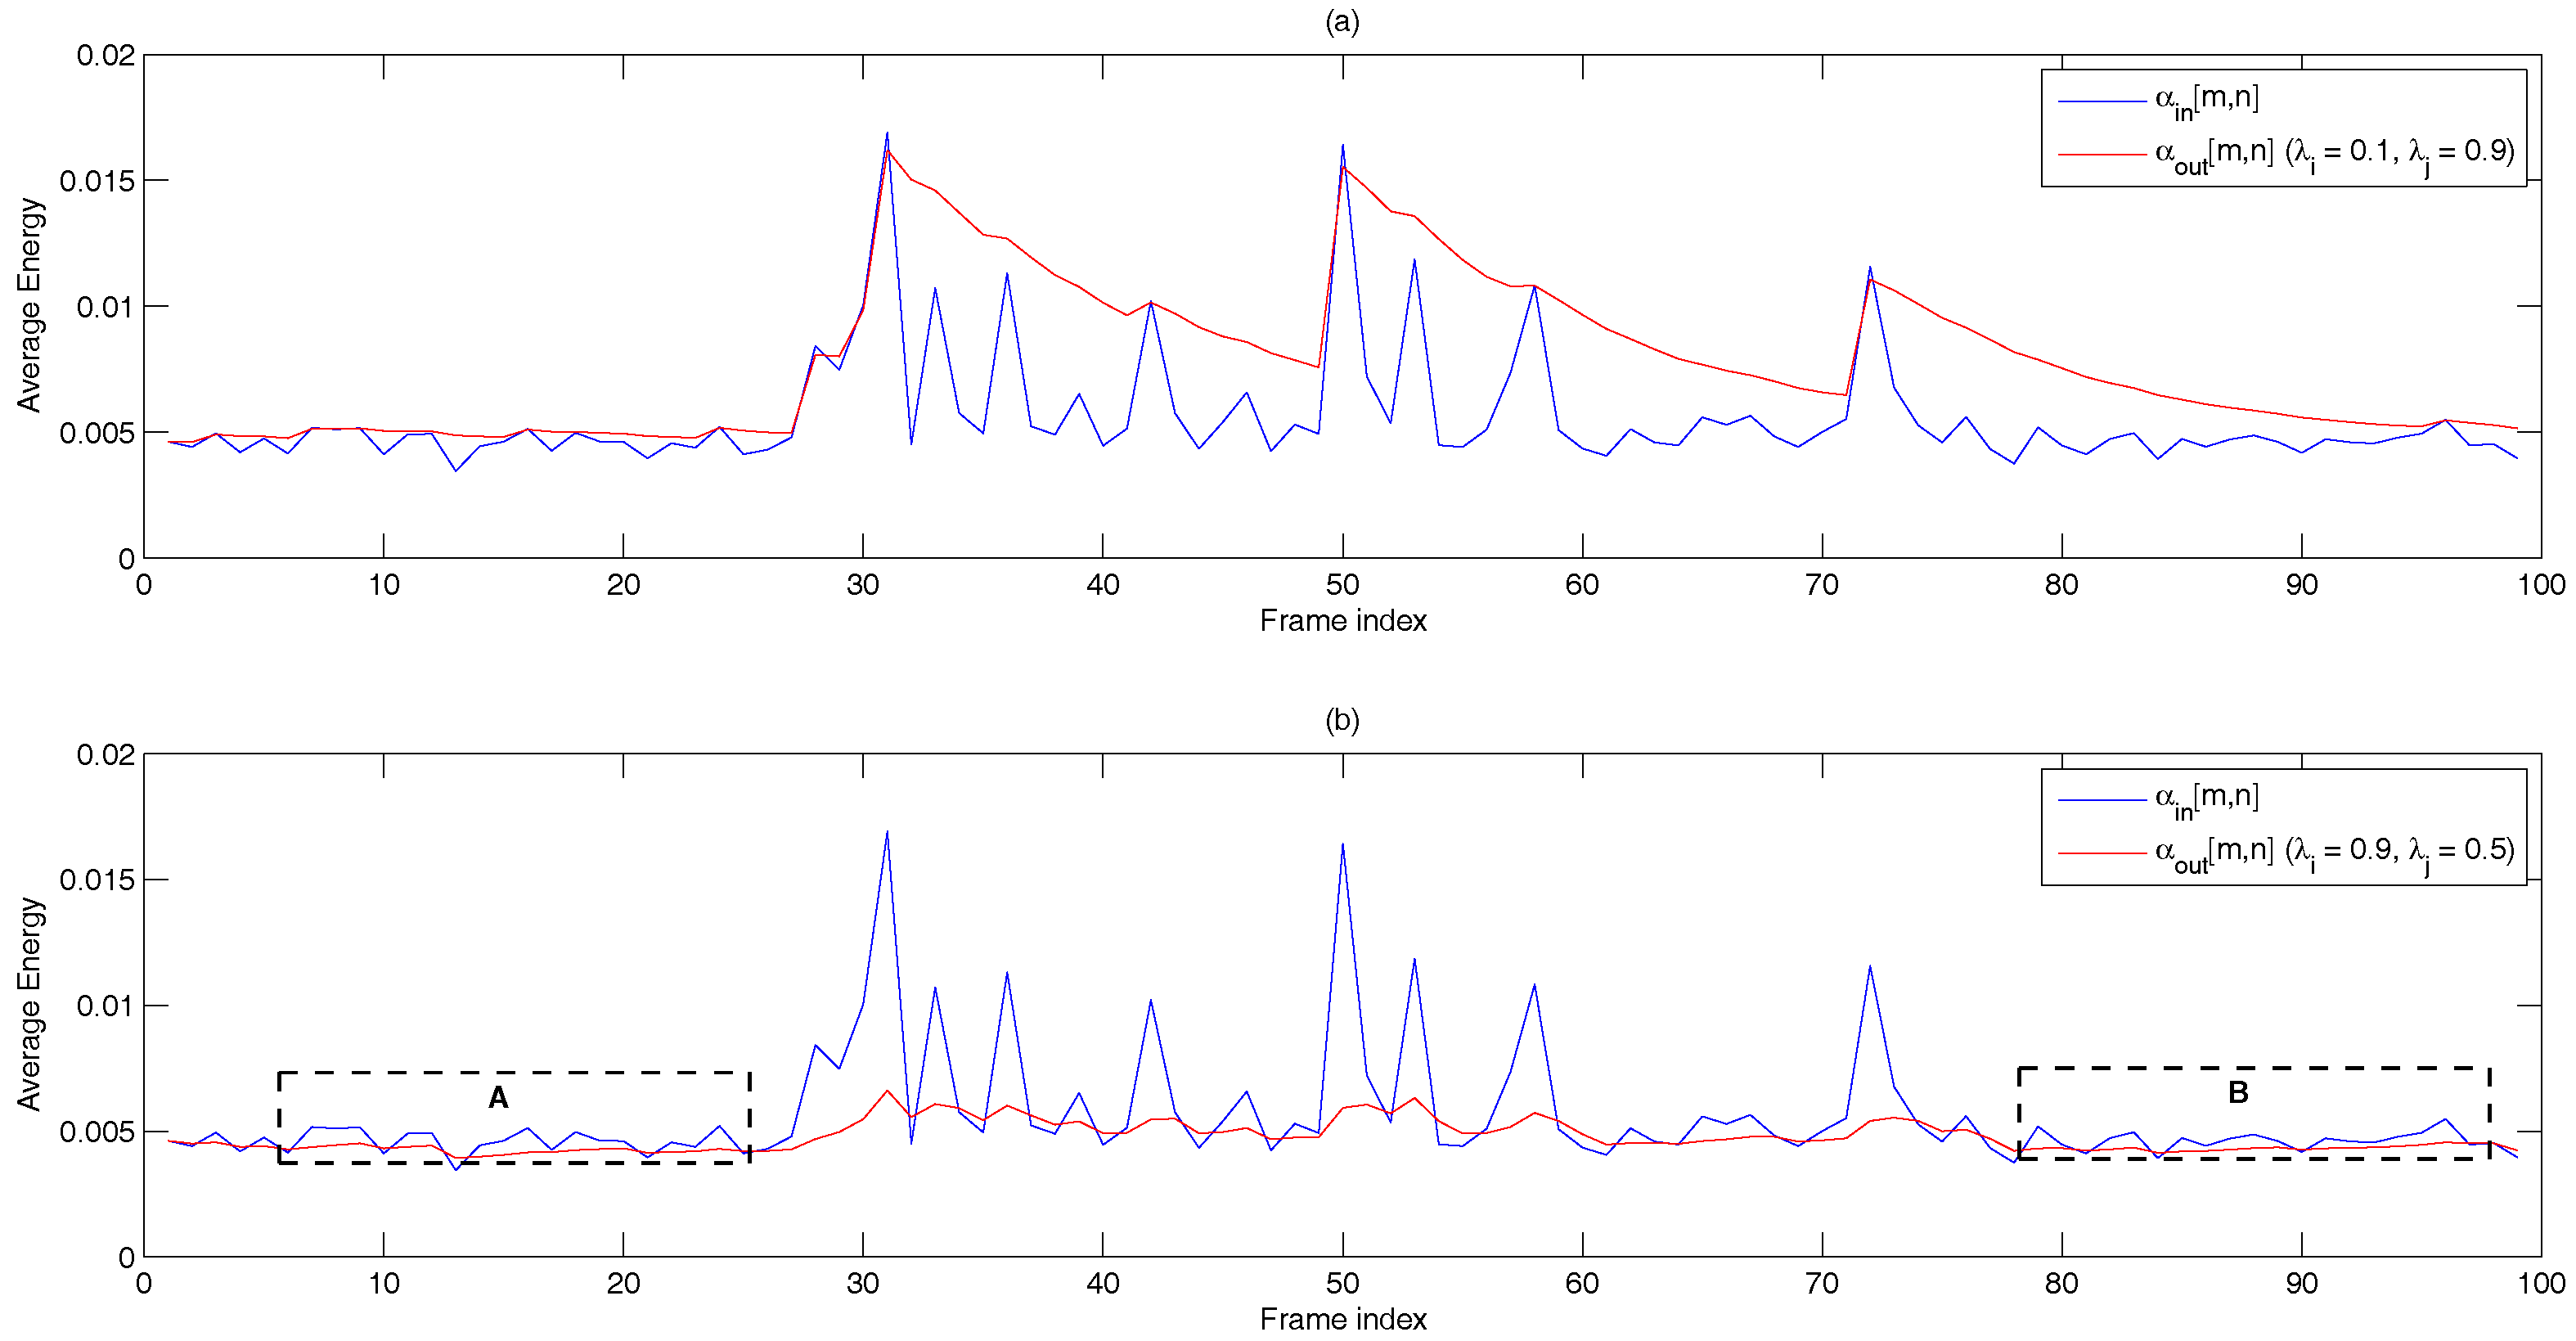
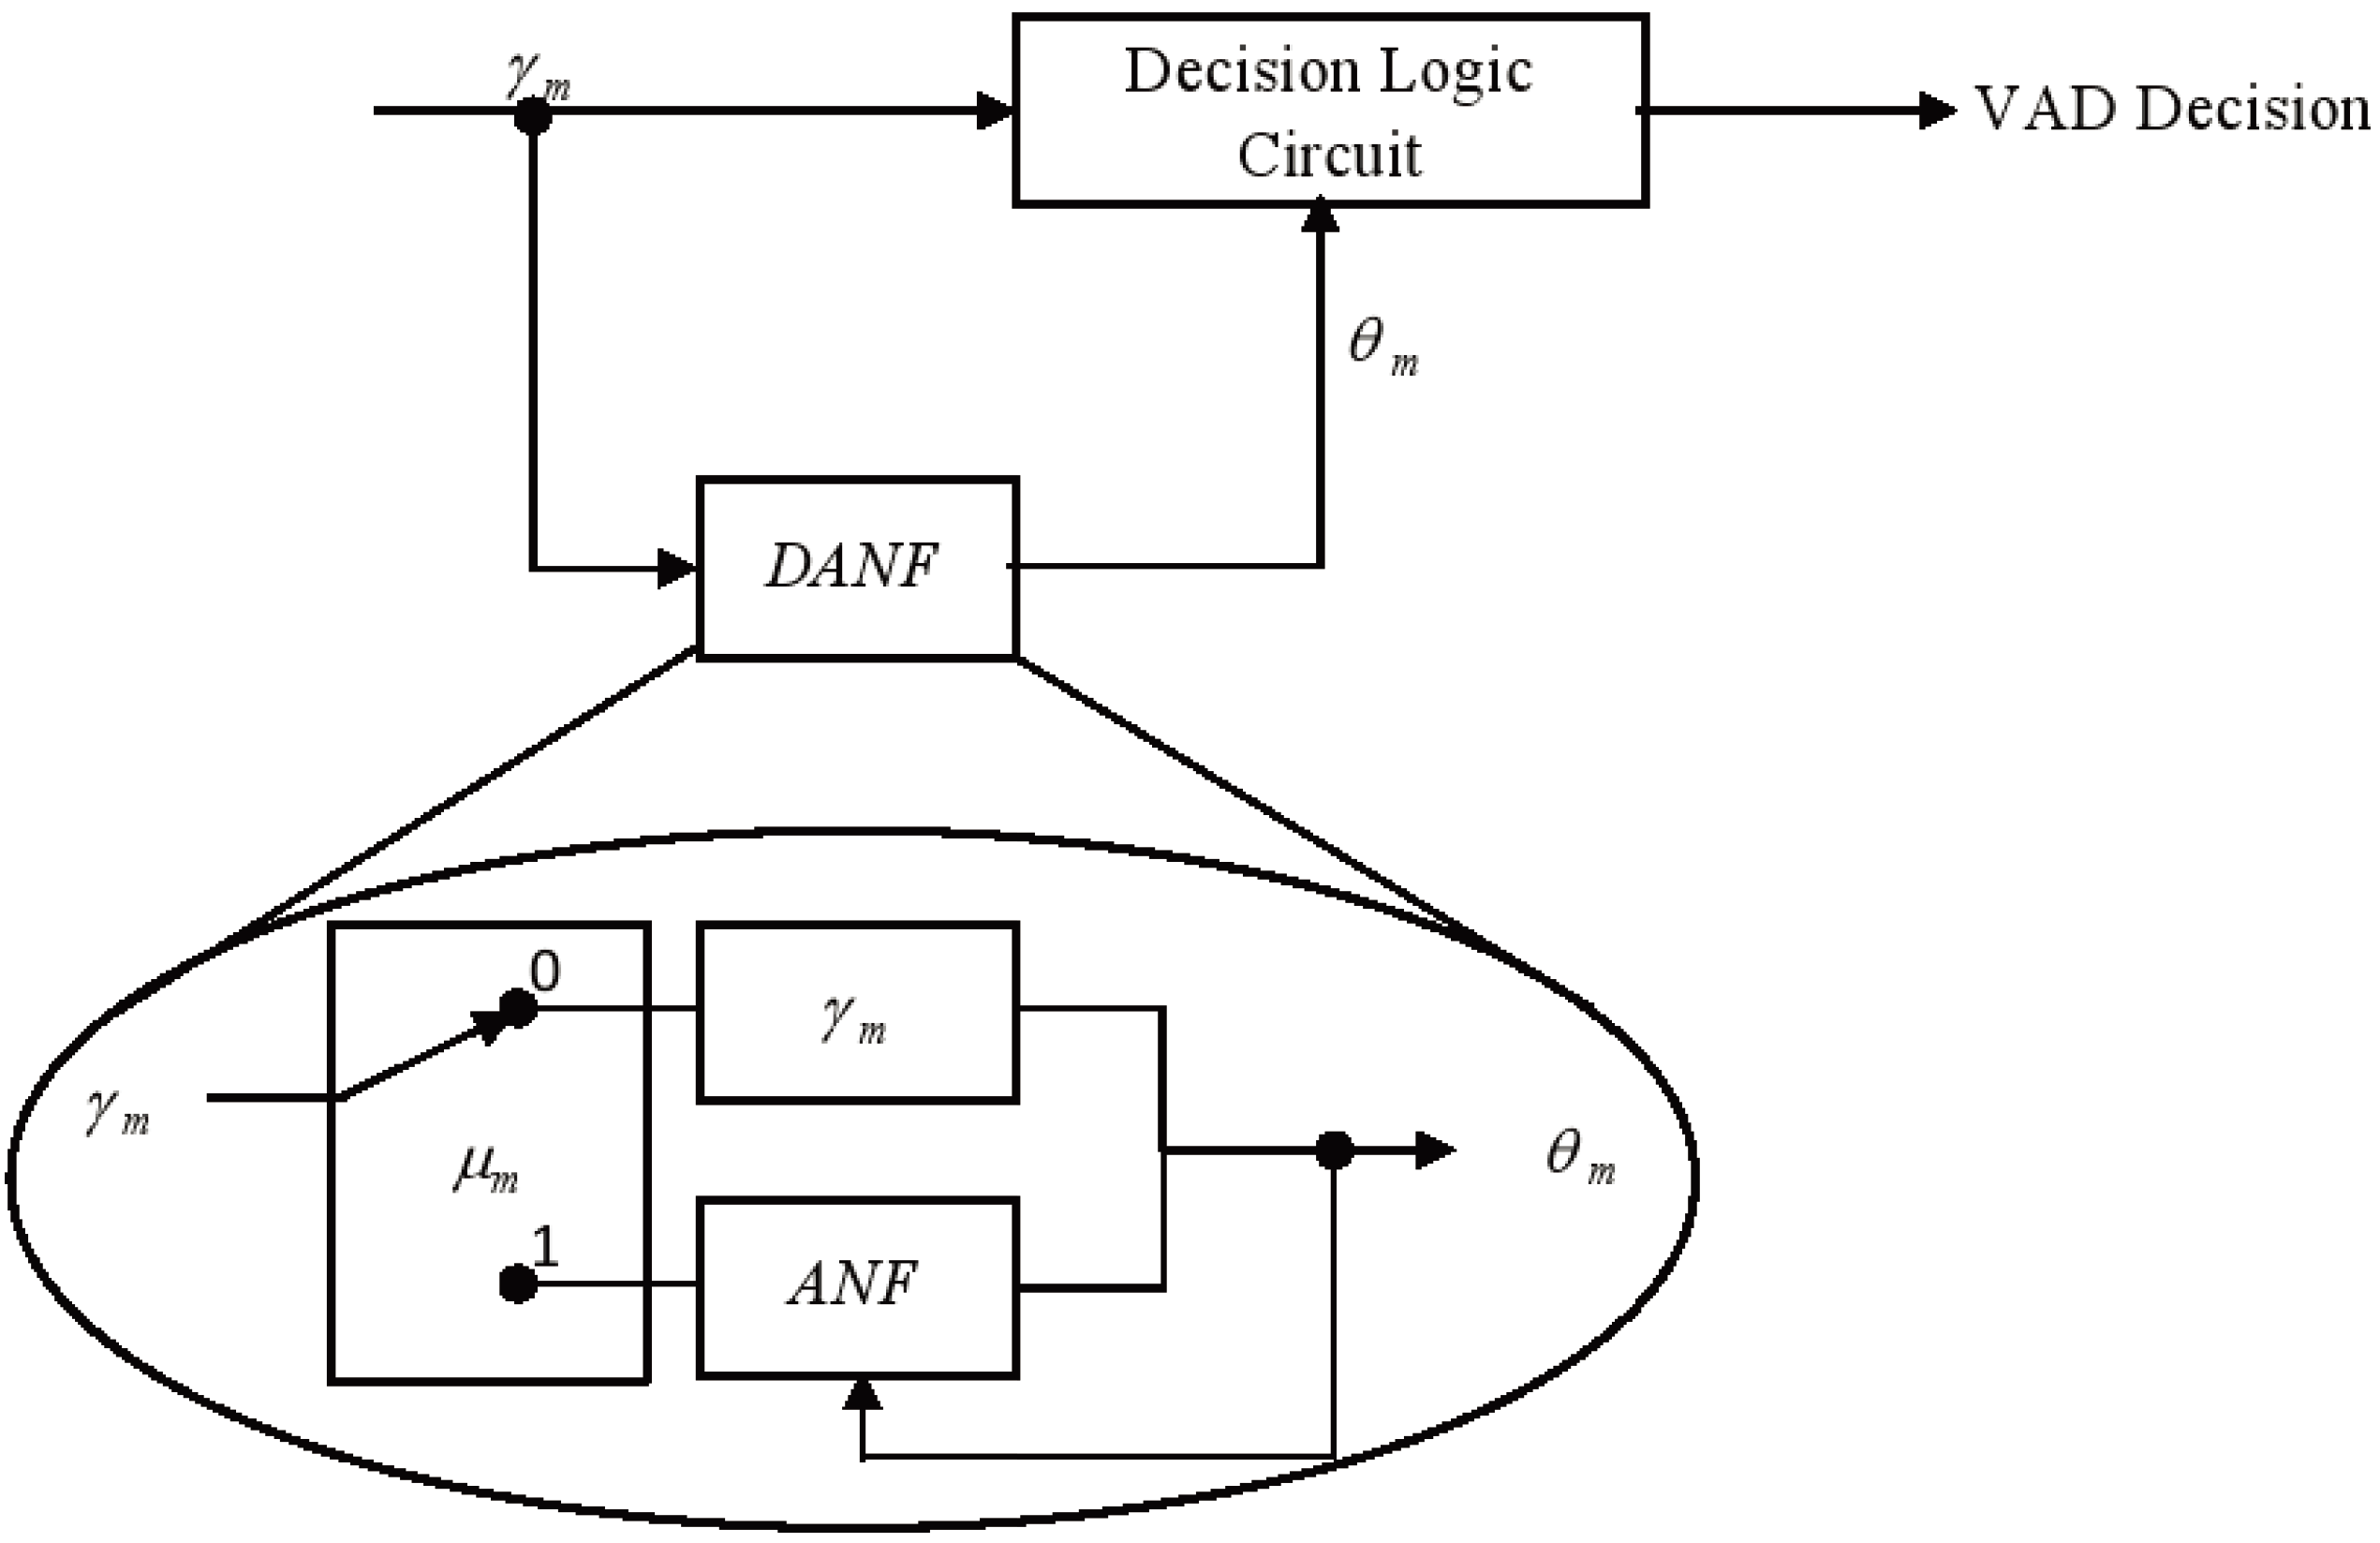
Dual-rate adaptive nonlinear filter: The input of the filter is the frame averaged entropy, i.e.,
γ m = n = 0 N 1 H m ( n ) N
A controller, u m , is used to differentiate the long noise interval (Region A) and potential speech segments (Region B). We set u 1 = 0 and θ 1 = γ 1 in the starting frame. In subsequent frames, u m and θ m are given by:
u m = 1 , if u m 1 = 1 0 , if γ m T m 1 , if γ m > T m , if u m 1 = 0
θ m = γ m , if u m = 0 α i θ m 1 + ( 1 α i ) γ m , if γ m > θ m 1 α j θ m 1 + ( 1 α j ) γ m , if γ m θ m 1 , if u m = 1
where T m = B N ¯ + ϵ σ B N is the transition threshold to set u m from zero (Region A) to one (Region B), where B N ¯ and σ B N are the mean and standard deviation of the eight most recent values of γ m of only the noise frame. Figure 10 demonstrates the adaptivity of the decision threshold of a noisy signal. In Region B, when u m = 1 , the decision threshold, computed using ANF, varies slowly with respect to the DANF input, whereas in Region A, the decision threshold adapts itself to the fluctuating noise floor.
Step 8
Decision logic: The VAD decision is made based on:
V A D m = 1 , if γ m > θ m 0 , if γ m θ m
where 1 represents speech, while 0 represents noise.
Step 9
Noise frame counter: The number of identified noise frames is counted, and this is used to reset u m accordingly, i.e.,
s t = s t + 1 , if V A D m = 0 and u m = 1 0 , if V A D m = 1
u m = 0 , if s t > β 1 , if s t β
where 0 represents a long interval of noise and 1 represents otherwise.

3. Results

This section presents the results of the proposed VAD and compares it with other well-known VAD algorithms. We also discuss the technical background information of the common performance metrics, and we have used these metrics to evaluate the results of our VAD algorithms.

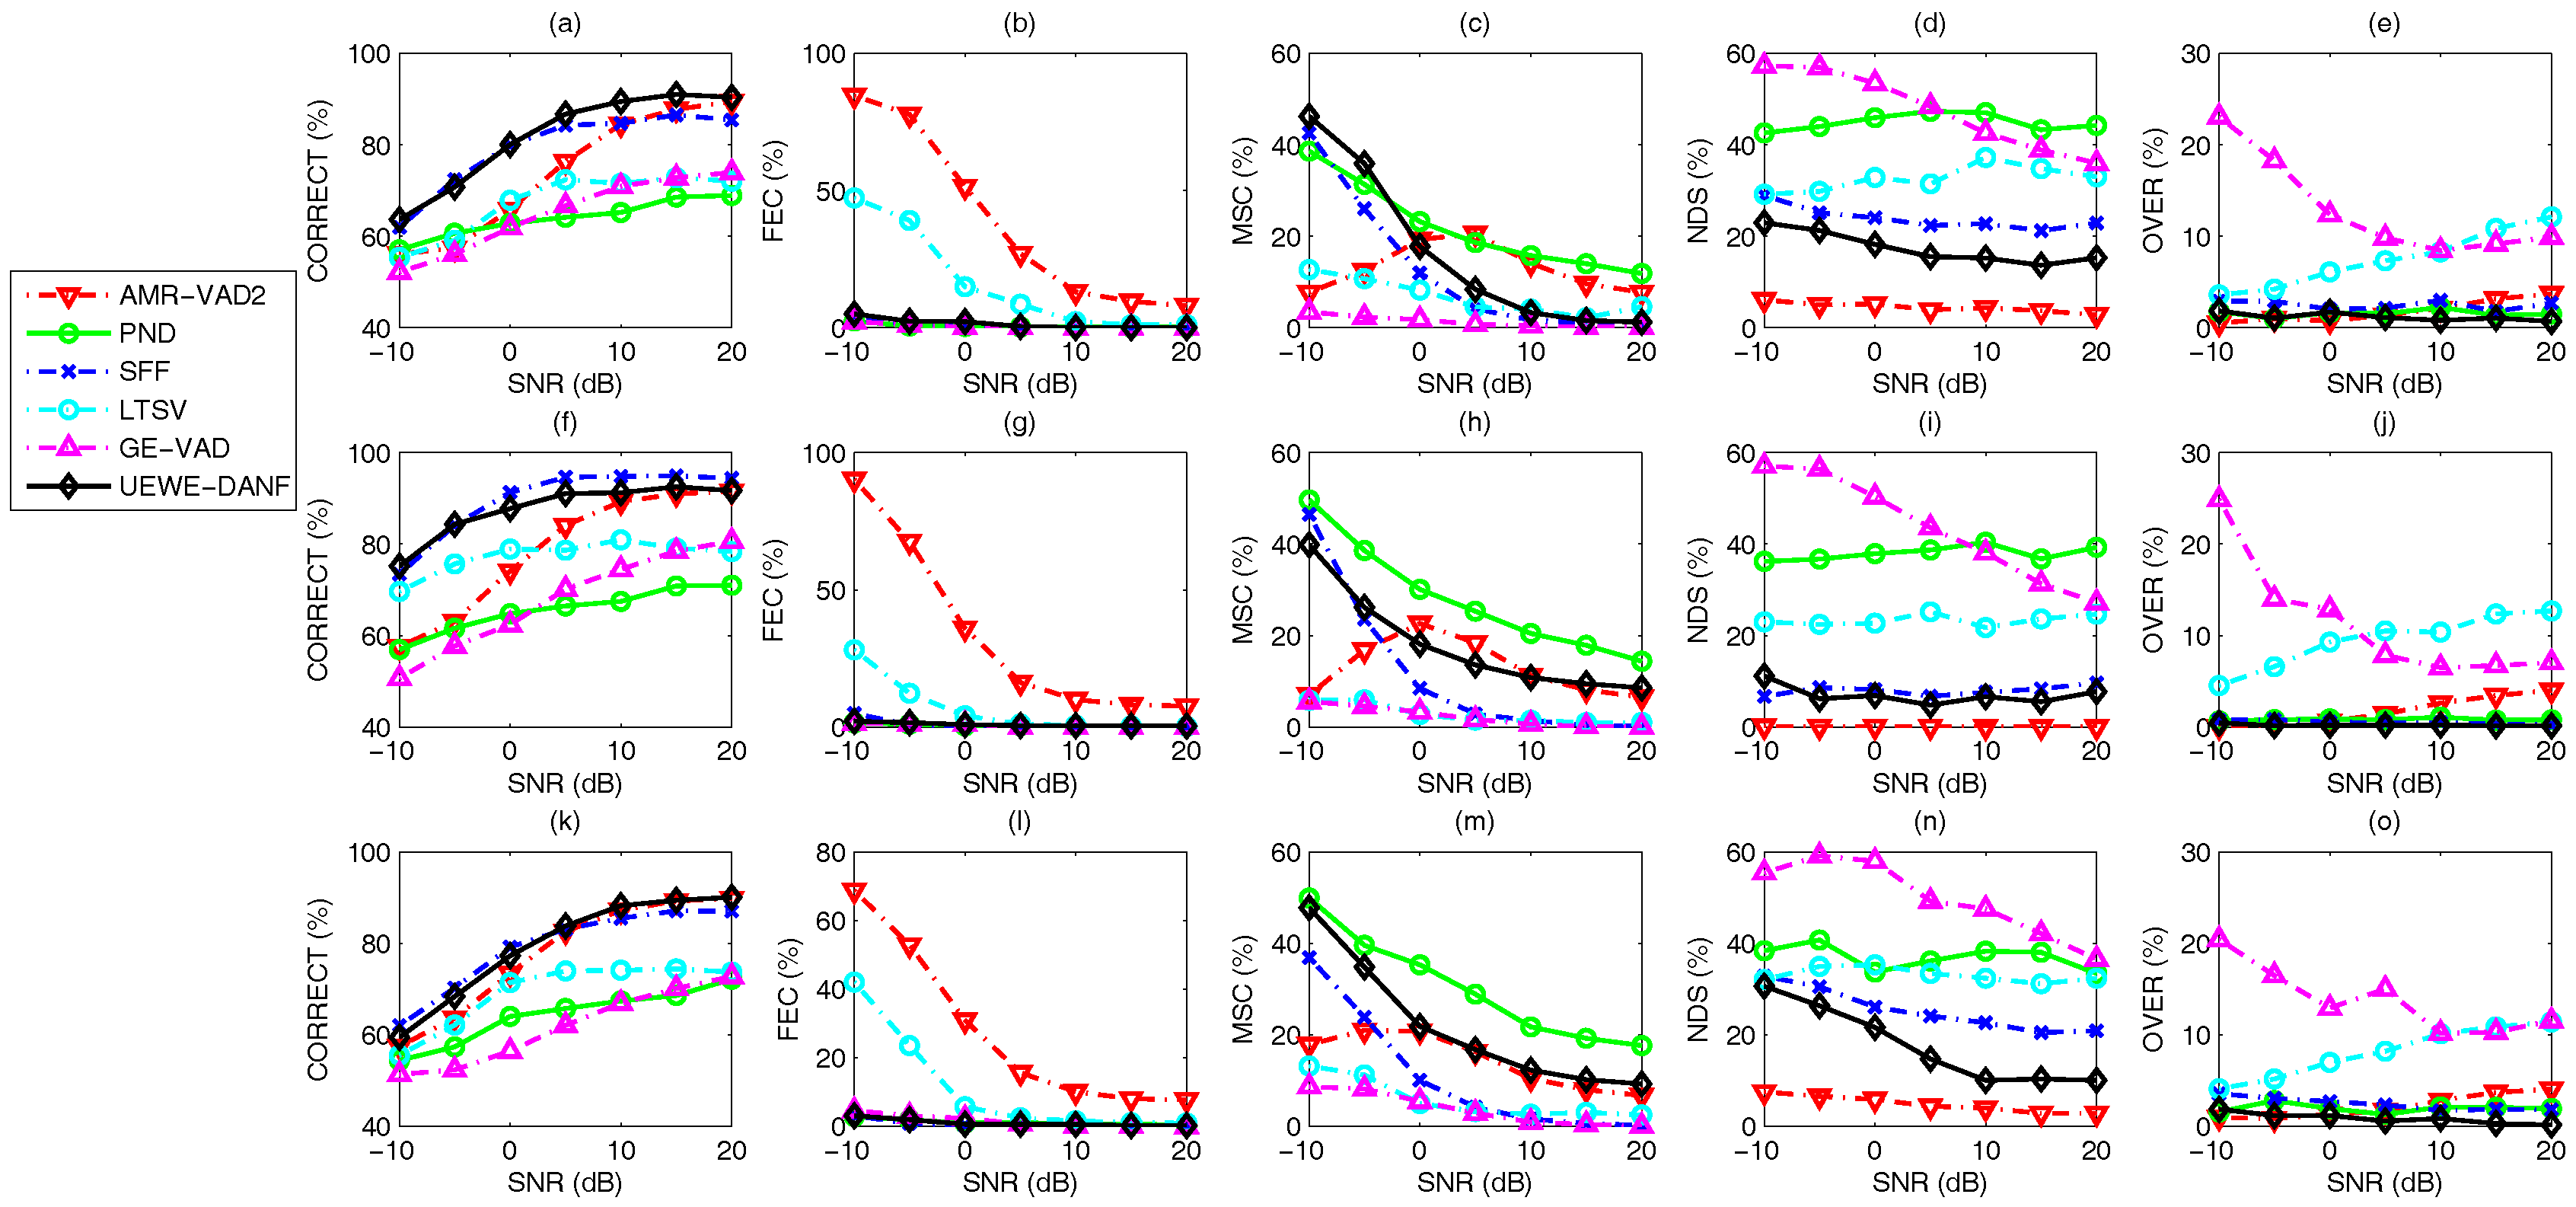
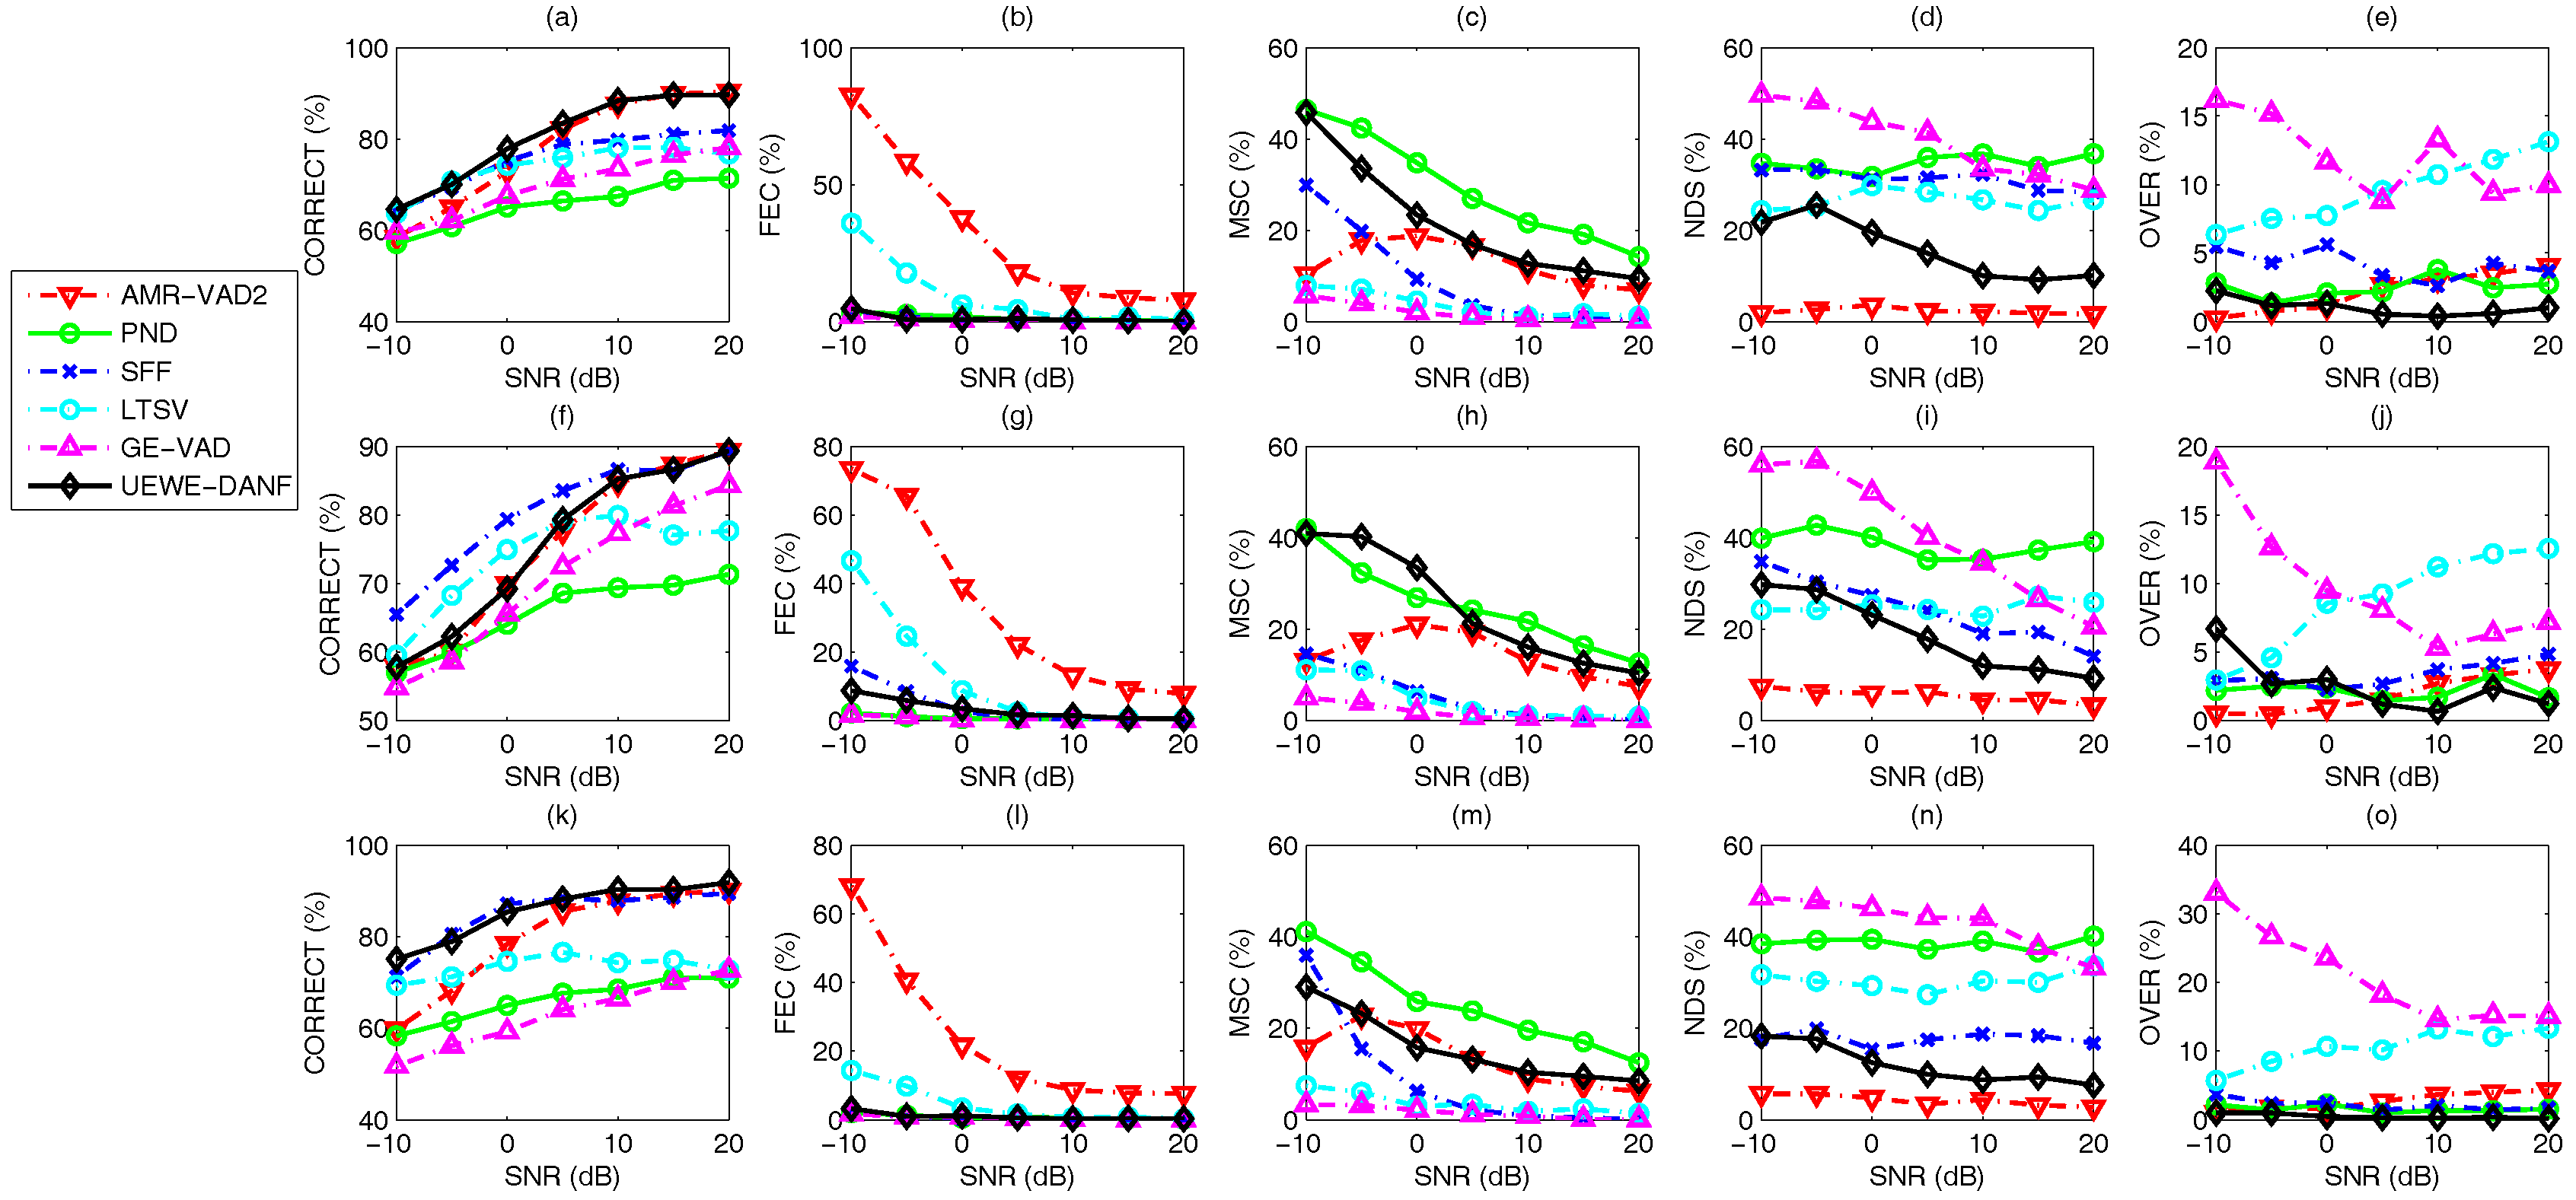
3.1. Performance Evaluation Metrics

Freeman et al. proposed a set of metrics in [36], which are widely used to evaluate the performance of the voice activity detector [1,25,37]. Specifically, the five metrics are illustrated in Figure 11 and defined thereafter.
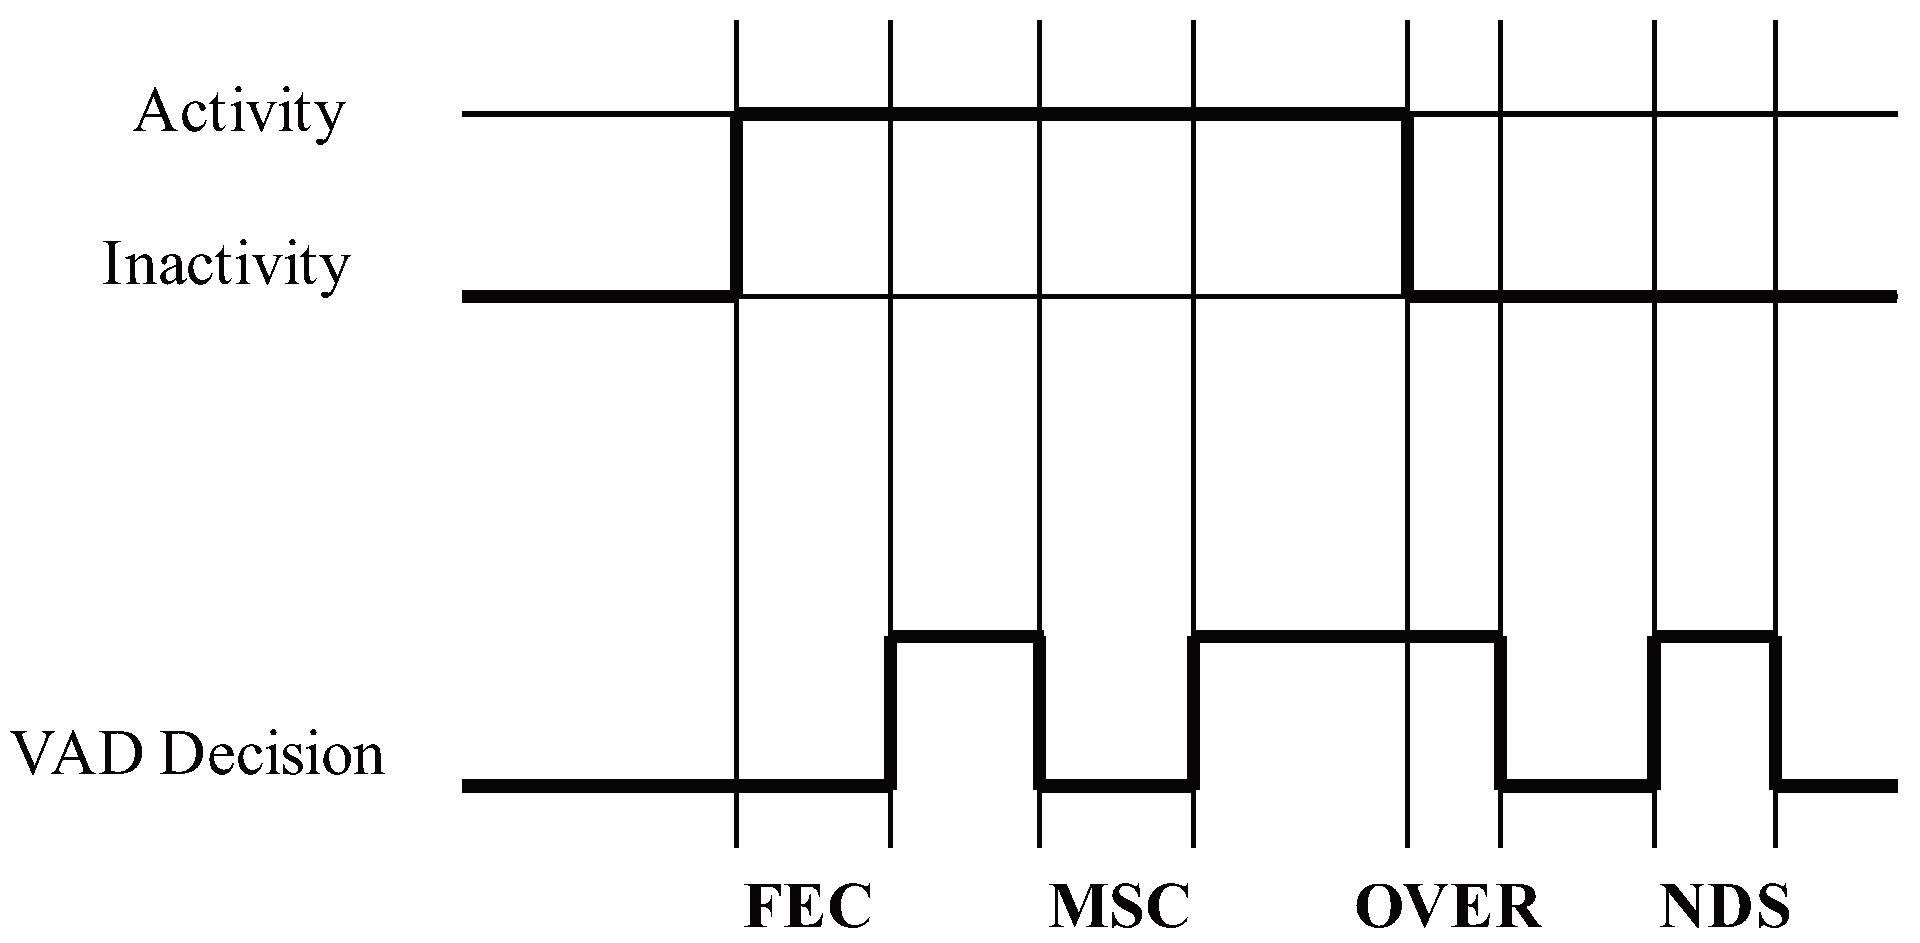
  • CORRECT: The correct speech or non-speech detection done by the VAD algorithm.
  • Front-end clipping (FEC): Clipping caused by misclassification of speech as noise at the shift of the noise segment to the speech segment.
  • Mid-speech clipping (MSC): Clipping caused by misclassification of speech as noise within a speech segment.
  • Carry over (OVER): Noise misclassified as speech at the shift of the speech segment to the noise segment.
  • Noise detected as speech (NDS): Noise misclassified as speech within the noise segment.
    D e t e c t i o n A c c u r a c y / C o r r e c t ( % ) = C O R R E C T Length of signal × 100
    F E C ( % ) = F E C Length of speech × 100
    M S C ( % ) = M S C Length of speech × 100
    N D S ( % ) = N D S Length of non speech × 100
    O V E R ( % ) = O V E R Length of non speech × 100

3.2. Experimental Setup

The performance of existing voice activity detection algorithms and the proposed VAD are evaluated using the above performance metrics. Three existing VAD algorithms are chosen for the evaluation purposes. The first is the voice activity detection for adaptive multi-rate Option 2 (denoted as AMR-VAD2) that was standardized for the European Telecommunications Standards Institute (ETSI) [12]. The other three are the single-frequency filtering approach for discriminating speech and non-speech (SFF) [25], the formant-based robust voice activity detection (PND) [9] and the robust voice activity detection using long-term signal variability (LTSV) [1]. In addition, the gammatone filtering and entropy-based VAD (GE-VAD) proposed in [24] is also compared. The performance evaluation is carried out on noise-added speech signals under different signal-to-noise ratios (SNR). In particular, clean speech signals from the TIMIT acoustic-phonetic continuous speech corpus [38] are degraded by noise signals from the AURORA project database 2.0 (AURORA-2) [39] at SNRs ranging from 10 dB–20 dB with increments of 5 dB. In this experiment, the 16-kHz clean TIMIT speech signals are downsampled to 8 kHz to accommodate AMR-VAD2 [12] and other existing VADs, such as the formant-based VAD [9], which were designed and had been experimented on at this frequency. In addition, the 8-kHz sampling rate is also applied to the proposed VAD, which is designed to work optimally at this frequency. The clean speech signals from the TIMIT corpus consist of a relatively higher concentration of speech segments than silences [25]. Thus, the signals may be suitable for the measurement of the sensitivity of the VAD, but not the specificity. However, the evaluation results are only reliable when both the sensitivity and specificity of a VAD are measured, because an ideal VAD should have high sensitivity and high specificity. Thus, each TIMIT clean speech signal is appended fore and aft with 1.5 s of silence prior to the addition of noise to even out the proportion of speech and noise segments [1,9,25]. To evaluate the performance of the existing and proposed VAD in continuous speech detection, ten silence-padded TIMIT signals are concatenated. This time, the length of silence between each sentence is randomly generated from the range of 2–3 s. Table 1 below shows the parameters and the corresponding values considered in the experiments.

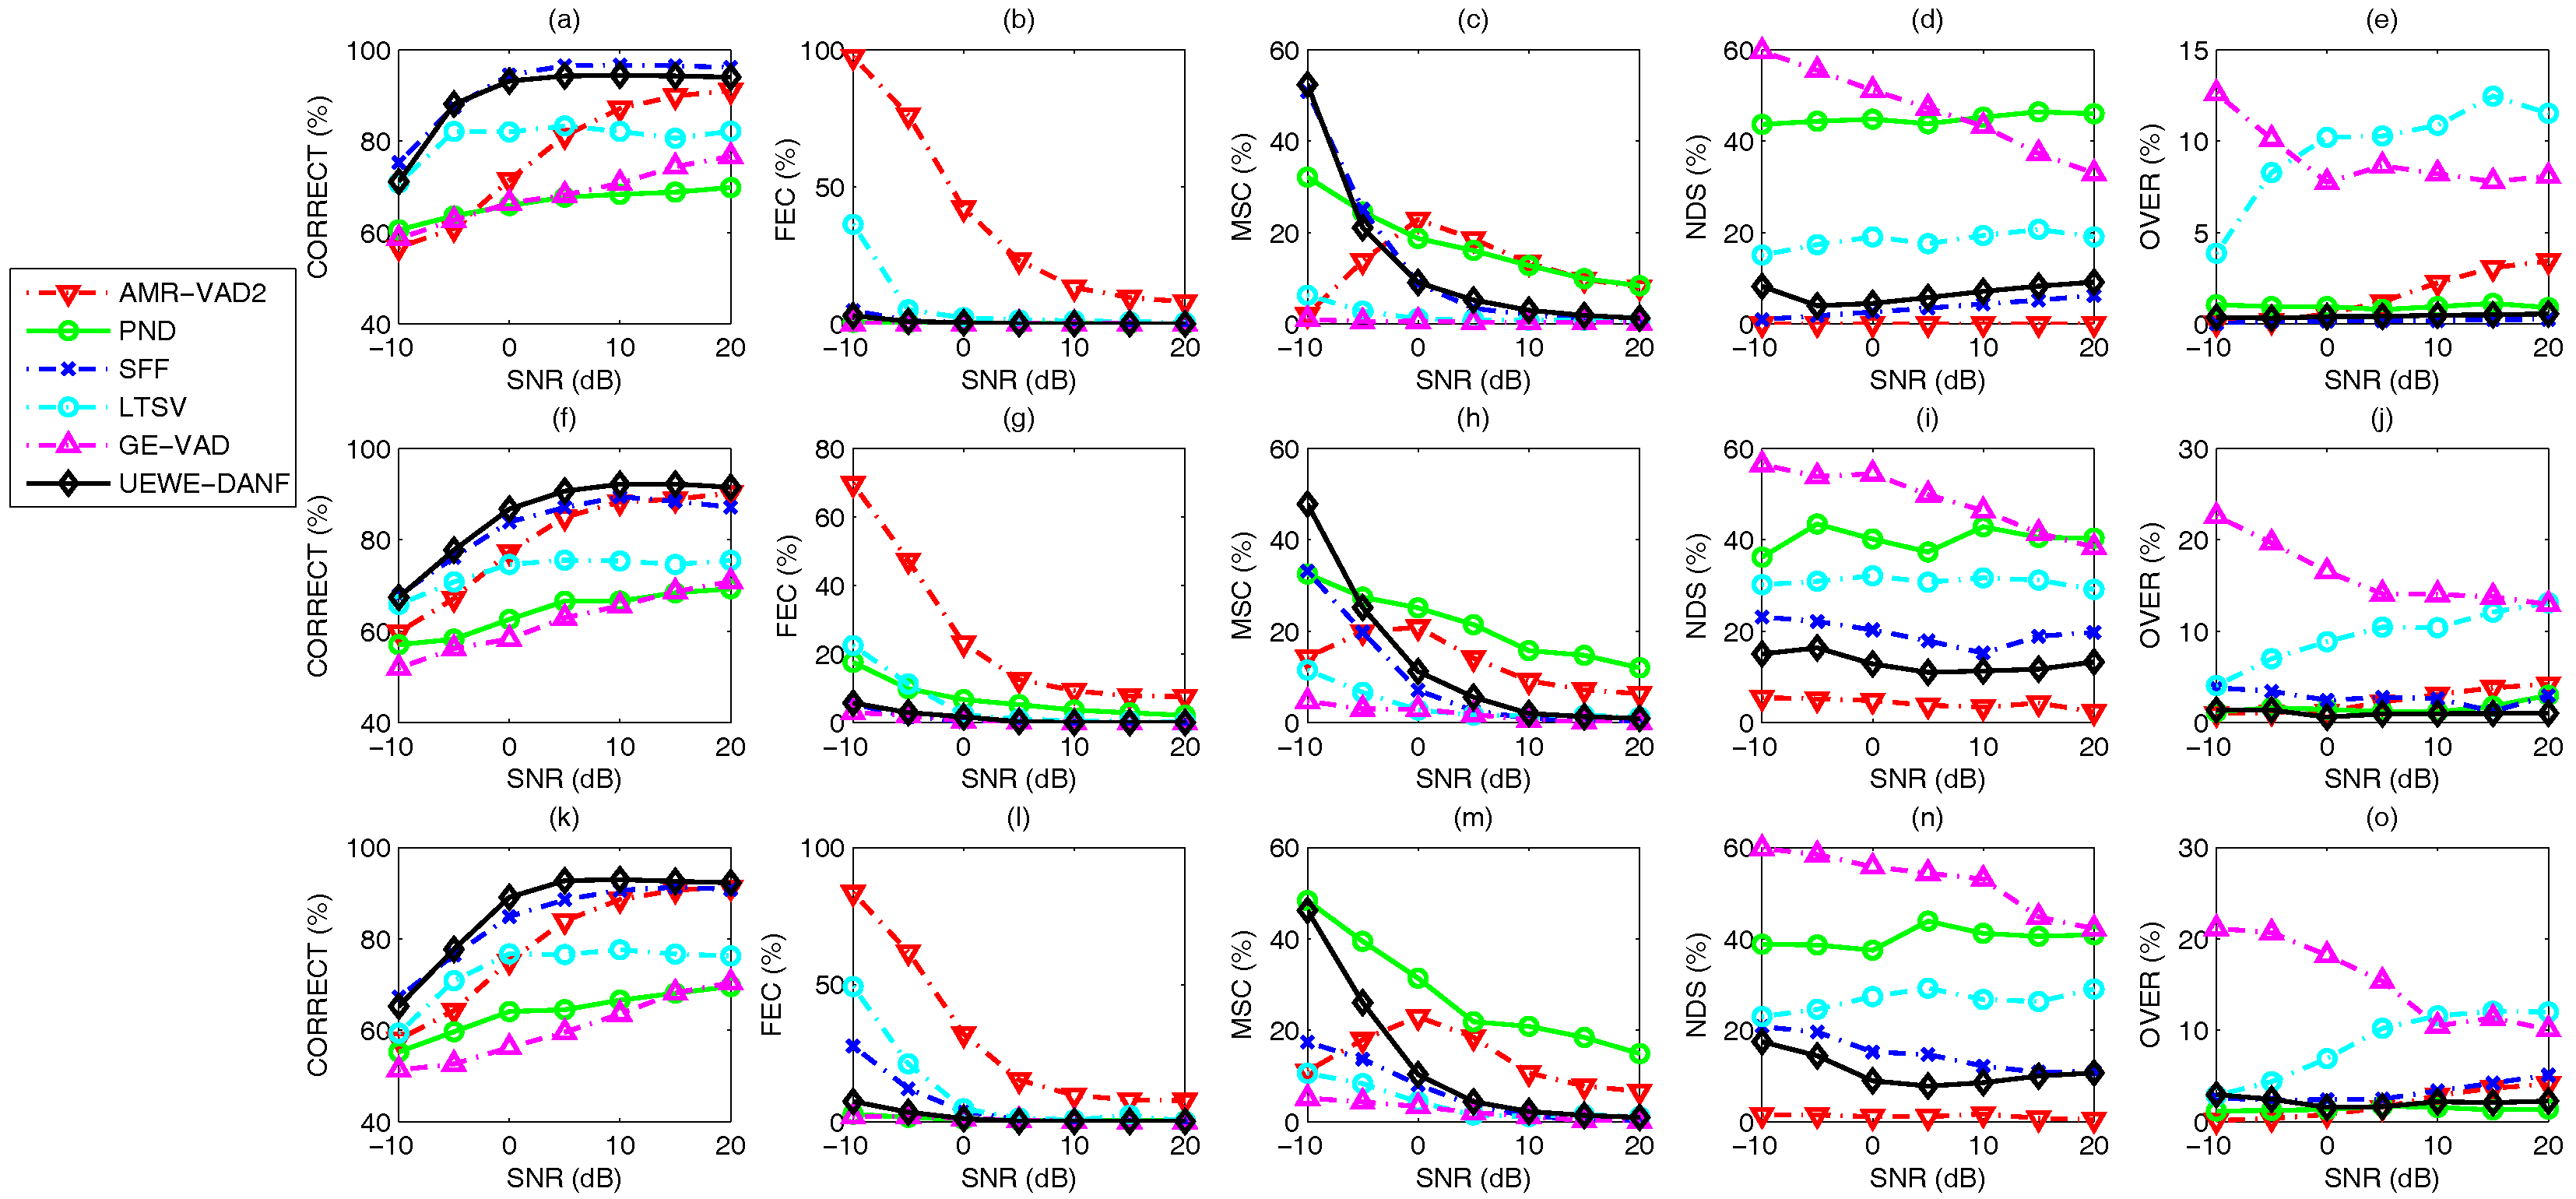
3.3. Voice Activity Detection Results and Benchmarking

Figure 12, Figure 13 and Figure 14 present the performance comparison between AMR-VAD2, PND, SFF, LTSV, GE-VAD and the proposed UEWE-DANF-based VAD when tested on 100 TIMIT speech signals that were degraded by additive white Gaussian noise (AWGN) and eight non-stationary noise samples from the AURORA-2 noise database, namely airport, babble, exhibition, car, restaurant, street, subway and train, at SNR ranging from −10 dB–20 dB with an increment of 5 dB.
The detection accuracy of the proposed UEWE-DANF-based VAD for all noise types is averaged and summarized in Table 2.
The results tabulated in Table 2 were obtained using isolated noise-degraded speech sentences. To examine the performance of the proposed VAD in continuous operation, the speech utterances are concatenated and fed into each VAD system contiguously. The average detection accuracy obtained in this experiment is tabulated in Table 3. To monitor the improvement achieved by the proposed VAD from GE-VAD, the detection accuracy at each stage of improvement is added into Table 3. The GE-VAD represents the initial stage, followed by UEWE, which represents the improvement made using the asymmetric nonlinear filter, and lastly, UEWE-DANF represents the replacement of offline threshold calculation with the dual-rate adaptive nonlinear filter.

4. Discussion

From Figure 12, Figure 13 and Figure 14, we observe that the detection accuracy of the proposed UEWE-DANF VAD is superior to its predecessor, GE-VAD and PND, at all SNR for all types of noise. Overall, the detection accuracy of UEWE-DANF VAD is also higher than LTSV except for subway noise. The difference in accuracy between UEWE-DANF and LTSV rises as the SNR increases. The LTSV-based VAD is a non-causal system that relies on past and future frames with reference to the current frame of interest. The voting scheme of LTSV-based VAD applied overlapping long windows of 300 ms on past and future frames to make a final VAD decision [1]. This implementation results in a less real-time VAD performance.
The proposed UEWE-DANF VAD also outperformed AMR-VAD2 [12] at low SNR (−10 dB–5 dB) for AWGN, airport noise, babble noise, exhibition noise, car noise and train noise. The performance of UEWE-DANF VAD and AMR-VAD2 is comparable at −10 dB–5 dB SNR for restaurant, street and subway noises. Some of these observations can be attributed to the characteristics of the noise. For instance, restaurant noise, street noise and subway noise have a higher degree of non-stationarity, e.g., transient interference produced by the departure and arrival of subway trains, as compared to the other six types of noise, which result in more impulsive traits in the noise region of the weighted entropy feature. These traits could potentially result in noise being detected as speech when SNR is low. Based on Figure 15, non-stationary noise such as airport and car noise are relatively constant over a long interval of time as compared to street noise and subway noise. Thus, the performance of the proposed VAD at negative SNR is better when tested against airport and car noises than street or subway noises; whereas for 5 dB–20 dB SNR, the detection accuracy of the proposed VAD is comparable to AMR-VAD2 for all noise types.
From Figure 12, Figure 13 and Figure 14, we can see that the detection accuracy of the SFF approach is highest among the four existing voice activity detectors that were selected for comparison. The SFF approach has higher accuracy in the offline mode as it relies on the knowledge of the entire signal to estimate the noise floor in noise compensation and computation of the decision threshold. Out of the nine types of noise, UEWE-DANF VAD achieved comparable detection accuracy for all noises except car noise and subway noise. The accuracy gap between the SFF approach and the proposed VAD is significantly large in subway noise at low SNR (−10 dB–5 dB). The drop in percentage is mainly due to the higher MSC rate at low SNR. The reason behind the high MSC rate for subway noise is the similarity between the speech and noise segments of the weighted entropy feature.
Based on Table 2, UEWE-DANF outperformed AMR-VAD2, PND, LTSV and GE-VAD regardless of the types of degradation. At −10 dB–0 dB SNR, the detection accuracy of UEWE-DANF is slightly lower than SFF, but it overtakes SFF from 5 dB onwards. Although the detection accuracy of UEWE-DANF is slightly lower than SFF at negative SNR for isolated speech, the detection accuracy of UEWE-DANF is much higher than SFF in continuous detection scenarios. In addition, UEWE-DANF also outperformed all existing VADs at every SNR. The ability of UEWE-DANF to detect voice activity continuously can be attributed to the highly adaptive weight factor and threshold computed using ANF and DANF, respectively.
The improvement achieved by the proposed VAD from GE-VAD can be observed from the last three columns of Table 3. The replacement of offline weight factor calculation with ANF has improved the detection accuracy at low SNR. However, the accuracy at high SNR drops due to the inability of the constant threshold to distinguish noise segments correctly. Therefore, the detection accuracy is largely improved after the implementation of DANF for adaptive threshold calculation.
Despite having slightly lower accuracy for car and subway noises in the isolated sentences scenario, the proposed VAD has the ability to produce VAD decision for each 64-ms frame. Meanwhile, the SFF could only achieve high accuracy by operating in offline mode. To ensure that the proposed VAD is fast enough for real-time implementation, we have tested it with various combinations of numbers of frequency channels, K, and the numbers of taps, L, for the gammatone filter bank on the ARM Cortex-M7 microcontroller. The efficiency of the proposed VAD algorithm on this microcontroller can be evaluated based on the required million instructions per second (MIPS). A lower MIPS (<10 MIPS) is preferable for real-time implementation on a digital signal processor (DSP) [40]. The required MIPS for each combination are as shown in Table 4.
From Table 4, the combination of 12 channels and 50 taps requires the lowest MIPS, which is 8.0–9.3. The performance of the proposed VAD is re-evaluated by reducing the default 16 gammatone filter channels and 200 gammatone filter taps in Table 1 to 12 and 50, respectively. The average detection accuracy of the proposed VAD with the new combination in continuous detection at different signal-to-noise ratios is tabulated in Table 5. The average detection accuracy decreases as the number of channels and taps are reduced. However, the accuracy of the proposed VAD with reduced complexity is superior to the existing VADs at negative SNR and achieved comparable results with the highest accuracy achieved by the existing VADs at negative SNR.

5. Conclusions

In this paper, we propose a voice activity detection algorithm using the upper envelope weighted entropy (UEWE) measure and the dual-rate adaptive nonlinear filter (DANF). The novel UEWE measure extracts frequency-sensitive information using the gammatone filter and computes the signal variability, i.e., weighted by its own upper envelope, across frequency using entropy. The signal’s upper envelopes were extracted using an asymmetric nonlinear filter, which also provides a hangover effect on the weighted entropy feature. This discriminative feature demonstrates high speech and non-speech separability. Based on the discriminative feature, an adaptive decision threshold is computed using DANF. The decision threshold was computed at two different changing rates for long noise intervals and potential speech segments to minimize the trade-off between sensitivity and specificity, i.e., caused by the similarity between the amplitude of speech and non-speech at low SNR. Based on the results from our extensive evaluations, the proposed VAD outperformed existing formant-based VAD [9] and our earlier VAD [24] for all types of noises that were tested. The proposed VAD also achieved higher detection accuracy as compared to AMR-VAD2 for all noise types. Besides, the performance of the proposed VAD also achieved comparable results with the best existing VAD, which is the SFF approach [25]. While the SFF approach achieved high accuracy, the proposed VAD achieved comparable results while being implemented in real time. In addition, the proposed VAD also achieved superior results as compared to SFF when both were tested with contiguous sentences, which mean that the proposed VAD is more suitable for continuous speech detection that is commonly practiced in real-time practical applications. The proposed VAD is also capable of maintaining its high detection accuracy as compared to the existing VADs when the number of channels and the number of taps for the gammatone filter bank are reduced to 12 and 50, respectively. The reduced combination enabled the proposed VAD to lower the requirement in million instructions per second (8–9.3 MIPS).

Acknowledgments

This research is supported by Collaborative Research in Engineering, Science and Technology (CREST) R&D Grant MMUE/140100 and was performed in collaboration with Motorola Solutions (Malaysia) Sdn. Bhd. Publication of this paper is funded by the Multimedia University.

Author Contributions

W.Q. Ong, A.W.C. Tan and V.V. Vengadasalam conceived of and designed the experiments. W.Q. Ong and A.W.C. Tan performed the experiments and analyzed the data. C.H. Tan and T.H. Ooi contributed reagents/materials/analysis tools. W.Q. Ong wrote the paper.

Conflicts of Interest

The authors declare no conflict of interest.

Abbreviations

The following abbreviations are used in this manuscript:
VADVoice activity detection
SNRSignal-to-noise ratio
UEWEUpper envelope weighted entropy
ANFAsymmetric nonlinear filter
DANFDual-rate adaptive nonlinear filter
VoIPVoice over Internet Protocol
SVMSupport vector machine
LRTLikelihood ratio test
GMMsGaussian mixture models
HMMsHidden Markov models
MFCCsMel frequency cepstral coefficients
AMR-VAD2Voice activity detection for adaptive multi-rate Option 2
PNDPeak neighbor difference
SFFSingle frequency filtering
GE-VADGammatone and entropy-based voice activity detector
ERBEquivalent rectangular bandwidth
LTSVLong-term signal variability
FECFront-end clipping
MSCMid-speech clipping
OVERCarry over
NDSNoise detected as speech
ETSIEuropean Telecommunications Standards Institute
AWGNAdditive white Gaussian noise
MIPSMillion instructions per second
DSPDigital signal processor

References

  1. Ghosh, P.K.; Tsiartas, A.; Narayanan, S. Robust Voice Activity Detection Using Long-Term Signal Variability. IEEE Trans. Audio Speech Lang. Process. 2011, 19, 600–613. [Google Scholar] [CrossRef]
  2. Beritelli, F.; Casale, S.; Ruggeri, G. New Speech Processing Issues in IP Telephony. In Proceedings of the International Conference on Communication Technology Proceedings (WCC-ICCT), Beijing, China, 21–25 August 2000; pp. 652–656. [Google Scholar]
  3. Adeli, M.; Rouat, J.; Wood, S.; Molotchnikoff, S.; Plourde, E. A Flexible Bio-Inspired Hierarchical Model for Analyzing Musical Timbre. IEEE/ACM Trans. Audio Speech Lang. Process. 2016, 24, 875–889. [Google Scholar] [CrossRef]
  4. Kathirvel, P.; Manikandan, M.S.; Senthilkumar, S.; Soman, K.P. Noise Robust Zerocrossing Rate Computation for Audio Signal Classification. In Proceedings of the 3rd International Conference on Trendz in Information Sciences & Computing (TISC2011), Chennai, India, 8–9 December 2011; pp. 65–69. [Google Scholar]
  5. Lokhande, N.N.; Nehe, N.S.; Vikhe, P.S. Voice Activity Detection Algorithm for Speech Recognition Applications. In Proceedings of the International Conference in Computational Intelligence (ICCIA), Maharastra, India, 11–12 February 2012; pp. 5–7. [Google Scholar]
  6. Ma, Y.; Nishihara, A. Efficient voice activity detection algorithm using long-term spectral flatness measure. EURASIP J. Audio Speech Music Process. 2013. [Google Scholar] [CrossRef]
  7. Haghani, S.K.; Ahadi, S.M. Robust Voice Activity Detection Using Feature Combination. In Proceedings of the 21st Iranian Conference on Electrical Engineering (ICEE), Mashhad, Iran, 14–16 May 2013; pp. 1–5. [Google Scholar]
  8. Saeedi, J.; Ahadi, S.M.; Faez, K. Robust Voice Activity Detection directed by noise classification. Signal Image Video Process. 2015, 9, 561–572. [Google Scholar] [CrossRef]
  9. Yoo, I.C.; Lim, H.; Yook, D. Formant-Based Robust Voic Activity Detection. IEEE/ACM Trans. Audio Speech Lang. Process. 2015, 23, 2238–2245. [Google Scholar]
  10. Kola, J.; Espy-Wilson, C.; Pruthi, T. Voice Activity Detection; Merit Bien: College Park, MD, USA, 2011; pp. 1–6. [Google Scholar]
  11. Benyassine, A.; Shlomot, E.; Su, H.Y. ITU-T Recommendation G.729 Annex B: A Slience Compression Scheme for Use with G.729 Optimized for V.70 Digital Simultaneous Voice and Data Applications. IEEE Commun. Mag. 1997, 35, 64–73. [Google Scholar] [CrossRef]
  12. European Telecommunications Standards Institute (ETSI). Voice Activity Detection (VAD) for Adaptive Multi-Rate (AMR) Speech Traffic Channels; ETSI EN 301 708 v.7.1.1; ETSI: Valbonne, France, 1999. [Google Scholar]
  13. Germain, F.G.; Sun, D.L.; Mysore, G.J. Speaker and Noise Independent Voice Activity Detection. In Proceedings of the 14th Annual Conference of the International Speech Communication Association, Lyon, France, 25–29 August 2013; pp. 732–736. [Google Scholar]
  14. Pham, C.K. Noise Robust Voice Activity Detection. Master’s Thesis, Nanyang Technology University, Singapore, 2012. [Google Scholar]
  15. Tan, L.N.; Borgstrom, B.J.; Alwan, A. Voice Activity Detection Using Harmonic Frequency Components in Likelihood Ratio Test. In Proceedings of the IEEE International Conference on Acoustics, Speech and Signal Processing, Dallas, TX, USA, 14–19 March 2010; pp. 4466–4469. [Google Scholar]
  16. Minotto, V.P.; Jung, C.R.; Lee, B. Simultaneous-Speaker Voice Activity Detection and Localization Using Mid-Fusion of SVM and HMMs. IEEE Trans. Multimed. 2014, 16, 1032–1044. [Google Scholar] [CrossRef]
  17. Popović, B.; Pakoci, E.; Pekar, D. Advanced Voice Activity Detection on Mobile Phones by Using Microphone Array and Phoneme-Specific Gaussian Mixture Models. In Proceedings of the IEEE 14th International Symposium on Intelligent Systems and Informatics, Subotica, Serbia, 29–31 August 2016; pp. 45–50. [Google Scholar]
  18. Ferroni, G.; Bonfigli, R.; Principi, E.; Squartini, S.; Piazza, P. A Deep Neural Network Approach for Voice Activity Detection in Multi-Room Domestic Scenarios. In Proceedings of the International Joint Conference on Neural Networks, Killarney, Ireland, 12–17 July 2015; pp. 1–8. [Google Scholar]
  19. Luo, D.; Yang, R.; Huang, J. Detecting Double Compressed AMR Audio Using Deep Learning. In Proceedings of the IEEE International Conference on Acoustic, Speech and Signal Proccesing, Florence, Italy, 4–9 May 2014; pp. 2669–2673. [Google Scholar]
  20. Touazi, A.; Debyeche, M. A Case Study on Back-End Voice Activity Detection for Distributed Speech Recognition System using Support Vector Machines. In Proceedings of the 2014 Tenth International Conference on Signal-Image Technology and Internet-Based Systems, Marrackech, Morocco, 23–27 November 2014; pp. 21–26. [Google Scholar]
  21. Souissi, N.; Cherif, A. Dimensionality Reduction for Voice Disorders Identification System Based on Mel Frequency Cepstral Coefficients and Support Vector Machine. In Proceedings of the 7th International Conference on Modelling, Identification and Control, Sousse, Tunisia, 18–20 December 2015; pp. 1–6. [Google Scholar]
  22. Ying, D.; Yan, Y.; Dang, J.; Soong, F.K. Voice Activity Detection Based on an Unsupervised Learning Framework. IEEE Trans. Audio Speech Lang. Process. 2011, 19, 2624–2633. [Google Scholar] [CrossRef]
  23. Cornu, E.; Sheikhzadeh, H.; Brennan, R.L.; Abutalebi, H.R.; Tam, E.C.Y.; Iles, P.; Wong, K.W. ETSI-AMR2 VAD: Evaluation and Ultra Low-Resource Implementation. In Proceedings of the International Conference on Multimedia and Expo, Baltimore, MD, USA, 6–9 July 2003; Volume 2, p. II-841-4. [Google Scholar]
  24. Ong, W.Q.; Tan, A.W.C. Robust Voice Activity Detection Using Gammatone Filtering and Entropy. In Proceedings of the International Conference on Robotics, Automation and Sciences, Melaka, Malaysia, 5–6 November 2016; pp. 1–5. [Google Scholar]
  25. Aneeja, G.; Yegnanarayana, B. Single Frequency Filtering Apporach for Discriminating Speech and Nonspeech. IEEE/ACM Trans. Audio Speech Lang. Process. 2015, 23, 705–717. [Google Scholar] [CrossRef]
  26. Moore, B.C.J. Coding of sounds in the Auditory System and Its Relevance to Signal Processing and Coding in Cochlear Implants. Otol. Neurotol. 2003, 24, 243–254. [Google Scholar] [CrossRef] [PubMed]
  27. Johannesma, P.I.M. The pre-response stimulus ensemble of neuron in the cochlear nucleus. In Proceedings of the Symposium of Hearing Theory, Eindhoven, The Netherlands, 22–23 June 1972; pp. 58–69. [Google Scholar]
  28. Schlider, R.; Bezrukov, I.; Wagner, H.; Ney, H. Gammatone Features and Feature Combination for Large Vocabulary Speech Recognition. In Proceedings of the IEEE International Conference on Acoustic, Speech and Signal Processing, Honolulu, HI, USA, 15–20 April 2007; pp. IV-649–IV-652. [Google Scholar]
  29. Qi, J.; Wang, D.; Jiang, Y.; Liu, R. Auditory Features Based on Gammatone Filters for Robust Speech Recognition. In Proceedings of the IEEE International Symposium on Circuits and Systems, Beijing, China, 19–23 May 2013; pp. 305–308. [Google Scholar]
  30. Kim, C.; Stern, R.M. Power-Normalized Cepstral Coefficient (PNCC) for Robust Speech Recognition. IEEE/ACM Trans. Audio Speech Lang. Process. 2016, 24, 1315–1329. [Google Scholar] [CrossRef]
  31. Papadopoulos, P.; Tsiartas, A.; Narayanan, S. Long-term SNR Estimation of Speech Signals in Known and Unknown Channel Conditions. IEEE/ACM Trans. Audio Speech Lang. Process. 2016, 24, 2495–2506. [Google Scholar] [CrossRef]
  32. Renevey, P.; Drygajlo, A. Entropy Based Voice Activity Detection in Very Noisy Condition. In Proceedings of the EUROSPEECH 2001 Scandinavia, 7th European Conference on Speech Communication and Technology, 2nd INTERSPEECH Event, Aalborg, Denmark, 3–7 September 2001; pp. 1887–1890. [Google Scholar]
  33. Asgari, M.; Sayadian, A.; Farhadloo, M.; Mehrizi, E.A. Voice Activity Detection Using Entropy in Spectrum Domain. In Proceedings of the Australasian Telecommunication Networks and Applications Conference, Adelaide, Australia, 7–10 December 2008; pp. 407–410. [Google Scholar]
  34. Metzger, R.A.; Doherty, J.E.; Jenkins, D.M. Using Approximate Entropy as a Speech Quality Measure for a Speaker Recognition System. In Proceedings of the Annual Conference on Information Science and Systems, Princeton, NJ, USA, 16–18 March 2016; pp. 292–297. [Google Scholar]
  35. Humeau-Heurtier, A.; Wu, C.W.; Wu, S.D.; Mahe, G.; Abraham, P. Refined Multiscale Hilbert-Huang Spectral Entropy and Its Application to Central and Peripheral Cardiovascular Data. IEEE Trans. Biomed. Eng. 2016, 63, 2405–2415. [Google Scholar] [CrossRef] [PubMed]
  36. Freeman, D.K.; Cosier, G.; Southcott, C.B.; Boyd, I. The Voice Activity Detector for The Pan-European Digital Cellular Mobile Telephone Service. In Proceedings of the International Conference on Acoustics, Speech, and Signal Processing, Glasgow, UK, 23–26 May 1989; pp. 369–372. [Google Scholar]
  37. Beritelli, F.; Casale, S.; Cavallaero, A. A robust voice activity detector for wireless communications using soft computing. IEEE J. Sel. Areas Commun. 1998, 16, 1818–1829. [Google Scholar] [CrossRef]
  38. Garofolo, J.S.; Lamel, L.F.; Fisher, W.M.; Fiscus, J.G.; Pallet, D.S.; Dahlgren, N.L.; Zue, V. TIMIT Acoustic-Phonetic Continuous Speech Corpus LDC93S1; Linguistic Data Consortium: Philadelphia, PA, USA, 1993; Available online: https://catalog.ldc.upenn.edu/docs/LDC93S1/ (accessed on 9 September 2017).
  39. ELDA S.A.S. ELRA Catalogue. AURORA Project Database 2.0, ISLRN: 977-457-139-304-2, ELRA ID: AURORA/CD0002. Available online: http://catalog.elra.info (accessed on 9 September 2017).
  40. Rajamani, K.; Lai, Y.; Farrow, C.W. An Efficient Algorithm for Sample Rate Conversion from CD to DAT. IEEE Signal Process. Lett. 2000, 7, 288–290. [Google Scholar] [CrossRef]
Figure 1. Structure of the proposed voice activity detection algorithm.
Entropy 19 00487 g001
Figure 2. Input (blue) and output (red) response of the asymmetric nonlinear filter (ANF): (a) ANF as the upper envelope detector, λ i < λ j ; (b) ANF as the lower envelope detector, λ i λ j .
Entropy 19 00487 g002
Figure 3. Illustration of a signal of a single utterance and the weighted entropy extracted using the UEWE measure: (a) an audio sample consisting of a single utterance and crowd noise at 0 dB SNR; (b) corresponding weighted entropy feature for the signal described in (a).
Entropy 19 00487 g003
Figure 4. Illustration of a signal of multiple sentences and the weighted entropy extracted using the UEWE measure: (a) an audio sample consisting of a multiple utterances and crowd noise at 0 dB SNR; (b) corresponding weighted entropy feature for the signal described in (a).
Entropy 19 00487 g004
Figure 5. Functional block diagram of DANF.
Entropy 19 00487 g005
Figure 6. Impulse response of gammatone filter bank: (a) gammatone impulse response at f c = 300 Hz; (b) gammatone impulse response at f c = 691.8 Hz; (c) gammatone impulse response at f c = 2976.2 Hz.
Entropy 19 00487 g006
Figure 7. Gammatone filter output at each center frequency.
Entropy 19 00487 g007
Figure 8. Noise effect compensation on the degraded signal: (a) speech signal degraded by crowd noise at 5 dB SNR; (b) signal envelope of the clean speech signal; (c) signal envelope of the noisy signal; (d) noise-compensated signal envelope.
Entropy 19 00487 g008
Figure 9. (a) Speech signal degraded by crowd noise at 0 dB SNR; (b) weighted entropy H ( n ) .
Entropy 19 00487 g009
Figure 10. Computation of the decision threshold using DANF. (a) Speech signal degraded by subway noise at 0 dB SNR; (b) corresponding average weighted entropy feature, γ m , and its decision threshold, θ m .
Entropy 19 00487 g010
Figure 11. Illustration of the VAD performance metrics proposed in [36].
Entropy 19 00487 g011
Figure 12. Performance comparison as a percentage of detection accuracy/CORRECT, front-end clipping (FEC), mid-speech clipping (MSC), noise detected as speech (NDS) and carry over (OVER) for different noise types at various SNR: (ae) AWGN; (fj) airport noise; (ko) babble noise.
Entropy 19 00487 g012
Figure 13. Performance comparison as a percentage of detection accuracy/CORRECT, front-end clipping (FEC), mid-speech clipping (MSC), noise detected as speech (NDS) and carry over (OVER) for different noise types at various SNR: (ae) exhibition noise; (fj) car noise; (ko) restaurant noise.
Entropy 19 00487 g013
Figure 14. Performance comparison as a percentage of detection accuracy/CORRECT, front-end clipping (FEC), mid-speech clipping (MSC), noise detected as speech (NDS) and carry over (OVER) for different noise types at various SNR: (ae) street noise; (fj) subway noise; (ko) train noise.
Entropy 19 00487 g014
Figure 15. Noise signals form the AURORA-2 database. (a) Airport noise; (b) car noise; (c) street noise; (d) subway noise.
Entropy 19 00487 g015
Table 1. Parameters applied in the proposed voice activity detection algorithm.
ParametersValues
Sampling frequency8000 Hz
Frame size, N512 (64 ms)
Pre-emphasis factor, ζ −0.9375
Number of gammatone filter channel, K16
Number of gammatone filter tap, L200
Gammatone filter bank frequency range, f c ( 1 ) ; f c ( K ) 300 Hz; 4000 Hz
ANF coefficient, λ i ; λ j 0.1; 0.9
Transition threshold coefficient, ϵ 3
Threshold value, β 20
ANF coefficient, α i ; α j 0.99; 0.9
Table 2. Average detection accuracy (%) at different signal-to-noise ratios of AMR-VAD2 [12], PND [9], SFF [25], LTSV [1], GE-VAD [24] and the proposed UEWE-DANF.
SNR (dB)Voice Activity Detection Algorithms
AMR-VAD2PNDSFFLTSVGE-VADUEWE-DANF
−1057.9657.0767.6763.2353.5866.62
−563.360.3676.5970.0657.1675.36
073.1764.2583.9374.9761.5882.95
582.0366.4387.276.8166.3787.8
1087.2167.4488.4477.0169.9390.27
1589.3569.4688.9876.3873.3890.94
2090.3470.4989.0676.0475.6191.2
Table 3. Average detection accuracy (%) of the existing and proposed VADs for continuous detection at different signal-to-noise ratios.
SNR (dB)Voice Activity Detection Algorithms
AMR-VAD2PNDSFFLTSVGE-VADUEWEUEWE-DANF
−1060.1158.6362.5955.5853.9162.464.16
−569.2363.3967.6364.4157.8270.5172.84
080.1668.8471.6768.5264.3872.8284.4
579.1272.7175.2863.4467.4370.5188.44
1081.3676.4277.8262.9670.7970.4992.06
1581.5478.980.8865.7672.7869.591.67
2087.9180.1781.1264.0774.8966.5491.56
Table 4. The required MIPS for different combination of channel and tap numbers.
Number of Channels, KNumber of Taps, LMIPS
1650232.3–250.3
1630148.8–159.4
145047.4–49.86
121008.53–8.84
12508.0–9.3
12308.9–9.4
810016–16.5
85016.3–17.5
83016.5–17.0
Table 5. A comparison between the highest average detection accuracy (%) of the existing VADs and the average detection accuracy (%) of UEWE-DANF and its reduced version for continuous detection at different signal-to-noise ratios.
SNR (dB)Highest Value among the Existing VADsUEWE-DANF (K = 16, L = 200)UEWE-DANF (K = 12, L = 50)
−1062.5964.1662.91
−569.2372.8469.39
080.1684.481.6
579.1288.4487.71
1081.3692.0691.81
1581.5491.6791.47
2087.9191.5691.43

