1. Introduction
Alzheimer’s disease (AD) is the leading cause of dementia [
1], with the World Alzheimer Report of 2015 [
2] estimating 9.9 million new dementia cases every year worldwide. AD is characterized by loss of neuronal cells and development of neurofibrillary tangles and cortical amyloid plaques [
3]. It continues to be difficult to diagnose as it shares symptoms with other dementia-related diseases. Diagnosis of AD is either possible or probable [
4]. Common routine diagnostic procedures and workout for AD patients include clinical interviews with neuropsychological tests that evaluate possible cognitive deficits, imaging techniques such as structural and functional magnetic resonance imaging (MRI), and PET scans. MRI is widely available, but can be costly and is not suitable for patients who are claustrophobic, while PET scans are expensive, not easily available, and invasive, with intravenous access and exposure to radiation [
5]. Use of an electroencephalogram as an aid for physicians for the diagnosis of AD is a viable option as it is widely available in neurological clinics, relatively inexpensive, noninvasive, and has mobility potential [
6].
Three major effects of cognitive decline have been observed in the EEGs of AD patients: slowing of the EEG in terms of a shift in the power spectrum to lower frequencies, reduced complexity of EEG signals, and reduced coherence of signals measured at different locations on the cortex [
7,
8]. Furthermore, [
7] pointed out the loss of connectivity in cortex of AD patients and that EEG signals are generated by nonlinear interactions between neurons. The loss of connectivity in the brain could mean deficiency in the information processing of the cortex. As such, we expect a change in the nonlinear qEEG markers describing complexity of a signal such as entropy and auto mutual information (AMI) in AD patients. The behavior of entropy and AMI in AD patients has been assessed in the past. A previous study by Jeong et al. on AMI found that the rate of decrease of AMI was correlated with MMSE scores [
9]. In their investigation of multiscale entropy (MsE), Yang et al. observed a decrease in MsE complexity in short time scales in AD patients with increased severity and increased MsE complexity in long time scales [
10]. On the other hand, Escudero et al. found better MsE in deeper scales of EEG in their study on AD patients and found less complexity in AD patients than in control subjects [
11]. Mizuno et al. observed less complexity in the AD groups at smaller scales in the frontal area and higher complexity at larger scales was seen across the brain and was correlated with cognitive decline [
12]. In their investigation of spectral entropy (SpE), 79.2% accuracy in classifying amnestic mild cognitive decline patients, AD patients and normal controls using regional SpE and complexity features was achieved by McBride et al [
13]. Garn et al observed association of AMI, Shannon entropy (ShE) and Tsallis entropy (TsE) to MMSE [
14,
15].
While most of the previous studies have looked into the comparison of qEEG markers between AD to healthy controls or to mild cognitive impairment, the focus of this paper was to observe changes in the qEEG markers in comparison to MMSE scores at mild and moderate stages of the disease. Mini-mental state examination (MMSE) [
16] is a method to evaluate the cognitive state of AD patients and have been routinely used in clinical settings. We are interested in the behavior of the markers, entropy, and AMI, at specific electrode sites or regions of the brain, as the cognitive decline of probable AD patients becomes more severe. Garn et al. [
14] have shown correlation between the MMSE scores of AD patients to AMI, ShE, and TsE. Following up on the previous findings of their paper about the correlation between AD severity, as expressed by the MMSE, and the EEG markers of AMI, ShE, and TsE, the addition of other entropy definitions of SpE and MsE were examined in this paper. The same subjects from [
14] participated in this study. While 79 subjects were reported in the previous paper, the eventual number of participants was effectively 64 subjects due to the automatic exclusion of data in the statistical analysis as there was missing/unknown demographic information.
The objective of this study is to investigate whether disease severity, ranging from mild to moderate, could be explained by nonlinear EEG markers, in the hope to find specific markers that could aid in the diagnosis of AD patients. No healthy controls were used in this study as the focus is on the severity of the disease in relation to the markers within probable AD patients.
2. Materials and Methods
2.1. Subjects
The 79 subjects participated in this study where all were diagnosed with probable Alzheimer’s disease according to NINCDS-ADRDA criteria [
4,
17] (See
Appendix A). All subjects were participants in the Prospective Dementia Database Austria (PRODEM), a multi-cohort study of patients diagnosed with AD. Written consent forms were obtained from all participating subjects and their caregivers. The responsible ethics commissions approved the study.
During assessment, MMSE tests and EEG recordings were performed on all patients. As seen in
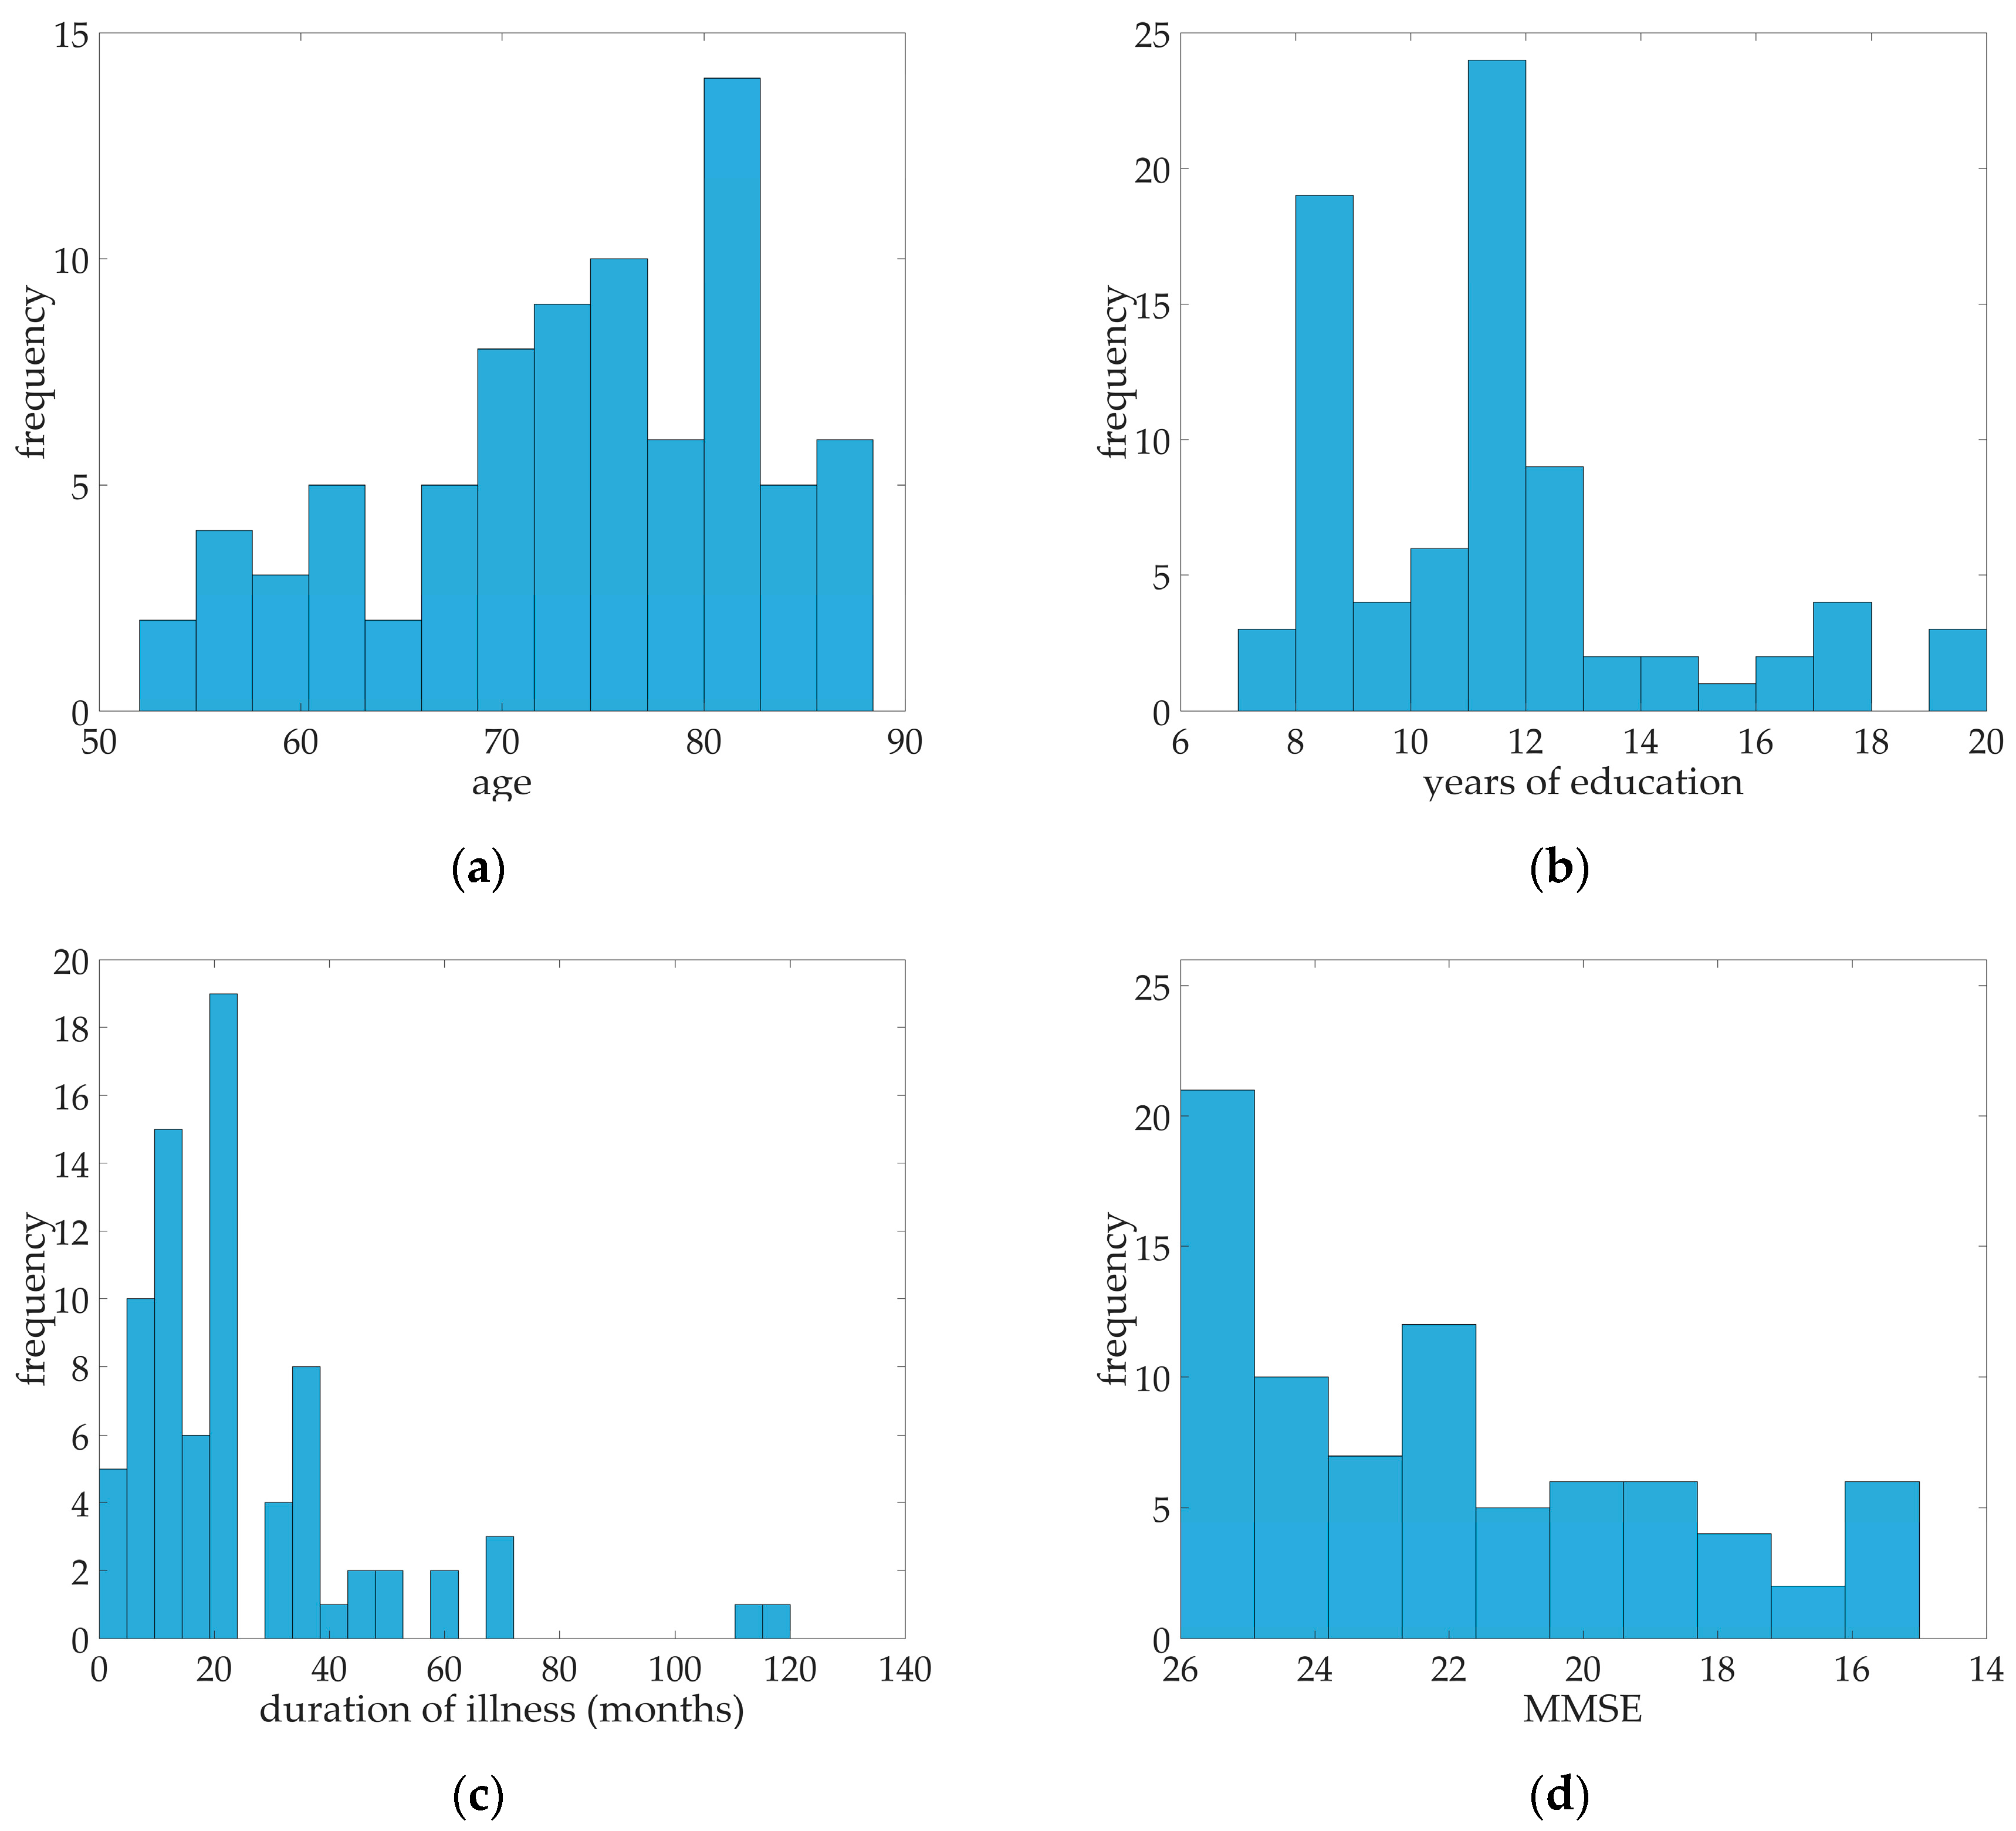
Table 1, a median of 22 for MMSE was calculated. Ranging from 15 to 26 MMSE scores, all 79 probable AD patients were in the mild to moderate case. The median age of the subjects was 75, median education in years was 11, and the median duration of illness in months was 23. Distribution of age, years of education, duration of illness, and MMSE scores were illustrated in
Figure 1. Fifty of the subjects were female and 29 were male. 57% percent of the patients had arterial hypertension while almost 13% of patients were diagnosed with diabetes mellitus, 10% had coronary heart disease, and 29 patients had hypercholesterolemia (See
Table 1).
2.2. Ethical Statement
The ethics committees of the Medical University of Graz (19-135 ex 07/08), Medical University of Innsbruck (UN3259), Medical University of Vienna (176/2008) and Ethics Committee of the State of Upper Austria have approved this study.
2.3. EEG Recordings
All patients underwent EEG recordings in an upright seated position in a resting state with their eyes closed for approximately three minutes. A series of other positions and tests prescribed by physicians were also recorded. However, these took place after the three minutes of rest and were not included in this study.
Nineteen monopolar electrode sites according to the International 10/20 System were used to collect the following EEG data: Fp1, Fp2, Fz, F3, F4, F7, F8, T7, T8, Cz, C3, C4, Pz, P3, P4, P7, P8, O1, and O2. Two electrodes placed at the outer corner of the right and left eye recorded data for the horizontal electro-oculogram (HEOG). Vertical electro-oculogram (VEOG) electrodes were placed above and below the left eye. A ground electrode was placed at FCz and connected mastoid electrodes were used as references. Contact impedances were kept below 10 kΩ each. Data was collected using the AlphaEEG amplifier with NeuroSpeed software (alpha trace medical systems, Vienna, Austria). The EEG amplifier had a band pass of 0.3 to 70 Hz with a 50 Hz notch filter. Data were collected at 256 Hz with 16 bit resolution. ECG signals were also recorded via clamp electrodes around the subjects’ wrists.
2.4. EEG Preprocessing
All EEG recordings were preprocessed to remove any artefacts, movements, irregular segments in the recording due to loosed or detached electrodes, and cardiac activity. The following steps were taken:
Visual inspection by an expert to exclude segments in the recording with highly irregular signals due to any patient movements, loose, or detached electrodes. An average of 168s from the total three-minute recording of the EEG was selected.
A 2 Hz high-pass filter was applied to all remaining EEG, EOG, and ECG signals.
Any interference due to eye movements, including blinking, was filtered from the EEG signal by linear regression using the HEOG and VEOG according to the Draper and Smith method [
18].
Some EEG signals contained interference from heart signals appearing as small voltage peaks. These were removed based on the ECG signals recorded; the procedure was carried out according to a modified Pan-Tompkins algorithm and linear regression [
19].
2.5. EEG Epochs
In the 3-min EEG recordings, 168 s of recording was the averaged selected EEG recordings for all 79 patients. 69 of the patients did not have segments in the EEG recordings that were excluded. The EEG markers to be obtained from the EEG recordings rely on the stationarity of the segment while the EEG signals are basically non-stationary [
20]. To overcome this problem, a solution of using “quasi-stationary” segments was used for EEG markers computation. The selected EEG signals were divided into 4-s epochs with 2 s of overlap. The length of the segment was verified by the augmented Dickey-Fuller test [
21]. As each patient had different number of epochs to be used, a limit of 40 epochs per patient, equivalent to 85 s, was imposed. For uniformity, only the first 40 epochs of each patient were used to calculate the EEG markers. All epoch values are provided in the
supplementary materials.
2.6. qEEG Markers and Computation
This study focused on the following nonlinear qEEG markers explaining complexity of the brain signals: ShE, TsE, MsE, SpE, and AMI. Each marker was the average computed value on “quasi-stationary” 4-second segments of EEG signal for all channels or clusters. All markers were calculated in the frequency range of 2–30 Hz.
Entropy measures the predictability of a random variable, in this case, an EEG signal of channel
, as a measure of the signal’s complexity. ShE of signal
of length T is
while TsE is calculated by
where
is the entropy index and is set at
for this study [
14].
SpE measures the complexity of the signal not in the time domain but in the frequency domain. The power spectral density (PSD) of the signal was estimated using the Welch method. Computation of the probability density function (PDF) was carried out by the normalization of the PSD. SpE is then calculated using the ShE equation on the PDF [
22].
On the other hand, MsE measures the complexity of the signal by looking at the scale of the signal. The concept of multiple scales was explained by Costa et al. [
23]. The scaled signal is achieved via resampling of the original signal where a scale of
represents the original signal and increasing the
will give a coarse-grained version of a signal. A
scaled version of a signal
is given by
and the MsE is achieved by computing the sample entropy of the scaled signal. For this study,
was tested. As the scale increases, the length of the scaled signal decreases, a modified version of the MsE (further referred to as MsE modified) performed by Wu et al. [
24]. Their method involved replacing the scaled version of the signal by a template vector calculated by moving-average and time delay to give better estimates of the MsE. MsE and MsE modified computations were employed in this study. Computation of MsE modified in higher scales were carried out for
.
Mutual information (MI) is a measure of the dependence between two signals of two random variables, where a value of 0 means that two variables are independent of each other [
25]. In the case of this study, the MI is measured between an EEG signal from channel
and its time time-shifted version, hence it is called AMI. It is different from cross MI where it measures the dependence between two signals [
9]. AMI is the EEG marker that was investigated here. It measures the predictability of the signal, or how the original signal can predict its time-shifted version. Given that an EEG signal of channel
is
and its time-shifted version
, both with length of
, the AMI is then defined as
where
,
, and
are the estimated probability functions. A signal with higher values denotes better predictability. The AMI was calculated on individual electrode sites and on clusters defined by the regions of the brain: anterior, anterior/temporal, central, posterior, posterior/temporal, temporal-left, temporal-right, left, right, and all (See
Appendix B).
2.7. Statistical Analysis
Multiple regression models were used to analyze disease severity quantified by MMSE in relation to each EEG markers per electrode site or cluster. The dependent variable was the MMSE score and the main independent variable was the specific qEEG marker, with age, duration of illness, and years of education as other predictors. The qEEG marker was added to the model as linear or in linear and squared terms. Inclusion of the other predictors was necessary as MMSE scores are affected by age and education [
26]. The significance of the regression models was assessed by the Fisher’s
f-test. The coefficients of determination, R
2, were compared to analyze the goodness of fit of the model. Holm-Bonferroni method [
27] was used to control the familywise error rate. Given a total of 875 total statistical tests, all statistical results were ranked and sequentially tested for significance following the said method. Stability of the markers was assessed by the calculated variance of the markers per patient, given that the markers are the mean values of the calculated marker from the 40 epochs. Assessment of the individual variables of the model was based on the
t-stat test,
. Standardized regression coefficients were also computed to compare the coefficients of variables given the differences in the variables’ units.
3. Results
Multiple regression models with significant results are shown in
Table 2 and
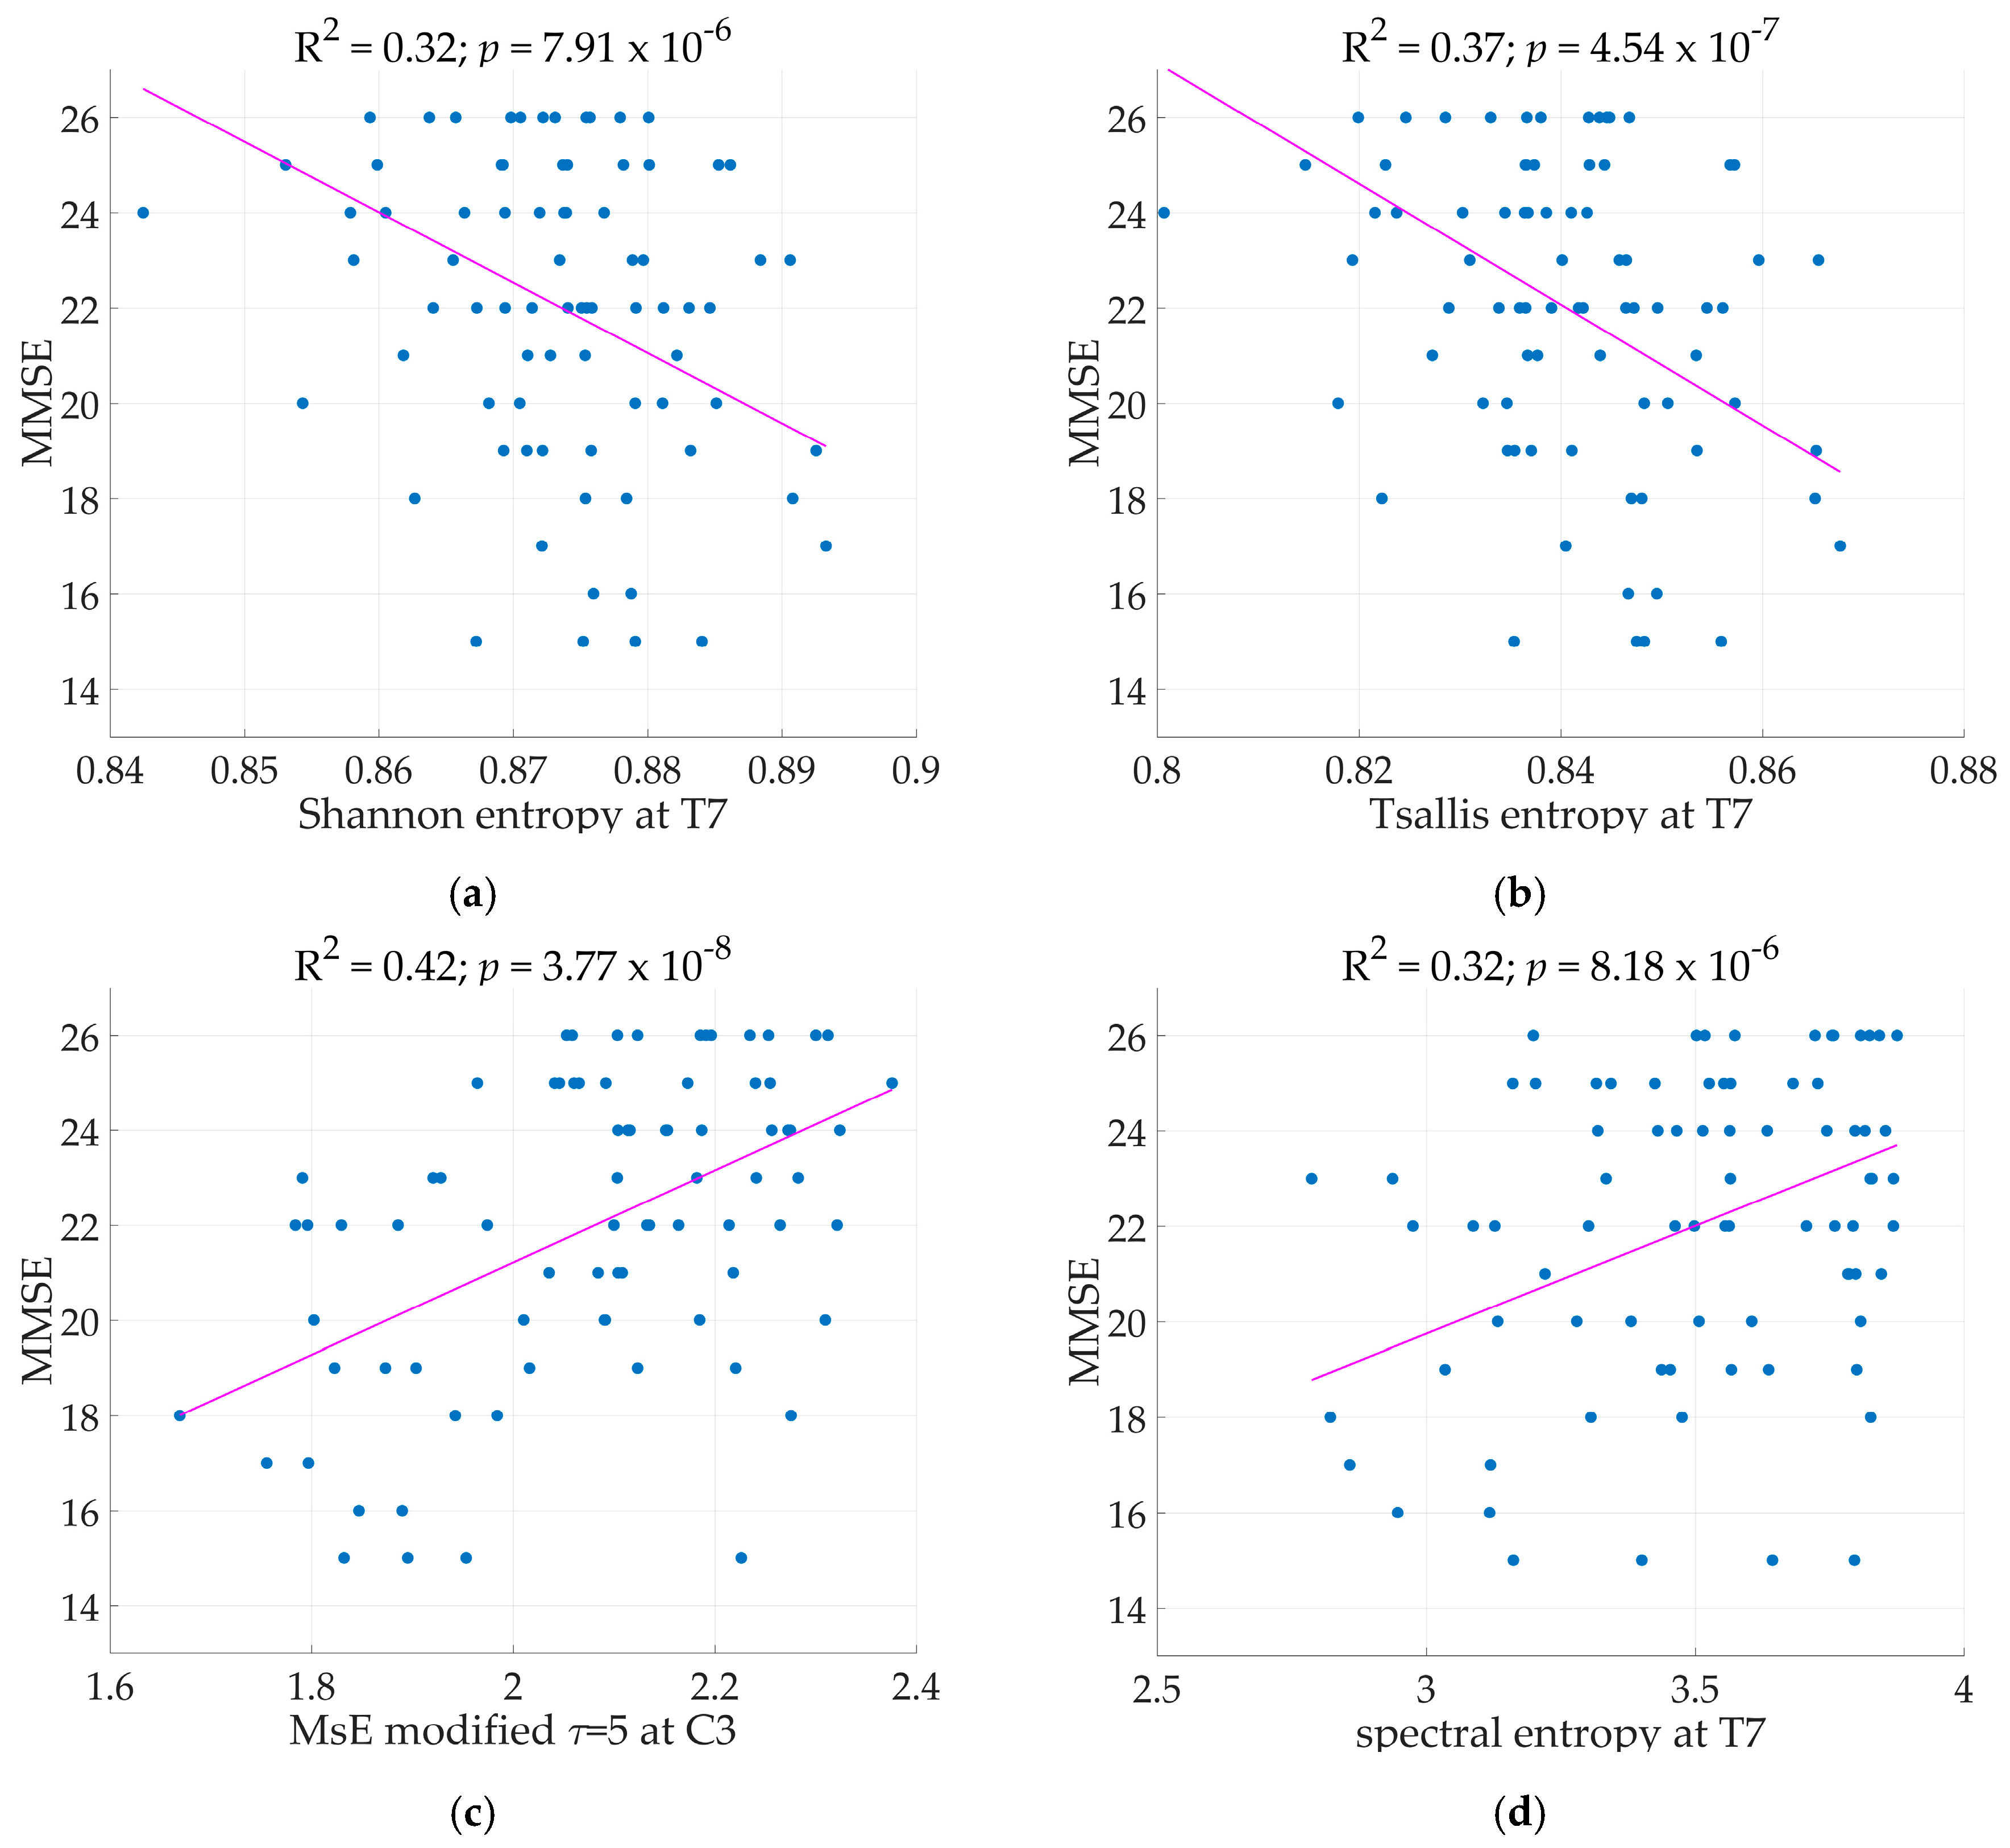
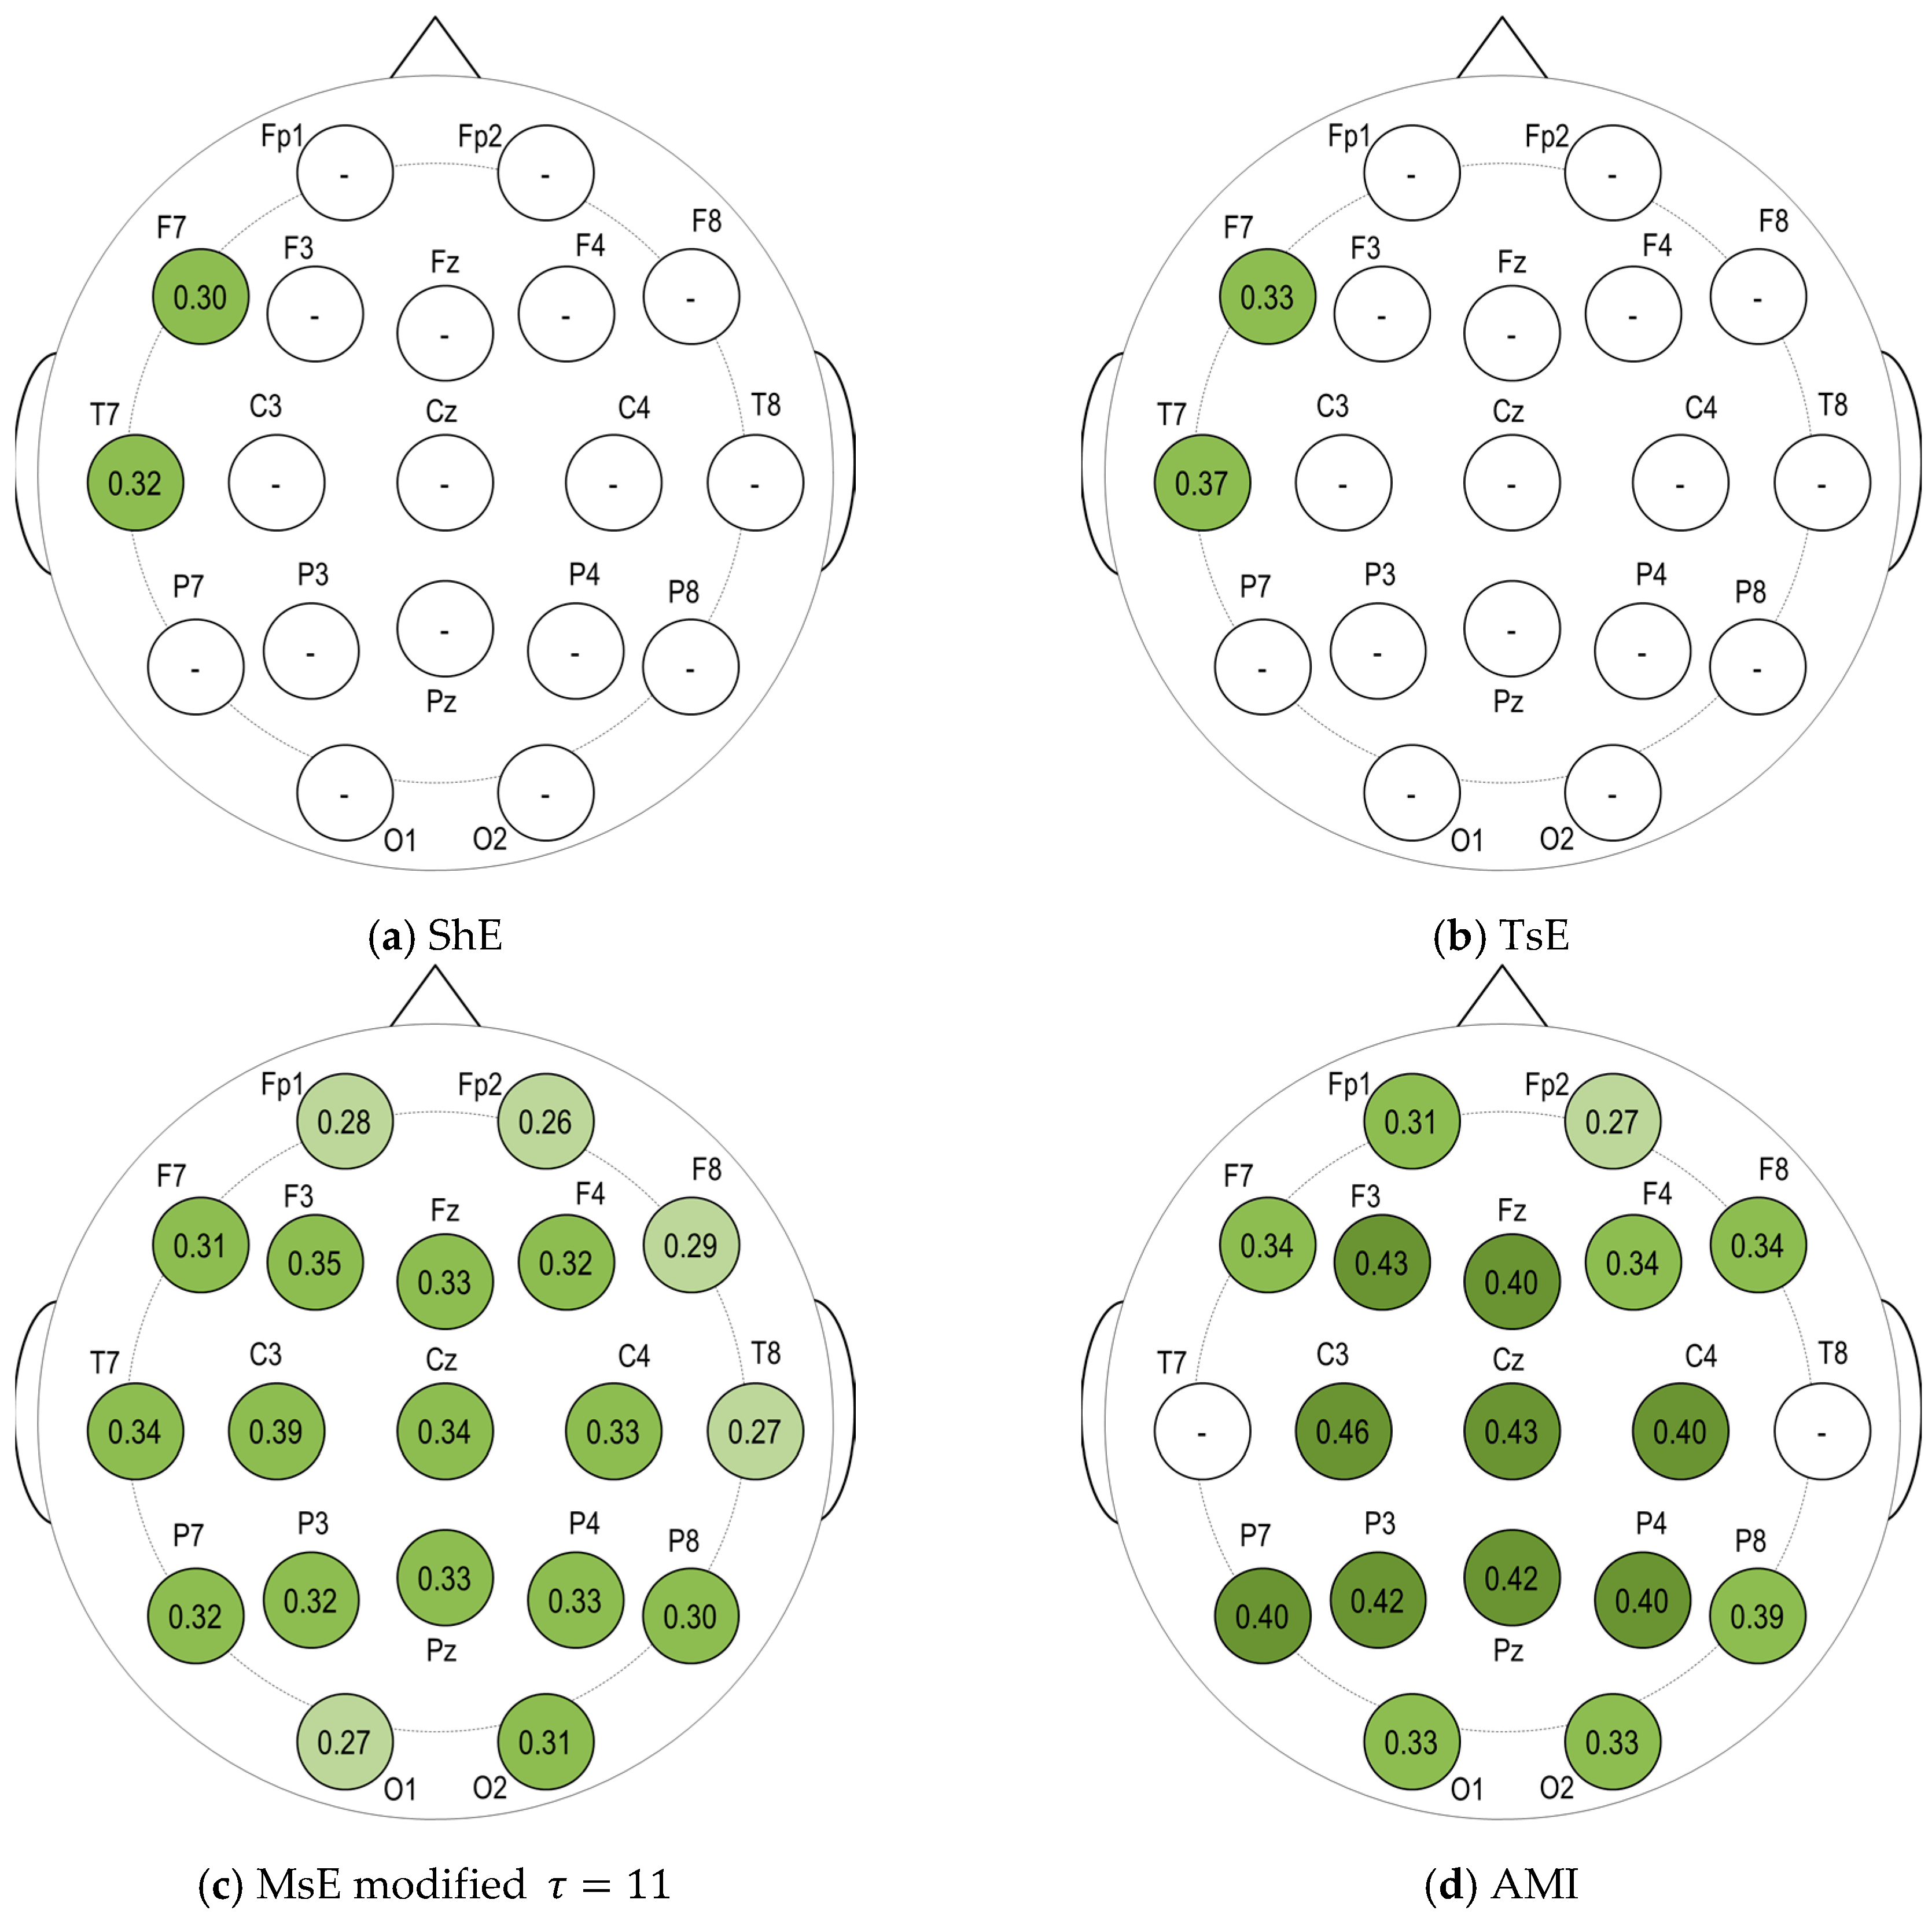
Table 3. MMSE served as the dependent variable while the predictors are the qEEG markers, age, duration of illness, and years of education. The regression models with qEEG markers were expressed in linear and squared terms. All following models mentioned with significant results were tested according to the Holm-Bonferroni method. Two electrode sites resulted in significant linear regression models with ShE as the independent variable at electrodes T7 and F7 where the regression models achieved R
2 as high as 0.32 (See
Figure 2) and 0.30 respectively. With a low variance for the marker ShE, where the highest is at 0.0042, it is evident that the marker remained stable across the calculation for 40 epochs per patient. The marker TsE also has a low variance (highest at 0.0075), indicating stability across the recording. Models with TsE resulted in significant results at two electrode sites, T7 and F7. The regression model performed at electrode T7 achieved R
2 = 0.37 (See
Figure 2) while at electrode F7 the model had R
2 of 0.33. The regression models with SpE as independent variable were significant at electrodes located in the frontal, central, and temporal regions. While regression models at C3, T7, and F3 have R
2 > 0.30, the variance of SpE is higher (reaching up to 0.15) than that of ShE and TsE.
Age, duration of illness and years of education were significant variables for the models in
Table 3 for ShE and TsE. Comparing standardized regression coefficients verified that ShE and TsE for models specified in
Table 3 were the most significant variables. Adding the squared terms of the EEG markers produced quadratic regression models. ShE at T7 with linear and squared terms present in the model does not provide a better model than having only the linear term of ShE in the model. The same was evident for TsE and SpE.
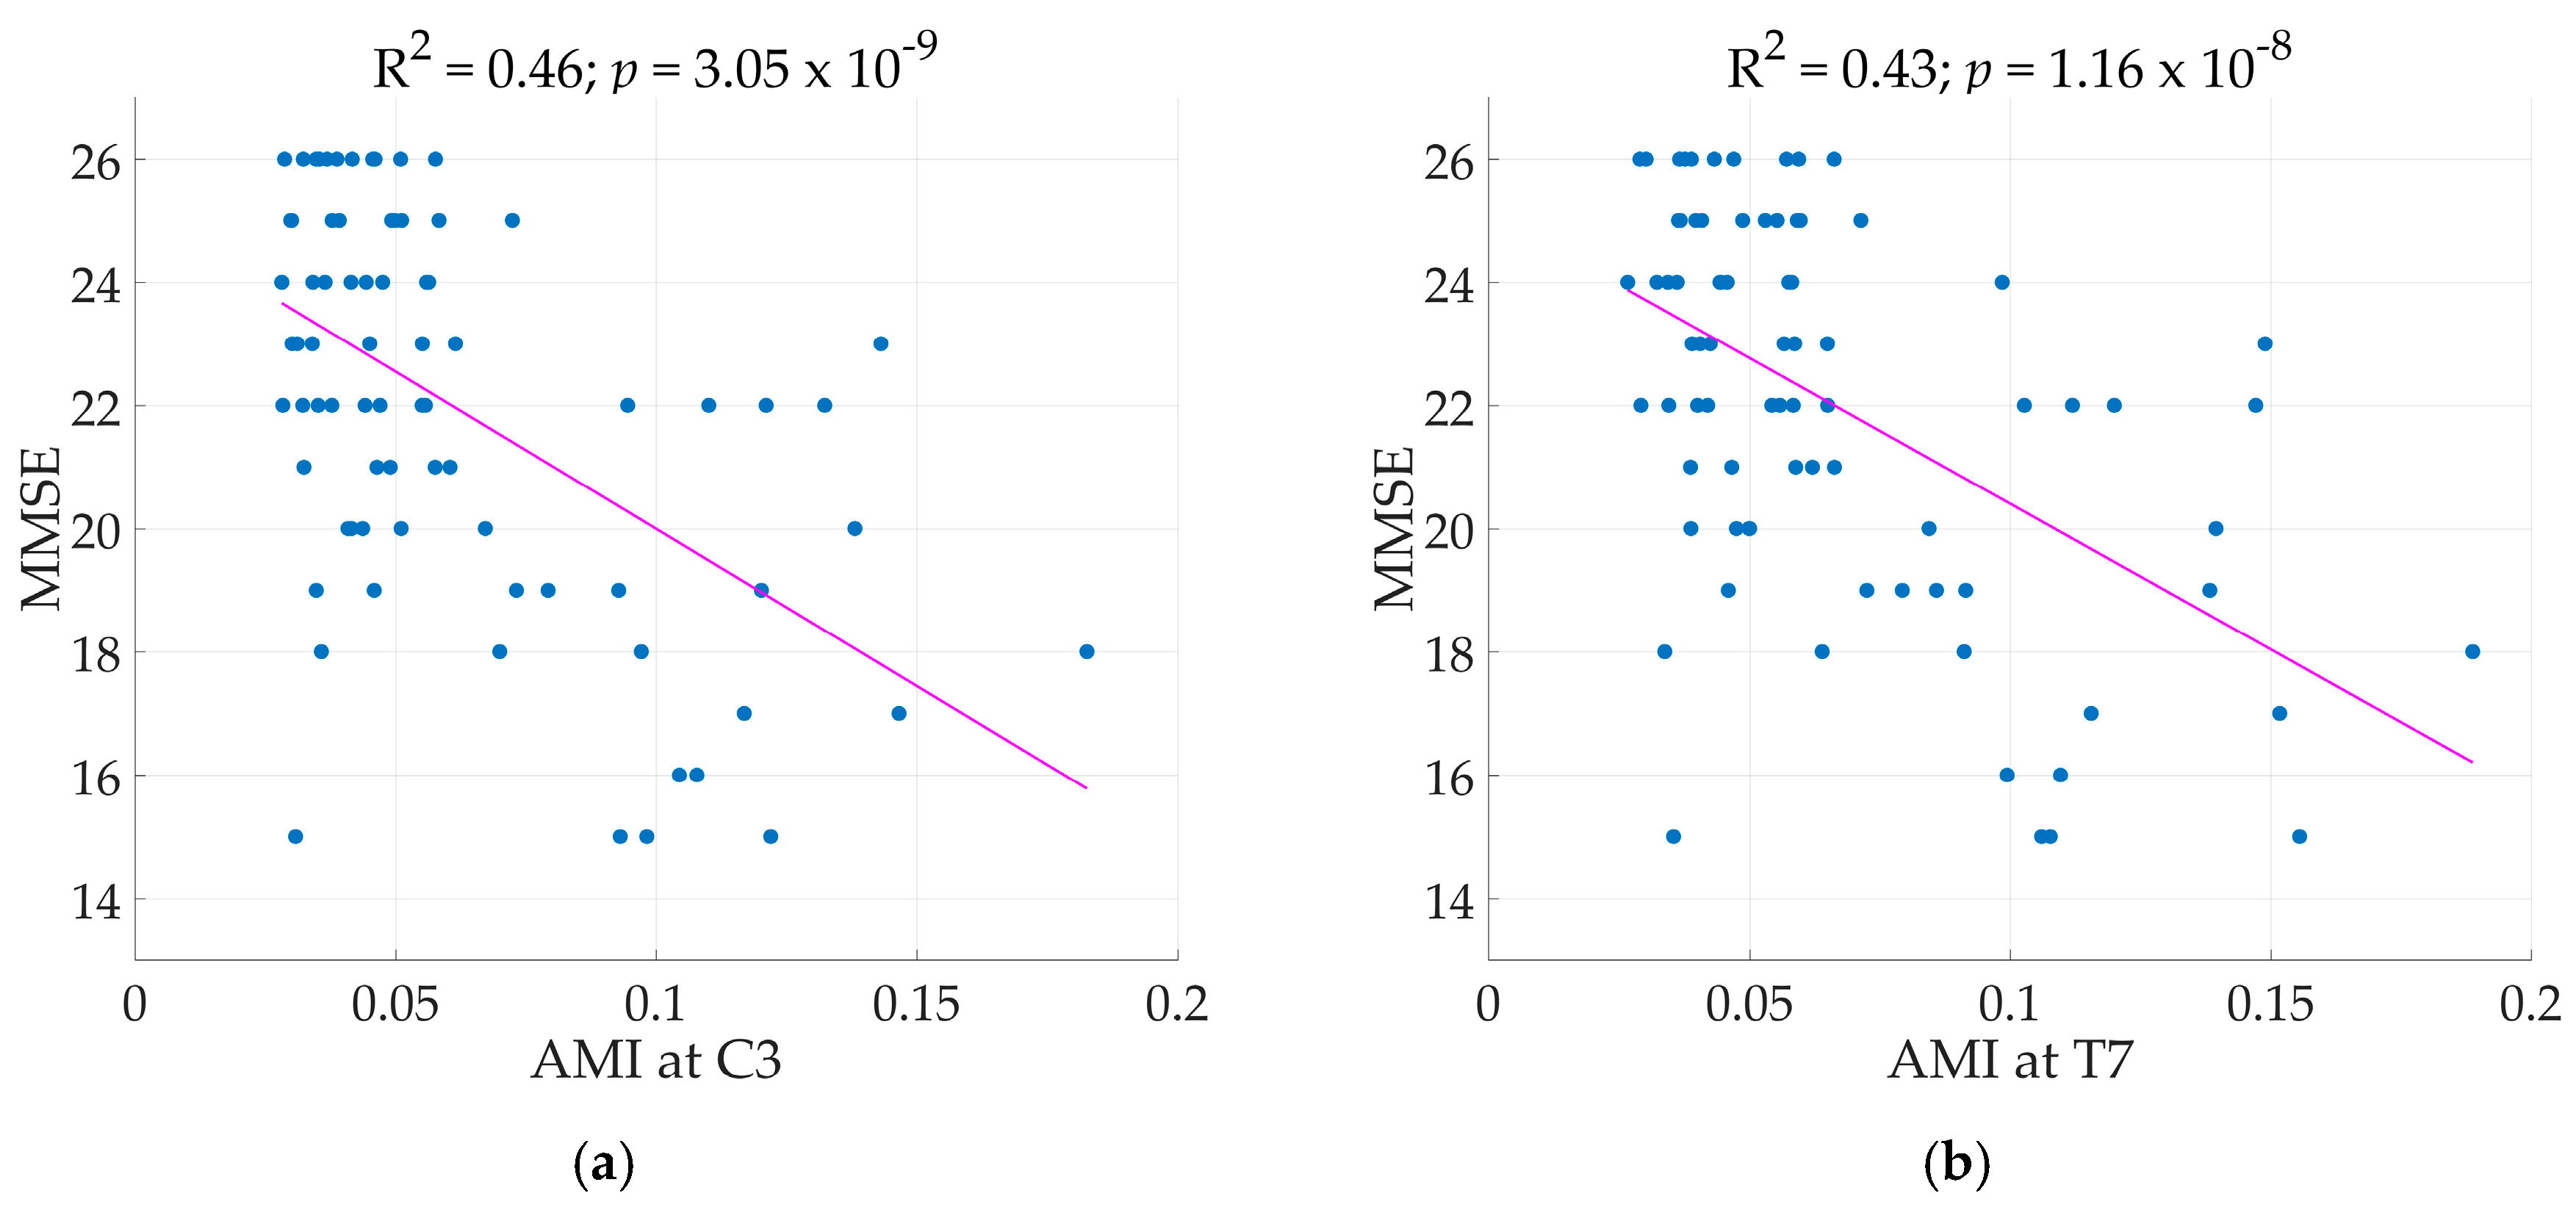
Across the region of the brain, all electrode sites, except T7 and T8, and clusters achieved significant regression models with AMI as the main predictor achieving R
2 as high as 0.46 at electrode C3 (Illustrated in
Figure 3). Next to C3, electrode Cz and F3 achieved R
2 of 0.43 for both. Comparisons of standard regression coefficients showed AMI as the main significant predictor of the models. As expected, adding another term to the regression models increased R
2, in this case the squared term of the qEEG markers. However, adding the squared term of the qEEG markers did not automatically constitute a better model. So was the case for AMI. As seen in
Figure 4, electrodes by the perimeter resulted to lower R
2 than the electrodes situated more centrally.
The drawback in computing MsE at higher scales was evident in
Table 2 where the variance increased dramatically at scale
. The MsE modified proved to be better for all scales used in this study thus MsE modified was the only one to be discussed further. At lower scales, only 12 electrode sites resulted to significant regression models. By
, all electrode sites resulted to significant regression models (
Figure 4). There are electrode sites that did not exhibit significant models at lower scales, particularly at electrode O2 where significant results were only observed starting at scale
, electrode Fp2 at scale
, and electrode O1 at
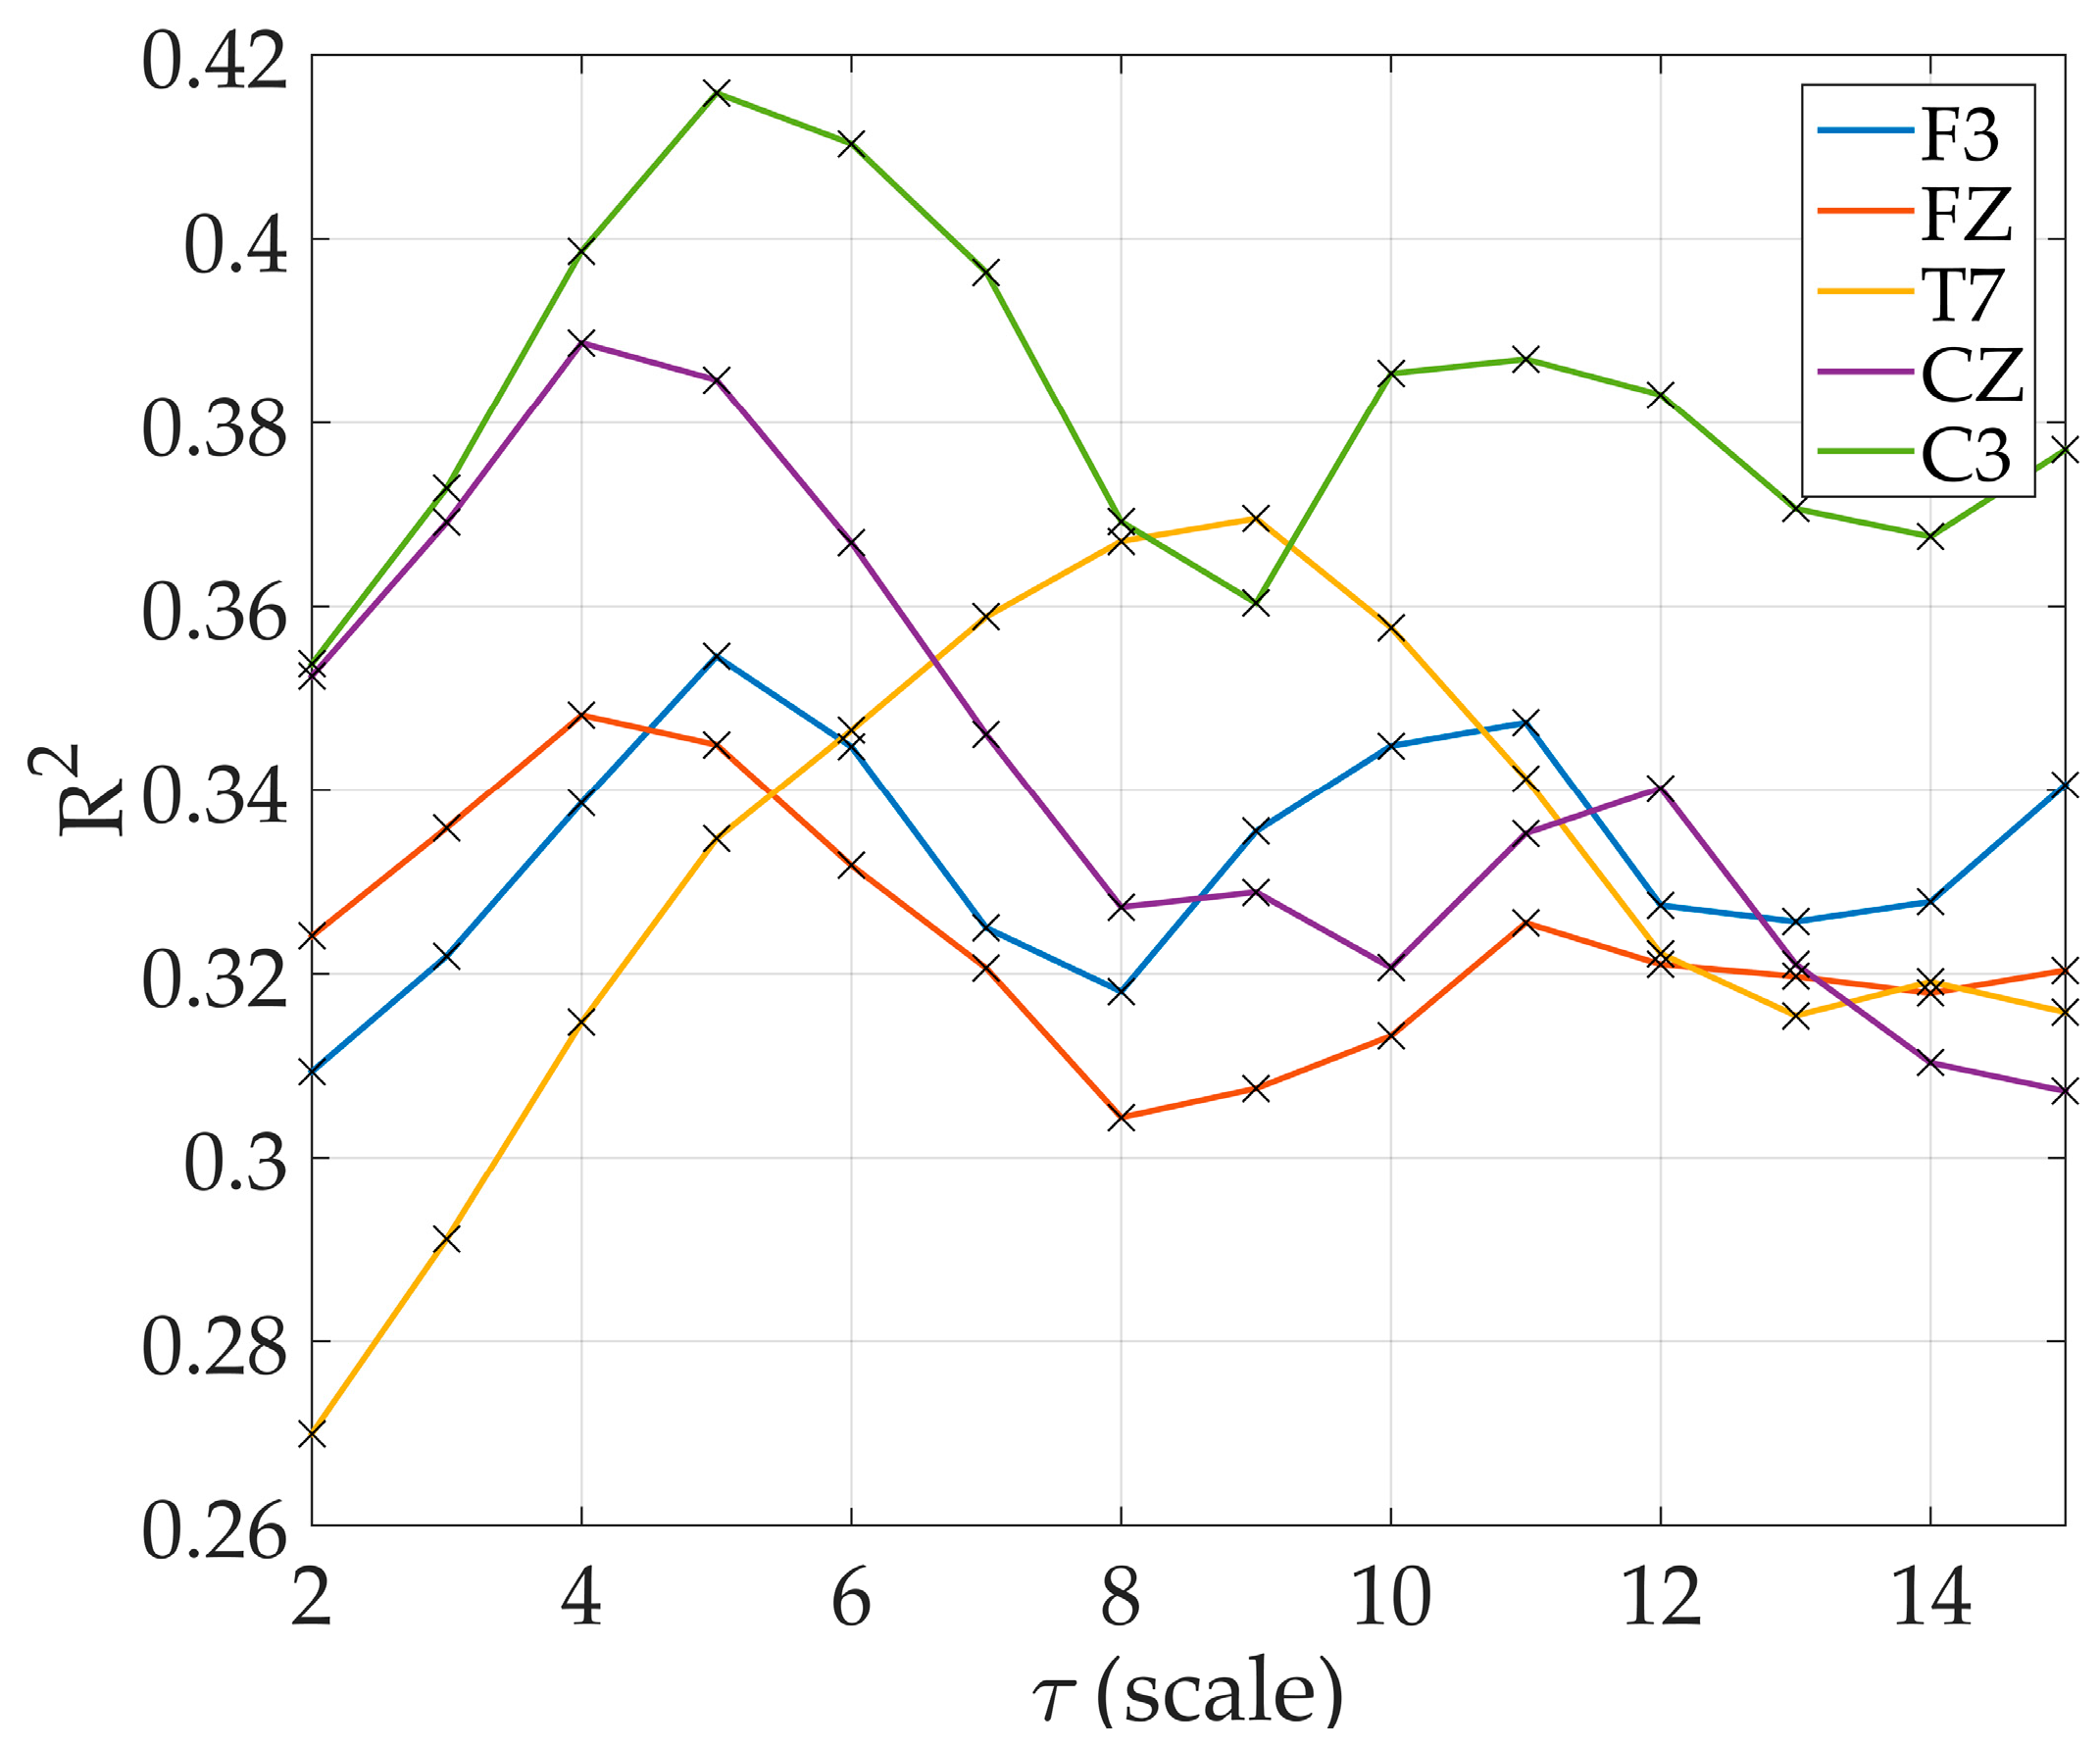
. Increasing R
2 was observed in models starting at scale
at electrode C3 and T7 reaching the maximum R
2 at
and
respectively. R
2 at other electrode sites also increased with increasing scale with varying scale where it reached the maximum (
Figure 5).
In general, adding the squared term of the EEG marker did not produce a better model. Thus, the results of quadratic models were not specified in
Table 2 and
Table 3. The scatterplot figures and regression line shown in
Figure 3 and
Figure 4 describing the relationship of qEEG markers to the MMSE scores based on the regression model. Age, duration of illness, and years of education were set at their mean value shown in
Table 1.
4. Discussion
There were 79 subjects diagnosed with probable AD who participated in this study. EEG recordings were taken while the subjects were sitting in an upright position in a resting state with their eyes closed. MMSE scores and demographic information such as age, duration of illness, and years of education were taken during assessment. The EEG recordings were visually selected before computation of the qEEG markers to remove irregular segments due to detached or loose electrodes. Cardiac and eye activities were automatically removed from the EEG. Forty 4-s epochs were selected from each patient. Calculation of the qEEG marker was derived from the mean value of 40 epochs per patient. The variance over the 40 epochs was computed for each marker to check stability. Linear regression models were calculated with MMSE as the dependent variable and the qEEG marker as the main independent variable. Age, duration of illness, and years of education served as the other independent variables to consider their effect on the MMSE scores. Regression models were computed at every electrode site for all qEEG markers. The significance of model was assessed by the Holm-Bonferroni method.
The results showed that the disease severity of probable AD, quantified by the MMSE scores of mild to moderate, was associated with the nonlinear qEEG markers of entropy and AMI. Regression models predicting MMSE with TsE or ShE as the main predictor variable achieved the highest R
2 at the electrodes T7 and F7, both positioned at the left side of the brain. This can be related to the study done by Ferreira et al. [
28], where temporal lobe entropy was found to be a biomarker for conversion of mild cognitive impairment to AD due to atrophy of the left hippocampus and parahippocampal campus. For models with SpE as the main predictor, significant results were observed at C3 and T7. While a previous study on SpE of EEG signals between AD patients and normal controls did not produce significant differences [
29], our results, however, showed an association with SpE to greater severity in probable AD patients. It’s important to note, however, that the variance for the SpE markers were considerably higher than the other markers considered in this study. A reduction in complexity was seen with higher disease severity in SpE, MsE, and AMI. This loss of complexity was previously investigated in [
9,
10]. Our results showed increased ShE and TsE to greater disease severity. However, this does not automatically refute the common findings of reduced complexity in AD compared to normal controls. Since there were no normal controls in this study, no direct comparison between the AD and normal group was made. MsE modified returned significant regression models at almost all electrode sites of the brain from
where R
2 of 0.42 peaked at
for C3, and at scale
significant regression models across all electrodes were observed.
With AMI as the main predictor variable, though all electrode sites (except for T7 and T8) and clusters in the brain returned significant models, the electrode sites C3, Cz, and F3, as well as the central and left regions of the brain achieved the highest R
2 values (see
Figure 4d). Jeong et al. [
9] saw a correlation with the rate of decrease of AMI in the frontal and temporal regions while our results of models with AMI achieved the highest R
2 in the left and central region particularly at the sites C3, F3, and Cz (
Figure 4d). Furthermore, MMSE also describes the ‘global cognition’ of a patient and as seen in the result, the AMI results across the all regions returned significant regression models. In comparison to the entropy markers where good results are concentrated at only certain electrode sites, AMI appeared to be able to describe the decline in global cognition of probable AD patients as seen in
Table 2 and
Figure 4. In comparison to the study of [
14] where data from 64 patients were included, AMI R
2 remained high even with the addition of 15 patients. The same trend of increasing AMI with decreasing MMSE was also observed implying better predictability or reduced complexity as the disease worsens. With the new results, this paper strengthens the claim for AMI as a potential qEEG marker in the study of AD.
Studies linking disease severity of AD to other markers instead of qEEG markers were carried out such as [
30] where (1) H-NMR spectroscopy resonances in the cerebrospinal fluid were found to be correlated with MMSE scores in AD patients. Benedictus et al. [
31] found that lower cerebral blood flow (CBF) in the posterior brain region could be a marker for the rate of cognitive decline in AD where the decline was measured by the MMSE.
The strong points of our paper are the following: 79 patients with probable AD is the largest study compared to other similar papers [
9,
11,
12,
13,
14,
15] that dealt with complexity markers and AD. Furthermore, previous papers [
9,
11,
12,
13] that studied qEEG markers and AD patients involved comparing AD patients with normal controls or other dementia-related diseases such as MCI while this study focused on qEEG markers and AD patients with varying disease severity. While previous studies investigated SpE and dementia, this is the first time that SpE was analyzed together with disease severity of dementia patients with probable AD diagnosis.
The aim of this study was to investigate the potential of EEG entropy features in the diagnostic support of Alzheimer’s diseases. The regression models with the most significant results based on R
2 were concentrated at the T7 and C3 electrode sites, and it would be interesting to carry out further investigations on this area. The effects of age and education on MMSE were verified by our results as they, as well as the duration of illness, were significant co-predictors in the regression models. AMI proved to be most closely related to disease severity, ranging from mild to moderate MMSE scores based on the 79 patients, explaining up to 46% of the variation in the data. As seen in
Figure 3, AMI increases with the decreasing MMSE. Given that higher AMI denotes better predictably, this suggests that less information processing and content is available in the EEG signal as the cognitive level of and probable AD patient declines. Next to AMI, MsE modified proved to be related to disease severity, explaining up to 42% of the variation in the data at scale
at C3. Therefore, we conclude that these quantitative EEG markers, AMI and MsE modified, should be investigated further in longitudinal studies to determine whether it can also aid in predicting AD progression.


 ,
, 

