Article

Use of Mutual Information and Transfer Entropy to Assess Interaction between Parasympathetic and Sympathetic Activities of Nervous System from HRV

1
Department of Biomedical Engineering, School of Engineering, Sun Yat-sen University, Guangzhou 510275, China
2
Key Laboratory of Sensing Technology and Biomedical Instrument of Guangdong Province, School of Engineering, Sun Yat-sen University, Guangzhou 510275, China
3
Guangdong Provincial Engineering and Technology Centre of Advanced and PorTable Medical Device, Guangzhou 510275, China
*
Authors to whom correspondence should be addressed.
Entropy 2017, 19(9), 489; https://doi.org/10.3390/e19090489
Submission received: 17 July 2017 / Revised: 9 September 2017 / Accepted: 11 September 2017 / Published: 13 September 2017
(This article belongs to the Special Issue Transfer Entropy II)

Abstract

:
Obstructive sleep apnea (OSA) is a common sleep disorder that often associates with reduced heart rate variability (HRV) indicating autonomic dysfunction. HRV is mainly composed of high frequency components attributed to parasympathetic activity and low frequency components attributed to sympathetic activity. Although, time domain and frequency domain features of HRV have been used to sleep studies, the complex interaction between nonlinear independent frequency components with OSA is less known. This study included 30 electrocardiogram recordings (20 OSA patient recording and 10 healthy subjects) with apnea or normal label in 1-min segment. All segments were divided into three groups: N-N group (normal segments of normal subjects), P-N group (normal segments of OSA subjects) and P-OSA group (apnea segments of OSA subjects). Frequency domain indices and interaction indices were extracted from segmented RR intervals. Frequency domain indices included nuLF, nuHF, and LF/HF ratio; interaction indices included mutual information (MI) and transfer entropy (TE (H→L) and TE (L→H)). Our results demonstrated that LF/HF ratio was significant higher in P-OSA group than N-N group and P-N group. MI was significantly larger in P-OSA group than P-N group. TE (H→L) and TE (L→H) showed a significant decrease in P-OSA group, compared to P-N group and N-N group. TE (H→L) were significantly negative correlation with LF/HF ratio in P-N group (r = −0.789, p = 0.000) and P-OSA group (r = −0.661, p = 0.002). Our results indicated that MI and TE is powerful tools to evaluate sympathovagal modulation in OSA. Moreover, sympathovagal modulation is more imbalance in OSA patients while suffering from apnea event compared to free event.

1. Introduction

Obstructive sleep apnea (OSA) is a common sleep disorder characterized by the repeated, temporary cessation or reduction of airflow [1] and has been linked with an increased risk of cardiovascular events and morbidity [2,3,4]. The diagnosis of OSA requires apnea-hypopnea index (AHI) which is defined as the number of apnea and hypopnea events per hour.
Autonomic nervous dysfunction has been reported to be exhibited with OSA patents at night [5]. In 1996, Camm demonstrated the heart rate variability (HRV) analysis was useful tool to study of the autonomic nervous system (ANS) [6]. Traditionally, HRV can be measured by three domains: time domain, frequency domain and nonlinear analysis. Frequency domain method which is analyzed by studying the power spectral density is mainly composed of two components: the low frequency band (LF) with the range from 0.04 Hz to 0.15 Hz; and the high frequency band (HF) with the range from 0.15 Hz to 0.4 Hz [7]. The HF is an indicator for parasympathetic activity while the LF evaluates sympathetic activity [8]. Furthermore, the LF/HF ratio serves as an index of sympathovagal balance [9,10]. More recently, nonlinear measurement of HRV has been found to be more sensitive in reflecting fluctuation of the complexity of ANS compared to other methods [11,12]. For example, Haitham et al. reported that the normal subjects have significantly more complex HRV pattern than the OSA subjects by using sample entropy [12].
Most of HRV studies are focused on the changes of features which reflect sympathetic and parasympathetic activity of ANS [13,14,15]. Gong et al. [16] used 25 OSA patients and 27 normal participants and found that the LF/HF and normalized LF (nuLF) were significantly associated with the value of AHI. Gula et al. [9] and Park et al. [17] demonstrated that patients with more severe OSA exhibited a higher LF/HF which represents the balance between the sympathetic and parasympathetic systems. The experiment by Pan et al. [5] was performed on 10 mild OSA patients, 24 moderate OSA patients, 45 severe OSA patients, and 10 normal participants. They found a reduction in sample entropy (SampEn) with an increase in severity of OSA and multiscale entropy index into small scale (MEIss) of normal subjects and mild OSA patients were significantly higher than that of moderate OSA and severe OSA patients. However, few studies investigate the interaction between sympathetic and parasympathetic activity [18,19,20]. There is no study that propose useful tool to evaluate interaction between sympathetic and parasympathetic activity.
Mutual information (MI) and transfer entropy (TE) have been recognized as powerful tools to detect causality between two variables [21,22]. MI quantifies the amount of information that can be obtained about a random variable through another one [23]. TE quantifies the amount of information transfer from one variable to the other [24]. Moreover, MI and TE have an advantage in calculation because they are model-free approaches. Thus, they are sensitive to all types of dynamical interactions. For example, Melia et al. used MI to quantify coupling between different zones of scalp and found that coupling between occipital and frontal zones was stronger when sleep disorder breathing patients with excessive daytime sleepiness [21]. Faes et al. used TE to study interaction of cardio-vascular (CV), cardio-pulmonary (CP), and vascular-pulmonary (VP) and suggested that TE successfully described CV, CP, and VP interaction [25]. Montalto et al. found a substantial increase of the TE from systolic arterial pressure to inter-beat interval when moving from supine to upright [22]. In this context, we intent to access the interaction between sympathetic and parasympathetic activity using MI and TE, which could give an insight into sympathovagal modulation.
In this work, we aimed to explore the transferred information between the sympathetic and parasympathetic systems by analyzing MI and TE from HRV. First, the significance of TE is validated on simulations reproducing interaction between two time series. Then, frequency domain indices of HRV were extracted to analyze the fluctuation of ANS. Next, RRI were divided to two parts: the low frequency band of RRI and the high frequency band of RRI. Finally, MI and TE were extracted from two parts of RRI to study the interaction between the sympathetic and parasympathetic systems. To achieve this goal, the segments were categorized into three groups according to two conditions: (1) whether the subject is OSA patient or not; (2) whether segment has apnea or not.

2. Methods

2.1. Datasets

The open database of Physionet website used in the present study consisted of 35 electrocardiogram (ECG) recording obtained from 35 subjects [12]. Their average age was 46 ± 10 years (mean ± standard deviation) with body mass index (BMI) between 19.2 and 41.67 kg·m2. These ECG data were from complete night polysomnography (PSG) recordings with a sampling rate of 100 Hz. The mean time of recording is eight hours. Each ECG recording includes a set of apnea annotations (each minute labeled with apnea or normal by sleep experts). The subjects of the Physionet database were classified into three classes by sleep experts: Apnea (A), Borderline (B) and Control or Normal (C). Class A, B and C consisted of 20, 5 and 10 subjects, respectively. Class A contained at least 100 min of disordered respiration and all recordings in this class had an AHI above 15 events per hour. Class B contained between 5 and 99 min with disordered breathing and all recordings in this class had an AHI above 5 events per hour. Class C contained fewer than 5 min with disordered breathing and all recordings in this class had an AHI less than 5.

2.2. RR Intervals Preprocessing

In present study, we included 20 subjects from class A and 10 subjects from class C. The missing recordings in the beginning and end of ECG were abandoned. Each ECG signal was divided in 1 min segment corresponding to label. There were a total of 13,993 min. Then, The RRI measure the duration of heartbeat cycles, which are obtained by measuring the intervals between the successive R peaks of ECG [1]. The R peaks were detected from the ECG signals using the algorithm proposed by Pan and Tompkins [26]. An adaptive filter algorithm was used to filter RRI time series for replacing and interpolating ventricular premature beats and artifacts [27,28].
A subject with the value of AHI > 5 is generally diagnosed as an OSA patient. 20 subjects from class A were OSA patients, and 10 subjects from class C were healthy subjects. Due to label (apnea or normal) of 1-min segments, the segments were categorized into three groups: N-N group, P-N group and P-OSA group. N-N group contained all normal segments of 10 normal subjects; P-N group contained all normal segments of 20 OSA patients; P-OSA group contained all apnea segments of 20 OSA patients. The number of N-N group, P-N group and P-OSA group were 4367, 3374 and 6252, respectively.
In calculation of TE, the sample size of signal is generally around 200–600 points [22,24,25,29]. In order to avoid the effect of length on features, the processed RRI were resample at 8.3 Hz (length = 500 points) by using cubic interpolation. Firstly, Fast Fourier Transformation (FFT) was performed on RRI sequence to estimate power spectral density. The length n of FFT was set as 512 points. Then, the LF components (0.15–0.4 Hz) of RRI were obtained by multiplying by rectangular window. Finally, the time signals without HF components (RRL) were obtain by using inverse Fast Fourier Transform (IFFT). The time signals without LF components (RRH) were obtain by the same method.

2.3. Frequency Domain and Interaction Analysis of HRV

2.3.1. Frequency Domain Features

The power spectral density of HRV were estimated by using FFT. The very low frequency band (VLF) with the range from 0.0033 Hz to 0.045 Hz. The power was calculated in VLF, LF and HF range [30,31].
  • LF power in normalized units (nuLF) was calculated by the power in LF in proportion to total power minus the power in VLF. The formula is as follows [32]:
    n u L F = t h e   p o w e r   i n   L F / ( t o t a l   p o w e r V L F ) × 100
  • HF power in normalized units (nuHF) was calculated by the power in HF in proportion to total power minus the power in VLF. The formula is as follows [32]:
    n u H F = t h e   p o w e r   i n   H F / ( t o t a l   p o w e r V L F ) × 100
  • LF/HF ratio was calculated by the power in LF in proportion to the power in HF. The formula is as follows [32]:
    L F / H F   r a t i o = t h e   p o w e r   i n   L F / H F

2.3.2. Interaction Features

The interaction features include mutual information (MI) and transfer entropy (TE).
  • MI was calculated to estimate the share information between parasympathetic and sympathetic of the autonomic nervous system. The formula is as follows [33]:
    For two X = { x ( i ) , i = 1 , , N } and Y = { y ( j ) , j = 1 , , N } , where N is the length of time series.
    M I = i N i N p ( x ( i ) , y ( j ) ) log p ( x ( i ) , y ( j ) ) p ( x ( i ) ) p ( y ( j ) )
    Time series X and Y were replaced by time series RRL and RRH, respectively. Then, Equation (4) can be expressed as follows
    M I = i = 1 N j = 1 N p ( R R L ( i ) , R R H ( j ) ) log p ( R R L ( i ) , R R H ( j ) ) p ( R R L ( i ) ) p ( R R H ( j ) )
    where RRL is the time signal without HF components, and RRH is the time signal without LF components. N is the length of the time signal, i and j are progressive counter. p ( R R L ( i ) , R R H ( j ) ) is the join probability distribution of RRL and RRH. p ( R R L ( i ) ) and p ( R R H ( j ) ) are the marginal probability distributions of RRL and RRH. If RRL and RRH are independent, then MI = 0. It is noteworthy that MI is symmetric under the information transformed between RRL and RRH. Therefore, it does not contain any directional information.
  • TE was calculated to quantify coupling strength and directional information between parasympathetic and sympathetic of the autonomic nervous system. The formula is as follows [24]:
    T E R R H R R L = R R L ( i ) , R R L ( i 1 ) , R R H ( i 1 ) p ( R R L ( i ) , R R L ( i 1 ) , R R H ( i 1 ) ) log p ( R R L ( i ) / R R L ( i 1 ) , R R H ( i 1 ) ) p ( R R L ( i ) / R R L ( i 1 ) )
    where p ( R R L ( i ) , R R L ( i 1 ) , R R H ( i 1 ) ) is the joint probabilities of RRL(i), RRI(i1) and RRH(i1). The classic approach of fixed bins is used to estimate the probability in Equation (6), which is to allocate data points to fixed, equally-spaced bins. The following step is to rearrange the time signal RRL and RRH by ranging from smallest value to largest value of them, obtaining X = { x 1 , x 2 , , x N } and X = { x 1 , x 2 , , x N } . Then, Equation (6) can be expressed as follows [24]:
    T E R R H R R L = x i , x i 1 , y i 1 p ( x i , x i 1 , y i 1 ) log p ( x i , x i 1 , y i 1 ) p ( x i 1 ) p ( x i 1 , y i 1 ) p ( x i , x i 1 )
    Using fixed bins, Equation (7) can be expressed as follows:
    T E R R H R R L = a = 1 , b = 1 , c = 1 Q m a , b , c P log m a , b , c m b m a , b m b , c
    where Q is the unified number of bin. a, b and c represent the index of bins along the along the x i , x i 1 and y i 1   respectively, P is the total number of triplets of x i , x i 1 and y i 1 . m a , b , c m a , b and m b , c are the number of data points in the intersection of the one-dimensional bins indexed by their subscript, and the number of data points in bth bin in the x i 1 dimension denoted by m b .

2.4. Simulated Data

The significance of TE is tested by surrogate data. Two processes X and Y are constructed according to the equations [22]:
x n = 1 β x n 1 2 + d u n y n = ( 1 C 1 ) ( 1 β y n 1 ) + C 1 ( 1 β x n 1 2 ) + d u n
where u n is independent white noises with zero mean and variance σ 2 = 1 ; the parameter design in Equation (9) is chosen to simulate the rhythms of RRL and RRH. The oscillation of processes X and Y are set to mimic the frequency band of RRL and RRH, respectively, f x [ 0.04 , 0.15 ] Hz and f y [ 0.15 , 0.4 ] Hz. C 1 is the coupling strength according to X is influencing Y; β = 1.8, d = 0.03. The stochastic processes X is driver system, and Y is target system. The interaction between X and Y is defined by the Equation (9).

2.5. Statistical Analysis

To validate the results obtained from each of the previous analysis, a statistical study is conducted to verify if significant differences are present among the different groups. The results are expressed as mean ± standard deviation (SD), and all data are analyzed using the statistical software SPSS 14.0 (SPSS Inc., Chicago, IL, USA). We use a two tailed Sparman’s correlation analysis to explore the linear relationship between the HRV indices and interaction indices. A p values less than 0.05 is considered significant for all tests.

3. Results

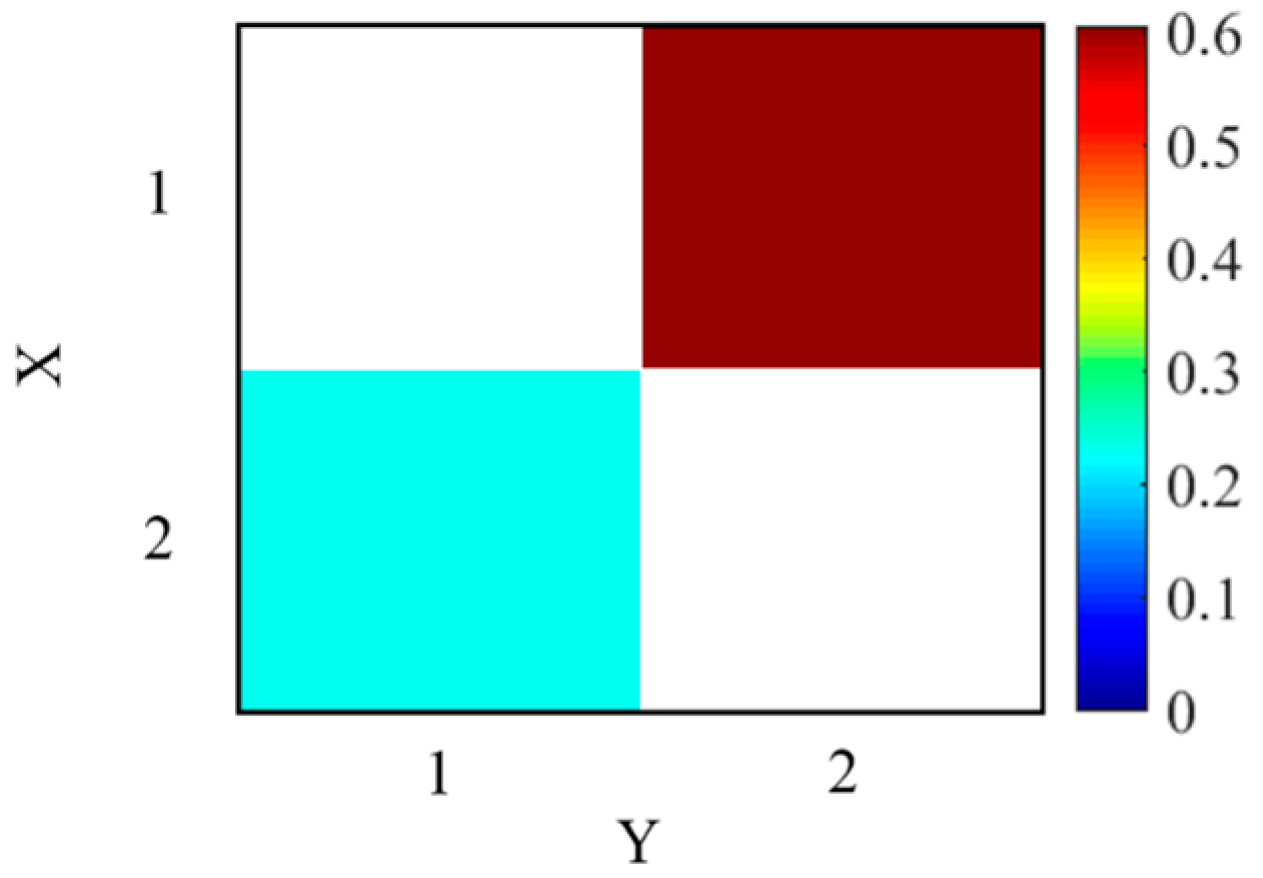
3.1. Simulated Experiment

We generated 100 realizations of Equation (9), length of n = 512 points. From simulated data, there was information transfer from processes X (driver system) to Y (target system), but there was less information transfer from processes Y to X. For each realization, TE were computed according to Equation (7), the lag time was set at 1, the number of bin was set at Q = 8. As shown in Figure 1, average TE matrix was showed in color map to indicate the causality between processes X and Y. The average TE of X→Y is much higher than the average TE of Y→X. It indicated that the TE detected correctly the information transfer X→Y, and it was reasonable to set the parameters of TE in this study. Moreover, Figure 2 shows how the both directional TE performed when lag time was varied from 1 to 10 in simulated experiment. With the increase of lag time, TE (X→Y) kept close to 0.63 and TE (X→Y) kept close to 0.31. Moreover, there were extremely significant differences between TE (X→Y) and TE (X→Y) (p < 0.001) with the increase of lag time (1 to 10). It indicated that the influence of lag time on TE was tiny for RRI and the parameter of lag time = 1 was suitable for the simulated experiment.

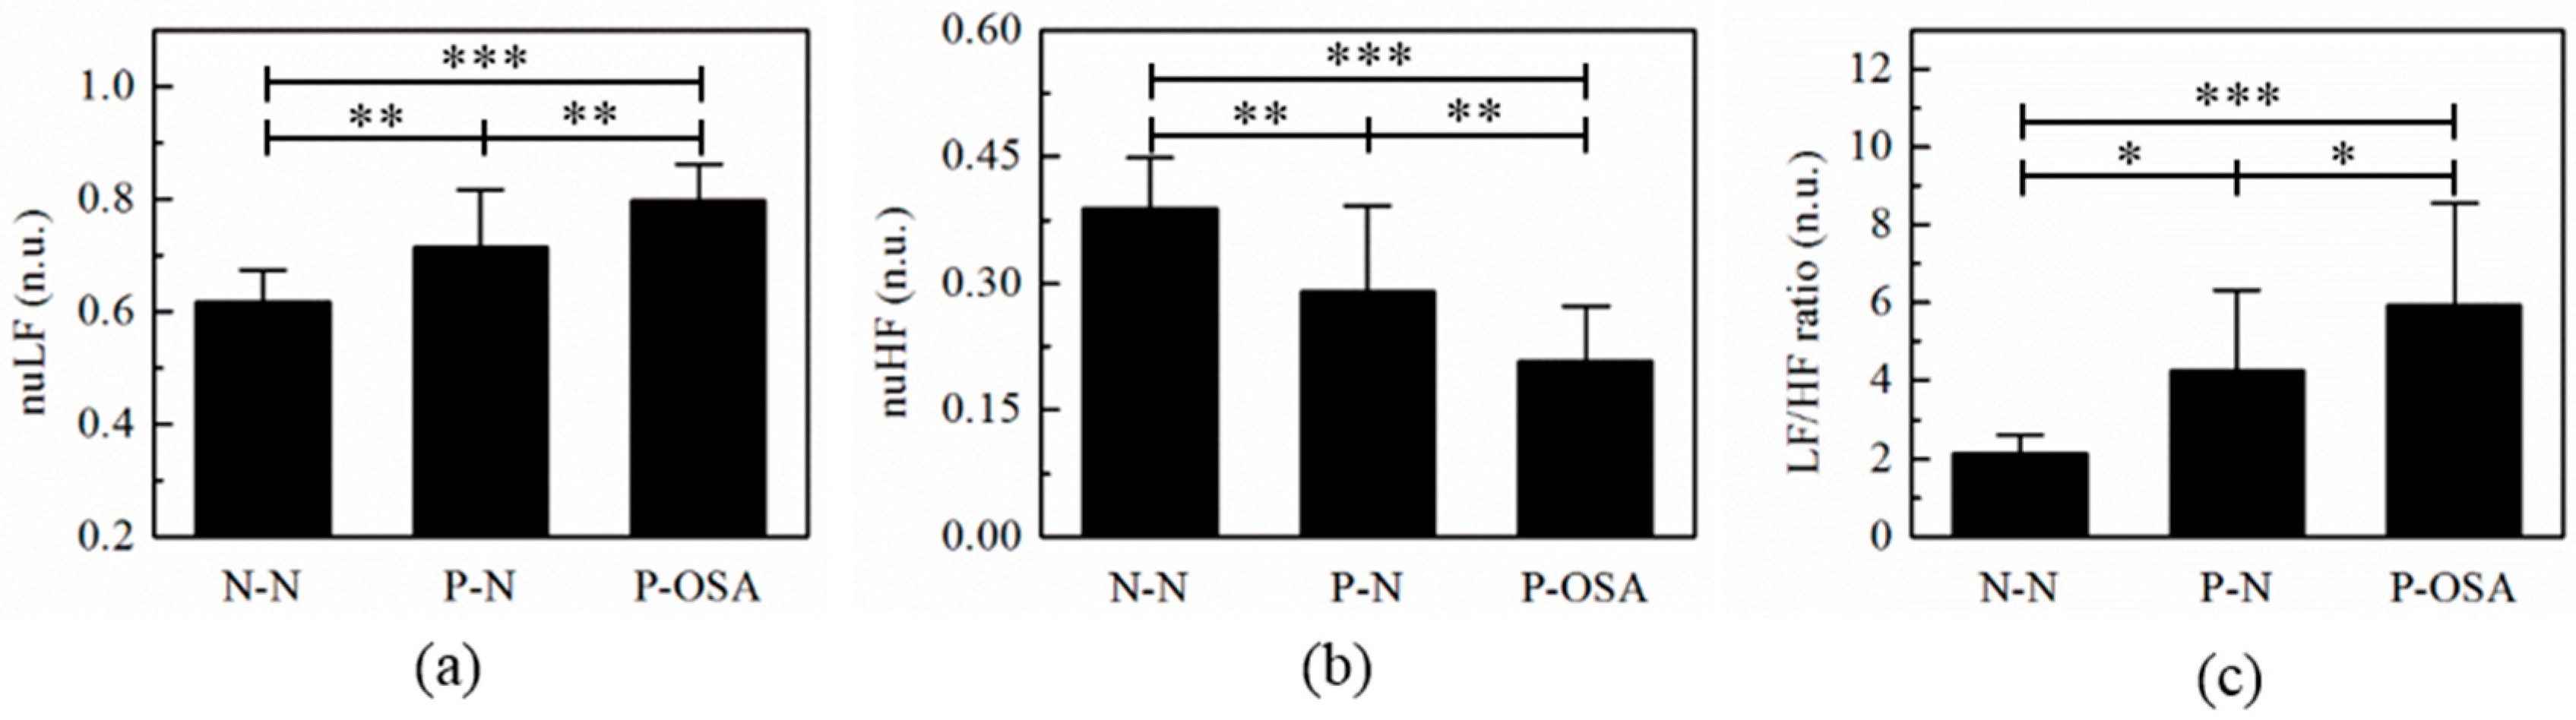
3.2. The Frequency Domain Features Analysis

The nuLF is an indicator for sympathetic activity, while the nuHF represents parasympathetic activity. the ratio of LF/HF reflects the balance of global autonomic nervous system. Figure 3 shows the results of post hoc analysis to nuLF, nuHF, and LF/HF ratio. Figure 3a shows the value of nuLF in N-N, P-N, P-OSA groups. Results demonstrated that the value of nuLF was highest in P-OSA group, and the value of nuLF was lowest in N-N group. Besides, the value of nuLF increased from N-N group to P-N group and a further rise was seen in P-OSA group. Post hoc analysis indicated that the value of nuLF was significantly higher in P-OSA group than in N-N group (p < 0.001) and P-N group (p < 0.001). In addition, the value of nuLF was significant higher in P-N group than in N-N group (p < 0.01).
The mean and standard error of nuHF were showed in Figure 3b. The value of nuHF was lowest in P-OSA group, and value of nuHF was highest in N-N group. The value of nuLF decreased from N-N group to P-N group and a further reduction was seen in P-OSA group. Post hoc analysis demonstrated that the value of nuHF was significantly lower in P-OSA group than in N-N group (p < 0.001) and P-N group (p < 0.001). The value of nuHF was significant lower in P-N group than in N-N group (p < 0.01).
As shown in Figure 3c, there was an increase trend in LF/HF ratio. The value of LF/HF ratio was highest in P-OSA group, and was lowest in N-N group. Besides, the value of LF/HF ratio increased from N-N group to P-N group and a further rise was seen in P-OSA group. Post hoc analysis indicated that the value of LF/HF ratio was significantly higher in P-OSA group than in N-N group (p < 0.001) and P-N group (p < 0.05). The value of LF/HF ratio was significantly higher in P-N group than in N-N group (p < 0.05). The results demonstrated that the balance between sympathetic and parasympathetic was highest in P-OSA group and lowest in N-N.

3.3. The Interaction Features Analysis

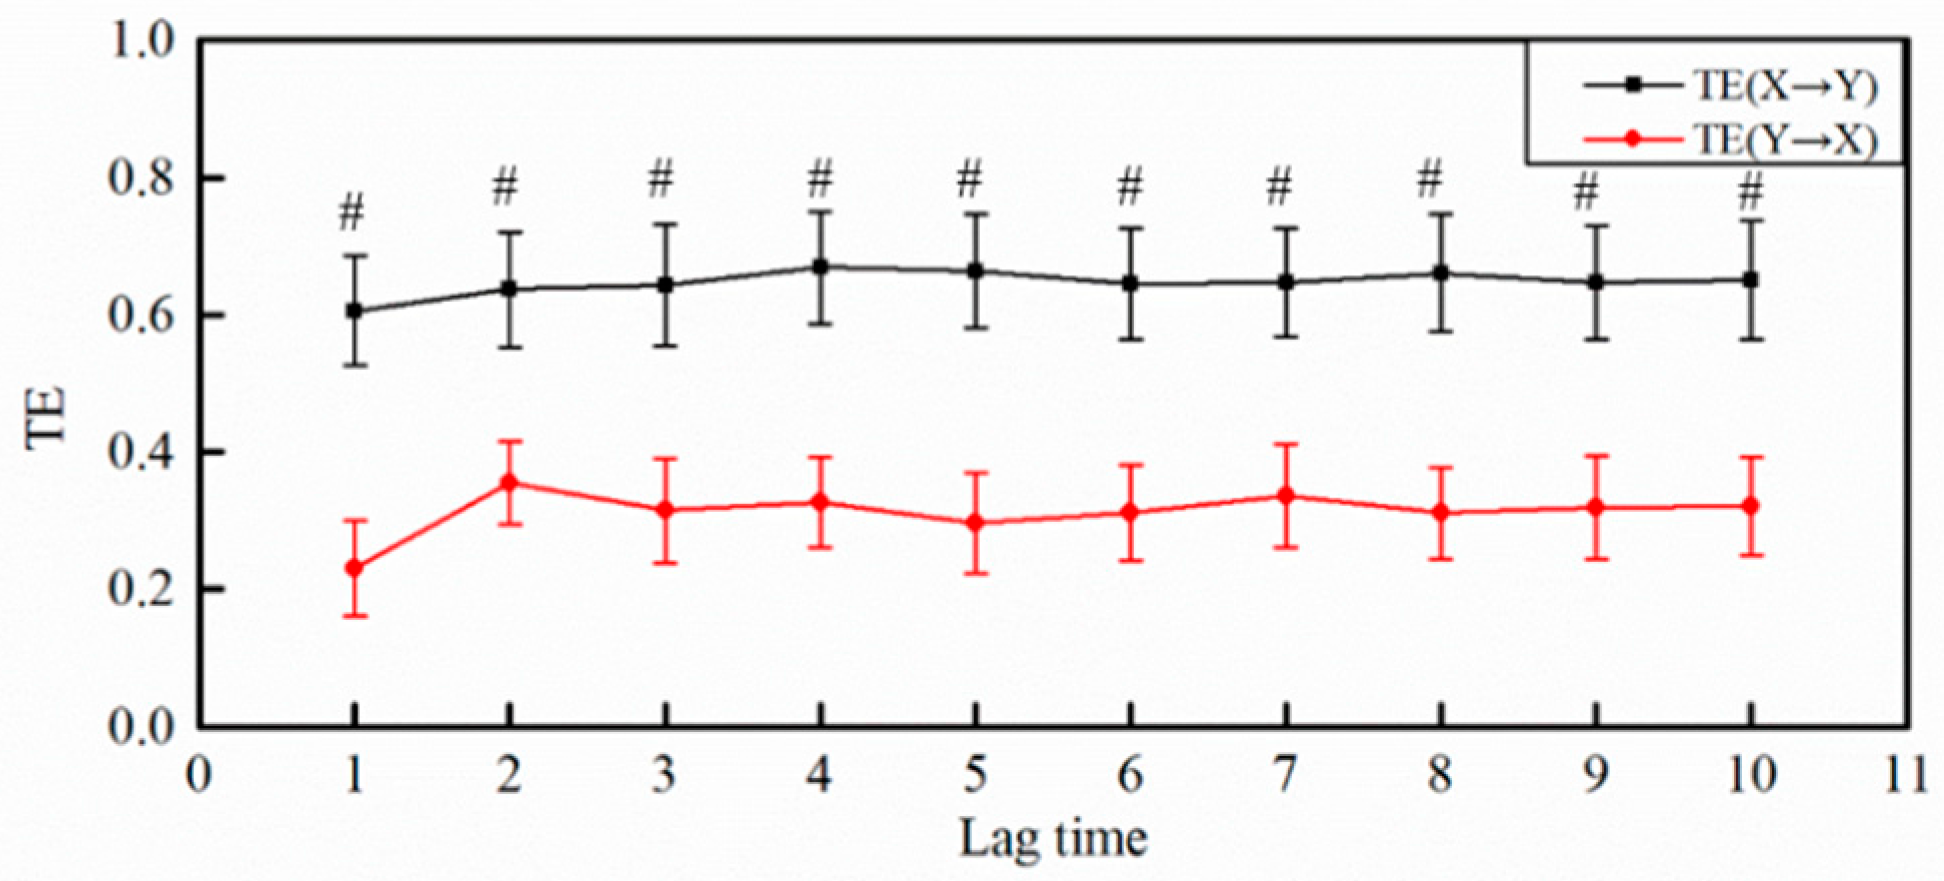
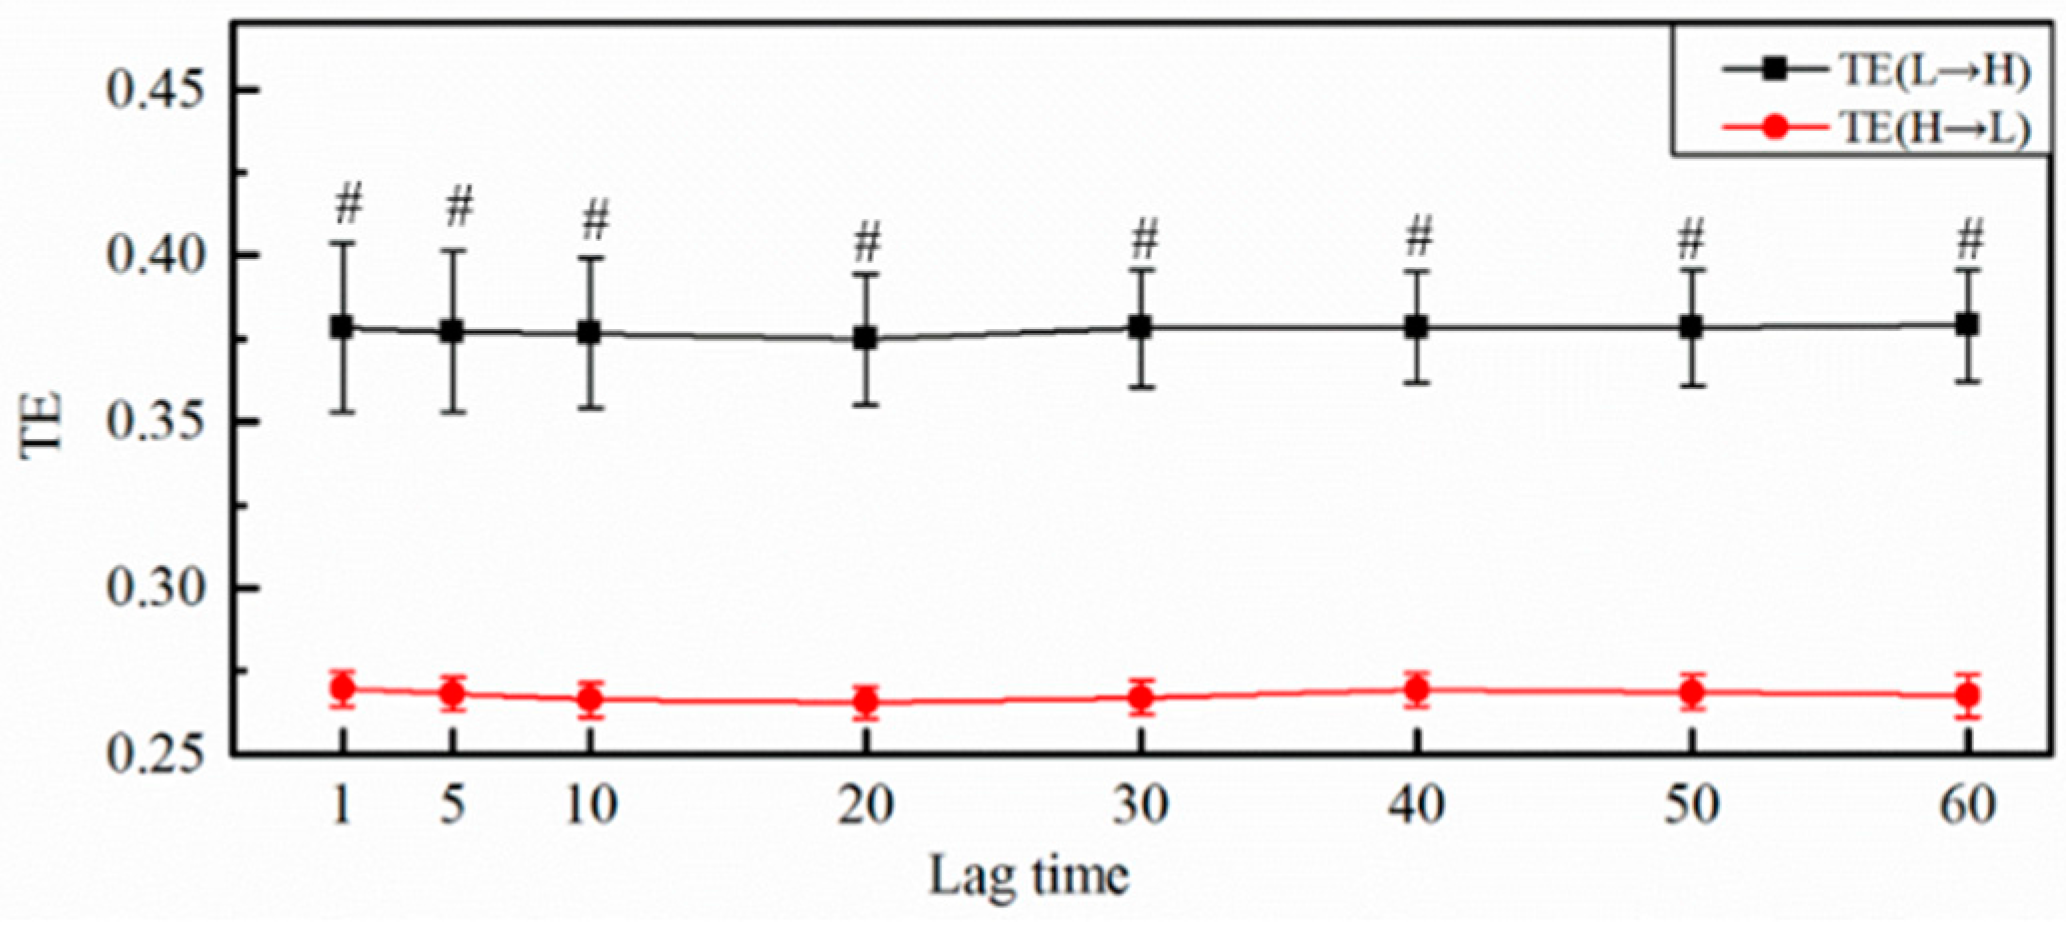
3.3.1. The Selection of Lag Time

Figure 4 shows the influence of lag time on mean transfer entropy of N-N group. With the increase of lag time, TE (LF→HF) kept close to 0.37 and TE (HF→LF) kept close to 0.26. It indicated that the influence of lag time on TE was tiny for HRV. Moreover, with the increase of lag time (1 to 60), TE (LF→HF) were significantly larger than TE (HF→LF) (p < 0.001). Thus, the lag time = 1 was selected for the rest of experiment.

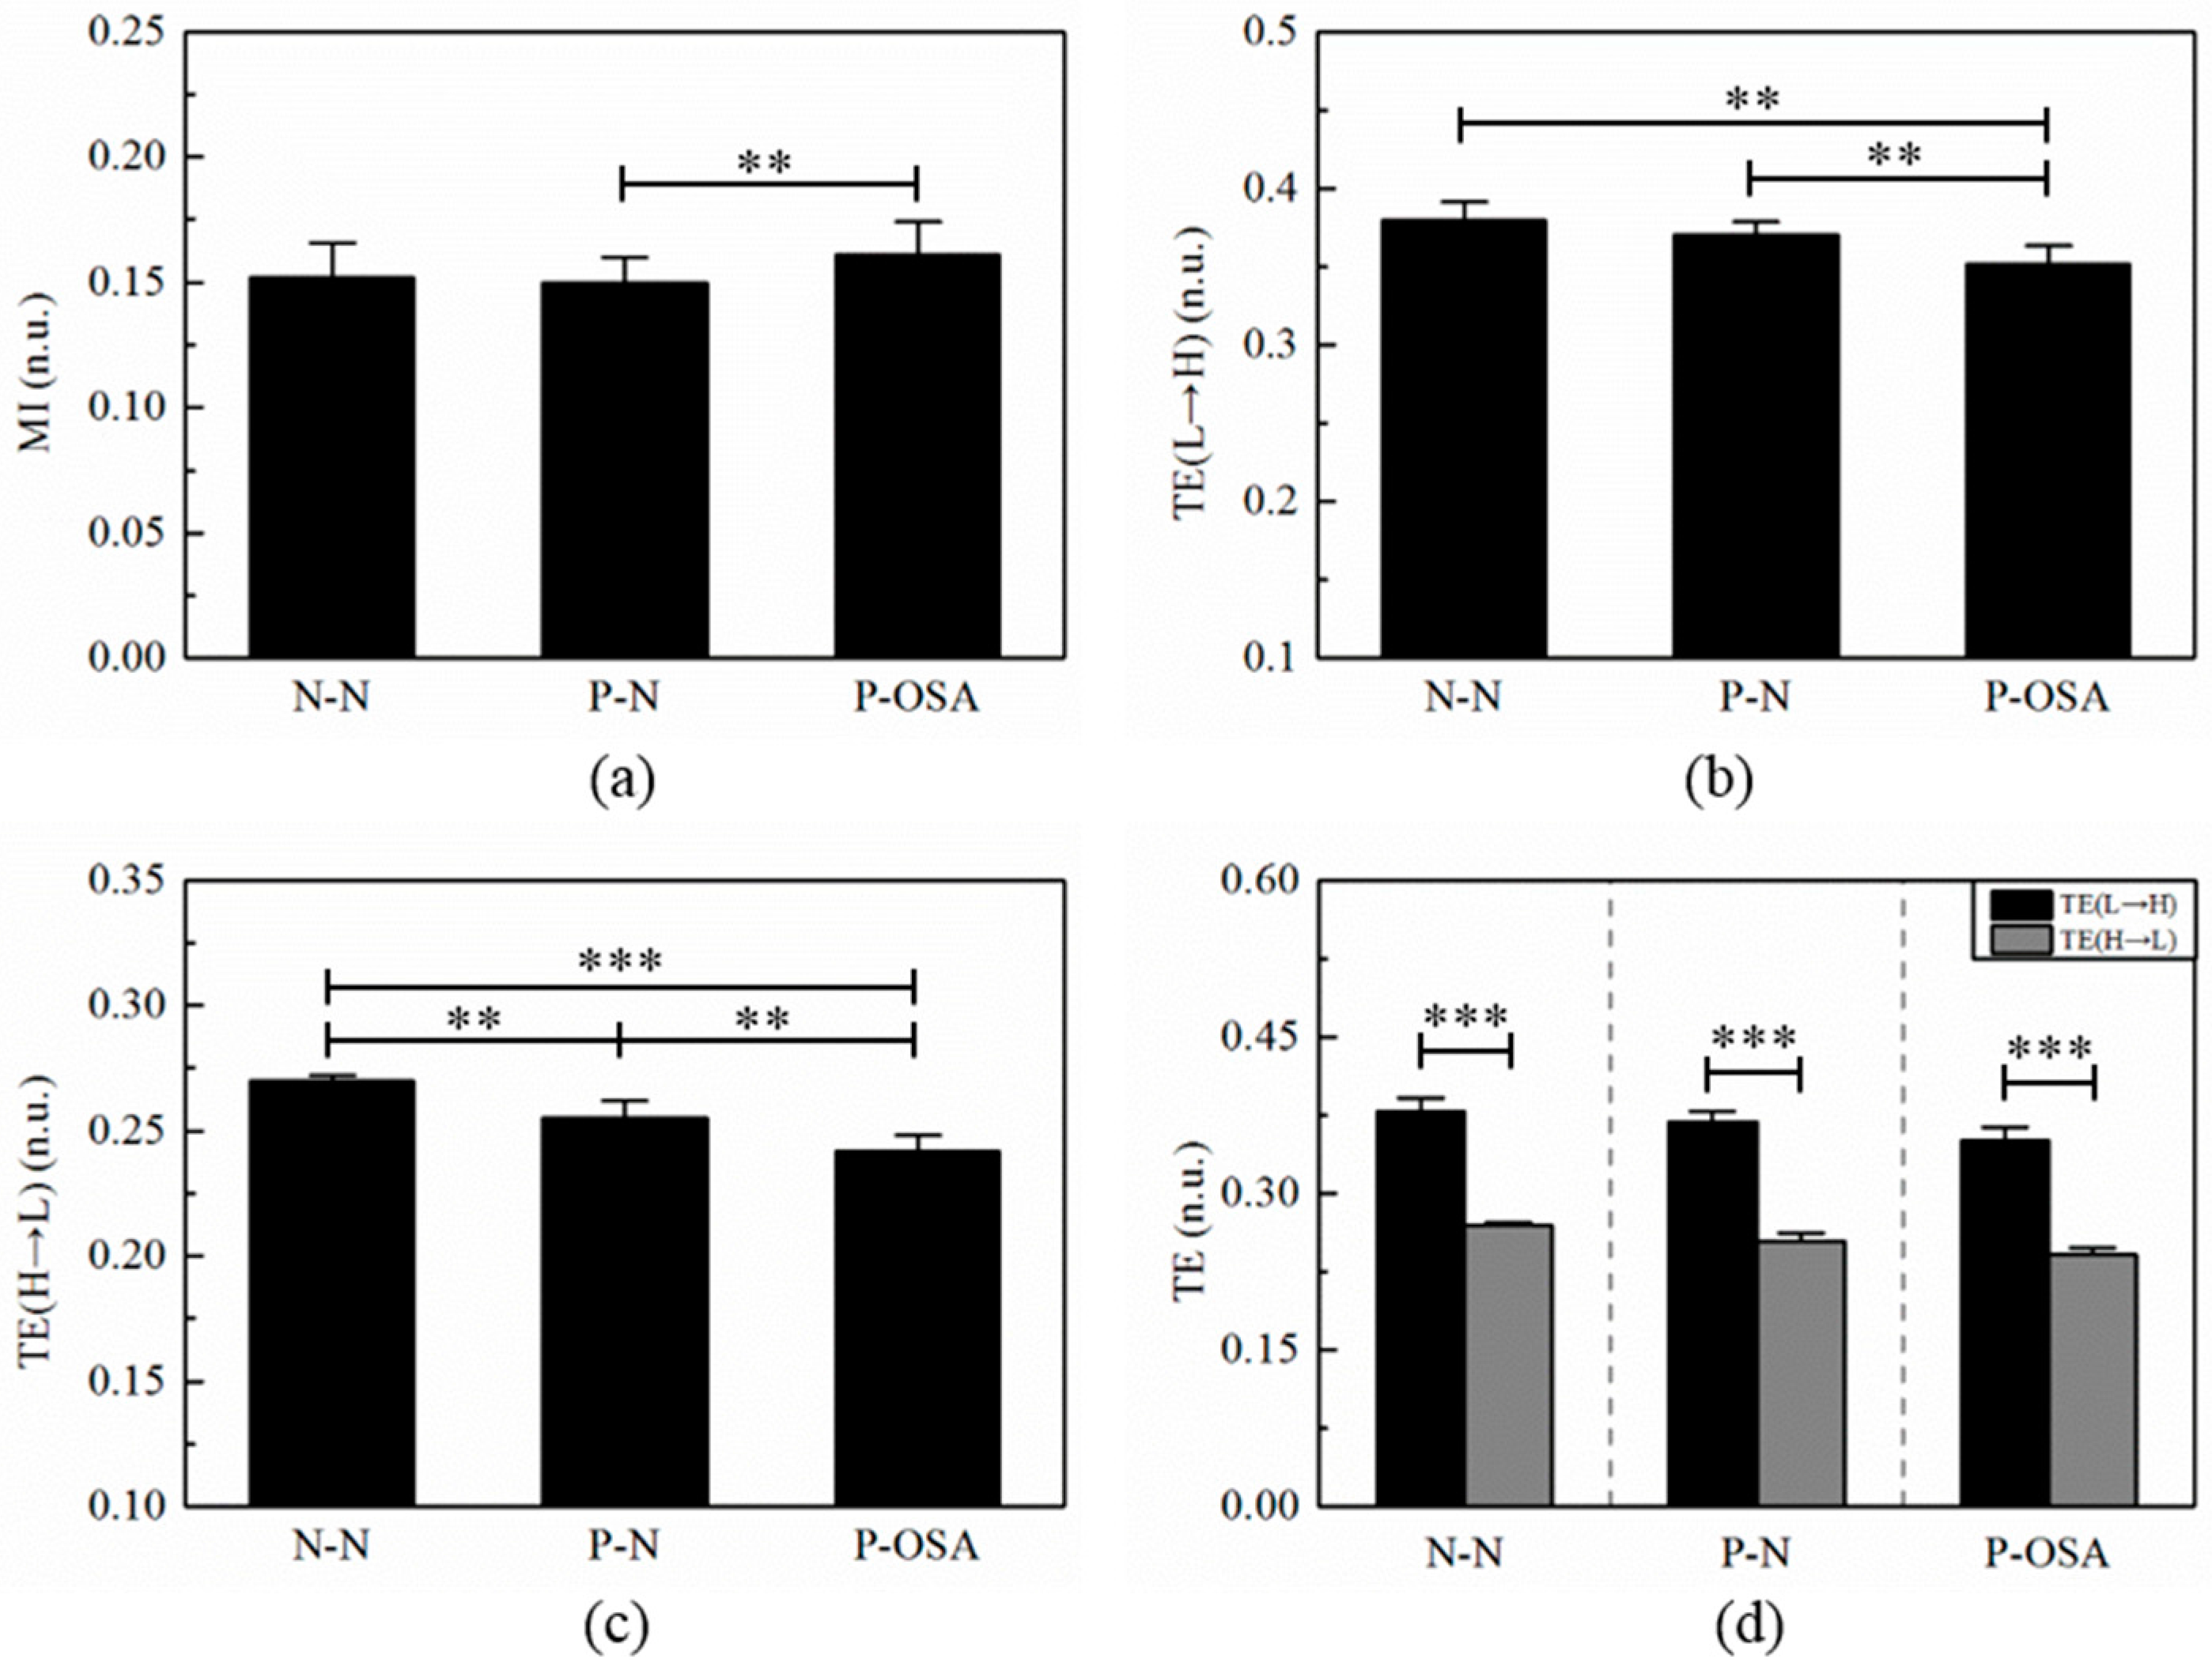
3.3.2. The Results of MI and TE

Mutual information was used to estimate coupling strength between sympathetic and parasympathetic system. Transfer entropy was used to quantify coupling strength and direction of information transfer between sympathetic and parasympathetic system. Figure 5 showed the statistical analysis results of interaction features.
The mean values of MI in three groups were showed in Figure 5a. The value of MI was highest in P-OSA group, lowest in P-N group. Post hoc analysis indicated that the value of MI was significantly higher in P-OSA group than P-N group. However, there was no significant differences between N-N group and P-N group. It showed that the coupling strength between sympathetic and parasympathetic system in P-OSA group was larger than in P-N and N-N groups.
Figure 5b,c displays the mean value of transfer entropy from low frequency to high frequency (TE (L→H)) and transfer entropy from high frequency to low frequency (TE (H→L)) in three groups, respectively. As shown in Figure 5b, the value of TE (L→H) was highest in N-N group and was lowest in P-OSA group. Post hoc analysis indicated the TE (L→H) was significant lower in P-OSA group than in N-N group (p < 0.01), and in P-N group (p < 0.01). As showed in Figure 5c, the value of TE (H→L) was highest in N-N group and was lowest in P-OSA group. Post hoc analysis indicated the TE (H→L) was significant lower in P-OSA group than in N-N group (p < 0.001), and in P-N group (p < 0.01). The value of TE (H→L) was larger in N-N group than in P-N group (p < 0.01). In addition, Figure 5d demonstrated the differences of information transfer between high frequency to low frequency. The value of TE (L→H) were significant larger than the value of TE (H→L) in three groups (p < 0.001).

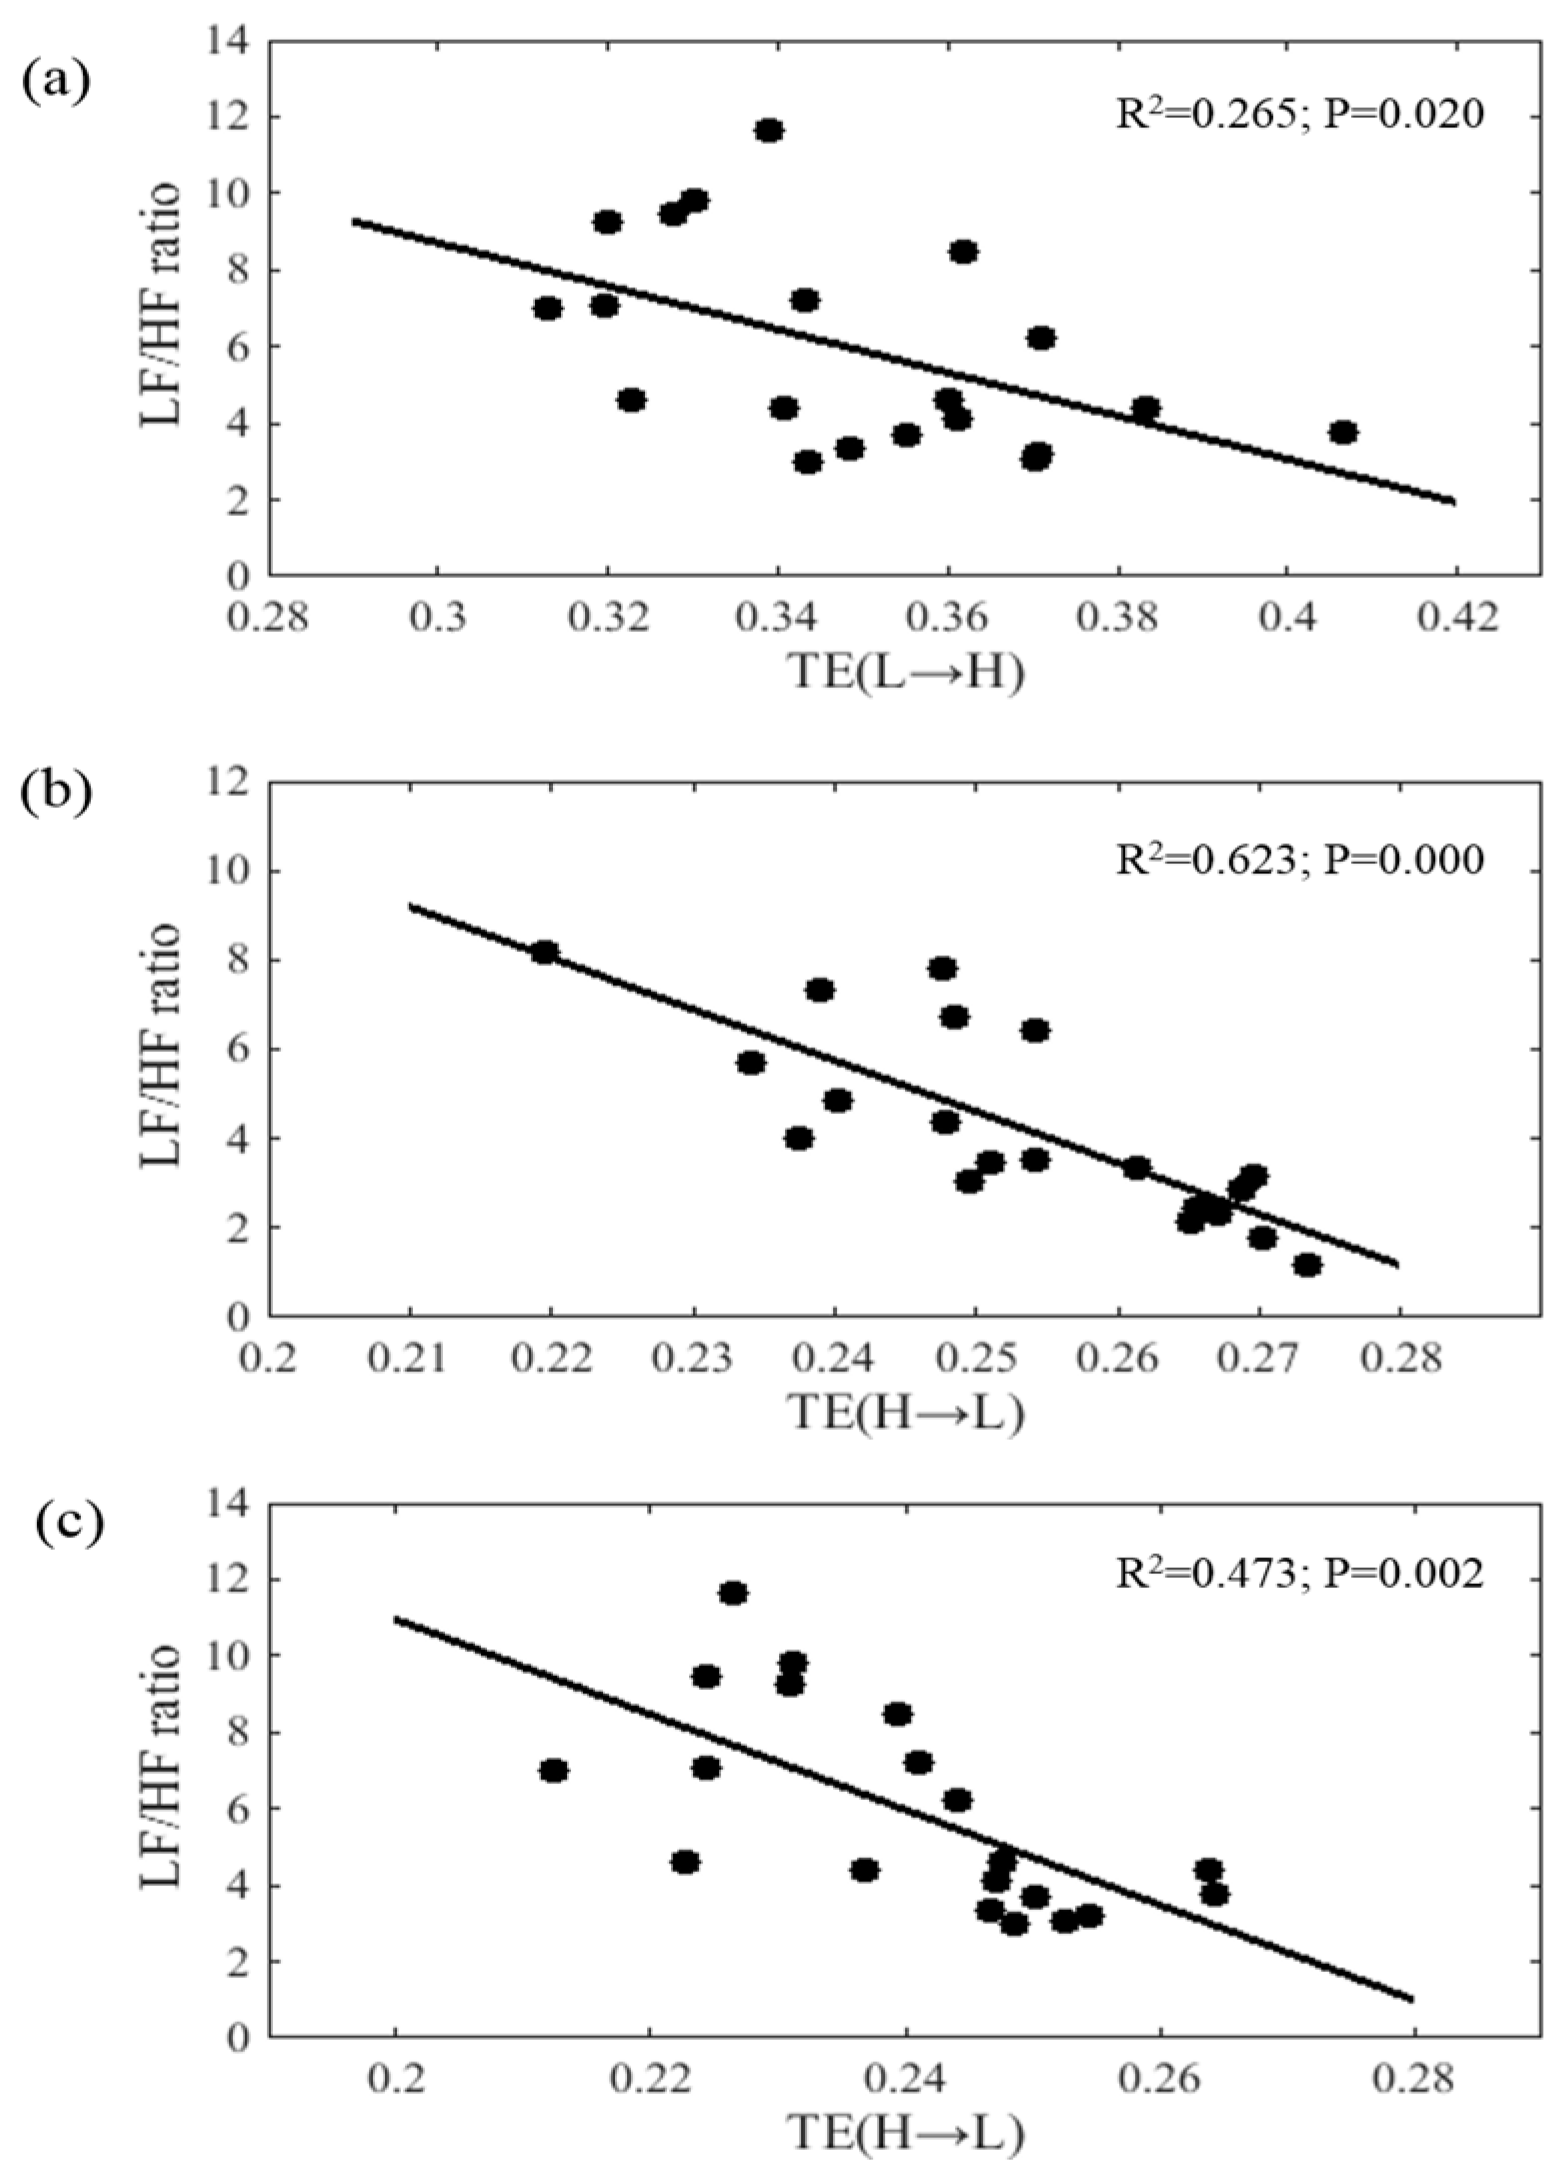
3.4 The Correlation Analysis between Interaction Features and LF/HF Ratio for Three Groups

Table 1 lists the correlation coefficients between and the MI, TE (L→H) and TE (H→L) with regard to N-N group, P-N group and P-OSA group. As shown in Table 1, TE (L→H) was significantly and negatively correlated with the LF/HF ratio (r = 0.154, p = 0.020). The TE (H→L) was significantly and negatively correlated with LF/HF ratio in P-N group (r = 0.789, p = 0.000) and in P-OSA group (r = 0.661, p = 0.002). The scatterplots showing the relationship between LF/HF ratio and interaction features were shown in Figure 6. The results revealed that the LF/HF was significantly and negatively correlated with the interaction features.

4. Discussion

The impairment of autonomic nervous system in OSA patients has attracted widespread attention. In present study, the LF component and HF component of global HRV were separated. The MI and TE were used to quantify the interaction between the LF component and HF component of global HRV in a group of N-N, P-N and P-OSA segments. These interaction features showed promise as effective parameters of sympathovagal modulation of AMS.

4.1. Comparison with Other Work

In frequency domain analysis, the finding of this study demonstrated an increase in nuLF among N-N, P-N, and P-OSA group while a reduction in nuHF. An increase in LF/HF ratio among N-N, P-N, and P-OSA group. It indicated that nuLF and LF/HF ratio were greater in OSA patients and nuHF was lower in OSA patients. These results are consistent with findings of previous studies [5,16,17,34]. They found that the increased LF power and LF/HF ratio in OSA patients, and the greater the AHI of OSA patient, the greater the LF/HF ratio [5,16,17,34]. The HF power is generally regarded as a reflection of parasympathetic activity, and LF power is known to be associated with sympathetic activity. Therefore, the LF/HF ratio can reflect the overall balance of parasympathetic activity and sympathetic activity. The LF/HF ratio was found to have a better statistical significance for assessing the change in sympathovagal balance in frequency analysis, because it is a normalized parameter with eliminating individual difference in total power. Moreover, the fact that LF/HF ratio is greater in P-OSA group compared to P-N group suggests a higher proportion of sympathetic activity when OSA patients suffered from apneic event.

4.2. Analysis of Interaction Features

The decomposing independent frequency components of HRV (HF and LF components) have been studying to demonstrate sympathetic and parasympathetic activity [35,36,37]. However, they neglected a complex interaction between the independent frequency components of HRV. In this study, MI and TE were proposed to deal with this problem, because both of them were good indicators to quantify the amount of shared information between two biomedical time series. Moreover, the feasibility of TE detecting interaction was verified by employing surrogate data.
Figure 3a showed that MI was higher in P-OSA group compared to P-N group, which was in agreement with LF/HF ratio. Furthermore, as shown in Figure 3b–d, the TE (L→H) and TH (E→L) exhibited a significant reduction within an increase unstable states (N-N to P-N to P-OSA). These findings suggested that the information interaction between sympathetic and parasympathetic system was decreasing within an increase unstable states. In other words, although OSA patients didn’t suffer from apnea event, OSA patients had autonomic function imbalance. This conclusion is supported by other literatures. They found that the more serious OSA patient was, the more variability the HRV decreased [5,15,17]. It is known that sympathetic system and parasympathetic system are two antagonistic parts of ANS. The influence of two nervous systems on a given tissue are opposed, which show enhancing the activity of given tissue while simultaneously inhibiting the activity of given tissue to avoid too rapid function of the tissue. The presence of interaction between the two nervous systems has been reported in many experimental studies [18,19,20]. As to experimental method, the MI and TE shows promise as noninvasive and quantitative markers of interaction between the two nervous system.
The practicability of TE to estimate interaction between the two nervous system was further validated by using Spearman’s correlation analysis between the HRV frequency indices and TE on both directions (TE (L→H) and TE (H→L)). The results showed that TE (L→H) and TE (H→L) were negatively related to LF/HF ratio in OSA patient with apneic event or not and that TE (H→L) was negatively related to LH power in healthy people. It tended to support the view that TE provides an accurate measure of interaction between the two nervous system. TE can quantify the amount of nonlinear interaction between two systems [22], so it is a more applicable as marker to measure nonlinear interaction between the two nervous systems. Comparing with linear power spectral analysis, it is a potential marker to provide new insight into the understanding of autonomic regulation of physiological phenomena.

4.3. The Length of RRI Time Series

A signal of 5 or more min is long accepted for HRV analysis [38,39]. Nevertheless, de Chanzal et al. considered 1-min epoch was particularly suited to the automated detection of apnea events, because 1 min is probably quite close to the natural duration time of apnea event [40]. In present study, the results of 1-min frequency features are in line with findings of 5 or more min in previous studies [5,9,16,17]. It supports the view that the information representation of 1-min epoch is the same as 5 or more-min epoch. The work by Gammoudi et al. [15] compared the 5-min epoch of RR-intervals (RRI) during free-events to those with obstructive events and found that there were no significant differences in LF/HF, LFnu and HFnu. The possible reason is that it is too long for 5-min epoch to analyze the distinction between patients during normal breathing and obstructive events. Because 5-min epoch is mixture of disordered and normal respiration [40].
In addition, it is more significant that using 1-min epoch to automatically detect OSA patients in clinical application. The difficult problem of automatically detecting OSA patients is to accurately determine whether an obstructive event in 1 min or not. Many studies have been trying to improve the accuracy of detection of 1-min apnea epoch, and thus improve the accuracy of automated detection of OSA patients [41,42,43,44]. The classification accuracy of previous work is about 85%. Therefore, it is important to provide more valuable information about 1-min epoch for better classification accuracy.
The present study has several limitations. First, we did not account for age and OSA severity which also influence the function of ANS [45]. Second, the effect of different sleep stages was not taken into account. At last, although we demonstrated negative correlation between LF/HF ratio and TE, we did not study the relationship between the PSG diagnostic indices and MI or TE.

5. Conclusions

This study aimed to investigate the interaction between sympathetic and parasympathetic activity by HRV with the presence of OSA. The results of this study proposed that MI and TE are powerful tools to detect the antagonistic relation between sympathetic system and parasympathetic system of ANS. Moreover, sympathovagal modulation is more imbalance in OSA patients while suffering from apnea event compared to free event.

Acknowledgments

This work was supported by the Natural Science Foundation of China (61401521), the Science and Technology Program of Guangzhou (2017A010101035) and the Natural Science Foundation of Guangdong province (2014A030310163).

Author Contributions

Qian Wang and Guanzheng Liu conceived and designed the experiments; Lianrong Zheng and Yifan Li analyzed the data; Weifeng Pan supplemented simulation experiments analyzed the data. Daiyi Luo contributed analysis tools; Lianrong Zheng and Yifan Li wrote the paper.

Conflicts of Interest

The authors declare no conflict of interest.

References

  1. Chen, L.; Zhang, X.; Wang, H. An obstructive sleep apnea detection approach using kernel density classification based on single-lead electrocardiogram. J. Med. Syst. 2015, 39, 47. [Google Scholar] [CrossRef] [PubMed]
  2. Drager, L.F.; Bortolotto, L.A.; Lorenzi, M.C.; Figueiredo, A.C.; Krieger, E.M.; Lorenzi-Filho, G. Early signs of atherosclerosis in obstructive sleep apnea. Am. J. Respir. Crit. Care Med. 2005, 172, 613–618. [Google Scholar] [CrossRef] [PubMed]
  3. Figueroa, M.S.; Peters, J.I. Congestive heart failure: Diagnosis, pathophysiology, therapy, and implications for respiratory care. Respir. Care 2006, 51, 403–412. [Google Scholar] [PubMed]
  4. Marshall, N.S.; Wong, K.K.; Liu, P.Y.; Cullen, S.R.; Knuiman, M.W.; Grunstein, R.R. Sleep Apnea as an Independent Risk Factor for All-Cause Mortality: The Busselton Health Study. Sleep 2008, 31, 1079–1085. [Google Scholar] [PubMed]
  5. Pan, W.-Y.; Su, M.-C.; Wu, H.-T.; Lin, M.-C.; Tsai, I.; Sun, C.-K. Multiscale entropy analysis of heart rate variability for assessing the severity of sleep disordered breathing. Entropy 2015, 17, 231–243. [Google Scholar] [CrossRef]
  6. Camm, A.J.; Malik, M.; Bigger, J.; Breithardt, G.; Cerutti, S.; Cohen, R.; Coumel, P.; Fallen, E.; Kennedy, H.; Kleiger, R. Heart rate variability: Standards of measurement, physiological interpretation and clinical use. Task Force of the European Society of Cardiology and the North American Society of Pacing and Electrophysiology. Circulation 1996, 93, 1043–1065. [Google Scholar]
  7. Chen, W.; Zheng, L.; Li, K.; Qian, W.; Liu, G.; Jiang, Q. A Novel and Effective Method for Congestive Heart Failure Detection and Quantification Using Dynamic Heart Rate Variability Measurement. PLoS ONE 2016, 11, e0165304. [Google Scholar] [CrossRef] [PubMed]
  8. Liu, G.; Wang, Q.; Chen, S.; Zhou, G.; Chen, W.; Wu, Y. Robustness evaluation of heart rate variability measures for age gender related autonomic changes in healthy volunteers. Australas. Phys. Eng. Sci. Med. 2014, 37, 567–574. [Google Scholar] [CrossRef] [PubMed]
  9. Gula, L.J.; Krahn, A.D.; Skanes, A.; Ferguson, K.A.; George, C.; Yee, R.; Klein, G.J. Heart rate variability in obstructive sleep apnea: A prospective study and frequency domain analysis. Ann. Noninvasive Electrocardiol. 2003, 8, 144–149. [Google Scholar] [CrossRef] [PubMed]
  10. Lado, M.J.; Mendez, A.J.; Rodríguez-Liñares, L.; Otero, A.; Vila, X.A. Nocturnal evolution of heart rate variability indices in sleep apnea. Comput. Biol. Med. 2012, 42, 1179–1185. [Google Scholar] [CrossRef] [PubMed]
  11. Liu, C.; Gao, R. Multiscale entropy analysis of the differential RR interval time series signal and its application in detecting congestive heart failure. Entropy 2017, 19, 251. [Google Scholar]
  12. Al-Angari, H.M.; Sahakian, A.V. Use of sample entropy approach to study heart rate variability in obstructive sleep apnea syndrome. IEEE Trans. Biomed. Eng. 2007, 54, 1900–1904. [Google Scholar] [CrossRef] [PubMed]
  13. Palma, J.A.; Urrestarazu, E.; Lopez-Azcarate, J.; Alegre, M.; Fernandez, S.; Artieda, J.; Iriarte, J. Increased sympathetic and decreased parasympathetic cardiac tone in patients with sleep related alveolar hypoventilation. Sleep 2013, 36, 933–940. [Google Scholar] [CrossRef] [PubMed]
  14. Floras, J.S.; Ponikowski, P. The sympathetic/parasympathetic imbalance in heart failure with reduced ejection fraction. Eur. Heart J. 2015, 36, 1974–1982. [Google Scholar] [CrossRef] [PubMed]
  15. Gammoudi, N.; Ben, C.R.; Saafi, M.A.; Sakly, G.; Dogui, M. Cardiac autonomic control in the obstructive sleep apnea. Libyan J. Med. 2015, 10, 26989. [Google Scholar] [CrossRef] [PubMed]
  16. Gong, X.; Huang, L.; Liu, X.; Li, C.; Mao, X.; Liu, W.; Huang, X.; Chu, H.; Wang, Y.; Wu, W. Correlation Analysis between Polysomnography Diagnostic Indices and Heart Rate Variability Parameters among Patients with Obstructive Sleep Apnea Hypopnea Syndrome. PLoS ONE 2016, 11, e0156628. [Google Scholar] [CrossRef] [PubMed]
  17. Park, D.-H.; Shin, C.-J.; Hong, S.-C.; Yu, J.; Ryu, S.-H.; Kim, E.-J.; Shin, H.-B.; Shin, B.-H. Correlation between the severity of obstructive sleep apnea and heart rate variability indices. J. Korean Med. Sci. 2008, 23, 226–231. [Google Scholar] [CrossRef] [PubMed]
  18. Lombardi, F.; Sandrone, G.; Pernpruner, S.; Sala, R.; Garimoldi, M.; Cerutti, S.; Baselli, G.; Pagani, M.; Malliani, A. Heart rate variability as an index of sympathovagal interaction after acute myocardial infarction. Am. J. Cardiol. 1987, 60, 1239–1245. [Google Scholar] [CrossRef]
  19. Houle, M.S.; Billman, G.E. Low-frequency component of the heart rate variability spectrum: A poor marker of sympathetic activity. Am. J. Physiol. Heart Circ. Physiol. 1999, 276, H215–H223. [Google Scholar]
  20. Miyamoto, T.; Kawada, T.; Yanagiya, Y.; Inagaki, M.; Takaki, H.; Sugimachi, M.; Sunagawa, K. Cardiac sympathetic nerve stimulation does not attenuate dynamic vagal control of heart rate via α-adrenergic mechanism. Am. J. Physiol. Heart Circ. Physiol. 2004, 287, H860–H865. [Google Scholar] [CrossRef] [PubMed]
  21. Melia, U.; Guaita, M.; Vallverdú, M.; Embid, C.; Vilaseca, I.; Salamero, M.; Santamaria, J. Mutual information measures applied to EEG signals for sleepiness characterization. Med. Eng. Phys. 2015, 37, 297. [Google Scholar] [CrossRef] [PubMed]
  22. Montalto, A.; Faes, L.; Marinazzo, D. MuTE: A MATLAB Toolbox to Compare Established and Novel Estimators of the Multivariate Transfer Entropy. PLoS ONE 2014, 9, e109462. [Google Scholar] [CrossRef] [PubMed] [Green Version]
  23. Al-Angari, H.M.; Kanitz, G.; Tarantino, S.; Cipriani, C. Distance and mutual information methods for EMG feature and channel subset selection for classification of hand movements. Biomed. Signal Process. Control 2016, 27, 24–31. [Google Scholar] [CrossRef]
  24. Lee, J.; Nemati, S.; Silva, I.; Edwards, B.A.; Butler, J.P.; Malhotra, A. Transfer entropy estimation and directional coupling change detection in biomedical time series. Biomed. Eng. Online 2012, 11, 19. [Google Scholar] [CrossRef] [PubMed] [Green Version]
  25. Faes, L.; Marinazzo, D.; Montalto, A.; Nollo, G. Lag-Specific Transfer Entropy as a Tool to Assess Cardiovascular and Cardiorespiratory Information Transfer. IEEE Trans. Biomed. Eng. 2014, 61, 2556–2568. [Google Scholar] [CrossRef] [PubMed]
  26. Pan, J.; Tompkins, W.J. A real-time QRS detection algorithm. IEEE Trans. Biomed. Eng. 1985, BME-32, 230–236. [Google Scholar] [CrossRef] [PubMed]
  27. Lippman, N.; Stein, K.M.; Lerman, B.B. Comparison of methods for removal of ectopy in measurement of heart rate variability. Am. J. Phys. 1994, 267, H411–H418. [Google Scholar]
  28. Voss, A.; Boettger, M.K.; Schulz, S.; Gross, K.; Bär, K.J. Gender-dependent impact of major depression on autonomic cardiovascular modulation. Prog. Neuro Psychopharmacol. Biol. Psychiatry 2011, 35, 1131–1138. [Google Scholar] [CrossRef] [PubMed]
  29. Faes, L.; Nollo, G.; Porta, A. Compensated Transfer Entropy as a Tool for Reliably Estimating Information Transfer in Physiological Time Series. Entropy 2013, 15, 198–219. [Google Scholar] [CrossRef]
  30. Palma, J.-A.; Iriarte, J.; Fernandez, S.; Valencia, M.; Alegre, M.; Artieda, J.; Urrestarazu, E. Characterizing the phenotypes of obstructive sleep apnea: Clinical, sleep, and autonomic features of obstructive sleep apnea with and without hypoxia. Clin. Neurophysiol. 2014, 125, 1783–1791. [Google Scholar] [CrossRef] [PubMed]
  31. Liu, G.Z.; Huang, B.Y.; Wang, L. A wearable respiratory biofeedback system based on generalized body sensor network. Telemed. J. e-Health 2011, 17, 348–357. [Google Scholar] [CrossRef] [PubMed]
  32. Cygankiewicz, I.; Zareba, W. Heart rate variability. Handb. Clin. Neurol. 2013, 117, 379–393. [Google Scholar] [PubMed]
  33. Gómez-Verdejo, V.; Verleysen, M.; Fleury, J. Information-theoretic feature selection for functional data classification. Neurocomputing 2009, 72, 3580–3589. [Google Scholar] [CrossRef]
  34. Trimer, R.; Mendes, R.; Costa, M.; Sampaio, M.; Delfino, A.; Arena, R.; Aletti, F.; Ferrario, M.; Borghi-Silva, A. Is there a chronic sleep stage-dependent linear and nonlinear cardiac autonomic impairment in obstructive sleep apnea? Sleep Breath. 2014, 18, 403–409. [Google Scholar] [CrossRef] [PubMed]
  35. Vigo, D.E.; Guinjoan, S.M.; Scaramal, M.; Siri, L.N.; Cardinali, D.P. Wavelet transform shows age-related changes of heart rate variability within independent frequency components. Auton. Neurosci. 2005, 123, 94–100. [Google Scholar] [CrossRef] [PubMed]
  36. Vigo, D.E.; Dominguez, J.; Guinjoan, S.M.; Scaramal, M.; Ruffa, E.; Solernó, J.; Siri, L.N.; Cardinali, D.P. Nonlinear analysis of heart rate variability within independent frequency components during the sleep–wake cycle. Auton. Neurosci. 2010, 154, 84–88. [Google Scholar] [CrossRef] [PubMed]
  37. Zhong, Y.; Jan, K.-M.; Ju, K.H.; Chon, K.H. Quantifying cardiac sympathetic and parasympathetic nervous activities using principal dynamic modes analysis of heart rate variability. Am. J. Phys. Heart Circ. Phys. 2006, 291, H1475–H1483. [Google Scholar] [CrossRef] [PubMed]
  38. Aktaruzzaman, M.; Sassi, R. Parametric estimation of sample entropy in heart rate variability analysis. Biomed. Signal Process. Control 2014, 14, 141–147. [Google Scholar] [CrossRef]
  39. Manis, G.; Aktaruzzaman, M.; Sassi, R. Bubble Entropy: An Entropy Almost Free of Parameters. IEEE Trans. Biomed. Eng. 2017. [Google Scholar] [CrossRef] [PubMed]
  40. De Chazal, P.; Penzel, T.; Heneghan, C. Automated detection of obstructive sleep apnoea at different time scales using the electrocardiogram. Phys. Meas. 2004, 25, 967–983. [Google Scholar] [CrossRef]
  41. Sharma, H.; Sharma, K.K. An algorithm for sleep apnea detection from single-lead ECG using Hermite basis functions. Comput. Biol. Med. 2016, 77, 116–124. [Google Scholar] [CrossRef] [PubMed]
  42. Babaeizadeh, S.; White, D.P.; Pittman, S.D.; Zhou, S.H. Automatic detection and quantification of sleep apnea using heart rate variability. J. Electrocardiol. 2010, 43, 535–541. [Google Scholar] [CrossRef] [PubMed]
  43. Varon, C.; Caicedo, A.; Testelmans, D.; Buyse, B.; Huffel, S.V. A novel algorithm for the automatic detection of sleep apnea from single-lead ECG. IEEE Trans. Biomed. Eng. 2015, 62, 2269–2278. [Google Scholar] [CrossRef] [PubMed]
  44. Song, C.; Liu, K.; Zhang, X.; Chen, L.; Xian, X. An Obstructive Sleep Apnea Detection Approach Using a Discriminative Hidden Markov Model From ECG Signals. IEEE Trans. Biomed. Eng. 2016, 63, 1532–1542. [Google Scholar] [CrossRef] [PubMed]
  45. Song, M.K.; Hyun, H.J.; Seung-Ho, R.; Yu, J.; Doo-Heum, P. The Effect of Aging and Severity of Sleep Apnea on Heart Rate Variability Indices in Obstructive Sleep Apnea Syndrome. Psychiatry Investig. 2012, 9, 65–72. [Google Scholar] [CrossRef] [PubMed]
Figure 1. TE matrix representation indicated the causality between X (driver system) and Y (target system). The color indicates the value of the TE averaged over 100 realizations of simulation.
Entropy 19 00489 g001
Figure 2. A plot of mean transfer entropy over 100 realizations of simulation with different lag time. # represents statistically significant difference p < 0.001.
Entropy 19 00489 g002
Figure 3. Mean and standard error of nuLF, nuHF and LF/HF ratio in N-N, P-N and P-OSA group. (a) nuLF of three groups. (b) nuHF of three groups. (c) The LF/HF ratio of three groups. nuLF: LF power in normalized units, nuHF: HF power in normalized units, LF/HF ratio: the power in LF⁄HF. *, ** and *** represent statistically significant difference p < 0.05, p < 0.01 and p < 0.001, respectively.
Entropy 19 00489 g003
Figure 4. The influence of lag time on mean transfer entropy of N-N group. # represents statistically significant difference p < 0.001.
Entropy 19 00489 g004
Figure 5. The results of interaction feature in N-N, P-N and P-OSA group. (a) The mean value of MI in three groups. (b) The mean value of TE (L→H) in three groups. (c) The mean value of TE (H→L) in three groups. (d) The differences between TE (L→H) and TE (H→L) in three groups. MI: mutual information; TE: transfer entropy; TE (L→H): transfer entropy from low frequency to high frequency; TE (H→L): transfer entropy high from frequency to low frequency. ** and *** represents statistically significant difference p < 0.01 and p < 0.001, respectively.
Entropy 19 00489 g005
Figure 6. The relationship between LF/HF ratio and interaction features with regard to the P-N group and P-OSA group. (a) Scatterplot of TE (L→H) with LF/HF ratio in P-OSA group; (b) Scatterplot of TE (H→L) with LF/HF ratio in P-N group; (c) Scatterplot of TE (H→L) with LF/HF ratio in P-OSA group.
Entropy 19 00489 g006
Table 1. The correlation between LF/HF ratio and interaction features.
ParametersLF/HF Ratio
(N-N Group)
LF/HF Ratio
(P-N Group)
LF/HF Ratio
(P-OSA Group)
rprprp
MI−0.3880.268−0.2480.293−0.1540.516
TE (L→H)−0.3880.640−0.2480.095−0.1540.020 *
TE (H→L)0.5320.113−0.7890.000 ***−0.6610.002 **
*, ** and *** represents statistically significant difference p < 0.05, p < 0.01 and p < 0.001.

