Evaluating Flight Crew Performance by a Bayesian Network Model


Abstract
:1. Introduction
2. Materials and Methods
2.1. Bayesian Network
2.1.1. Conditional Probabilities and Bayes Theorems
- B refers to a specific hypothesis or a set of hypothesizes;
- A refers to an observed evidence E;
- refers to prior probability before getting the evidence E;
- refers to the probability that E presents in every situation of B;
- refers to the posterior probability after getting the evidence E; and,
- is the marginal probability of A.
2.1.2. D-Separation and Conditional Independence
- (a)
- Serial Connection (see Figure 2)When there is evidence given about B, the communication between A and C is blocked.
- (b)
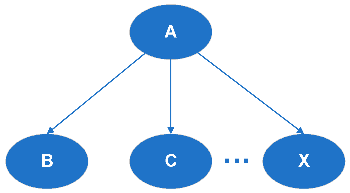
- Diverging Connection (see Figure 3)When there is evidence given about A, the communication between B and C is blocked.
- (c)
- Converging Connection (see Figure 4)When there is evidence given about A, communication is blocked between its parent nodes.
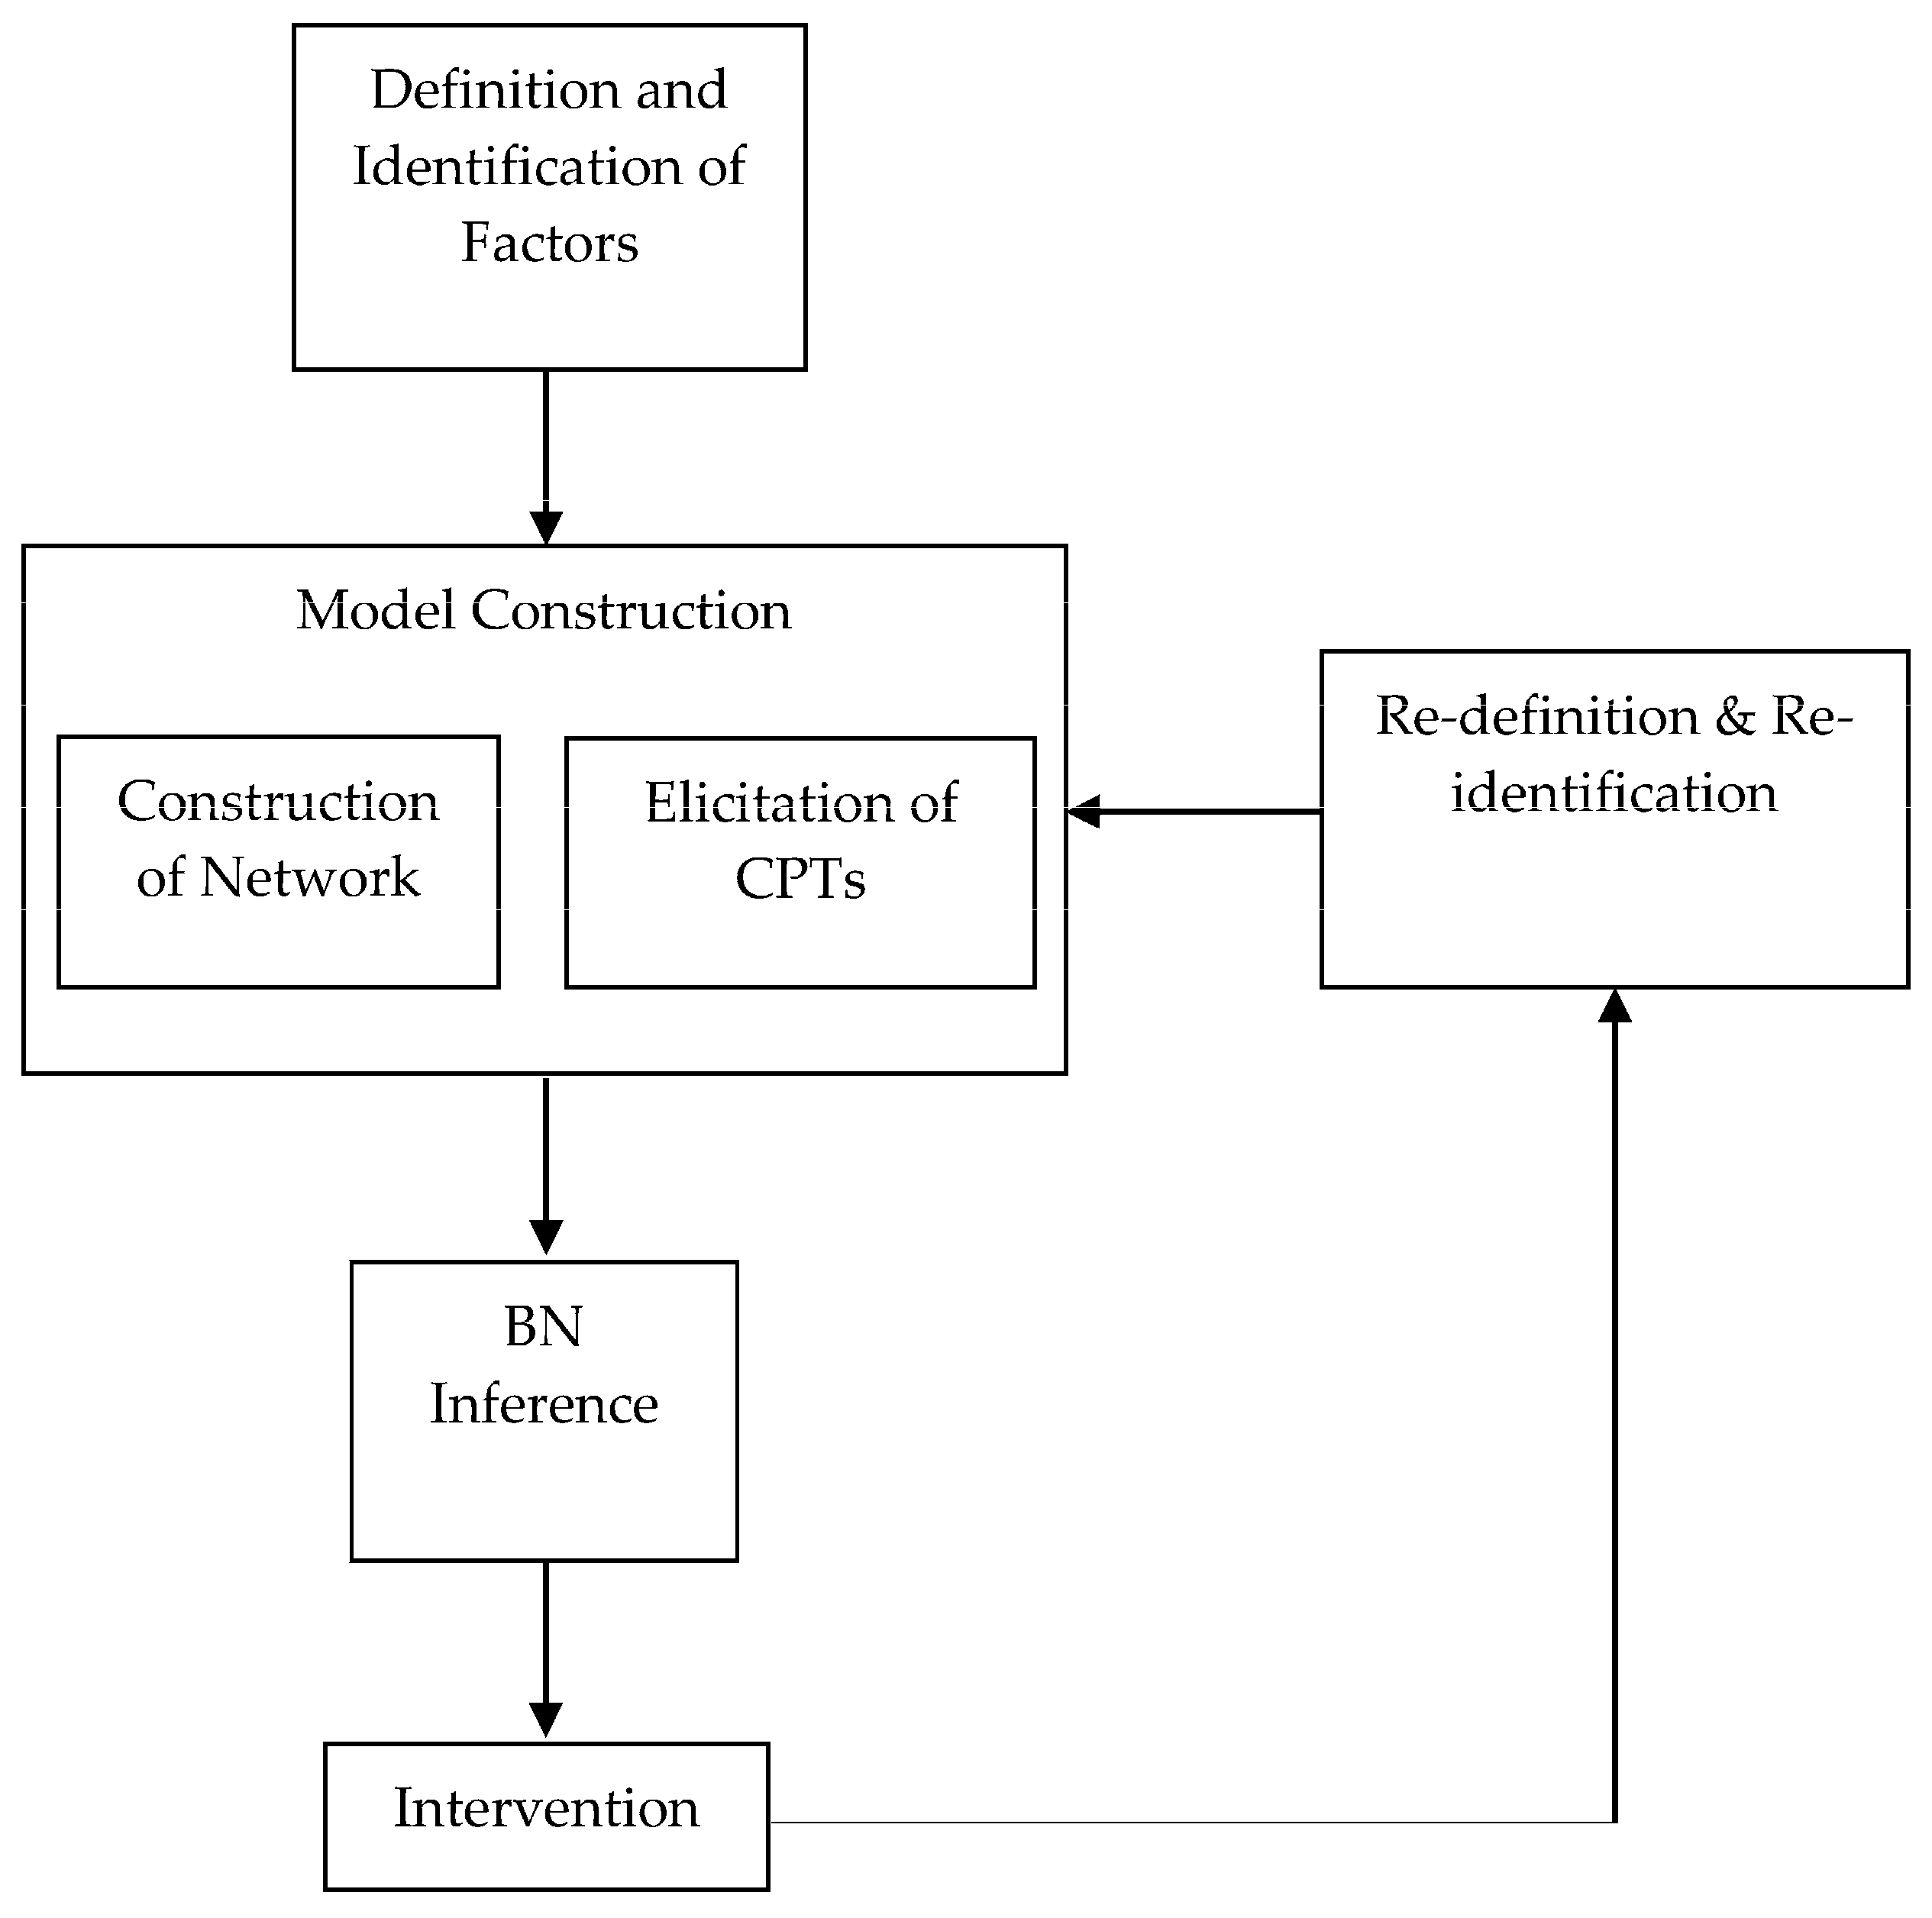
2.1.3. BN Modeling
- Step 1: Definition and identification of influence factors.
- Step 2: Construction of the BN model, which includes development of the network and elicitation of the CPTs. The dependence relations of the influence factors are modeled in a BN diagram and quantitative dependency is specified by eliciting the CPTs.
- Step 3: BN inference and finding key factors.
- Step 4: Intervention. Corresponding to the key factors, some measures should be taken to improve the safety condition.
- Step 5: Re-definition and re-identification. The process should be constant and the model should be improved continuously.
2.2. Noisy MAX and Leaky Noisy MAX
2.2.1. Noisy MAX Model
2.2.2. Leaky Noisy MAX Model
2.3. The Delphi Technique
3. The Flight Crew Performance Model
3.1. Network Construction
3.2. Data Collection
3.2.1. Marginal Probability Scenario
3.2.2. Conditional Probability Scenario
- What is the probability that “Safety Culture = good” results in “Organizational Climate = good” in the absence of the cause “Policy = good”?
- What is the leaky probability of the unmodeled causes result in “Organizational Climate = good” in the absence of the causes “Safety Culture = good” and “Policy = good”?
4. Discussions
4.1. Key Factors
4.2. Bottom-up Diagnostic
4.3. Sensitivity Analysis
5. Conclusions
Acknowledgments
Author Contributions
Conflicts of Interest
References
- Wiegmann, D.A.; Shappell, S.A. Human error analysis of commercial aviation accidents: Application of the Human Factors Analysis and Classification System (HFACS). Aviat. Space Environ. Med. 2001, 72, 1006–1016. [Google Scholar] [PubMed]
- O’Hare, D.; Wiggins, M.; Batt, R.; Morrison, D. Cognitive Failure Analysis for Aircraft Accident Investigation. Ergonomics 1994, 37, 1855–1869. [Google Scholar] [CrossRef]
- Yacavone, D.W. Mishap Trends and Cause Factors in Naval Aviation: A Review of Naval Safety Center Data, 1986–90. Aviat. Space Environ. Med. 1993, 64, 392–395. [Google Scholar] [PubMed]
- Wiegmann, D.A.; Shappell, S.A. Human Error and Crew Resource Management Failures in Naval Aviation Mishaps: A Review of US Naval Safety Center Data, 1990–96. Aviat. Space Environ. Med. 1999, 70, 1147–1151. [Google Scholar] [PubMed]
- Klinect, J.R.; Wilhelm, J.A.; Helmreich, R.L. Threat and Error Management: Data from Line Operations Safety Audits. In Proceedings of the Tenth International Symposium on Aviation Psychology, Columbus, OH, USA, 3–6 May 1999; pp. 683–688. [Google Scholar]
- Gao, J.T. Research on the Human Factors and Skill Training of Crew Resource Management. Ph.D. Thesis, NanJing University of Aeronautics and Astronautics, Nanjing, China, 2006. [Google Scholar]
- Helmreich, R.L.; Merritt, A.C.; Wilhelm, J.A. The Evolution of Crew Resource Management Training in Commercial Aviation. Int. J. Aviat. Psychol. 1999, 9, 19–32. [Google Scholar] [CrossRef] [PubMed]
- Neumeister, D.M.; Mangold, S.J. Implementing the Model AQO Database-Lessons Learned (Advanced Qualification Program). In Proceedings of the International Symposium on Aviation Psychology, Columbus, OH, USA, 27 April–1 May 1997; pp. 70–75. [Google Scholar]
- Klinect, J.R.; Murray, P.; Merritt, A.; Helmreich, R. Line Operations Safety Audit (LOSA): Definition and Operating Characteristics. In Proceedings of the 12th International Symposium on Aviation Psychology, Dayton, OH, USA, 14–17 April 2003; pp. 663–668. [Google Scholar]
- Kuhnert, P.M.; Hayes, K.R. How Believable is Your BBN. In Proceedings of the 18th World IMACS/MODSIM Congress, Cairns, Australia, 13–17 July 2009; pp. 13–17. [Google Scholar]
- Cooper, G.F.; Herskovits, E. A Bayesian Method for the Introduction of Probabilistic Networks from Data. Mach. Learn. 1992, 9, 309–347. [Google Scholar] [CrossRef]
- Trucco, P.; Cagno, E.; Ruggeri, F.; Grandeo, O. A Bayesian Belief Network Modelling of Organisational Factors in Risk Analysis: A Case Study in Maritime Transportation. Reliab. Eng. Syst. Saf. 2008, 93, 845–856. [Google Scholar] [CrossRef]
- Chen, W.; Huang, S.P. Human Reliability Analysis for Visual Inspection in Aviation Maintenance by a Bayesian Network Approach. Transp. Res. Rec. J. Transp. Res. Board 2014, 2449, 105–113. [Google Scholar] [CrossRef]
- Chen, W.; Huang, S.P. Human Reliability Analysis in Aviation Maintenance by a Bayesian Network Approach. In Proceedings of the 11th International Conference on Structural Safety & Reliability, New York, NY, USA, 16–20 June 2013. [Google Scholar]
- Yin, J.B. Quantitative Risk Assessment for Maritime Safety Management. Ph.D. Thesis, The Hong Kong Polytechnic University, Hongkong, China, 2011. [Google Scholar]
- Heckerman, D. Bayesian Networks for Knowledge Discovery. Adv. Knowl. Discov. Data Min. 1996, 11, 273–305. [Google Scholar]
- Heckerman, D. A Tutorial on Learning with Bayesian Networks. In Innovations in Bayesian Networks; Springer: Berlin/Heidelberg, Germany, 2008. [Google Scholar]
- Díez, F.J.; Galán, S.F. An Efficient Computation for the Noisy MAX. Int. J. Intell. Syst. 2003, 18, 165–177. [Google Scholar] [CrossRef]
- Zagorecki, A.; Druzdzel, M.J. Knowledge Engineering for Bayesian Networks: How Common are Noisy-max Distributions in Practice? In Proceedings of the Conference on ECAI 2006, 29 August–1 September 2006.
- Good, I.J. A Causal Calculus (I). Br. J. Philos. Sci. 1961, 11, 305–318. [Google Scholar] [CrossRef]
- Díez, F.J.; Druzdzel, M.J. Canonical Probabilistic Models for Knowledge Engineering; Technical Report CISIAD-06-01; UNED: Madrid, Spain, 2006. [Google Scholar]
- Henrion, M. Practical Issues in Constructing a Bayes’ Belief Network. arXiv 2013, arXiv:1304.2725. [Google Scholar]
- Díez, F.J. Parameter Adjustment in Bayes Networks. The Generalized Noisy OR-gate. In Proceedings of the Ninth International Conference on Uncertainty in Artificial Intelligence, Washington, DC, USA, 9–11 July 1993; Morgan Kaufmann Publishers Inc.: San Francisco, CA, USA, 1993; pp. 99–105. [Google Scholar]
- Pradhan, M.; Provan, G.; Middleton, B.; Henrion, M. Knowledge Engineering for Large Belief Networks. In Proceedings of the Tenth International Conference on Uncertainty in Artificial Intelligence, Seattle, WA, USA, 29–31 July 1994; Morgan Kaufmann Publishers Inc.: San Francisco, CA, USA, 1994; pp. 484–490. [Google Scholar]
- Dalkey, N.; Helmer, O. An Experimental Application of the Delphi Method to the Use of Experts. Manag. Sci. 1963, 9, 458–467. [Google Scholar] [CrossRef]
- Goodheart, B.J. Identification of Causal Paths and Prediction of Runway Incursion Risk by Means of Bayesian Belief Networks. Transp. Res. Rec. J. Transp. Res. Board 2013, 2400, 9–20. [Google Scholar] [CrossRef]
- Cooke, R.M. Validating Expert Judgment with the Classical Model. In Experts and Consensus in Social Science; Springer: Cham, Switzerland, 2014; pp. 191–212. [Google Scholar]
- Clemen, R.T. Comment on Cooke’s classical method. Reliab. Eng. Syst. Saf. 2008, 93, 760–765. [Google Scholar] [CrossRef]
- Pilot Certification in the United States from Wikipedia, the Free Encyclopedia. Available online: en.wikipedia.org/wiki/Pilot_certification_in_the_United_States#cite_note-17 (accessed on 1 July 2014).
- Guldenmund, F.W. The Nature of Safety Culture: A Review of Theory and Research. Saf. Sci. 2000, 34, 215–257. [Google Scholar] [CrossRef]
- Wang, H.; Rish, I.; Ma, S. Using Sensitivity Analysis for Selective Parameter Update in Bayesian Network Learning. In Proceedings of the Association for the Advancement of Artificial Intelligence (AAAI), Edmonton, AB, Canada, 28–29 July 2002. [Google Scholar]


| Pilot Flight Time (hours) | <1500 | (1500, 5000) | ≥5000 |
|---|---|---|---|
| Number | 12 | 73 | 349 |
| State | poor | normal | rich |
| Probability | 0.027650 | 0.168203 | 0.804147 |
| Node | State | FCP 1 = good | State | FCP = good | State | FCP = good | Increased Percent |
|---|---|---|---|---|---|---|---|
| Flying Skills | poor | 0.97263 | qualified | 0.99636 | excellent | 0.999247 | 2.74% |
| vigilance | low | 0.98911 | middle | 0.997717 | high | 0.998753 | 0.97% |
| Emergency Mishandling | yes | 0.993575 | - | - | no | 0.999217 | 0.57% |
| safety culture | poor | 0.993667 | normal | 0.998564 | good | 0.999199 | 0.56% |
| Crew Coordination | poor | 0.993972 | normal | 0.996798 | good | 0.999198 | 0.53% |
| training | poor | 0.994111 | normal | 0.998586 | good | 0.999329 | 0.52% |
| Negligence or Misoperation | yes | 0.993784 | - | - | no | 0.998802 | 0.50% |
| experience | poor | 0.995181 | middle | 0.998638 | rich | 0.999167 | 0.40% |
| professional quality | poor | 0.99589 | middle | 0.99855 | good | 0.999086 | 0.32% |
| organizational climate | poor | 0.996428 | normal | 0.99832 | good | 0.999101 | 0.27% |
| communication | poor | 0.996667 | normal | 0.998148 | good | 0.999153 | 0.25% |
| Violation | yes | 0.99706 | - | - | no | 0.999305 | 0.23% |
| supervision | poor | 0.996923 | normal | 0.998605 | good | 0.999012 | 0.21% |
| organization resources management | poor | 0.997499 | normal | 0.998713 | good | 0.999113 | 0.16% |
| Judgment Error | yes | 0.997443 | - | - | no | 0.998977 | 0.15% |
| operation plan | poor | 0.997866 | normal | 0.998781 | good | 0.999149 | 0.13% |
| situational awareness | lose | 0.997596 | - | - | exist | 0.998701 | 0.11% |
| Crew Incapacitation | yes | 0.997864 | - | - | no | 0.998749 | 0.09% |
| physiological situation | poor | 0.997872 | normal | 0.998696 | good | 0.99875 | 0.09% |
| working pressure | high | 0.998308 | middle | 0.998827 | low | 0.998862 | 0.06% |
| mentation | poor | 0.998226 | normal | 0.998676 | good | 0.998765 | 0.05% |
| policy | poor | 0.998425 | normal | 0.998613 | good | 0.998827 | 0.04% |
| continuous working period | long | 0.998531 | - | - | normal | 0.998752 | 0.02% |
| mood | poor | 0.998605 | normal | 0.998691 | good | 0.998748 | 0.01% |
| circadian rhythms | drowsy | 0.998657 | - | - | awake | 0.998745 | 0.01% |
| sudden injury | yes | 0.998657 | - | - | no | 0.998745 | 0.01% |
© 2018 by the authors. Licensee MDPI, Basel, Switzerland. This article is an open access article distributed under the terms and conditions of the Creative Commons Attribution (CC BY) license (http://creativecommons.org/licenses/by/4.0/).
Share and Cite
Chen, W.; Huang, S. Evaluating Flight Crew Performance by a Bayesian Network Model. Entropy 2018, 20, 178. https://doi.org/10.3390/e20030178
Chen W, Huang S. Evaluating Flight Crew Performance by a Bayesian Network Model. Entropy. 2018; 20(3):178. https://doi.org/10.3390/e20030178
Chicago/Turabian StyleChen, Wei, and Shuping Huang. 2018. "Evaluating Flight Crew Performance by a Bayesian Network Model" Entropy 20, no. 3: 178. https://doi.org/10.3390/e20030178
APA StyleChen, W., & Huang, S. (2018). Evaluating Flight Crew Performance by a Bayesian Network Model. Entropy, 20(3), 178. https://doi.org/10.3390/e20030178