1. Introduction
Let X = {x
1, …, x
m} be a finite set and A be a fuzzy set of X. In [
1,
2] two categories of fuzziness, measures are defined as energy and entropy (see, e.g., also [
3]). The energy measure of the fuzziness of A is given by:
where e: [0,1] → [0,1] is a monotonically increasing continuous function, with e(0) = 0 and e(1) = 1. A particular energy function is given by e(u) = u for any u ∈ [0,1]. In this case, the minimum value of the energy is 0, and the maximum is given by E(A) = Card(X) = m. The entropy measure of fuzziness of the fuzzy set A is defined as:
where h: [0,1] → [0,1] is a monotonically increasing continuous function in [0, ½] and monotonically decreasing in [½, 1], with h(0) = h(1) = 0 and h(u) = h(1 − u). A simple entropy function is given by h(u) = u if u ≤ ½ and h(u) = 1 − u if u > ½.
Now we consider another finite set, Y = {y
1, …, y
n}, and a fuzzy relation R defined by X × Y:
and
We now take a continuous t-norm t and a max-t fuzzy relation equation, that is of the following type:
where A (resp., B) is a known input (resp., output) fuzzy set, and R is an n unknown fuzzy automaton (relation) connecting the inputs-output via fuzzy rules.
Solutions for the fuzzy relation Equation (5) were proposed in [
4,
5,
6] (see, e.g., [
7] if t = min). In particular, if we consider the t-norm of Yager [
8], the unique greatest fuzzy relation R
1 is defined as
, where
is given:
R
1 is the fuzzy relation having the maximum energy E. Furthermore, in [
4,
5] the authors propose an algorithm for finding the relation R
2, solution of (5) not unique, having the minimum entropy H.
Many works in data and decision analysis present methods to minimize the fuzzy entropy for obtaining the solution with the smallest ambiguity. Some research works, such as [
9,
10,
11,
12,
13,
14,
15,
16,
17], present fuzzy decision algorithms for classification analysis using minimum fuzzy entropy.
We propose a new method for measuring the strength of fuzzy rules with respect to a set of input-output data, based on the maximum energy and minimum entropy measures.
Our idea is to calculate, for any pair of input and output fuzzy sets, a normalized index of the strength of the rule with respect to the data, which is a function of the maximum energy and minimum entropy. We find the best input-output fuzzy sets pair to be that for which the corresponding index is maximum. If this index is greater or equal to a pre-defined threshold, then we consider the fuzzy rule which is more relevant with respect to the data.
In
Section 2, we describe the algorithm presented in [
4,
5] for calculating the solutions R
1 and R
2 of the Equation (5) with the Yager t-norm. In
Section 3, our algorithm is presented for evaluating the strength of fuzzy rules with respect to the data. In
Section 4, we present the results of two experiments in which we apply our algorithm. Final considerations are shown in
Section 5.
2. Algorithm for Calculating Fuzzy Relations Having the Greatest Energy and Smallest Entropy
Let X = {x
1, …, x
m}, Y = {y
1, …, y
n}, A (resp., B) be a fuzzy set on X (resp., Y). In [
4,
5] it is proven that R
1 is the solution of the Equation (5) with maximum energy. For the calculus of R
2, the following algorithm is developed in [
4,
5]. Let h be defined as in
Section 1. For each y
j ∈ Y, we consider Γ(y
j) = {x
i ∈ X: A(x
i) ≥ B(y
j)}. If B(y
j) > 0, the algorithm finds some x
c ∈ Γ(y
j) (generally not unique), such that A(x
c)τB(y
j) is not zero and h(A(x
c)τB(y
j)) assumes the minimum value. Then, R
2(x
i,y
j) = A(x
i)τB(y
j) if x
i = x
c and R
2(x
i, y
j) = 0 if x
i ≠ x
c. If B(y
j) = 0, R
2(x
i, y
j) = 0 for each i = 1, …, m. Below, we show the pseudocodes for calculating R
1 (Algorithm 1) and R
2 (Algorithm 2).
| Algorithm 1 Calculate R1 |
| Description: | | Calculate the matrix R1 |
| Input: | | X, Y, A, B |
| Output: | | R1 |
| 1 | FOR j = 1 TO n |
| 2 | { |
| 3 | FOR i = 1 TO m |
| 4 | { |
| 5 | R1(xi,yj): = A(xi) τB(yj); |
| 6 | } |
| 7 | } |
| 8 | END |
| Algorithm 2 Calculate R2 |
| Description: | | Calculate the matrix R2 |
| Input: | | X, Y, A, B |
| Output: | | R2 |
| 1 | FOR j = 1 TO n |
| 2 | { |
| 3 | IF B(yj)>0 |
| 4 | { |
| 5 | xc: = 0: |
| 6 | hmin: = 1; |
| 7 | FOR each x in Γ(yj) |
| 8 | { |
| 9 | IF h(A(x), B(yj)) < hmin THEN |
| 10 | { |
| 11 | hmin: = h(A(x), B(yj)); |
| 12 | xc: = x; |
| 13 | } |
| 14 | } |
| 15 | FOR i = 1 TO m |
| 16 | { |
| 17 | IF (xi = xc) |
| 18 | R2(xi,yj): = A(xi) τB(yj) ; |
| 19 | ELSE |
| 20 | R2(xi,yj):= 0; |
| 21 | } |
| 22 | } |
| 23 | ELSE |
| 24 | { |
| 25 | FOR i = 1 TO m |
| 26 | R2(xi,yj):= 0; |
| 27 | } |
| 28 | } |
| 29 | END |
As example, let X = {x
1, x
2, x
3, x
4}, Y = {y
1, y
2, y
3, y
4}, A = (0.2, 0.3, 0.5, 0.8) and B = (0.4, 0.0, 0.6, 0.7). For p = 2 in Formula (6), we obtain that
For R
2, we have Γ(y
1) = {x
3, x
4}, Γ(y
3) = {x
4}, Γ(y
4) = {x
4} and hence R
2(x
3, y
1) = 0.67, R
2(x
4, y
3) = 0.65 and R
2(x
4, y
4) = 0.78. For B(y
2) = 0, we have that R
2(x
i, y
2) = 0 for each i = 1, …, 4. Then, the fuzzy relation with minimum entropy is given by:
3. Evaluating the Strength of the Fuzzy Rules with Respect to the Data
Our goal is to evaluate the strength of the fuzzy rules considered in a domain’s expert with respect to dataset [
18]. Transferring its knowledge of the domain, the expert builds a fuzzy partition of q fuzzy sets {A
1, …, A
q} of the universe of the discourse U
x of the input variable x, and a fuzzy partition of s fuzzy sets {B
1, …, B
s} of the universe of the discourse U
y of the output variable y. Subsequently, he defines a set of fuzzy rules relating the input and the output variables in the following form:
where rk is the kth fuzzy rule of the fuzzy rule set. For instance, let a dataset be composed by m measures of the input variable x, X = {x
1, …, x
m}, and a dataset composed by n measures of the output variable y, Y = {y
1, …, y
n}. For each rule we extract the pair (A
w,B
z) formed by the input and the output fuzzy sets in (7), and we calculate a normalized index based on the maximum energy and minimum entropy. The index represents the strength of the kth fuzzy rule with respect to the data. Let R be the fuzzy automaton (relation) connecting A
w and B
z by means of Equation (5) with the Yager t-norm. Let R
1wz and R
2wz serve as the solutions of (5), with maximum energy and minimum entropy calculated using the algorithms of
Section 2. The index of strength for the pair (A
w,B
z) is defined [
4] as:
For I
wz = 1, we obtain E(R
1wz) = n·m and H(R
2wz) = 0. If I
wz is greater or equal to a pre-defined threshold, then the fuzzy rule is confirmed by the data. In
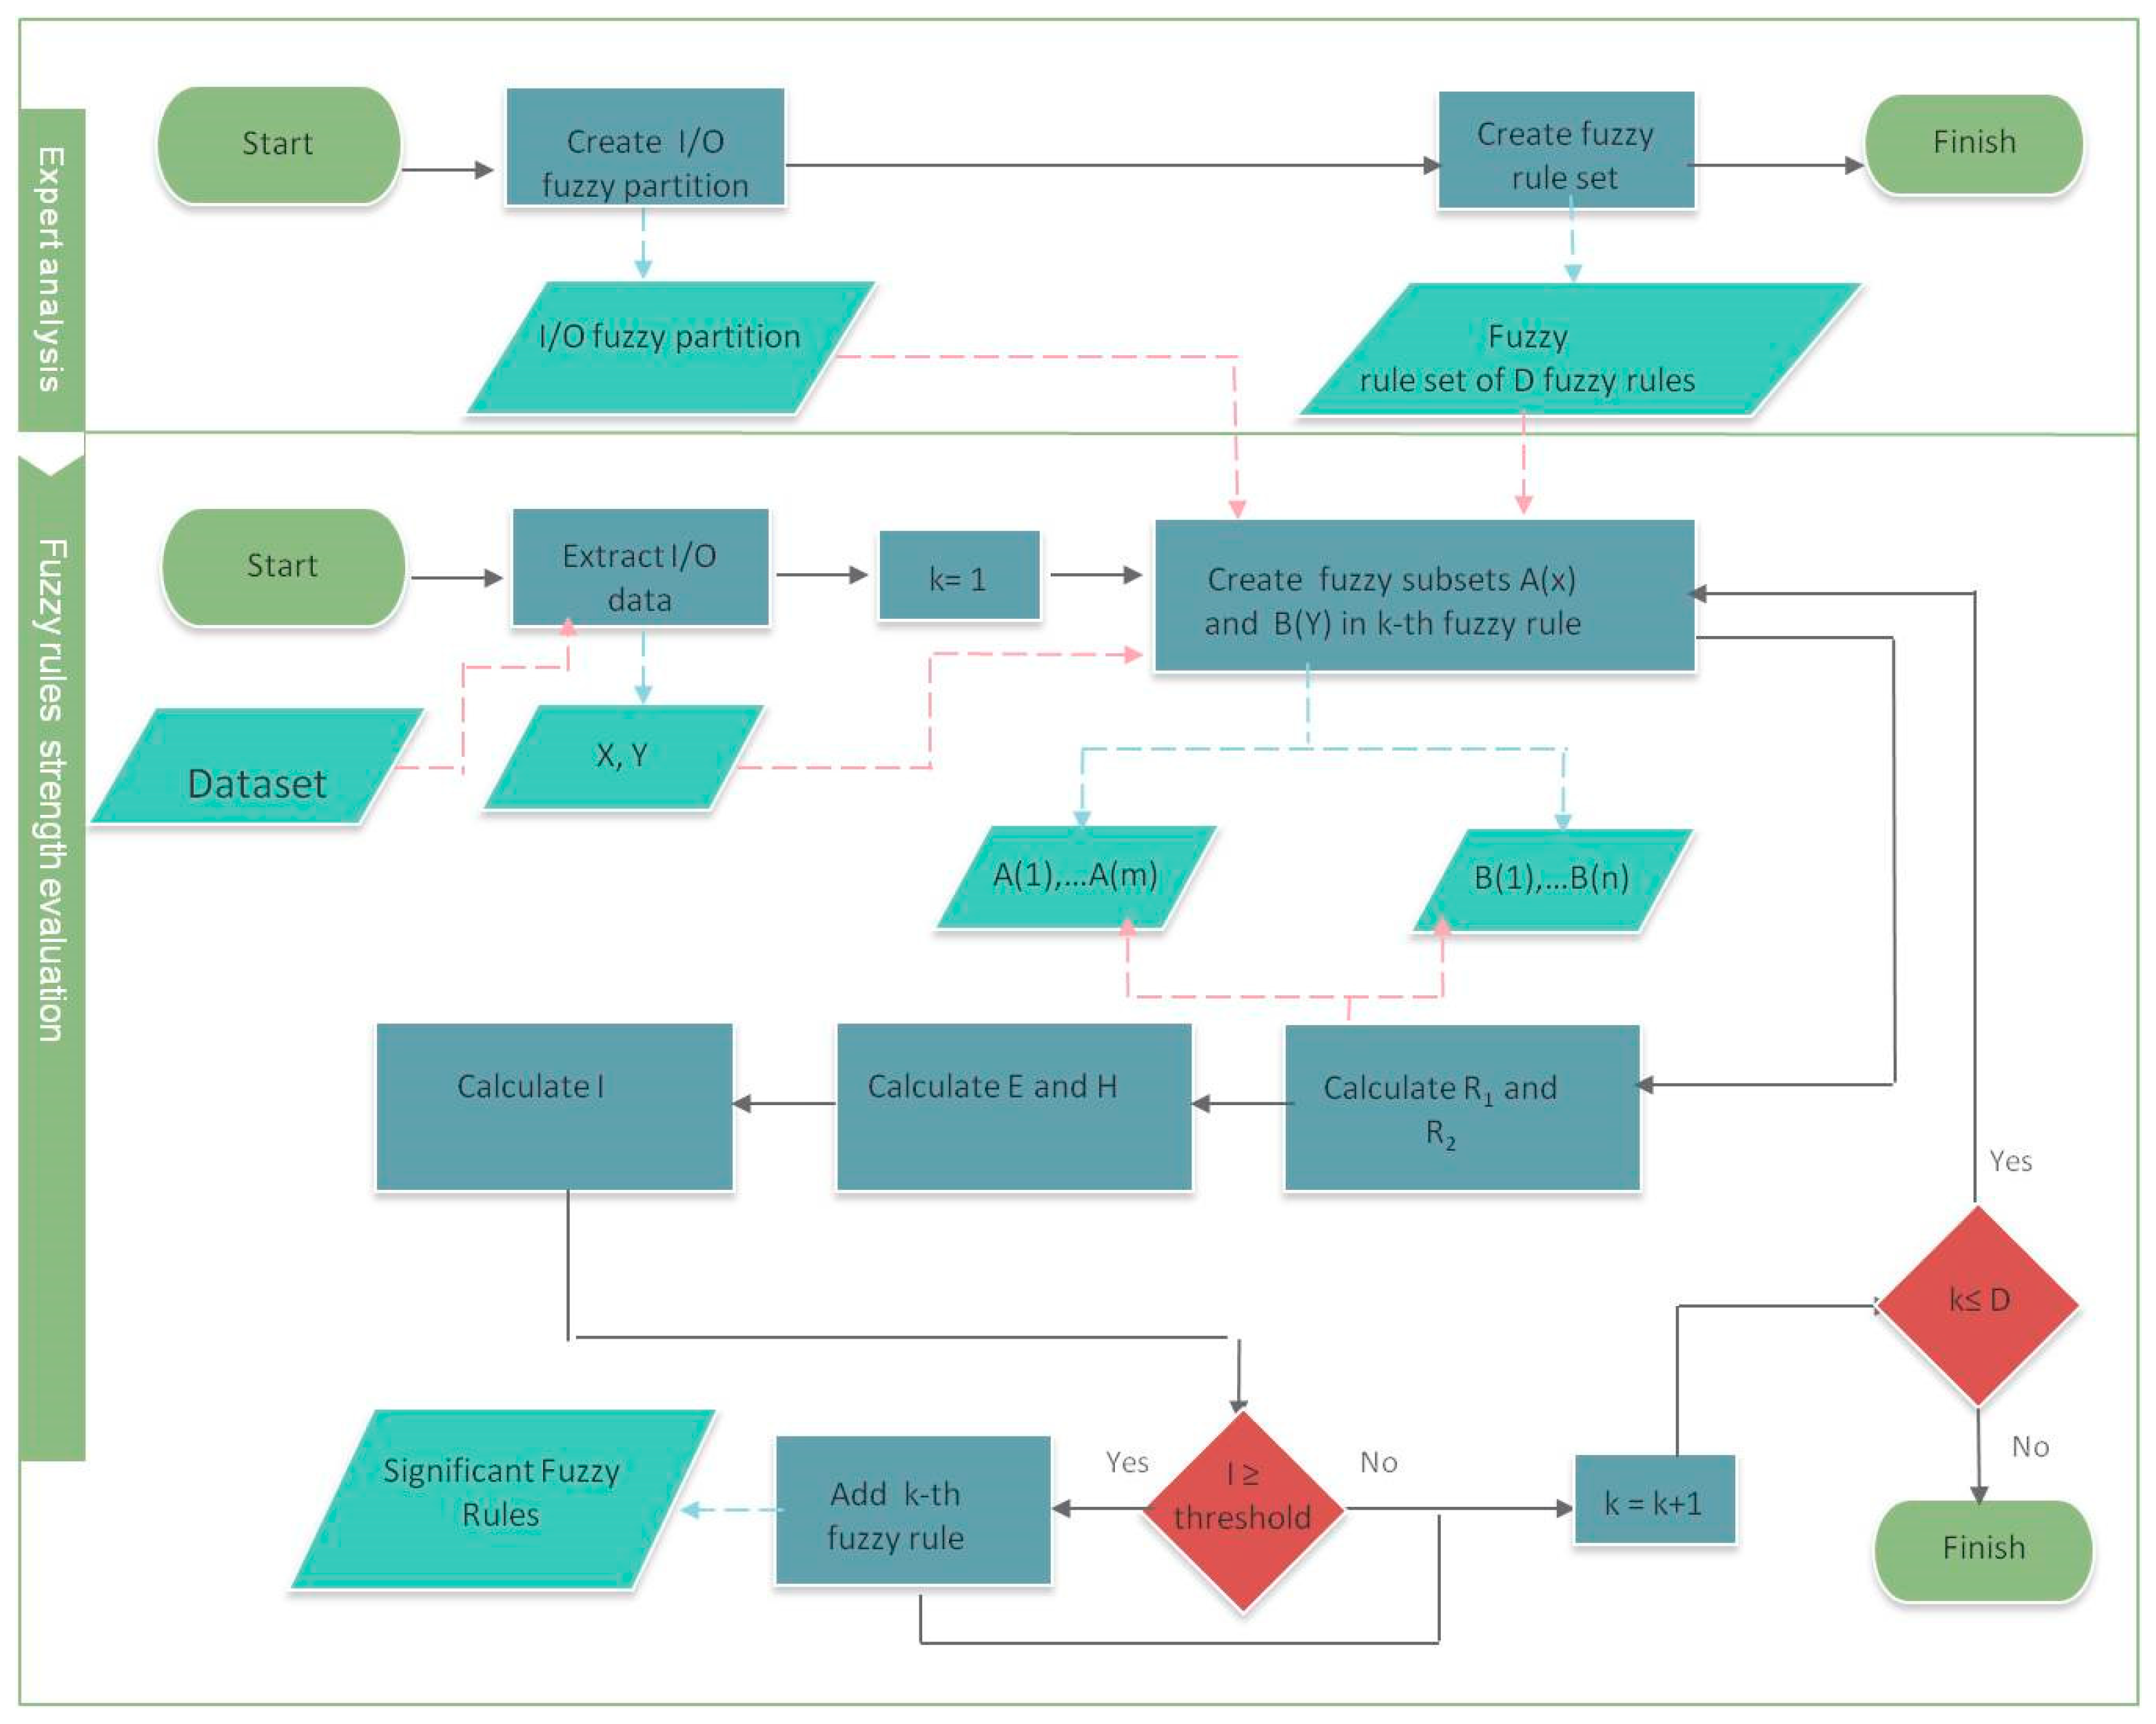
Figure 1, this process is schematized.
The continuous black arrows are related to two processes: the red arrows symbolize the use of data in input and the black arrows symbolize the use of data in output.
In the first phase, the expert creates the fuzzy partition for U
x and U
y and creates the fuzzy rule set. Then, the expert analyzes each fuzzy rule with respect to a set of data. For the input-output pair (A
w,B
z), A
w(x
1), …, A
w(x
m), B
z(y
1), …, B
z(y
n), the fuzzy relations R
1 and R
2, the Energy E, the Entropy H, and the index I are calculated. If the index I is greater or equal to a prefixed threshold, then the rule is considered to be significant to the fuzzy rule set with respect to the input/output data. We can generalize this model to the case in which two or more input variables are considered. The generalized form of a fuzzy rule is given by the form:
where
, l = 1, …, v, is a fuzzy set of the fuzzy partition of the universe of the discourse of the input variable.
For each pair
, we calculate the corresponding indices
for l = 1, …, v and assign a measure of strength of the fuzzy rule with respect to the data given by:
Below we show the pseudocode of the algorithm (Algorithm 3).
| Algorithm 3 Energy-Entropy fuzzy rules evaluation |
| Description: | | Calculate the matrix R2 |
| Input: | | X, Y, A, B |
| Output: | | R2 |
| 1 | SET Ith // set the threshold value |
| 2 | FOR k = 1 TO D // for all the D fuzzy rules in the dataset |
| 2 | { |
| 3 | Imin: = 2; // Imin is initialized to a value greater than 1 |
| 4 | Create the fuzzy subsets Bz(y1),…, Bz(yn); |
| 5 | FOR l = 1 to v |
| 6 | { |
| 7 | Create the fuzzy subsets A(l)wl(x1),…, A(l)wl(xm); |
| 8 | Calculate R1 and R2; |
| 9 | Calculate E and H; |
| 10 | Calculate I; |
| 11 | IF (I < Imin) |
| 12 | Imin = I; |
| 13 | } |
| 14 | IF (Imin ≥ Ith) |
| 15 | Annotate the k-th fuzzy rule as significant; |
| 16 | } |
| 17 | END |
The threshold value I
th can be settled by the expert by using an opportune calibration. This calibration can be obtained by testing the algorithm applied on a sample dataset for which the expert can evaluate the strength of fuzzy rules with respect to the data. In
Section 4, we present some results obtained by using various datasets. The first experiment is used for calibrating the threshold value I
th. Obviously the computational time is polynomial, being given by O(n·m·v).
4. Test Results
Here we use e(u) = u for u ∈ [0,1] and, in accordance with [
2,
3], the following fuzzy entropy:
and the Equation (5) with the Yager t-norm.
Our tests are applied to datasets extracted from the open data of the city of Naples (Italy) (
www.opendata.comune.napoli.it/) and from database of the 15° census population performed during 2011 on the Italian territory by the ISTAT (Italian Statistical National Institute), available at
http://dati-censimentopopolazione.istat.it. For brevity, we show the results obtained in two experiments.
The city of Naples is partitioned into 10 municipalities. In turn, each municipality includes a set of districts, as listed in
Table 1.
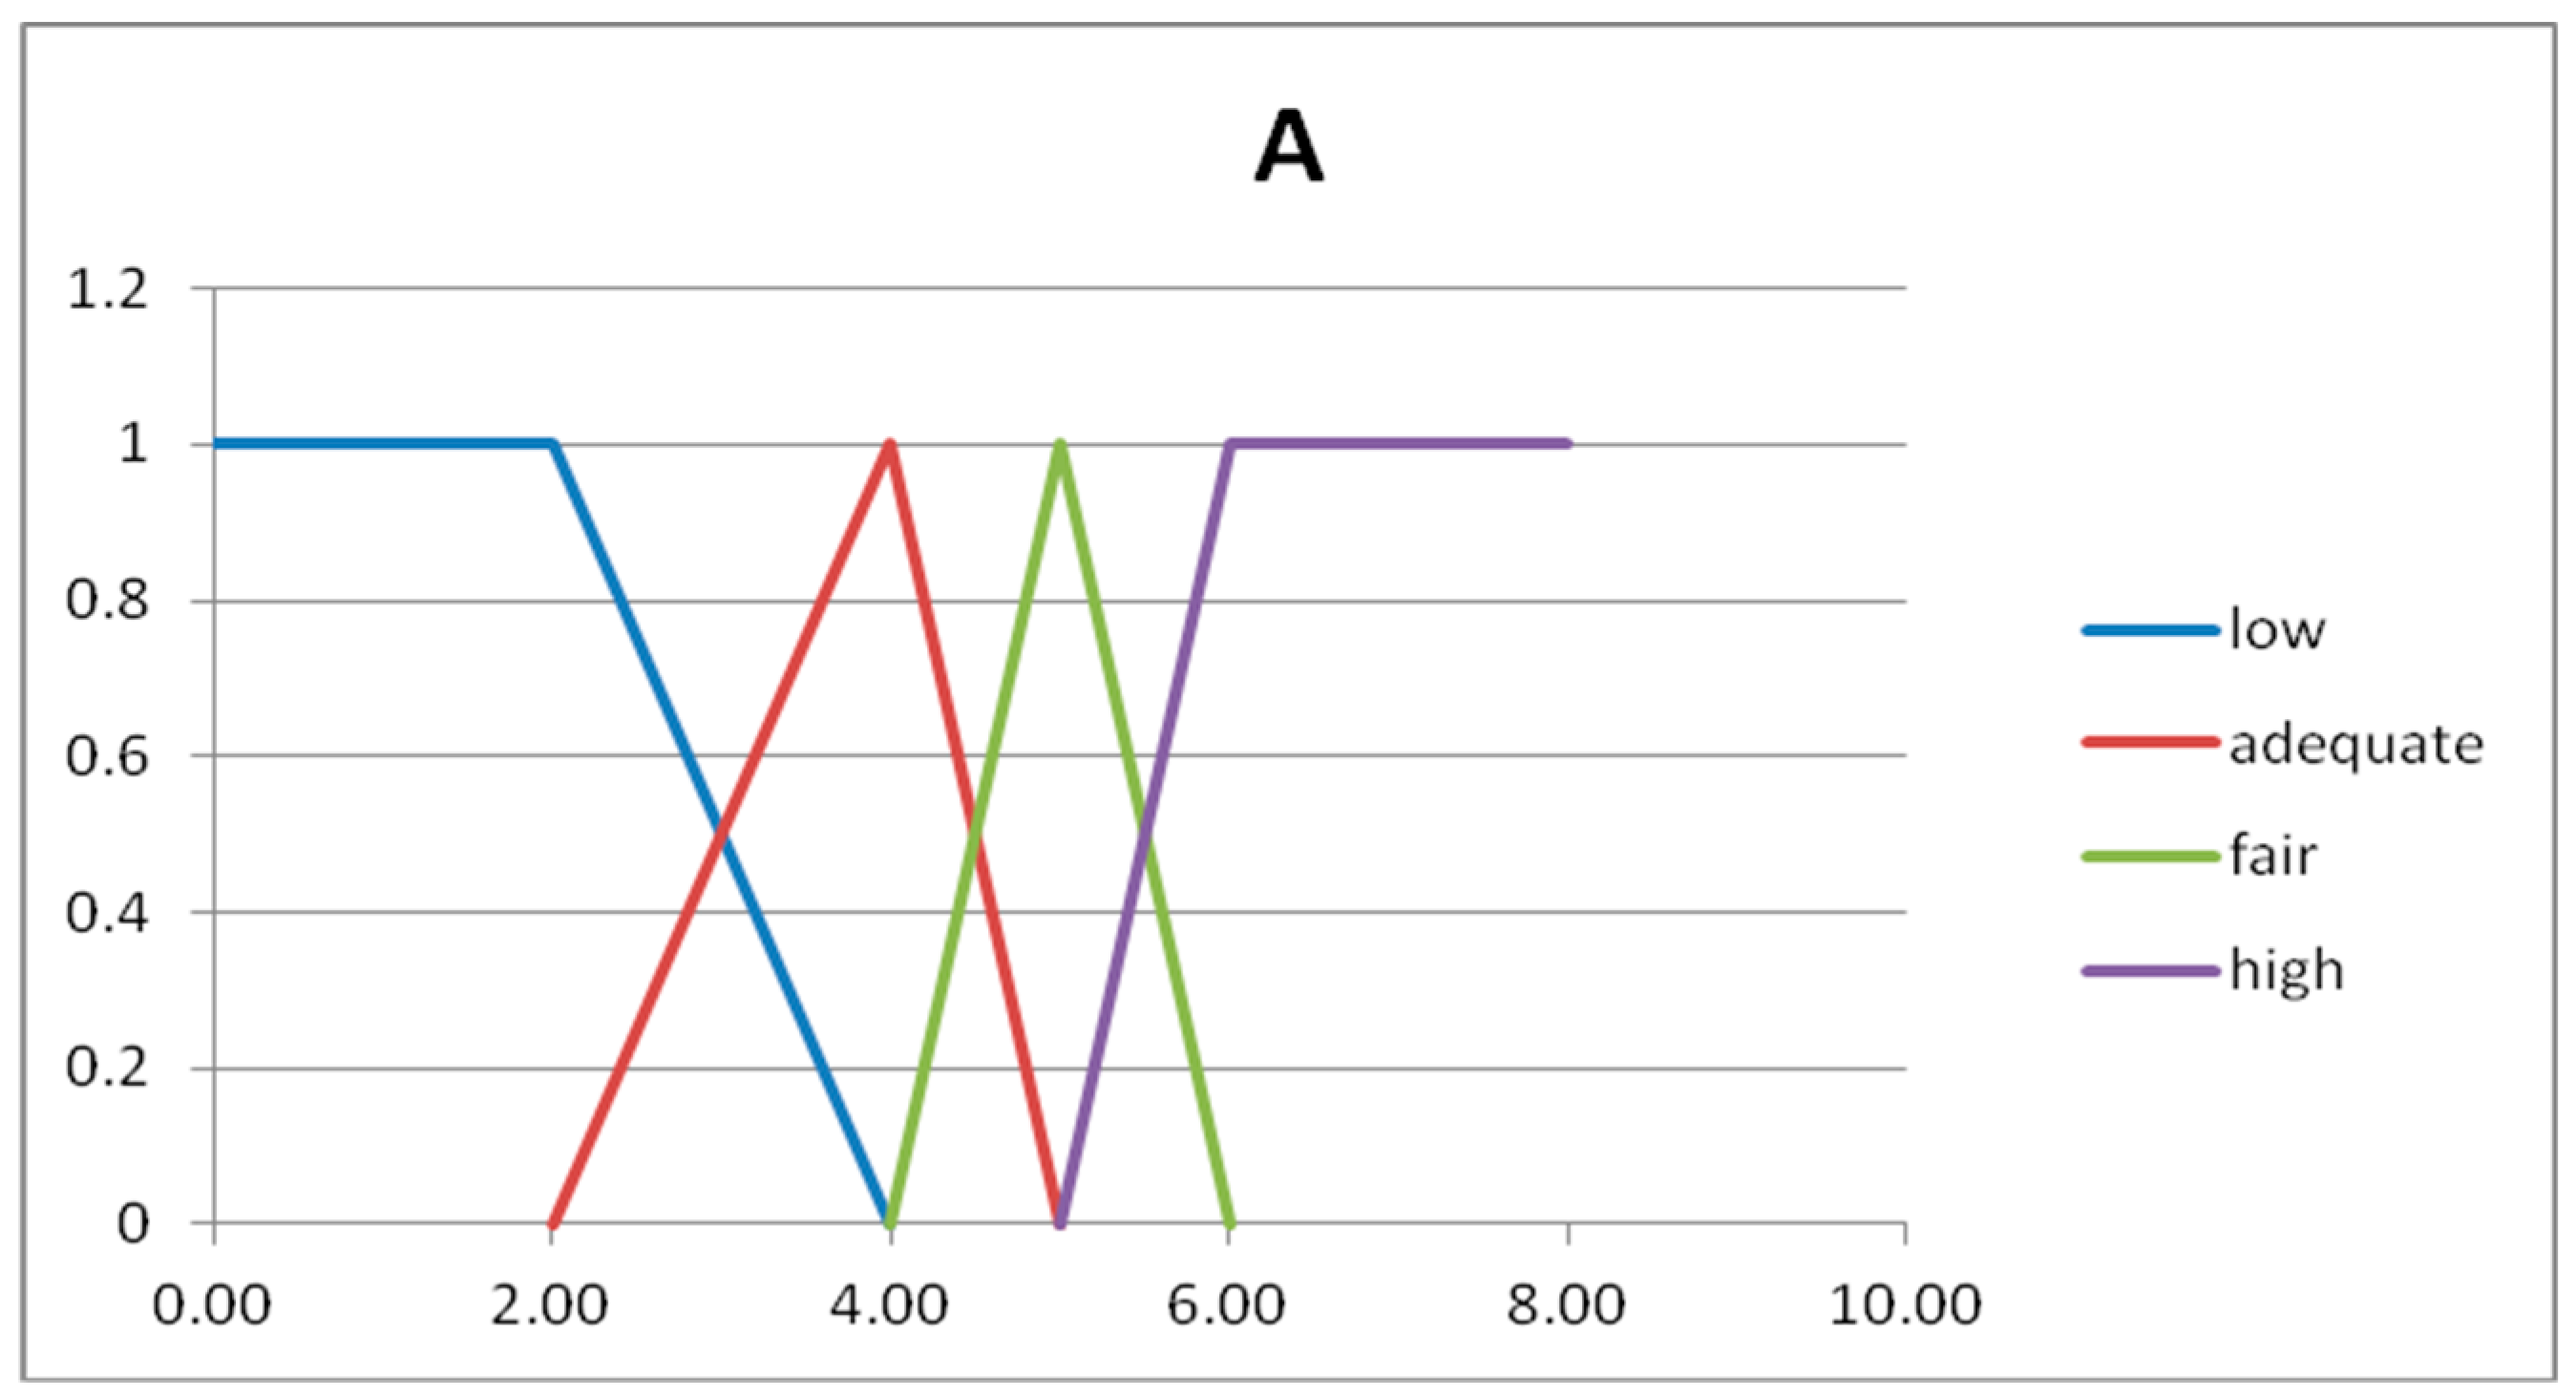
In the first experiment, we consider the input x = Percentage of inhabitants with less than 5 years old and the output y = Number of public kindergartens. The data extracted are shown in
Table 2.
The fuzzy partitions are composed by fuzzy numbers given by semi-trapezoidal or triangular fuzzy sets [
19]. The first and last fuzzy sets are semi-trapezoidal, and the intermediate fuzzy sets are triangular. The triangular fuzzy numbers are represented with three number, as A = (a
1,a
2,a
3) and B = (b
1,b
2,b
3). In
Table 3 we show the four fuzzy sets forming the fuzzy partition of the domain U
x.
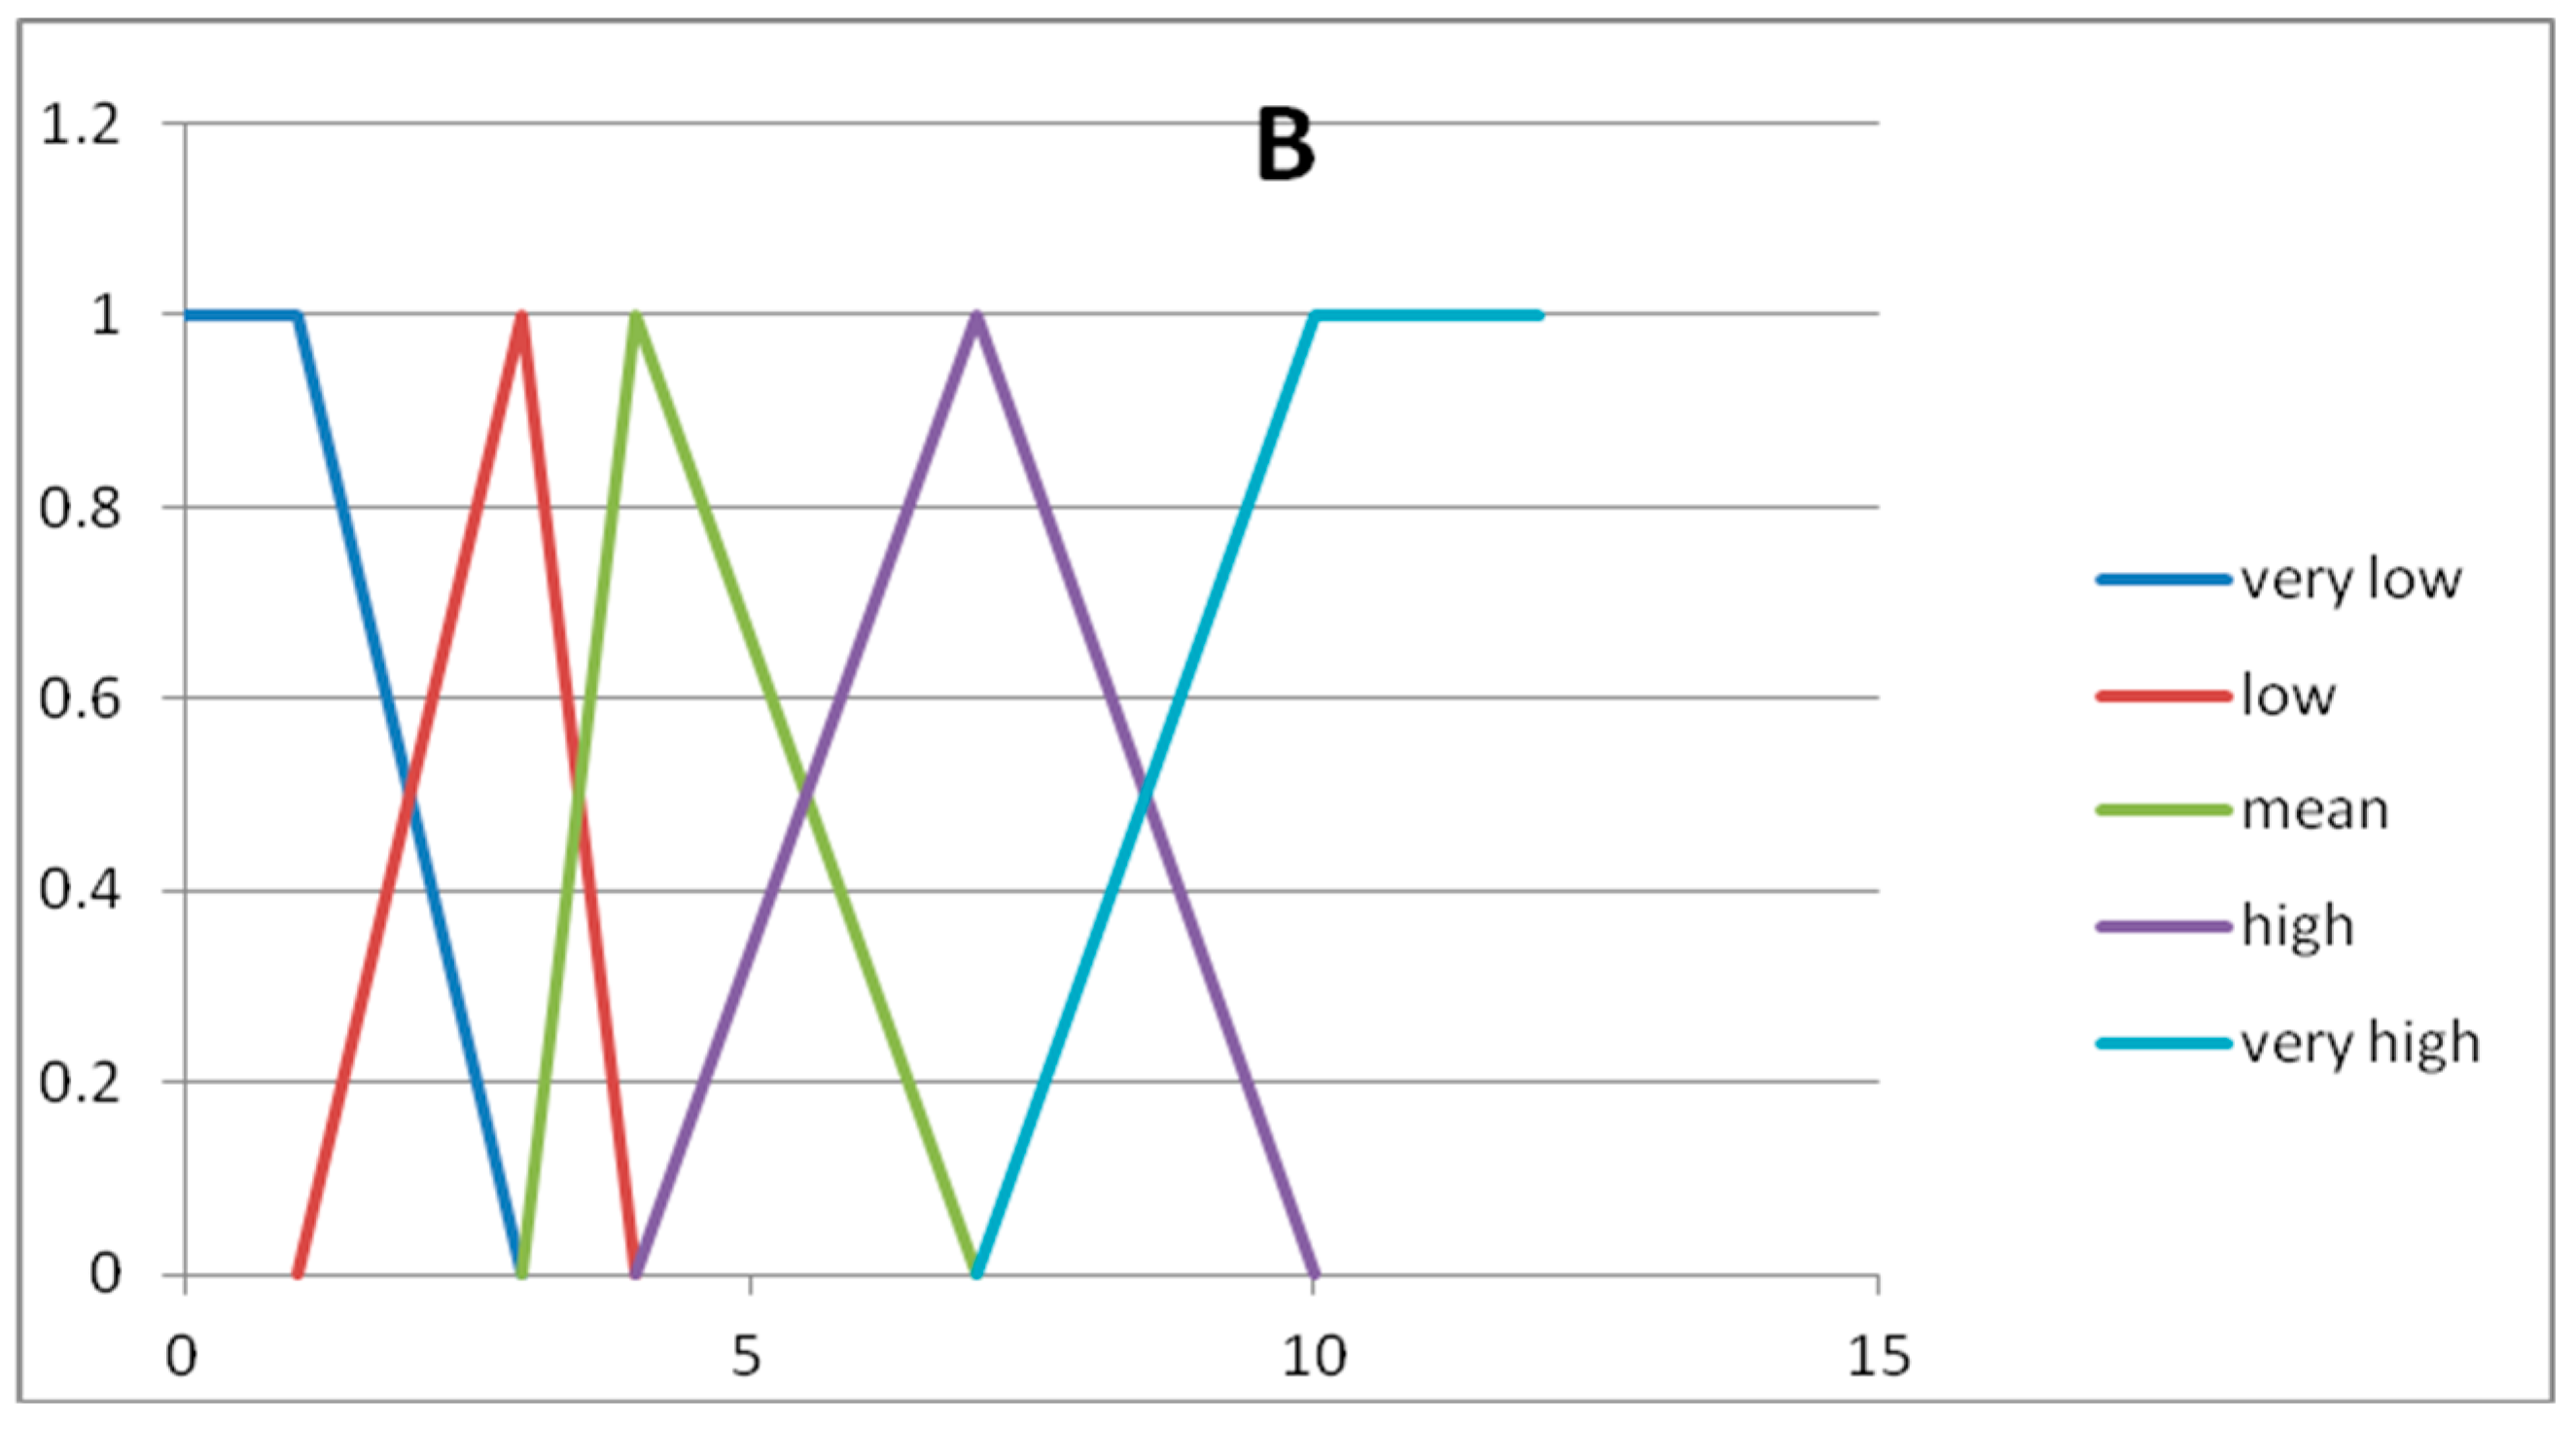
In
Table 4 we show the five fuzzy sets forming the fuzzy partition of the domain U
y.
In
Figure 2 and
Figure 3 we show the graphs of the fuzzy sets of the fuzzy partitions for the domains U
x and U
y, respectively.
The expert considers the following rules to be significant:
Rule 1 → IF A= low THEN B = very low
Rule 2 → IF A = adequate THEN B = mean
Rule 3 → IF A = fair THEN B = high
Then, the index of strength of each fuzzy rule is calculated.
Table 5 (resp.,
Table 6) shows E, H, I, corresponding to the three rules for p = 1 (resp., p = 2).
For calibrating the threshold value for the index I, after extracting the data x and y, the expert analyzes how each fuzzy rule appears consistent with respect to the data, i.e., which the degree of the fuzzy rule is confirmed from the data. He considers Rule 1 completely consistent with the data, and Rule 2 sufficiently consistent; therefore, Rule 3 is not sufficiently consistent with the data. For this reason, we set the threshold value to less or equal to the strength index I calculated for Rule 2. This value is 0.79 for p = 1 and 0.71 for p = 2. Then we set p = 2 and Ith = 0.7 in all the experiments.
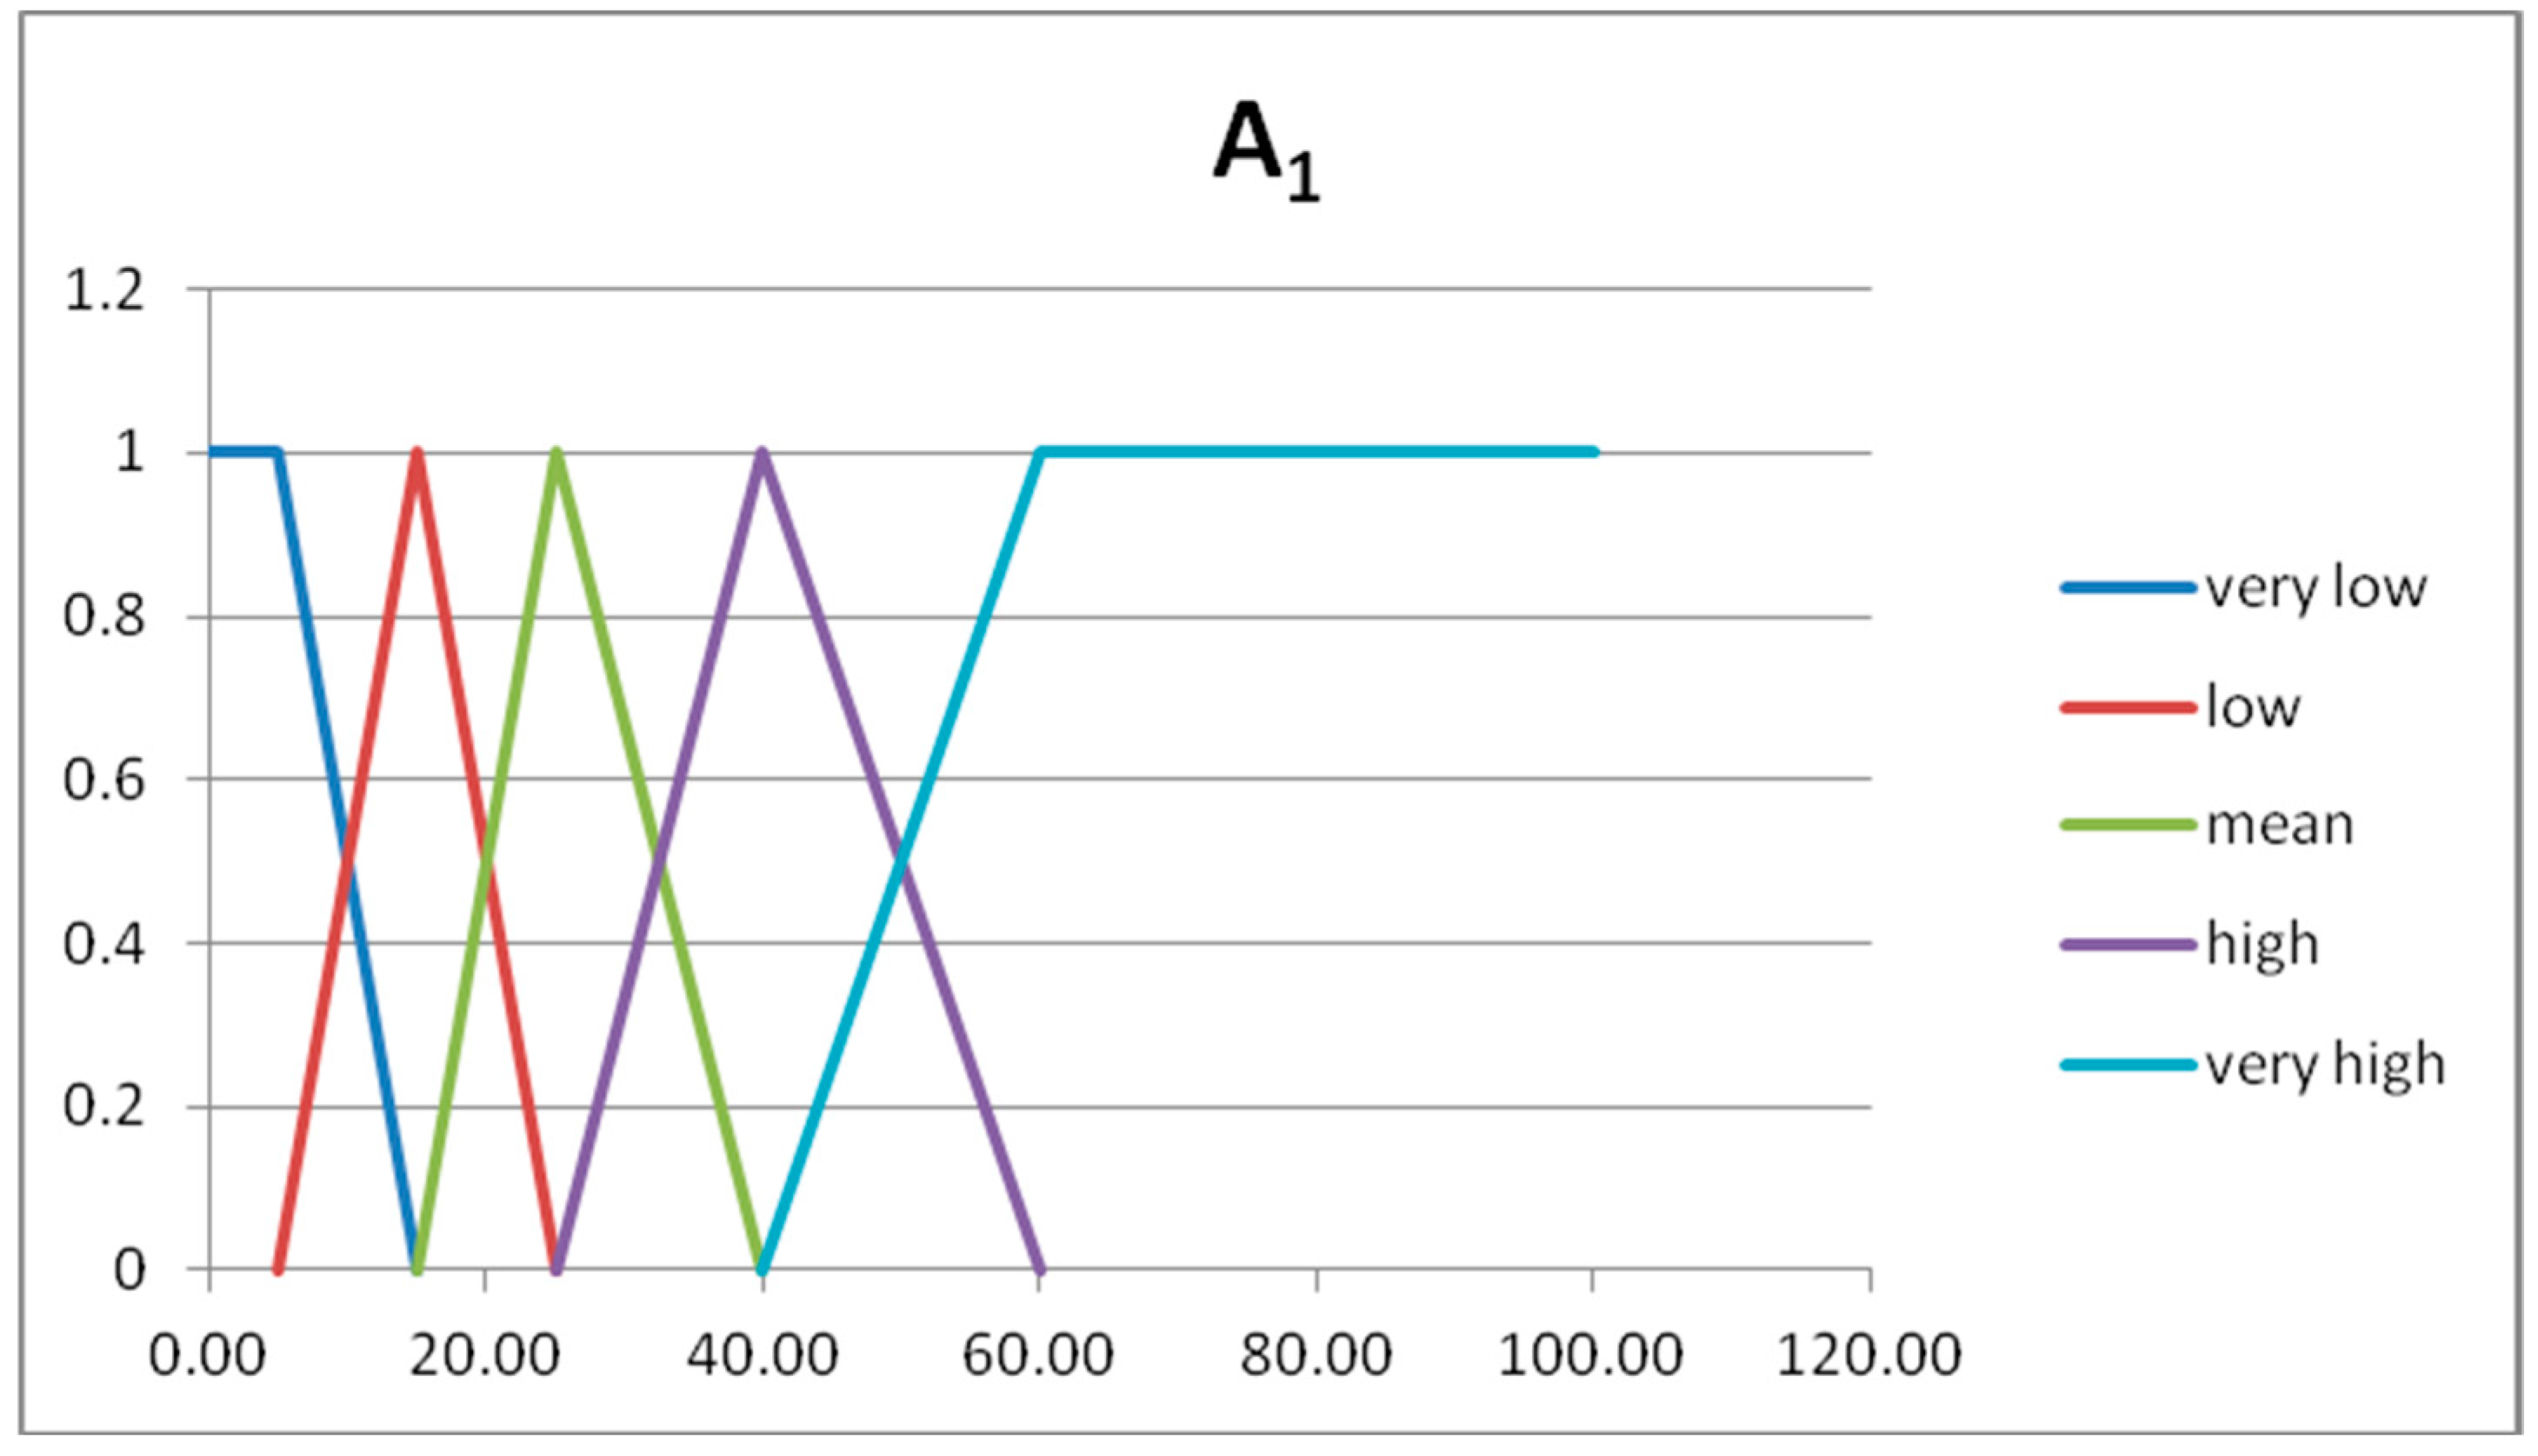
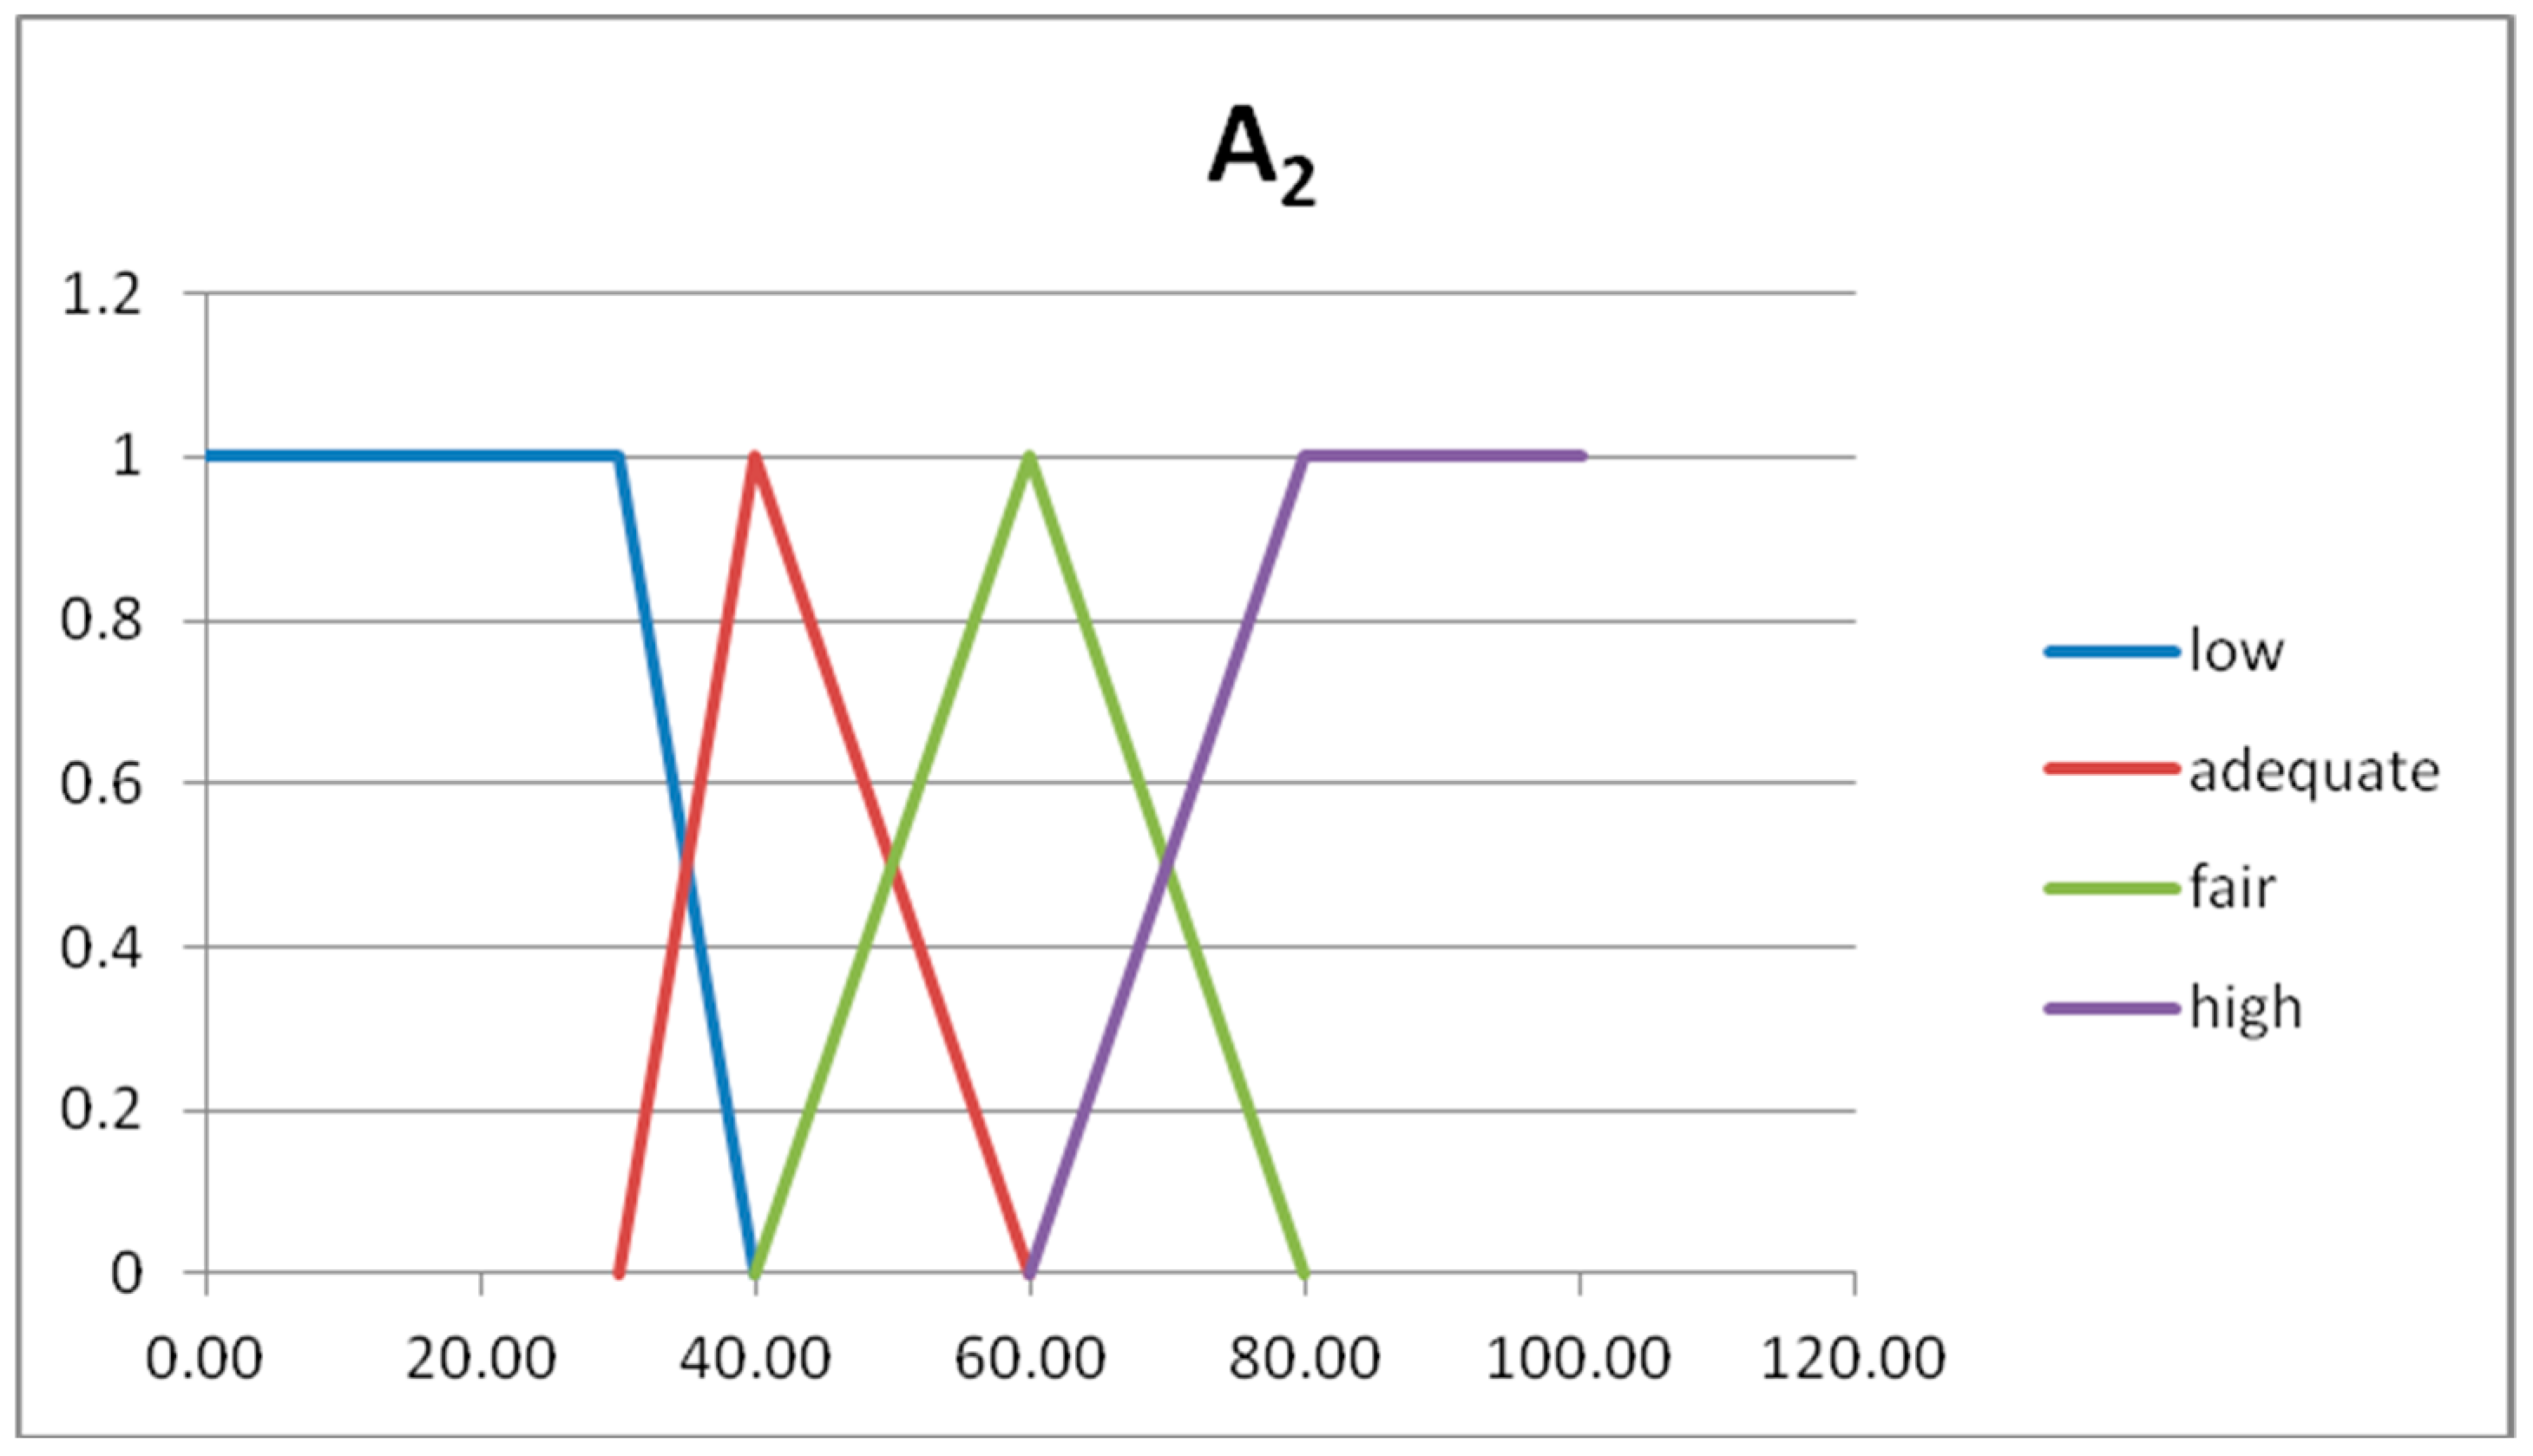
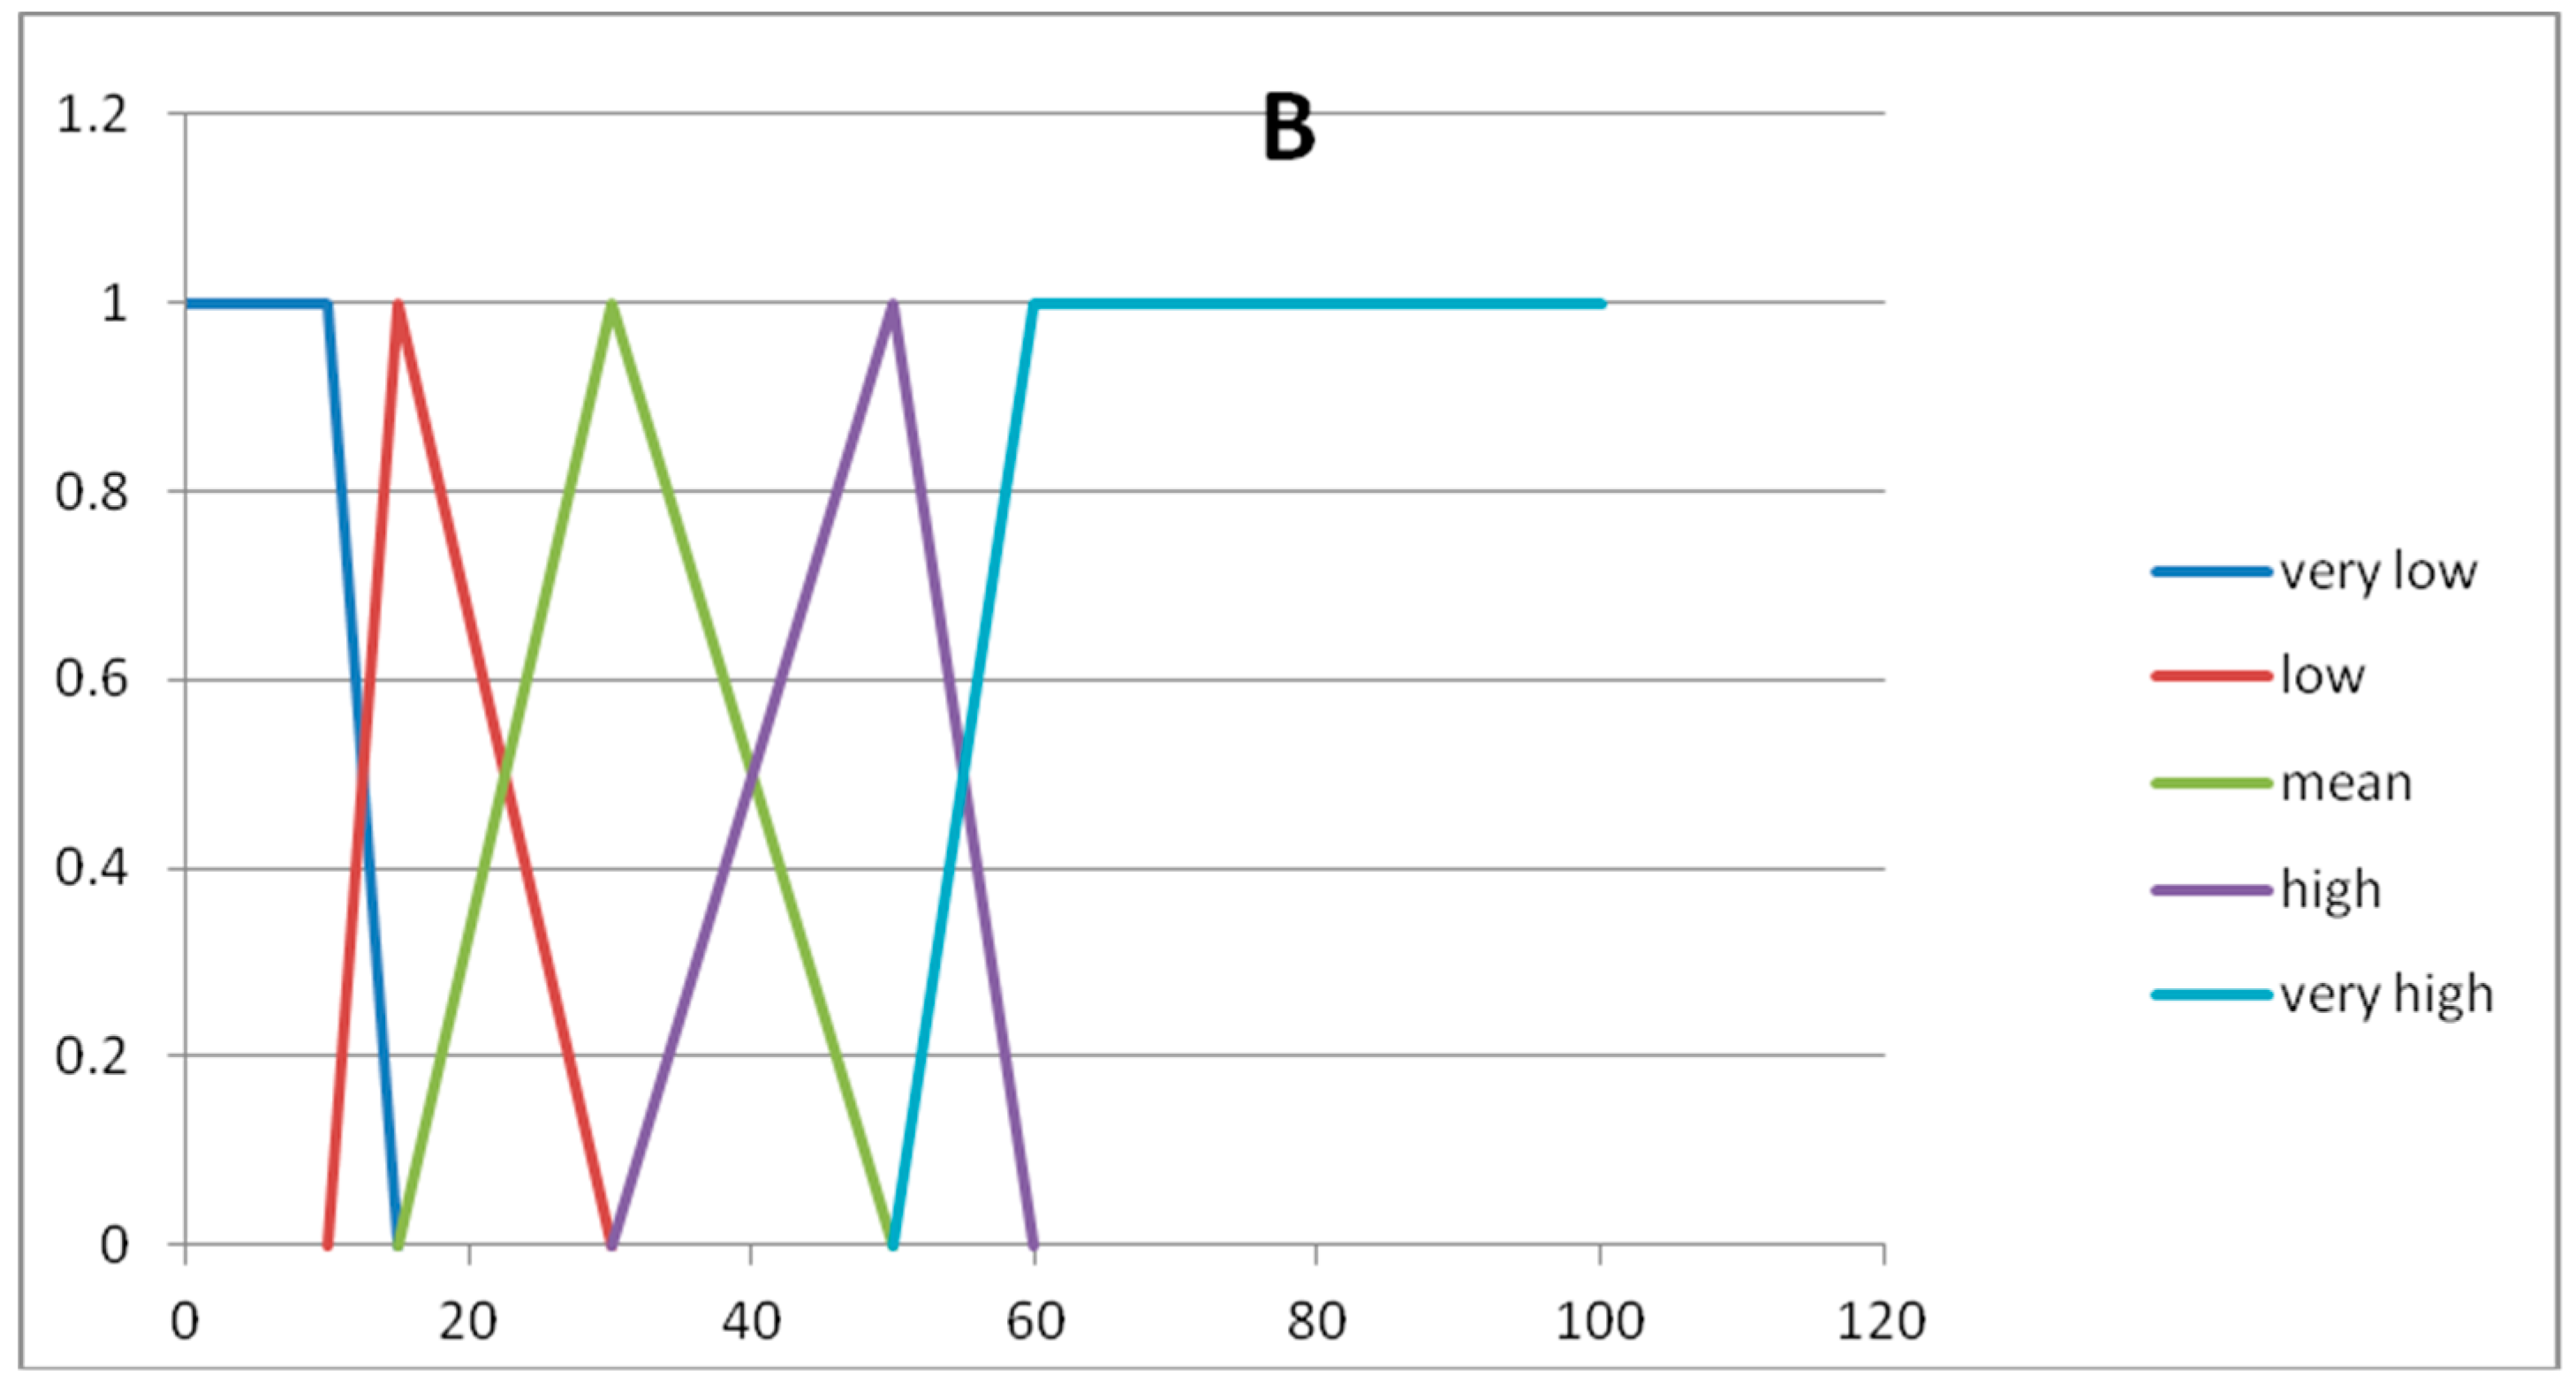
Below we present the results of the second experiment in which two input variables are considered. The inputs are the following: x1 = Percentage of families in residential properties with respect to the total resident families and x2 = Percentage of graduates with respect to the total workforce. The output is y = Unemployment rate.
In
Table 7, we show the data extracted for the 10 municipalities.
In
Table 8,
Table 9 and
Table 10, we show the fuzzy sets forming the fuzzy partitions of the domain U
x1, U
x2, U
y, respectively.
In
Figure 4,
Figure 5 and
Figure 6, we show the graphs of the fuzzy sets of the fuzzy partitions for the domains U
x1, U
x2, U
y, respectively.
The expert considers the following fuzzy rules:
Rule 1 →IF A1= very low AND A2 = low THEN B = very high
Rule 2 → IF A1= low AND A2 = low THEN B = high
Rule 3 → IF A1= mean AND A2 = adequate THEN B = mean
Rule 4 → IF A1= mean AND A2 = fair THEN B = mean
Rule 5 → IF A1= mean AND A2 = high THEN B = low
Rule 6 → IF A1= high AND A2 = fair THEN B = low
Rule 7 → IF A1= high AND A2 = high THEN B = very low
Rule 8 → IF A1 = very high AND A2 = high THEN B = very low
In
Table 11, we show the value of the index I calculated for any fuzzy rule (column I rule), when p = 2. For each pair
and
in the rule, we show the values of E, H, I.
The results in
Table 11 show that the final indices of the fuzzy rules are greater than the threshold I
th = 0.7, except for the fuzzy rules 1 and 2.
5. Conclusions
We present a new method that uses fuzzy energy and fuzzy entropy to evaluate the strength of fuzzy rules set by an expert, with respect to a set of data. We correlate the input and the output data via Equation (5), where t is the Yager t-norm, and calculate the corresponding relations which are solutions of (5) with maximum energy and minimum entropy.
After the processes of the creation of the fuzzy partitions of the input and output variable domains, and of the significant fuzzy rule set by the expert, a normalized index of the strength of each fuzzy rule with respect to the data is measured.
If this index is greater than a calibrated threshold, then the fuzzy rule is considered significant with respect to the data. We extend this approach to fuzzy rules in which there are two or more input variables. In this case, we calculate the index of strength separately for each pair of input and output, and we assign a best index of strength to the rule(s) having the minimum value of these indices. The results of some experiments are presented in order to show how our algorithm works inside a fuzzy rule set.


