Evaluating Sustainability of Regional Water Resources Based on Improved Generalized Entropy Method


School of Civil Engineering, Anhui Polytechnic University, Wuhu 241000, China
*
Author to whom correspondence should be addressed.
Entropy 2018, 20(9), 715; https://doi.org/10.3390/e20090715
Submission received: 2 August 2018
/
Revised: 14 September 2018
/
Accepted: 15 September 2018
/
Published: 18 September 2018
(This article belongs to the Special Issue Applications of Information Theory in the Geosciences II)
Abstract
:The sustainability of regional water resources has important supporting data needed for establishing policies on the sustainable development of the social economy. The purpose of this paper is to propose an assessment method to accurately reflect the sustainability of regional water resources in various areas. The method is based on the relative entropy of the information entropy theory. The steps are as follows. Firstly, the pretreatment of the evaluation sample data is required, before the relative entropy of each standard evaluation sample and evaluation grade (SEG) is calculated to obtain the entropy weight of each evaluation index. After this, the entropy weighted comprehensive index (WCI) of the standard evaluation grade sample is obtained. The function relation between WCI and SEG can be fitted by the cubic polynomial to construct the evaluation function. Using the above steps, a generalized entropy method (GEM) for the sustainable assessment of regional water resources is established and it is used to evaluate the sustainability of water resources in the Pingba and Huai River areas in China. The results show that the proposed GEM model can accurately reflect the sustainable water resources in the two regions. Compared with the other evaluation models, such as the Shepherd method, Artificial Neural Network and Fuzzy comprehensive evaluation, the GEM model has larger differences in its evaluation results, which are more reasonable. Thus, the proposed GEM model can provide scientific data support for coordinating the relationship between the sustainable development and utilization of regional water resources in order to improve the development of regional population, society and economy.
1. Introduction
Regional water resource sustainability (RWRS) is a state in which water resources can be recycled and renewed naturally according to the technical and economic levels and social production conditions [1,2], so that the regions can constantly provide water for industrial and agricultural production, but also protect people’s livelihood, as well as ecological and environmental factors [3,4,5]. Therefore, the assessment of RWRS is based on the comprehensive analysis of water resource characteristics, degree of guarantee, development and utilization of water resources in the basin, as well as the demand of water resources for industrial and agricultural production, people’s life and ecological environment [6,7,8]. Using the grade of RWRS, the relationship between water resources, river basin economy and population can be revealed and water resources can be reasonably and fully utilized. Thus, this allows economic construction and water resources protection to be carried out simultaneously, while social and economic sustainable development can be promoted [9,10].
When the grade of RWRS exceeds a certain threshold, it will seriously restrict regional sustainable development [11]. Therefore, it is important to accurately evaluate and diagnose regional water resources [12]. At present, the main methods for the comprehensive evaluation of the grade of RWRS include the artificial neural network method [13] (ANN), fuzzy comprehensive evaluation method [14] (FCE), Shepard method [15] (SP), etc. These methods have been used to evaluate the sustainable grade of RWRS from different perspectives. However, the evaluation results of these methods are often too close to distinguish the evaluation samples correctly and thus, are not conducive for formulating sustainable development policies [16]. In view of this problem, this paper intends to study an evaluation method based on the information entropy theory in order to increase the difference between evaluation results. This will ultimately allow us to better differentiate the sustainable evaluation results.
In information theory [17], the entropy value is usually used to measure the degree of disorder of a system, such as in a comprehensive evaluation system composed of evaluation samples and evaluation indicators [18,19,20]. The entropy method determines the weight of indicators according to the information provided by various indicators; makes full use of the difference information provided by various evaluation samples [21]; and can be used for many applications in the evaluation of water resources system or ecology system [22,23,24,25,26].
However, the entropy method only uses the different information between samples under a certain index and does not take into account the different information between the comprehensive evaluation results [27]. This may also lead to the problem of an excessively small difference degree of evaluation results, meaning that the evaluation results cannot accurately reflect the subtle differences between samples to be evaluated [28,29]. By analyzing the evaluation process of the entropy method, we found that the entropy method actually implies a hypothesis in its application. Essentially, it believes that the comprehensive evaluation value results are uniformly distributed and there is no difference between different samples, which is obviously not consistent with the target of significant differences between the comprehensive values of the actual sample. This may also be the main reason why the evaluation results of other methods are not distinguishable.
Therefore, we propose the hypothesis that when establishing the comprehensive evaluation function with the standard evaluation grade sample, it is necessary to differentiate the comprehensive evaluation results. Thus, we can use the generalized entropy weight to measure the differences in order to build the comprehensive evaluation model. In this paper, the data series of each sample under each index and the series of standard evaluation grades (SEG) are obtained respectively through data pretreatment [30]. After this, the relative entropy method in the information theory is used to calculate the relative entropy value (REV) between each index and SEG one by one, before the degree of proximity between each index and SEG is obtained successively. Relative entropy [31] (which is also called the Kullback–Leibler divergence) is a measure of how one probability distribution is different from a second reference probability distribution. In a simple case, a relative entropy value of 0 indicates that we can expect similar behavior in two different distributions.
Obviously, a closer distribution between the sample value of an index and the SEG indicates that the corresponding index should be given a larger weight [2,32]. According to the REV of each index, the entropy weight of each index is obtained by normalization in order to calculate the weighted comprehensive index (WCI), before the Generalized Entropy Method (GEM) is constructed.
For grading evaluation problems, the distribution of SEG constitutes the prior distribution of the comprehensive evaluation value [3,4]. For clustering evaluation problems, prior information of the SEG distribution cannot be found [2], so we could assume that SEG is uniformly distributed according to the principle of maximum entropy in the information theory.
In general, the purpose of this paper is to establish an assessment method to improve the discrimination degree of evaluation results. In this method, the relative entropy theory is used to measure the degree of proximity between the evaluation index series and the SEG series in order to calculate the weight of each index. The second part of this paper introduces the main steps of the GEM method and the two study areas of sustainable utilization of regional water resources. Section 3 shows the results of pretreatment, weight solution and evaluation, respectively. Section 4 discusses the rationality of GEM method evaluation results and the comparison with SP and other methods. This study is expected to provide guidance for coordinating the sustainability of regional water resources.
2. Materials and Methods
2.1. Generalized Entropy Method
The index system could be described as the matrix , where xij is the evaluation index j in i-th region; nj is the number of evaluation indices; and ni is the total number of regions. The SEG could be described as , where yi is the standard grade of i-th region.
There are only a few standard evaluation grade samples in the standard grade criteria, which are not enough to establish the evaluation function. The solution of this study is to use the Monte Carlo random method to produce standard evaluation samples according to the literature [15,33]. However, the premise of using the random method to generate evaluation samples is that the evaluation index should have an upper and lower interval in each evaluation grade. Therefore, within each evaluation grade, 10 evaluation index values were randomly generated by using uniform random numbers.
The process to establish the GEM model for the evaluation of RWRS included the following five steps.
Step 1: Data preprocessing
In this step, the data of the evaluation system will first be consistently processed, before being normalized. Firstly, all indicators are processed into consistent data of the same direction. For example, for the j-th indicator, the smaller the better type is; for other indicators, the bigger the better type is. Thus, the indicator j can be treated as the bigger the better type, which is consistent with other indicators as described in Equation (1).
where, represents the processed evaluation data of the i-th sample under the j-th index respectively; max(xij) represents the maximum value of each sample in the j-th index. It needs to be noted that the indicators of the bigger the better type are not needed to process by Equation (1). After the consistency processing, all the indicators become the bigger the better type.
In order to calculate the relative entropy value (REV), it is necessary to normalize the consistent indexes series xij and the SEG yi series. The normalization value of the i-th sample under j-th index pij can be calculated as:
The normalization value of the i-th sample of SEGi can be calculated as:
where Sum_y is the sum of the standard grade yi.
Step 2: Weight calculation of each indicators
First, the REV of each index is calculated. The approximate extent of the standard sample series pij and series SEGi under the index j, REVj, can be calculated according to relative entropy [31].
When the j-th sample series distribution pij is the closest to that of the SEG series SEGi, REVj is the smallest. This indicates that the index has a greater weight in the comprehensive evaluation system and 1-REVj could be regarded as an important degree of the j-th index [34]. Therefore, the weight value of the j-th index wj can be calculated as:
Step 3: Calculation of the weighted comprehensive index (WCI)
The formula for the WCI of the i-th standard evaluation sample is describes as follows:
where pij is the standard evaluation sample data. However, Equation (6) can also be used for the sample to be evaluated when the regional water resource sustainability evaluation is carried out.
Step 4: Determination of the evaluation function
WCI is a composite index that ranges from 0 to 1, which cannot yet correspond to specific sustainability levels. In order to determine the sustainability grade value of the regional water resources to be evaluated, it is also necessary to establish the mapping relationship between the series of WCIi and SEGi, which is called the regional sustainability index SEGi = f(WCIi). By observing the scatter distribution relation between the WCIi and SEGi series, the polynomial curve or logistic curve can be used for curve fitting. In this paper, the cubic polynomial curve was used for simple calculation [16].
where a, b, c and d are the parameters of cubic polynomials, which can be solved by the optimization algorithm based on accelerated genetic algorithm [34] (AGA).
Step 5: Assessment of regional water resources sustainability
Let matrix R = (rij)nk×nj be the evaluation system of regional water resources sustainability (RWRS) assessment system, which has nk areas. According to Equations (1)–(6), the WCI values of each region to be evaluated are obtained. Meanwhile, the corresponding SEG value is calculated according to Equation (7). However, each regional SEG needs to be renormalized to obtain the grade of RWRS GRWRS using Equation (8).
A smaller GRWRS of a region indicates better water resource sustainability of the region. On the contrary, a larger GRWRS represents worse sustainable water resources and countermeasures are needed to coordinate the sustainable development of economy, society and other systems.
2.2. Materials
2.2.1. Evaluation System
The factors that are influencing the regional water resources sustainability and China’s water supply and demand were analyzed systematically. Based on previous research [13,14,15], the evaluation index system consisting of seven evaluation indices (X1–X7) and four corresponding grade criteria were constructed (Table 1).
The indicators X1–X5 are of the type in which a higher value indicates a better result. Thus, a higher index value represents a better sustainable utilization state. The indicators X6–X7 are of the type in which a smaller value indicates a better result. Thus, a smaller value represents a better sustainable utilization state. The sustainable utilization state of grade 1 is the best, while the worst state grade corresponds to grade 4.
2.2.2. Study Regions
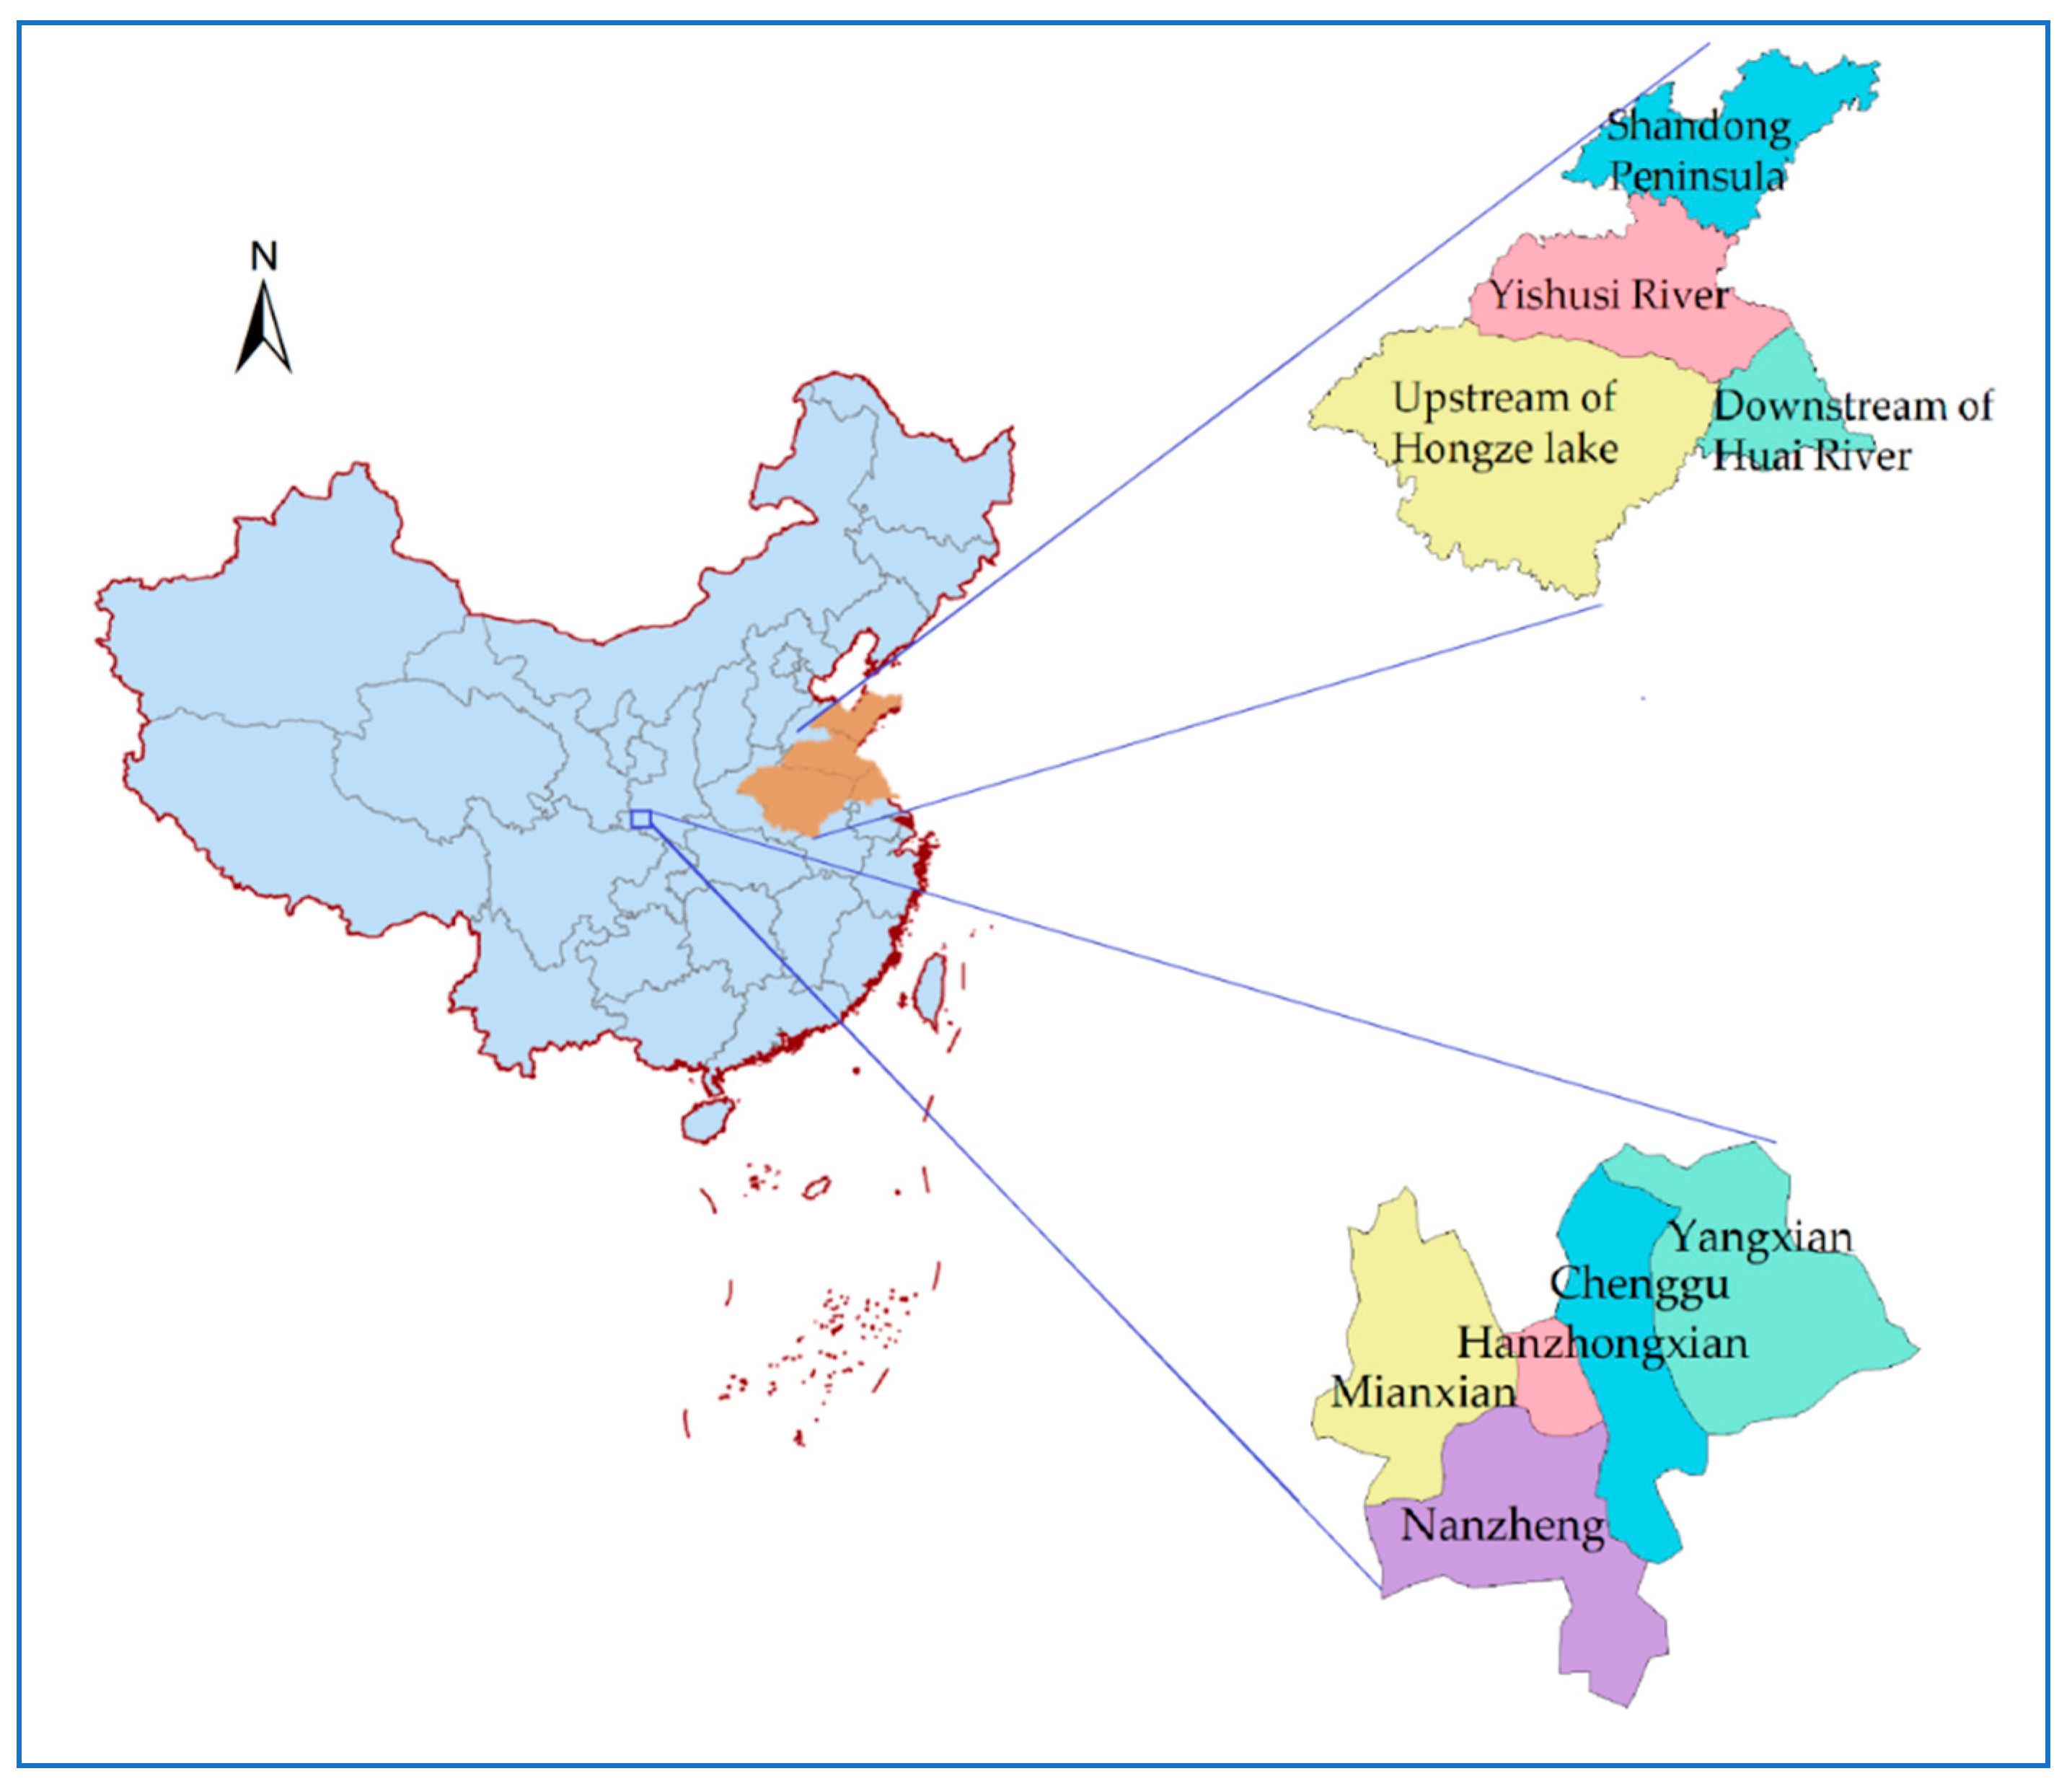
In order to carry out the comparative analysis with other evaluation methods, we used the six regions in the Pingba district of The Hanzhong basin, as reported in study [13] and the six regions in the Huai river basin reported in studies [14,15] as examples. The proposed GEM method was used to evaluate the grade of RWRS of each region.
The Hanzhong basin (Figure 1) is located in 106°35′–107°42′ E, 32°57′–33°15’ N. It belongs to a semi-arid and semi-humid area, which is located in the transitional zone between the subtropical zone and warm temperate zone. It has an average annual precipitation of 890 mm, an average annual runoff of 5.1 × 10⁸ m3 and a total groundwater resource of 7.47 × 10⁸ m3. Furthermore, there are many river systems and water conservancy facilities located in this basin.
The Huai River region (Figure 1) is located in north latitude 31–38° and belongs to the warm temperate semi-humid monsoon climate zone. It is composed of the two major river systems of Huai River and Yishusi River, with an average annual rainfall of 880 mm, total surface water resources of 62.1 billion m3 and total groundwater resources of 21.4 billion m3.
With the development of economy and population, the contradiction between the demand and supply of water resources in the Hanzhong basin and Huai River region has become increasingly obvious. The study on the sustainable utilization of water resources in these two regions is of great significance to further develop and utilize water resources in this region and alleviate the differences between water supply and demand.
In Table 2, Pingba covers the whole region of Mianxian, Hanzhongxian, Nanzheng, Chenggu and Yangxian. All of the Huai River basin includes upstream of Hongze Lake as well as downstream of Huai River basin and Yishusi river. The district of Huai River includes all of the Huai River basin and Shandong Peninsula.
3. Results
3.1. Random Generation of Standard Evaluation Samples and Data Preprocessing
In Grade 1, the upper limit of the water supply module X4 is set as 350 (104 m3/km2) and the upper limit of water demand module X5 is set as 200 (104 m3/km2). We select the upper and lower limits of the other indicators according to their physical meanings. The evaluation sample matrix X and the standard evaluation grade series Y of 40 standard evaluation samples were obtained, as shown in Table 3. Due to the confines of this paper and layout, Table 3 only provides some of the data.
In Table 3, columns 7 (X6) and 8 (X7) are the smaller and better type indicators, while Equation (1) is adopted for consistent pretreatment. For column 7 data, 2971.9 (104 m3/person) is divided by each number. For column 8 data, we use 5.0% divided by each number. After this, all the standard evaluation samples were normalized according to Equation (2). Due to the length of calculation, the preprocessed data is not listed here.
3.2. Relative Entropy and Index Weight
As shown in Table 4, the REV of X3 is the smallest at 0.145, which indicates that the evaluation sample distribution of this index is the closest to the SEG distribution. Thus, it is necessary to assign a large weight of 0.172 to X3. However, the REV of X6 is the largest, which indicates that the sample distribution of the index evaluation is quite different from that of the SEG distribution. Thus, the weight of this index is the smallest at only 0.096. After the calculation of each index weight wj, X3 plays the most important role in improving the sustainability of regional water resources, which needs to be considered in guiding policy formulation, followed by X1, X2, etc.
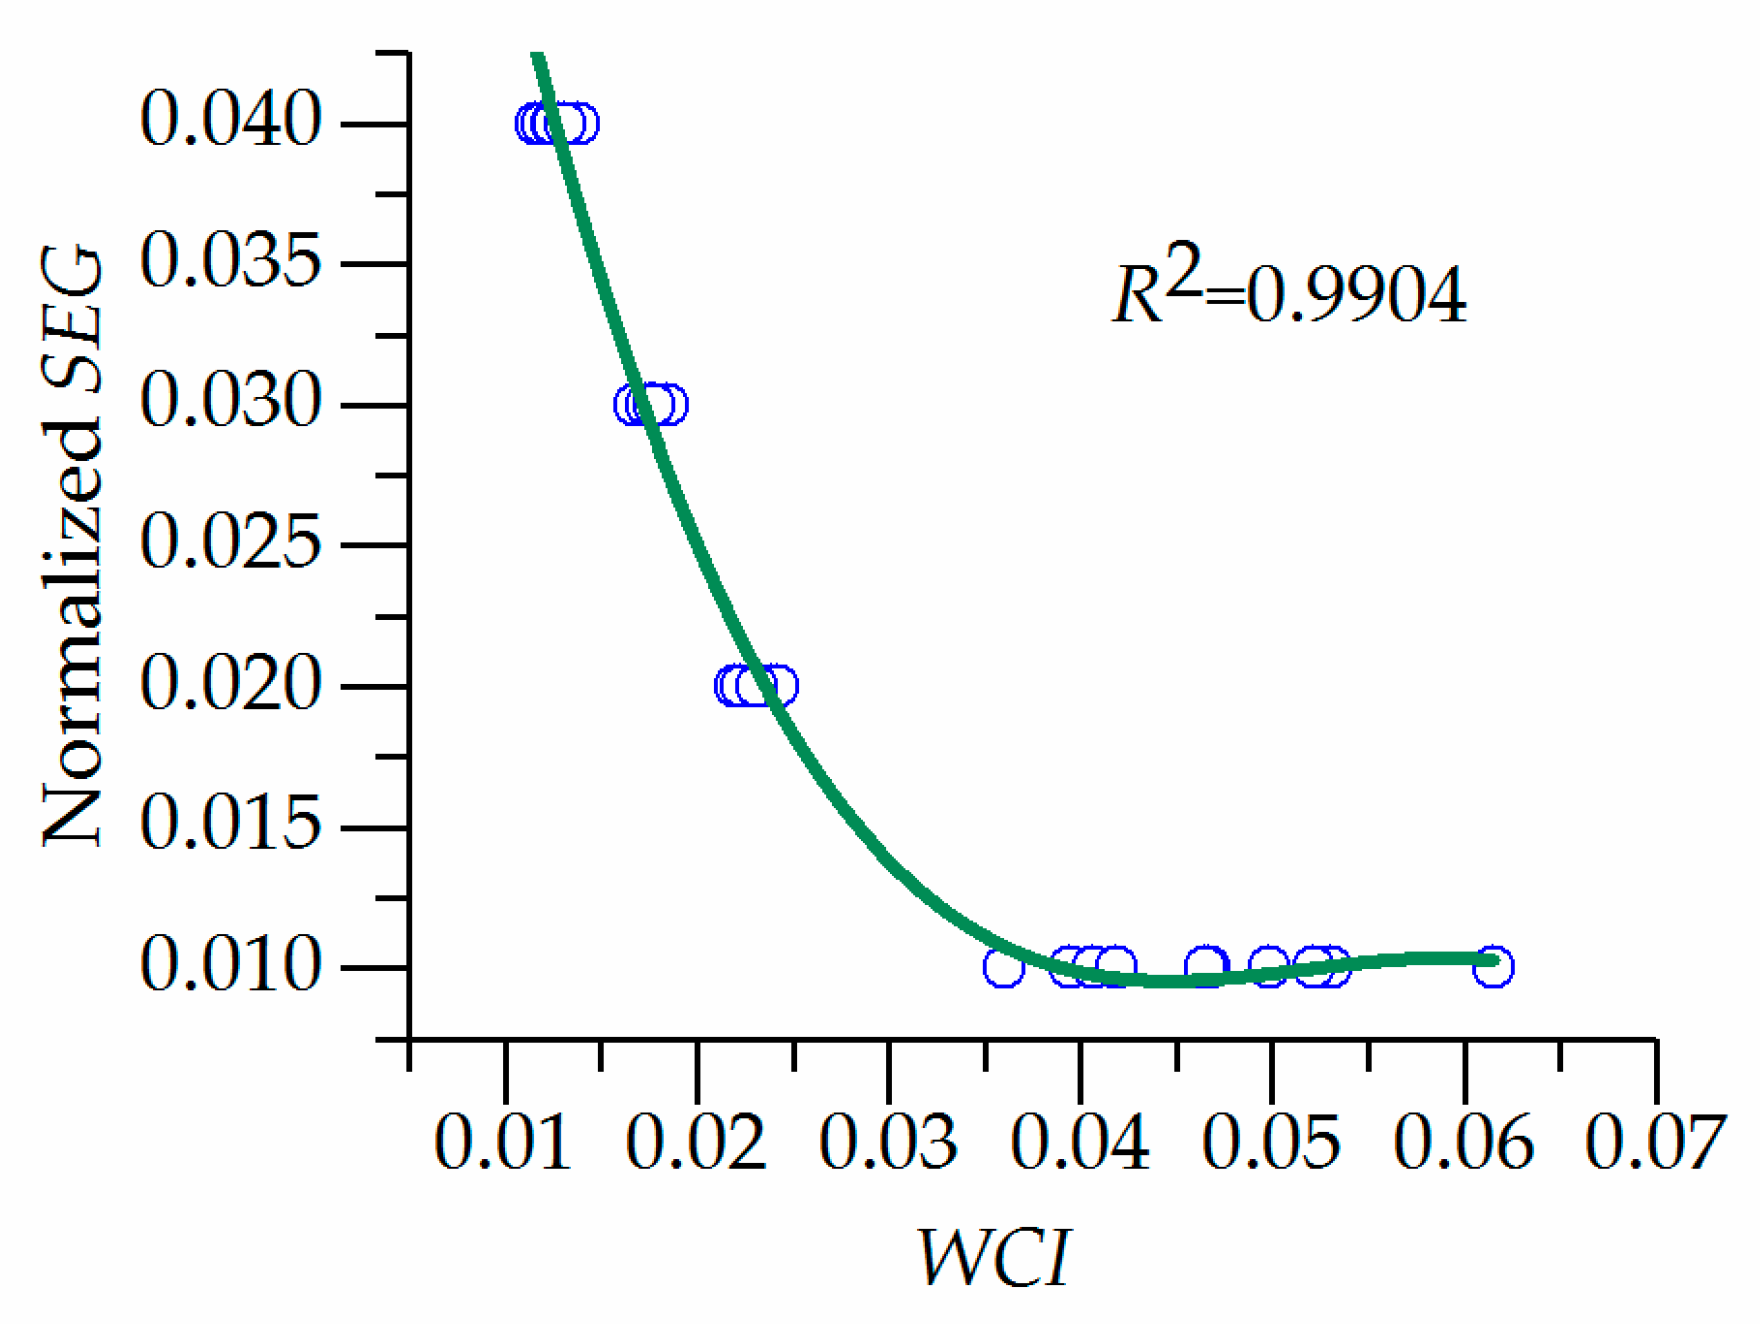
3.3. WCI and Evaluation Function
The scatter distribution between the WCI and the normalized standard grade value SEG is observed, as shown in Figure 2.
The evaluation function is established by using cubic polynomial curve fitting and the optimization algorithm based on AGA is adopted to solve all four parameters, which is shown as follows:
The SEG of each sample was renormalized to the calculated grade using Equation (8), which was listed in Table 1, column 10, “calculated grade”. The last column of “error grade” in Table 1 is the error between the GEM calculated grade and the standard grade. From Table 1, the absolute error grade is less than 0.1 that accounts for 72.5%, which indicates a feasible evaluation function that can be used for the regional sustainable evaluation of water resources.
3.4. Assessment the Grade of RWRS in Two Study Regions
The index data in Table 2 of 12 sub-regions in Hanzhong and Huai River Basin were calculated by Step 1–5 successively and the evaluation grades of each region were obtained, as shown in Table 5. Table 5 also shows the results of literatures using the Artificial Neural Network method [13] (ANN), Fuzzy Comprehensive Evaluation method [14] (FCE) and Shepard similarity interpolation evaluation model [15] (SP).
Table 5 shows that the GEM method proposed in this paper is generally consistent with the results of the other three evaluation methods. Hanzhong basin is in the sustainable state of 2–3 grades and Huai river basin is between 1.5 and 2.5 grades.
4. Discussion
4.1. Discriminability Analysis
The last line in Table 5 shows the variance of the evaluation results obtained using the four evaluation methods, which can reflect the discrimination degree of the evaluation results of the four evaluation methods to a certain extent. Obviously, a greater variance represents greater discrimination. The variance results show that GEM method has the largest variance in evaluation results and is significantly statistically different to SP (p-value = 0.0072, which is <0.01). The variance of ANN and FCE is so small that it is difficult to distinguish the sustainable utilization status of water resources in each sub-region.
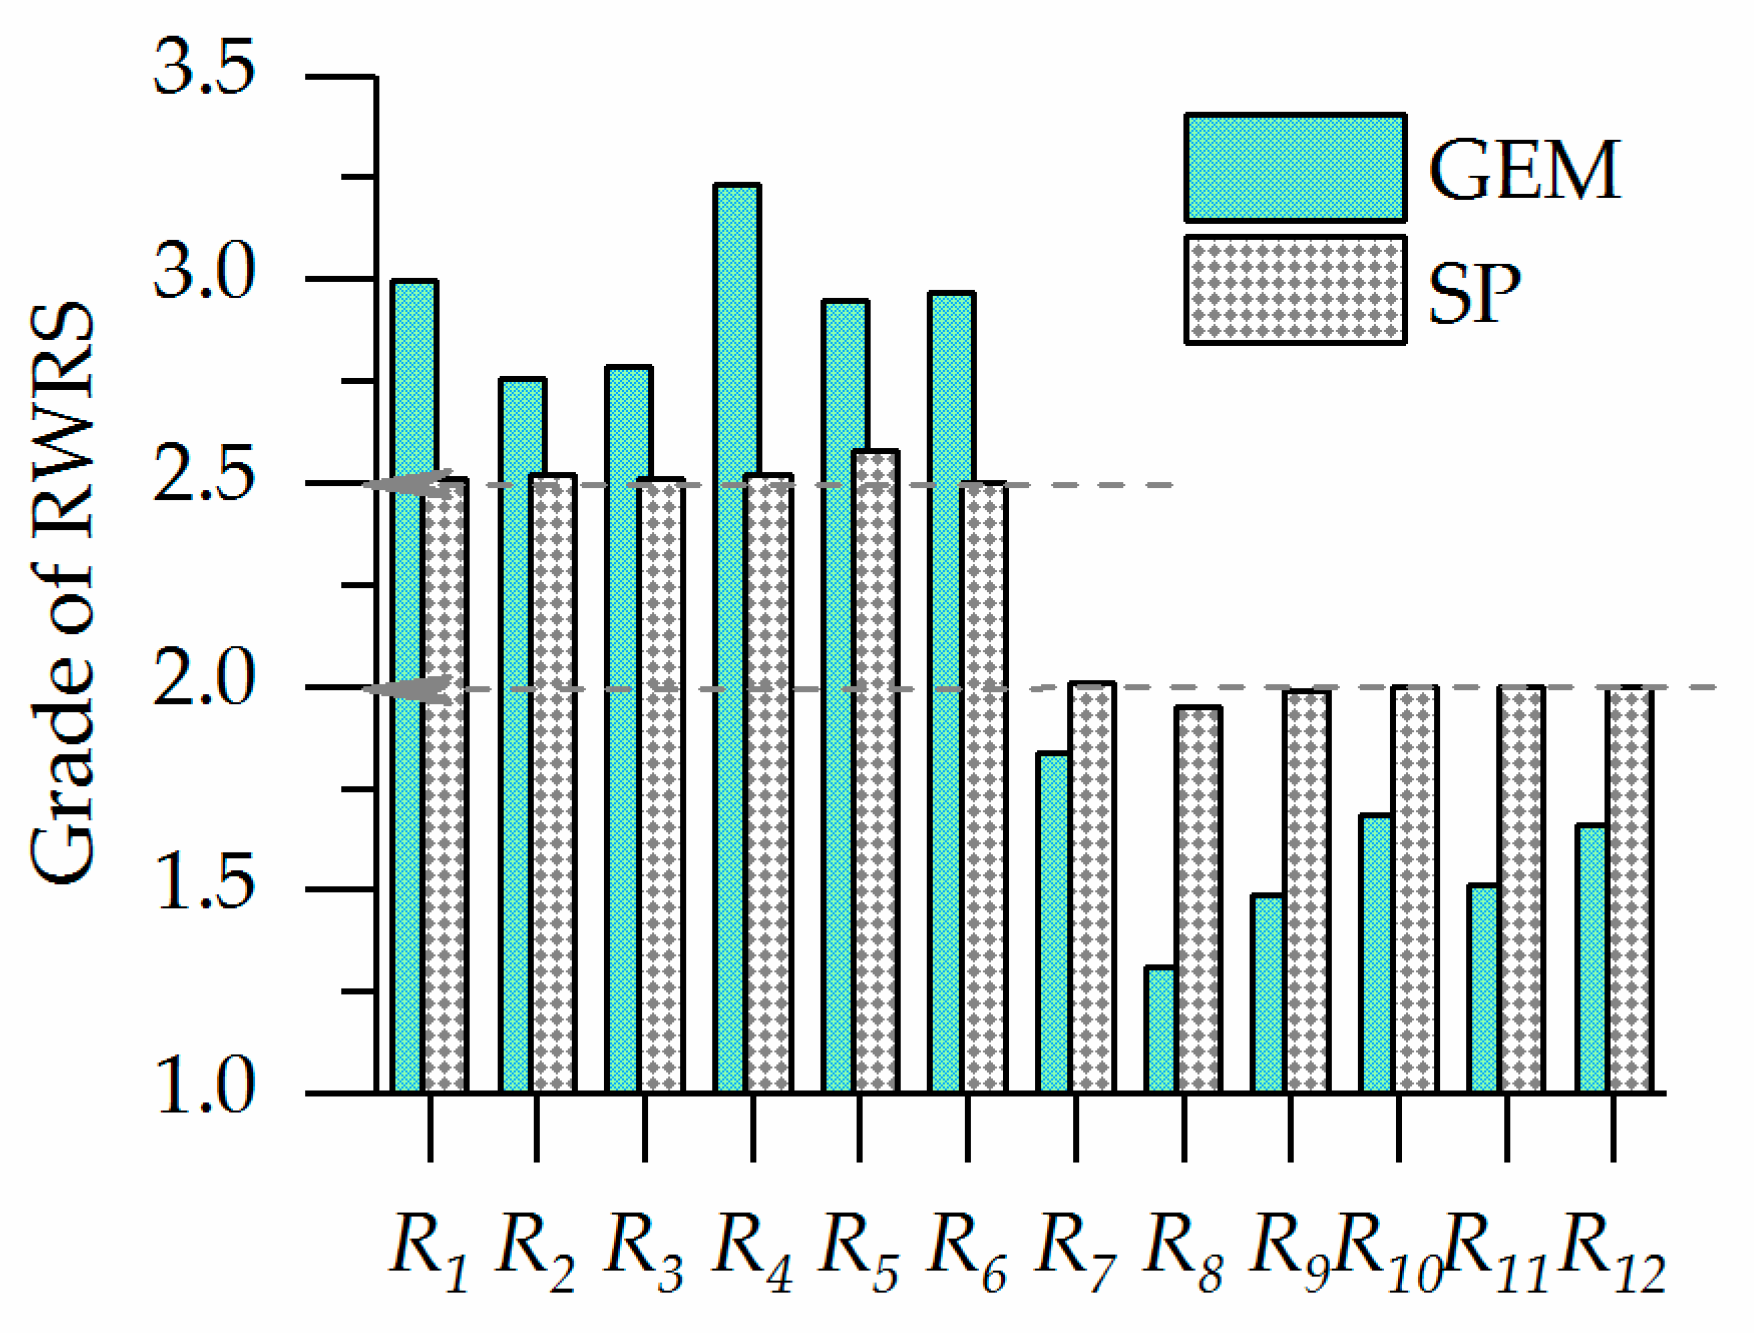
In order to further compare the discrimination degree of evaluation methods, the evaluation result graph of GEM and SP is drawn, as shown in Figure 3.
Figure 3 shows that GEM evaluation results are generally consistent with SP evaluation results. Both evaluation methods agree that the sustainable utilization degree of water resources in the six regions of Huai River is lower than that in the six regions of Hanzhong. This indicates that there is still a large development space in the Huai River basin, which is consistent with the literature research results [13,14,15].
However, there are still significant differences between the two evaluation models in the data distribution of the evaluation results. In six regions of Hanzhong, the GEM results ranged from 2.76 in R2 Hanzhongxian to 3.23 in R4 Chenggu. However, the SP results of these six regions are about 2.5 and the sustainable utilization of water resources varies very little from the smaller value of 2.5 in R6 Pingba to the largest value of 2.8 in R5 Yangxian, with only a difference of 0.3 in the grade.
4.2. Rationality Analysis of Evaluation Results
Taking the R4 Chenggu and R5 Yangxian regions of Hanzhong basin as examples, the rationality of the GEM and SP evaluation results is analyzed.
Firstly, the rationality of the evaluation results is judged according to the values of each single index in R4 Chenggu. In Table 2, the index of irrigation rate in R4 Chengu is 31.3%, which is greater than grade 3; X2 is 25.8%, which is greater than grade 3; X3 is 48.4%, which is less than but close to grade 3; X4 is 36.7 × 10⁴ m3/km2, which is larger than grade 3 and close to grade 4; X5 is 76.5 × 10⁴ m3/km2, which is less than grade 3 but greater than grade 2; X6 is 1102.6 × 104 m3/person, which is less than grade 2 and greater than grade 1; X7 is 2%, which is grade 1.Three of the seven indicators are greater than grade 3, two are close to grade 3 and two are close to grade 1. Therefore, it is reasonable to use the GEM model to evaluate the sustainable utilization grade of water resources in R4 Chenggu as a grade of 3.23. However, the evaluation grade of SP model is 2.52, which is obviously not as reliable as the evaluation results from GEM in terms of the characteristic values of a single index in R4 Chenggu.
Secondly, the rationality of the GEM and SP methods is judged by comparing the evaluation results of the two regions. In the SP model, the RWRS grade in R4 Chenggu and R5 Yangxian regions is evaluated as 2.52 and 2.58, respectively, while the GEM model is evaluated as 3.23 and 2.95, respectively. GEM and SP have opposite results of the grade of RWRS in these two areas. Further analysis is needed to determine which method is more reasonable.
The characteristic values of each indicator in Table 2 are compared. For the bigger the better type indicators X1–X5, the index characteristic values of R4 Chenggu are smaller than the corresponding index characteristic values of R5 Yangxian, which indicates that the sustainable utilization of water resources in R4 Chenggu is lower than that of R5 Yangxian. For the smaller the better type indicator X6, the value of R5 Yangxian is 1032.7 × 104 m3/person, which is less than 1102.6 × 104 m3/person in R4 Chenggu. This also indicates that the grade of RWRS of R4 Chenggu is lower than that of R5 Yangxian. On index 7, the values of the two regions are the same. Through the comparative analysis of two regional indicators, we suggest that the grade of RWRS in R4 Chenggu is lower than that in R5 Yangxian. Thus, the reasonable evaluation result should be that GRWRS of R5 Chenggu > GRWRS of R6 Yangxian. Obviously, the evaluation result from GEM is more reasonable than that from SP. The performance of GEM and SP in Huai River Basin is similar to that of Hanzhong Basin. Compared with the SP model, the GEM model has better differentiation results and there is no logical irrationality.
5. Conclusions
In order to improve the rationality and discriminability of the evaluation results related to the sustainable utilization of regional water resources, we used the relative entropy method in the information theory to establish a generalized entropy method (GEM) consisting of five steps and obtained the following conclusions.
(1) The proposed GEM method can significantly improve the differentiation of the evaluation results. Compared with the evaluation results of SP and other evaluation methods, the variance of the GEM method evaluation results is significantly higher than that of other methods. The evaluation results are more distinguished.
(2) The GEM method can correctly reflect the sustainable state of regional water resources and the evaluation result is more reasonable. GEM evaluates the six regions of Hanzhong Basin to have a grade around 3.0, while the evaluation results of Huai River Basin are all less than 2. The water resource sustainability of Huai River Basin is lower than that of Hanzhong Basin, which show a more sustainable state of water resources than Hanzhong Basin.
(3) GEM is more reasonable than SP in evaluating the sustainability of water resources. The analysis from two aspects, including the rationality of the single regional grade and two regional grade rankings, shows that the evaluation results from GEM are more accurate and there is no sorting error.
In the proposed GEM evaluation method, the index weight calculated by the difference of evaluation samples is called the objective weight. However, this objective weight has not considered the subjective weight determined by experts according to the meaning of each index. In future studies, the subjective weight method, such as the analytic hierarchy process, can be considered to integrate the objective weight to obtain more reliable evaluation results.
Author Contributions
Conceptualization, M.Z.; Methodology, M.Z. and R.Z.; Validation, R.Z.; Data Curation, J.Z.; Writing Original Draft Preparation, M.Z. All of the authors have read and approved the final manuscript.
Funding
The authors would like to thank the support of the National Natural Science Foundation of China under Grant No. 51409001, Excellent Talents Supporting program of Higher Education of Anhui under Grant No. gxyqZD2016127 and Anhui Provincial Natural Science Foundation under Grant No. 1808085QE146.
Conflicts of Interest
The authors declare no conflict of interest.
References
- Ostrom, E. A general framework for analyzing sustainability of social-ecological systems. Science 2009, 325, 419–422. [Google Scholar] [CrossRef] [PubMed]
- Jin, J.L.; Fu, J.; Wei, Y.M.; Jiang, S.M.; Zhou, Y.L.; Liu, L.; Wang, Y.Z.; Wu, C.G. Integrated risk assessment method of waterlog disaster in Huai River Basin of China. Nat. Hazards 2015, 75, 155–178. [Google Scholar] [CrossRef]
- Jin, J.L.; Wei, Y.M.; Zou, L.L. Forewarning of sustainable utilization of regional water resources: A model based on BP neural network and set pair analysis. Nat. Hazards 2012, 62, 115–127. [Google Scholar] [CrossRef]
- Liu, Q.Y.; Wang, M.W.; Wang, X.; Shen, F.Q.; Jin, J.L. Land Eco-Security Assessment Based on the Multi-Dimensional Connection Cloud Model. Sustainability 2018, 10, 2096. [Google Scholar] [CrossRef]
- Pan, H.; Xu, Q. Quantitative Analysis on the Influence Factors of the Sustainable Water Resource Management Performance in Irrigation Areas: An Empirical Research from China. Sustainability 2018, 10, 264. [Google Scholar] [Green Version]
- Stevovic, S.; Nestorovic, Z.; Lutovac, M. Water management and sustainability of water resources. Water Sci. Technol. Water Supply 2018, 18, 976–983. [Google Scholar] [CrossRef]
- Chen, Y.; He, L.; Lu, H.; Li, J.; Ren, L. Planning for Regional Water System Sustainability through Water Resources Security Assessment Under Uncertainties. Water Resour. Manag. 2018, 32, 3135–3153. [Google Scholar] [CrossRef]
- Archer, D.R.; Forsythe, N.; Fowler, H.J.; Shah, S.M. Sustainability of water resources management in the Indus Basin under changing climatic and socio economic conditions. Hydrol. Earth Syst. Sci. 2010, 14, 1669–1680. [Google Scholar] [CrossRef] [Green Version]
- Zeng, X.T.; Li, Y.P.; Huang, G.H.; Liu, J. Modeling of Water Resources Allocation and Water Quality Management for Supporting Regional Sustainability under Uncertainty in an Arid Region. Water Resour. Manag. 2017, 31, 3699–3721. [Google Scholar] [CrossRef]
- Pires, A.; Morato, J.; Peixoto, H.; Botero, V.; Zuluaga, L.; Figueroa, A. Sustainability Assessment of indicators for integrated water resources management. Sci. Total Environ. 2017, 578, 139–147. [Google Scholar] [CrossRef] [PubMed]
- Vilela de Moura Leite, F.B.; Bertolo, L.S.; Santos, R.F. Practices and perceptions on water resource sustainability in ecovillages. Water Resour. Res. 2016, 52, 6004–6017. [Google Scholar] [CrossRef]
- Yang, J.F.; Lei, K.; Khu, S.; Meng, W. Assessment of water resources carrying capacity for sustainable development based on a system dynamics model: A case study of Tieling City, China. Water Resour. Manag. 2015, 29, 885–899. [Google Scholar] [CrossRef]
- Lou, W.G.; Liu, S.Q. On assessment of sustainable development level of regionalwater resource using artificial neural networks. Syst. Sci. Comp. Stud. Agric. 2004, 20, 113–119. (In Chinese) [Google Scholar]
- Wang, H.F.; Hu, J.M.; Li, C.Y. Comprehensive evaluation for water resources carrying capacity of Huai River Basin. Yangtze River 2010, 41, 53–57. (In Chinese) [Google Scholar]
- Jin, J.L.; Ding, J.; Wei, Y.M.; Fu, Q. An interpolation evaluation model for regional water resources sustainable utilization system. J. Nat. Res. 2002, 17, 610–615. (In Chinese) [Google Scholar]
- Zhang, M.; Jin, J.L.; Zhang, L.B. Pursuit Projection Evaluation Model Based on Principle of Maximum Entropy for River Basin Sustainability Evaluation. Sci. Geogr. Sin. 2007, 27, 177–181. (In Chinese) [Google Scholar]
- Jaynes, E.T. Information Theory and Statistical Mechanics. Phys. Rev. 1957, 106, 620–630. [Google Scholar] [CrossRef]
- Pan, Z.W.; Jin, J.L.; Li, C.H.; Ning, S.W.; Zhou, R.X. A connection entropy approach to water resources vulnerability analysis in a changing environment. Entropy 2017, 19, 591. [Google Scholar] [CrossRef]
- Fang, S.B.; Jia, R.F.; Tu, W.R.; Sun, Z.L. Research on the influencing factors of comprehensive water consumption by impulse response function analysis. Water 2017, 9, 18. [Google Scholar] [CrossRef]
- Peterson, H.M.; Nieber, J.L.; Kanivetsky, R.; Shmagin, B. Water Resources Sustainability Indicator: Application of the Watershed Characteristics Approach. Water Resour. Manag. 2013, 27, 1221–1234. [Google Scholar] [CrossRef]
- Zhou, R.X.; Pan, Z.W.; Jin, J.L.; Li, C.H.; Ning, S.W. Forewarning model of regional water resources carrying capacity based on combination weights and entropy principles. Entropy 2017, 19, 574. [Google Scholar] [CrossRef]
- Ulanowicz, R.E. Quantitative methods for ecological network analysis. Comput. Biol. Chem. 2004, 28, 321–339. [Google Scholar] [CrossRef] [PubMed]
- Cabezas, H.; Pawlowski, C.W.; Mayer, A.L.; Hoagland, N.T. Sustainable systems theory: Ecological and other aspects. J. Clean. Prod. 2005, 13, 455–467. [Google Scholar] [CrossRef]
- Eason, T.; Cabezas, H. Evaluating the sustainability of a regional system using fisher information in the San Luis basin, Colorado. J. Environ. Manag. 2012, 94, 41–49. [Google Scholar] [CrossRef] [PubMed]
- Harte, J.; Zillio, T.; Conlisk, E.; Smith, A.B. Maximum entropy and the state-variable approach to macroecology. Ecology 2008, 89, 2700–2711. [Google Scholar] [CrossRef] [PubMed]
- Mayer, A.L.; Donovan, R.P.; Pawlowski, C.W. Information and entropy theory for the sustainability of coupled human and natural systems. Ecol. Soc. 2014, 19. [Google Scholar] [CrossRef] [Green Version]
- Cui, Y.; Feng, P.; Jin, J.L.; Liu, L. Water resources carrying capacity evaluation and diagnosis based on set pair analysis and improved the entropy weight method. Entropy 2018, 20, 359. [Google Scholar] [CrossRef]
- Li, F.; Chen, Y.; Li, W. The application of Set Pair Analysis based on entropy weight to evaluation of sustainable water resources utilization: A case study in the three sources of Tarim River. J. Glaciol. Geocryol. 2010, 32, 723–730. [Google Scholar]
- Sun, S.; Wang, Y.; Liu, J. Sustainability assessment of regional water resources under the DPSIR framework. J. Hydrol. 2016, 532, 140–148. [Google Scholar] [CrossRef]
- Sandoval-Solis, S.; McKinney, D.C.; Loucks, D.P. Sustainability Index for Water Resources Planning and Management. J. Water Res. Plan. Manag. 2011, 137, 381–390. [Google Scholar] [CrossRef] [Green Version]
- Kullback, S.; Leibler, R.A. On information and sufficiency. Ann. Stat. 1951, 22, 79–86. [Google Scholar] [CrossRef]
- Hernandez-Bedolla, J.; Solera, A.; Paredes-Arquiola, J.; Pedro-Monzonis, M.; Andreu, J.; Tatiana Sanchez-Quispe, S. The Assessment of Sustainability Indexes and Climate Change Impacts on Integrated Water Resource Management. Water 2017, 9, 213. [Google Scholar] [CrossRef]
- Jin, J.L.; Wei, Y.M.; Zou, L.L.; Liu, L.; Fu, J. Risk evaluation of China’s natural disaster systems: An approach based on triangular fuzzy numbers and stochastic simulation. Nat. Hazards 2012, 62, 129–139. [Google Scholar] [CrossRef]
- Zhao, J.; Jin, J.L.; Zhu, J.Z.; Han, D.H. Water resources risk assessment model based on the subjective and objective combination weighting methods. Water Resour. Manag. 2016, 30, 3027–3042. [Google Scholar] [CrossRef]
Figure 1.
The location of the Hanzhong Basin and the Huai River regions.

Figure 2.
Scatter plot of weighted comprehensive index (WCI) and sample and evaluation grade (SEG).

Figure 3.
Sustainability of water resources in Hanzhong and Huai River Basin. (R1–R6 represent Hanzhong, while R7–R12 Huai River).
Figure 3.
Sustainability of water resources in Hanzhong and Huai River Basin. (R1–R6 represent Hanzhong, while R7–R12 Huai River).


Table 1.
Index system and corresponding grade criteria for evaluating regional water resource sustainability (RWRS) in China.
Table 1.
Index system and corresponding grade criteria for evaluating regional water resource sustainability (RWRS) in China.
| Evaluation Index | Water Resources Sustainability Grade Criterion | |||
|---|---|---|---|---|
| Grade 1 | Grade 2 | Grade 3 | Grade 4 | |
| X1 rate of irrigation (%) | ≥60 | 45 | 35 | ≤20 |
| X2 rate of water resources utilization (%) | ≥60 | 45 | 35 | ≤20 |
| X3 rate of water resources development (%) | ≥70 | 55 | 45 | ≤30 |
| X4 modulus of water demand (104m3/(km2)) | ≥100 | 80 | 60 | ≤40 |
| X5 modulus of water supply (104m3/(km2)) | ≥100 | 80 | 60 | ≤40 |
| X6 water supply per capita(104m3/person) | ≤1000 | 1750 | 2250 | ≥3000 |
| X7 rate of ecological water consumption (%) | ≤2 | 3 | 4 | ≥5 |
Table 2.
Characteristics of water resources sustainable status in the Hanzhong and Huai River regions.
Table 2.
Characteristics of water resources sustainable status in the Hanzhong and Huai River regions.
| Regions | Sub regions | X1 | X2 | X3 | X4 | X5 | X6 | X7 |
|---|---|---|---|---|---|---|---|---|
| Hanzhong Basin [13] | R1 Mianxian | 39.1 | 22.5 | 43.5 | 95.5 | 46.0 | 1006.6 | 2 |
| R2 Hanzhongxian | 37.6 | 26.7 | 50.3 | 98.4 | 50.7 | 885.2 | 2 | |
| R3 Nanzheng | 40.3 | 25.6 | 49.5 | 106.8 | 53.9 | 1225.8 | 2 | |
| R4 Chenggu | 31.3 | 25.8 | 48.4 | 76.5 | 36.7 | 1102.6 | 2 | |
| R5 Yangxian | 32.7 | 28.9 | 53.0 | 95.2 | 37.7 | 1032.7 | 2 | |
| R6 Pingba | 35.8 | 25.7 | 48.7 | 92.7 | 44.6 | 1041.4 | 2 | |
| Huai River [14,15] | R7 Upstream of Hongze Lake | 55.3 | 51.1 | 42.9 | 13.5 | 12.9 | 244.1 | 1 |
| R8 Downstream of Huai River | 90.5 | 71.5 | 94.2 | 29.2 | 43.3 | 495.8 | 1 | |
| R9 Yishusi River | 69.1 | 72.1 | 68.4 | 20.0 | 26.7 | 319.3 | 1 | |
| R10 All of Huai River basin | 63.4 | 59.3 | 55.8 | 17.2 | 23.7 | 296.8 | 1 | |
| R11 Shandong Peninsula | 67.2 | 59.3 | 53.7 | 12.4 | 15.4 | 222.6 | 1 | |
| R12 District of Huai River | 64.1 | 59.3 | 55.5 | 16.3 | 22.2 | 283.8 | 1 |
Table 3.
Results of standard evaluation samples and generalized entropy method (GEM) assessment.
| No. | X1 | X2 | X3 | X4 | X5 | X6 | X7 | Standard Grade | Calculated Grade | Error Grade |
|---|---|---|---|---|---|---|---|---|---|---|
| 1 | 2 | 3 | 4 | 5 | 6 | 7 | 8 | 9 | 10 | 11 |
| 1 | 86.3 | 86.1 | 81.2 | 109.4 | 155.9 | 565.8 | 0.3 | 1 | 0.96 | 0.041 |
| 2 | 89.3 | 64.2 | 81.3 | 308.8 | 143.3 | 978.4 | 1.4 | 1 | 0.99 | 0.008 |
| 3 | 65.6 | 79.3 | 89.4 | 240.7 | 128.8 | 726.5 | 0.2 | 1 | 1.01 | –0.007 |
| 4 | 85.0 | 99.8 | 85.2 | 285.4 | 196.0 | 483.1 | 1.3 | 1 | 0.96 | 0.042 |
| 5 | 84.3 | 66.4 | 84.1 | 238.7 | 114.2 | 318.3 | 0.3 | 1 | 0.98 | 0.021 |
| 6 | 60.4 | 72.6 | 70.9 | 177.0 | 137.6 | 596.7 | 0.8 | 1 | 1.07 | –0.074 |
| 7 | 64.0 | 79.9 | 98.6 | 346.4 | 126.5 | 720.2 | 1.7 | 1 | 0.98 | 0.024 |
| 8 | 96.7 | 60.9 | 96.6 | 168.0 | 177.7 | 88.7 | 0.7 | 1 | 1.03 | –0.026 |
| 9 | 86.8 | 86.3 | 90.6 | 330.4 | 102.0 | 154.9 | 1.1 | 1 | 1.00 | 0.001 |
| 10 | 99.2 | 91.6 | 80.8 | 310.3 | 135.6 | 947.4 | 1.7 | 1 | 0.96 | 0.036 |
| … | … | … | … | … | … | … | … | … | … | … |
| 30 | 39.5 | 44.6 | 46.5 | 60.2 | 70.6 | 1765.5 | 3.3 | 3 | 2.88 | 0.122 |
| 31 | 32.2 | 24.6 | 35.5 | 43.2 | 53.6 | 2338.8 | 4.4 | 4 | 3.94 | 0.062 |
| 32 | 31.6 | 32.3 | 42.2 | 44.2 | 55.1 | 2971.9 | 4.7 | 4 | 3.71 | 0.290 |
| 33 | 22.3 | 22.9 | 34.8 | 54.3 | 44.6 | 2765.9 | 4.6 | 4 | 4.26 | –0.257 |
| 34 | 21.7 | 33.8 | 34.9 | 41.3 | 55.3 | 2386.9 | 4.7 | 4 | 3.98 | 0.019 |
| 35 | 25.8 | 20.3 | 37.4 | 58.4 | 55.9 | 2786.8 | 4.8 | 4 | 4.03 | –0.034 |
| 36 | 28.4 | 20.3 | 33.0 | 52.4 | 54.5 | 2454.9 | 4.3 | 4 | 4.08 | –0.077 |
| 37 | 33.1 | 20.0 | 34.1 | 48.1 | 41.0 | 2615.4 | 4.2 | 4 | 4.17 | –0.167 |
| 38 | 24.7 | 21.7 | 41.7 | 57.9 | 47.6 | 2651.4 | 5.0 | 4 | 4.05 | –0.048 |
| 39 | 26.8 | 26.8 | 34.2 | 52.8 | 52.7 | 2911.0 | 4.8 | 4 | 4.02 | –0.023 |
| 40 | 33.5 | 29.8 | 37.5 | 42.6 | 46.7 | 2428.6 | 4.7 | 4 | 3.87 | 0.126 |
Table 4.
Results of relative entropy value (REV) and weight index.
| X1 | X2 | X3 | X4 | X5 | X6 | X7 | |
|---|---|---|---|---|---|---|---|
| REV | 0.179 | 0.182 | 0.145 | 0.309 | 0.175 | 0.522 | 0.511 |
| 1-hj | 0.821 | 0.818 | 0.855 | 0.691 | 0.825 | 0.478 | 0.489 |
| wj | 0.165 | 0.164 | 0.172 | 0.139 | 0.166 | 0.096 | 0.098 |
Table 5.
Results of the grade of RWRS by GEM method.
| Sub Regions | ANN [13] | FCE [14] | SP [15] | This Work |
|---|---|---|---|---|
| R1 Mianxian | 2.56 | - | 2.51 | 3.00 |
| R2 Hanzhongxian | 2.69 | - | 2.52 | 2.76 |
| R3 Nanzheng | 2.73 | - | 2.51 | 2.78 |
| R4 Chenggu | 2.37 | - | 2.52 | 3.23 |
| R5 Yangxian | 2.57 | - | 2.58 | 2.95 |
| R6 Pingba | 2.56 | - | 2.50 | 2.97 |
| R7 Upstream of Hongze Lake | - | 2.29 | 2.01 | 1.84 |
| R8 Downstream of Huai River | - | 2.10 | 1.95 | 1.31 |
| R9 YishusiRiver | - | 2.36 | 1.99 | 1.49 |
| R10 All of Huai River basin | - | 2.29 | 2.00 | 1.68 |
| R11 Shandong Peninsula | - | 2.49 | 2.00 | 1.51 |
| R12 District of Huai River | - | 2.35 | 2.00 | 1.66 |
| Variance | 0.126 | 0.128 | 0.279 | 0.734 |
© 2018 by the authors. Licensee MDPI, Basel, Switzerland. This article is an open access article distributed under the terms and conditions of the Creative Commons Attribution (CC BY) license (http://creativecommons.org/licenses/by/4.0/).
Share and Cite
MDPI and ACS Style
Zhang, M.; Zhou, J.; Zhou, R. Evaluating Sustainability of Regional Water Resources Based on Improved Generalized Entropy Method. Entropy 2018, 20, 715. https://doi.org/10.3390/e20090715
AMA Style
Zhang M, Zhou J, Zhou R. Evaluating Sustainability of Regional Water Resources Based on Improved Generalized Entropy Method. Entropy. 2018; 20(9):715. https://doi.org/10.3390/e20090715
Chicago/Turabian StyleZhang, Ming, Jinghong Zhou, and Runjuan Zhou. 2018. "Evaluating Sustainability of Regional Water Resources Based on Improved Generalized Entropy Method" Entropy 20, no. 9: 715. https://doi.org/10.3390/e20090715
Note that from the first issue of 2016, this journal uses article numbers instead of page numbers. See further details here.