Evaluating the Transient Energy Dissipation in a Centrifugal Impeller under Rotor-Stator Interaction

Abstract
:1. Introduction
2. Numerical Methods
2.1. Governing Equations
2.2. Eddy Viscosity Turbulence Modeling
2.3. Acoustic Analogy Method
3. Case Description
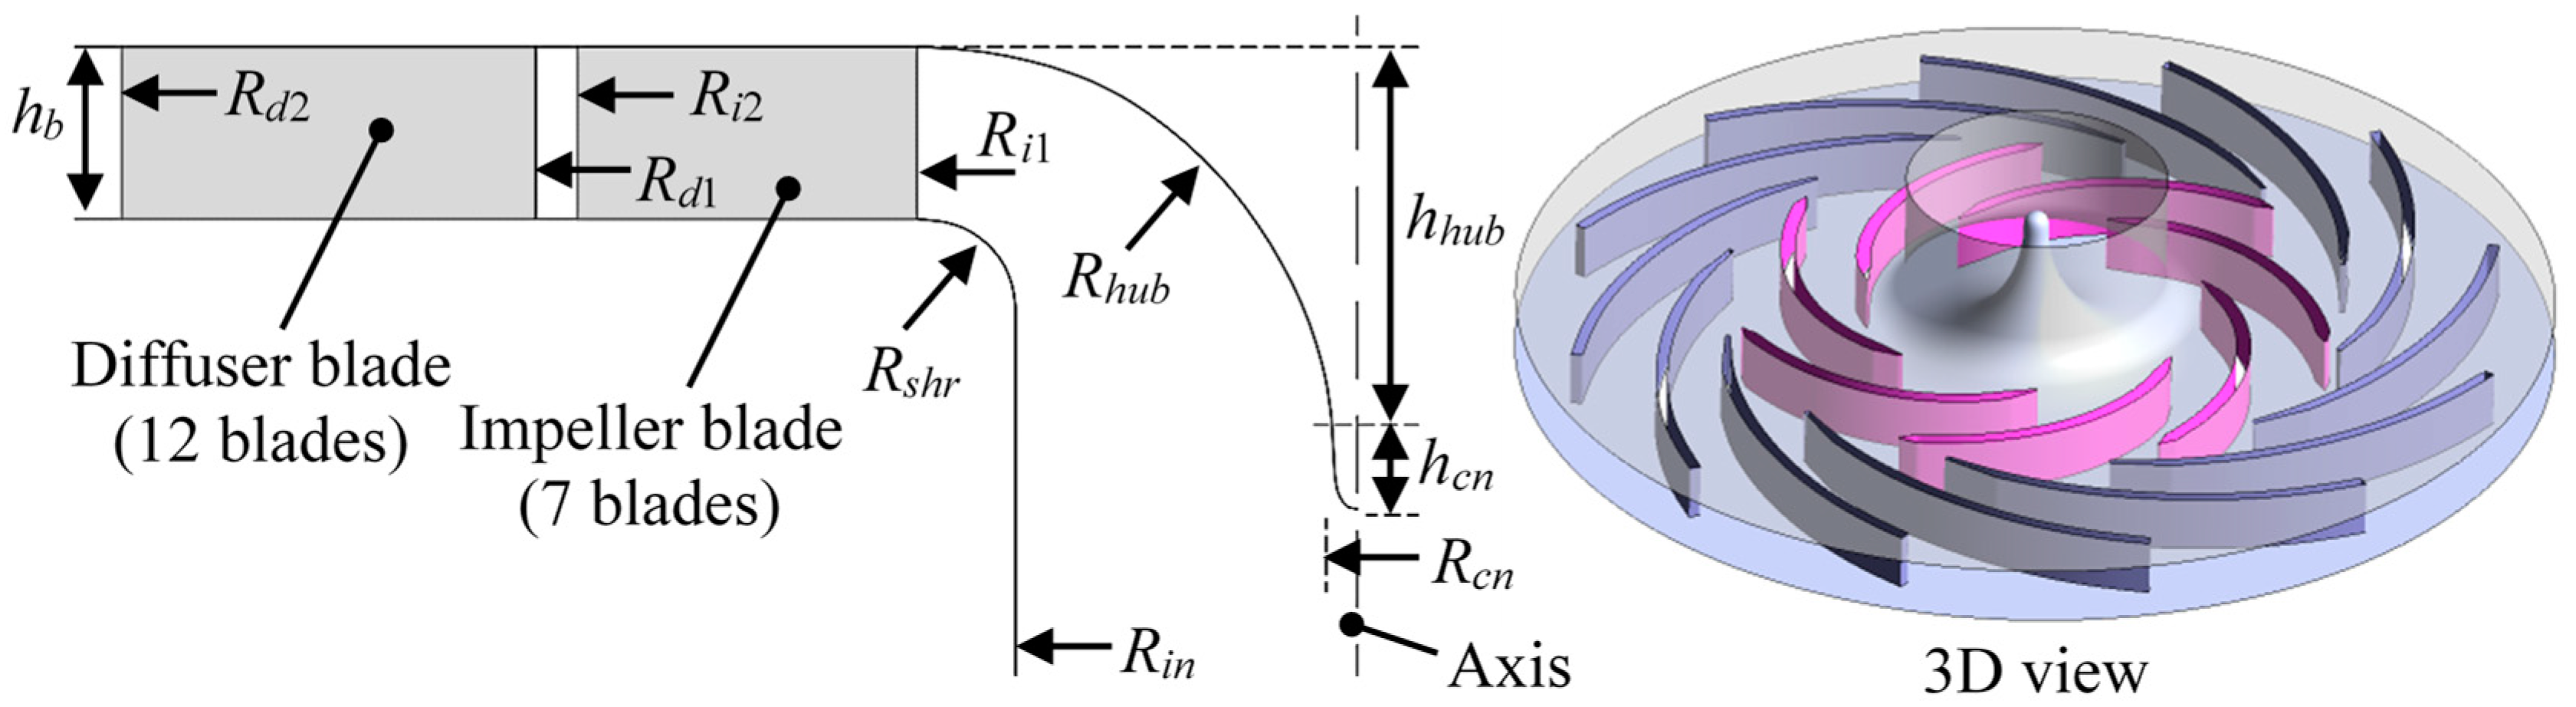
3.1. Centrifugal Air Pump Model
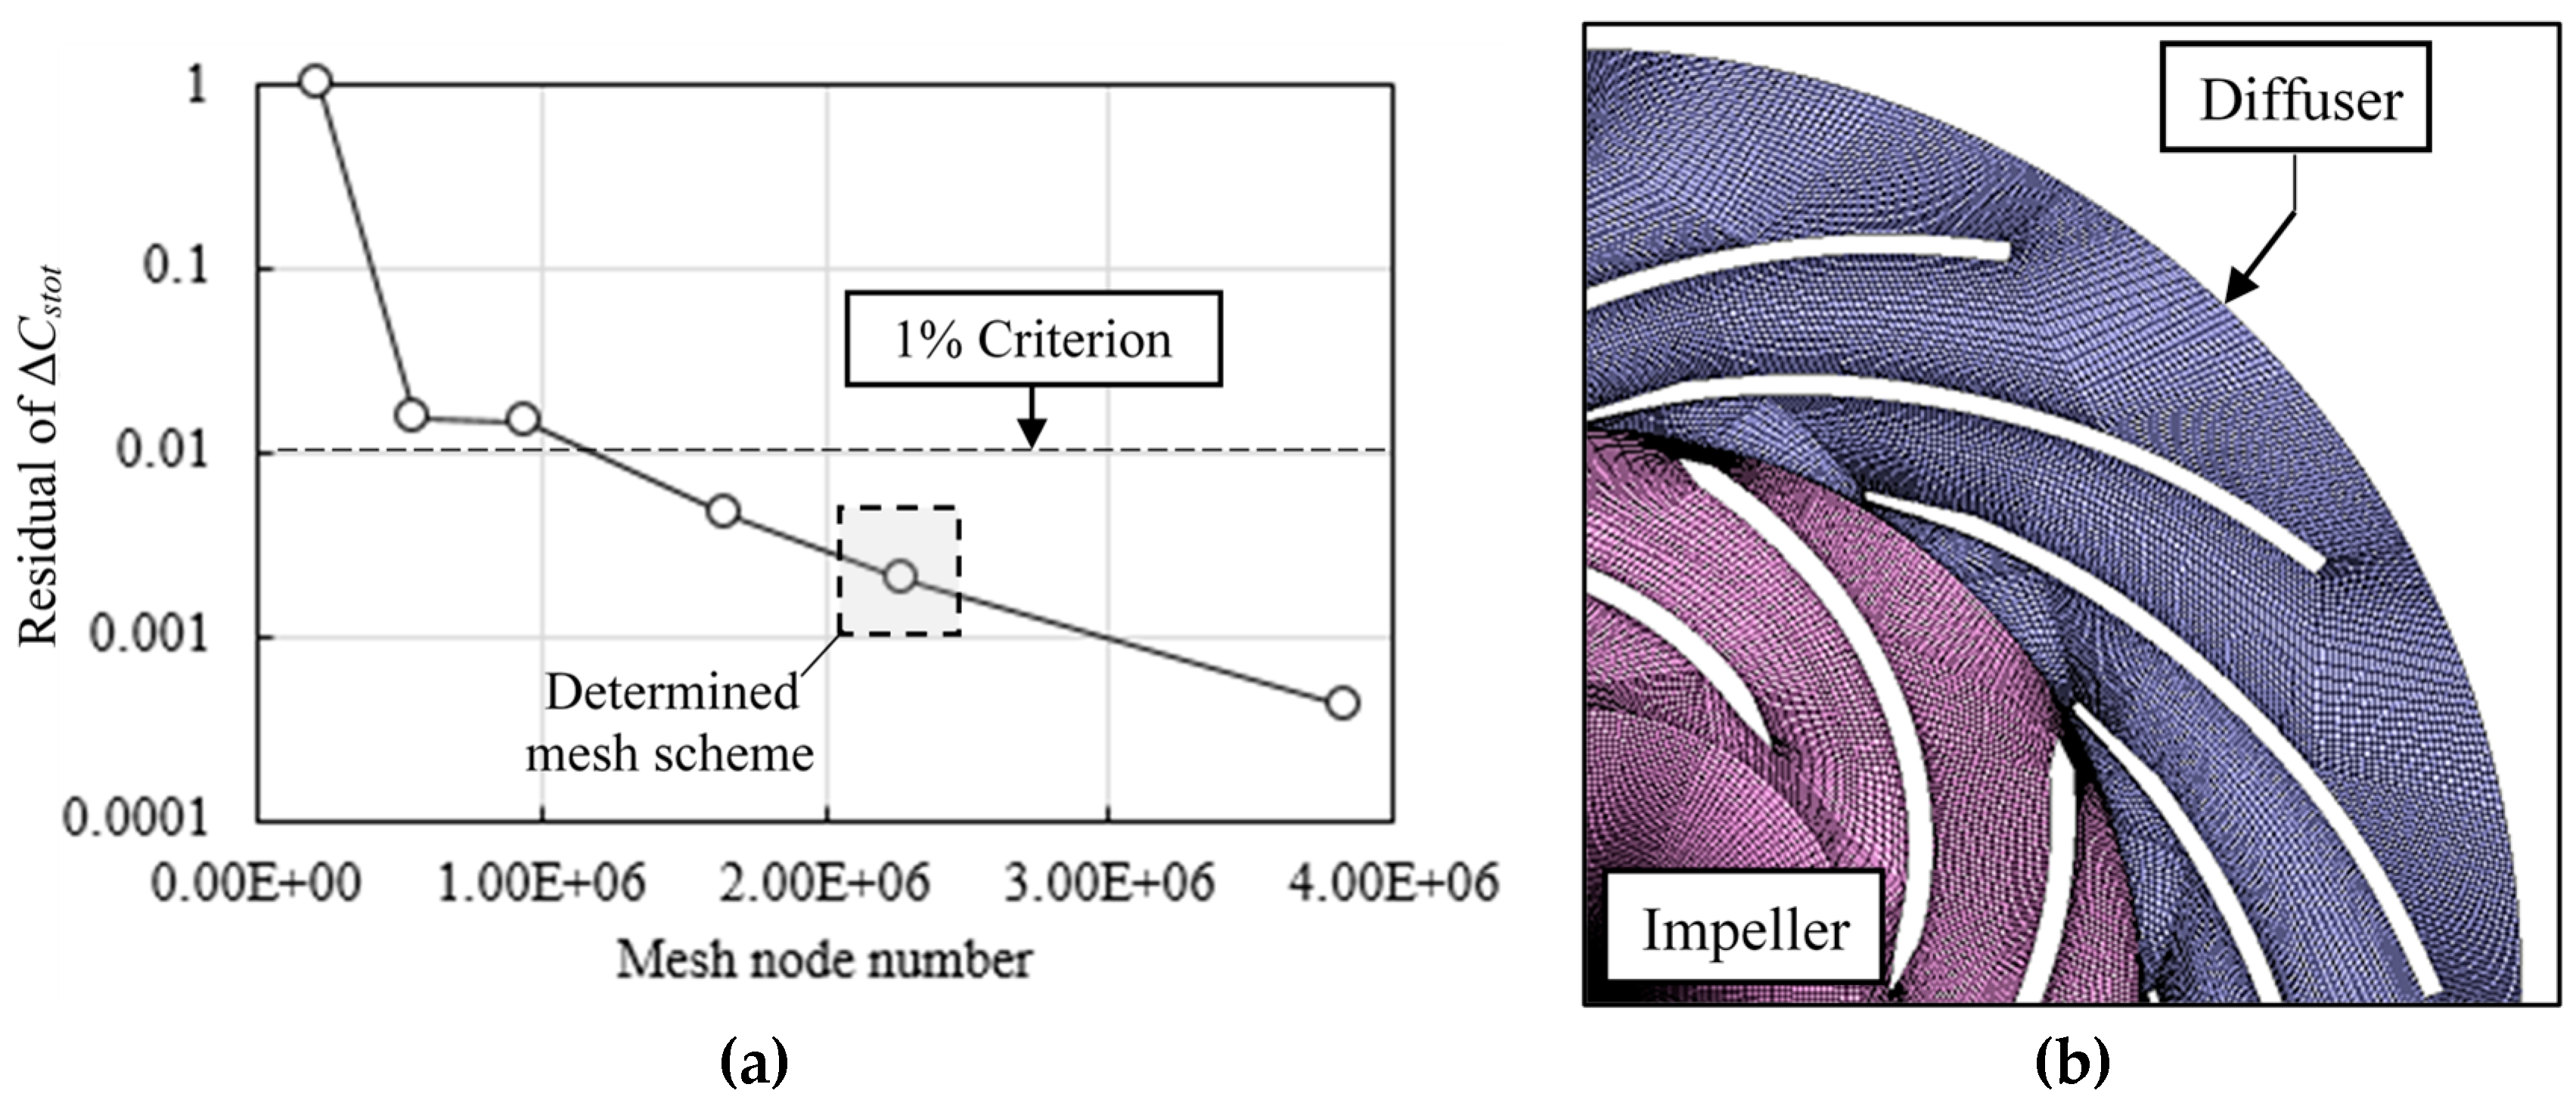
3.2. Flow Domain Meshing
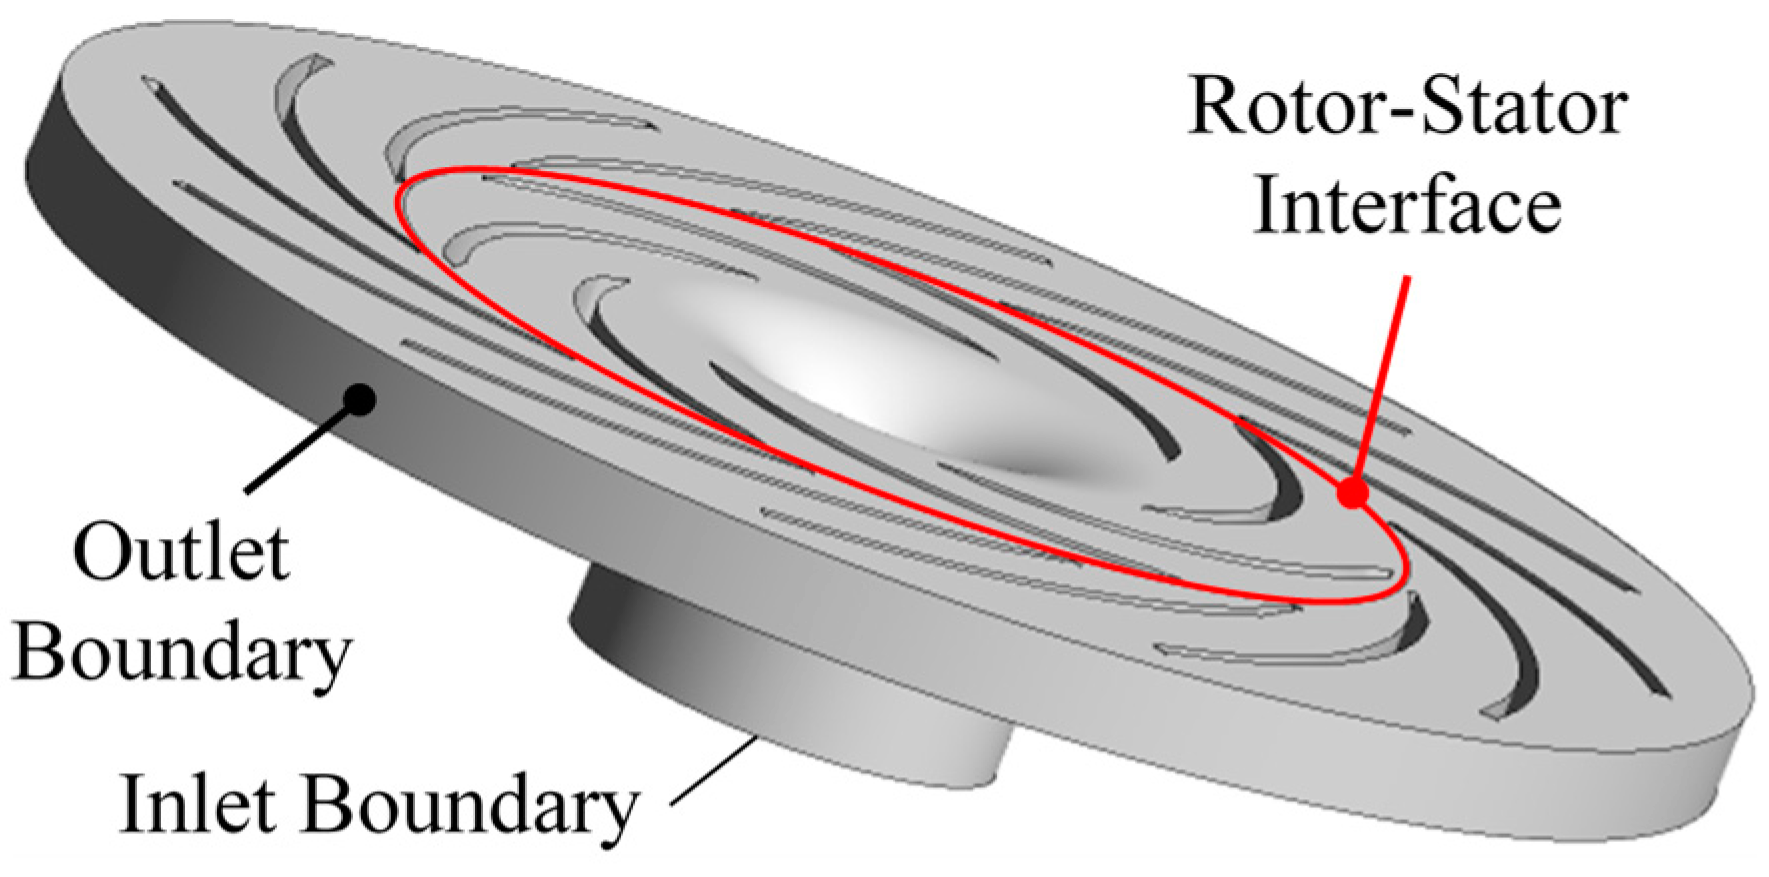
3.3. Setup of CFD Simulation
- Velocity inlet: the velocity at inlet boundary, Vin, was Vin = Q/Ain where Ain is the impeller inflow area; the temperature at inlet boundary, Tin, was 298.15 K; the pressure at inlet boundary, pin, follows the Neumann condition [34]; the inlet turbulence intensity is set as medium of 5%;
- Pressure outlet: the pressure at outlet boundary, pout, was 0 Pa relative to the environment pressure 1 atm; the velocity and temperature at outlet boundary, Vout and Tout, follows the Neumann condition;
- No slip wall: the impeller hub, impeller shroud, impeller blade, diffuser hub, diffuser shroud and diffuser blade are all in the no slip wall type [35];
- Rotor-Stator interface: an interface is given between impeller and diffuser with conservative interface flux on mass and momentum; the mesh is connected using the general grid interface (GGI) method.
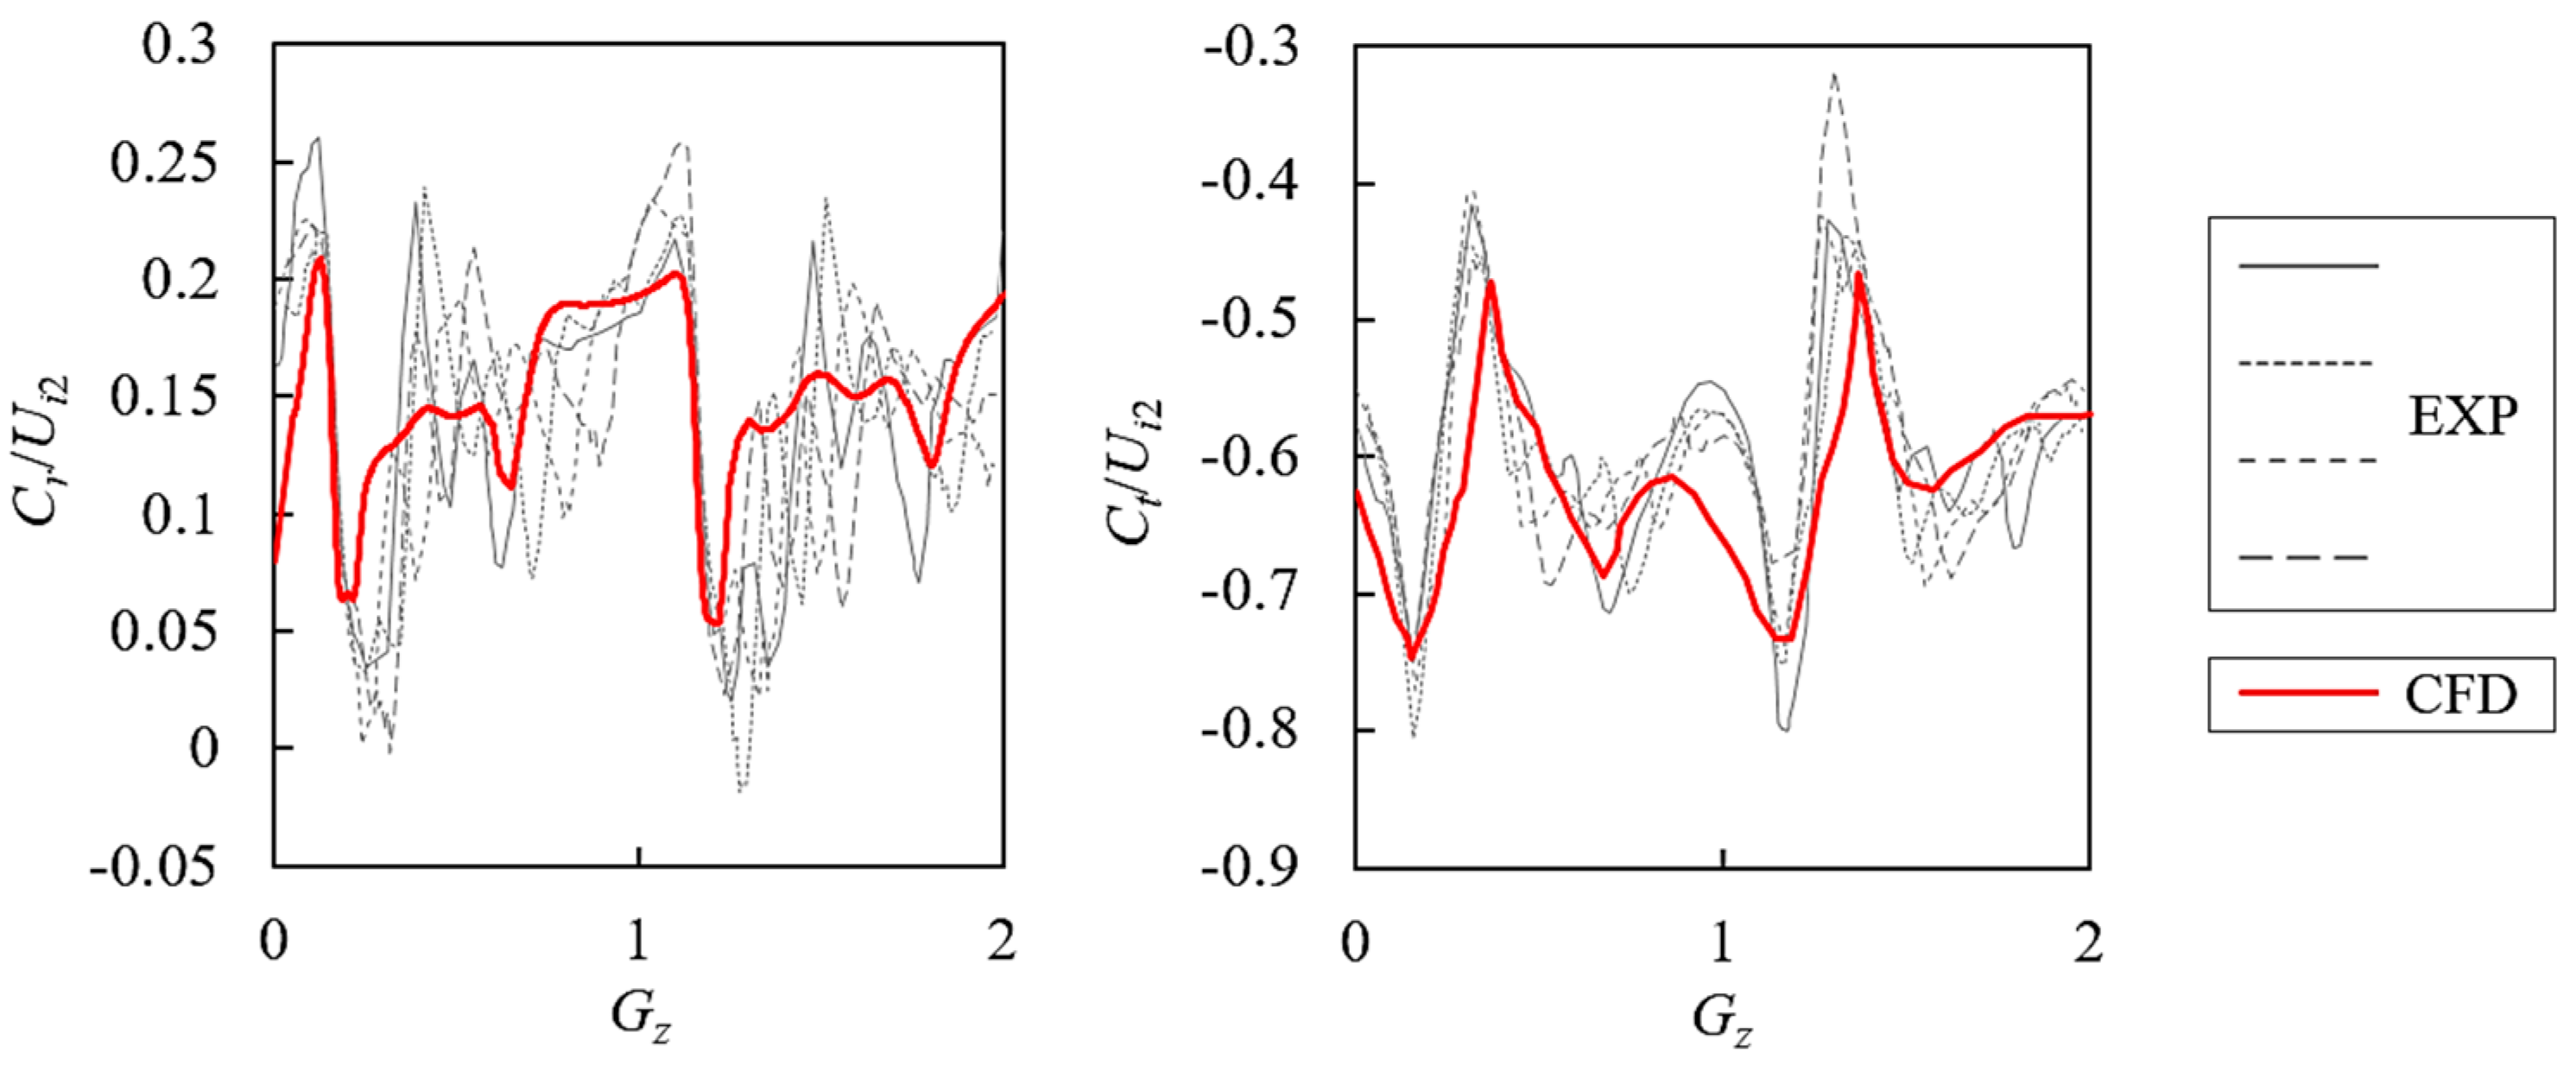
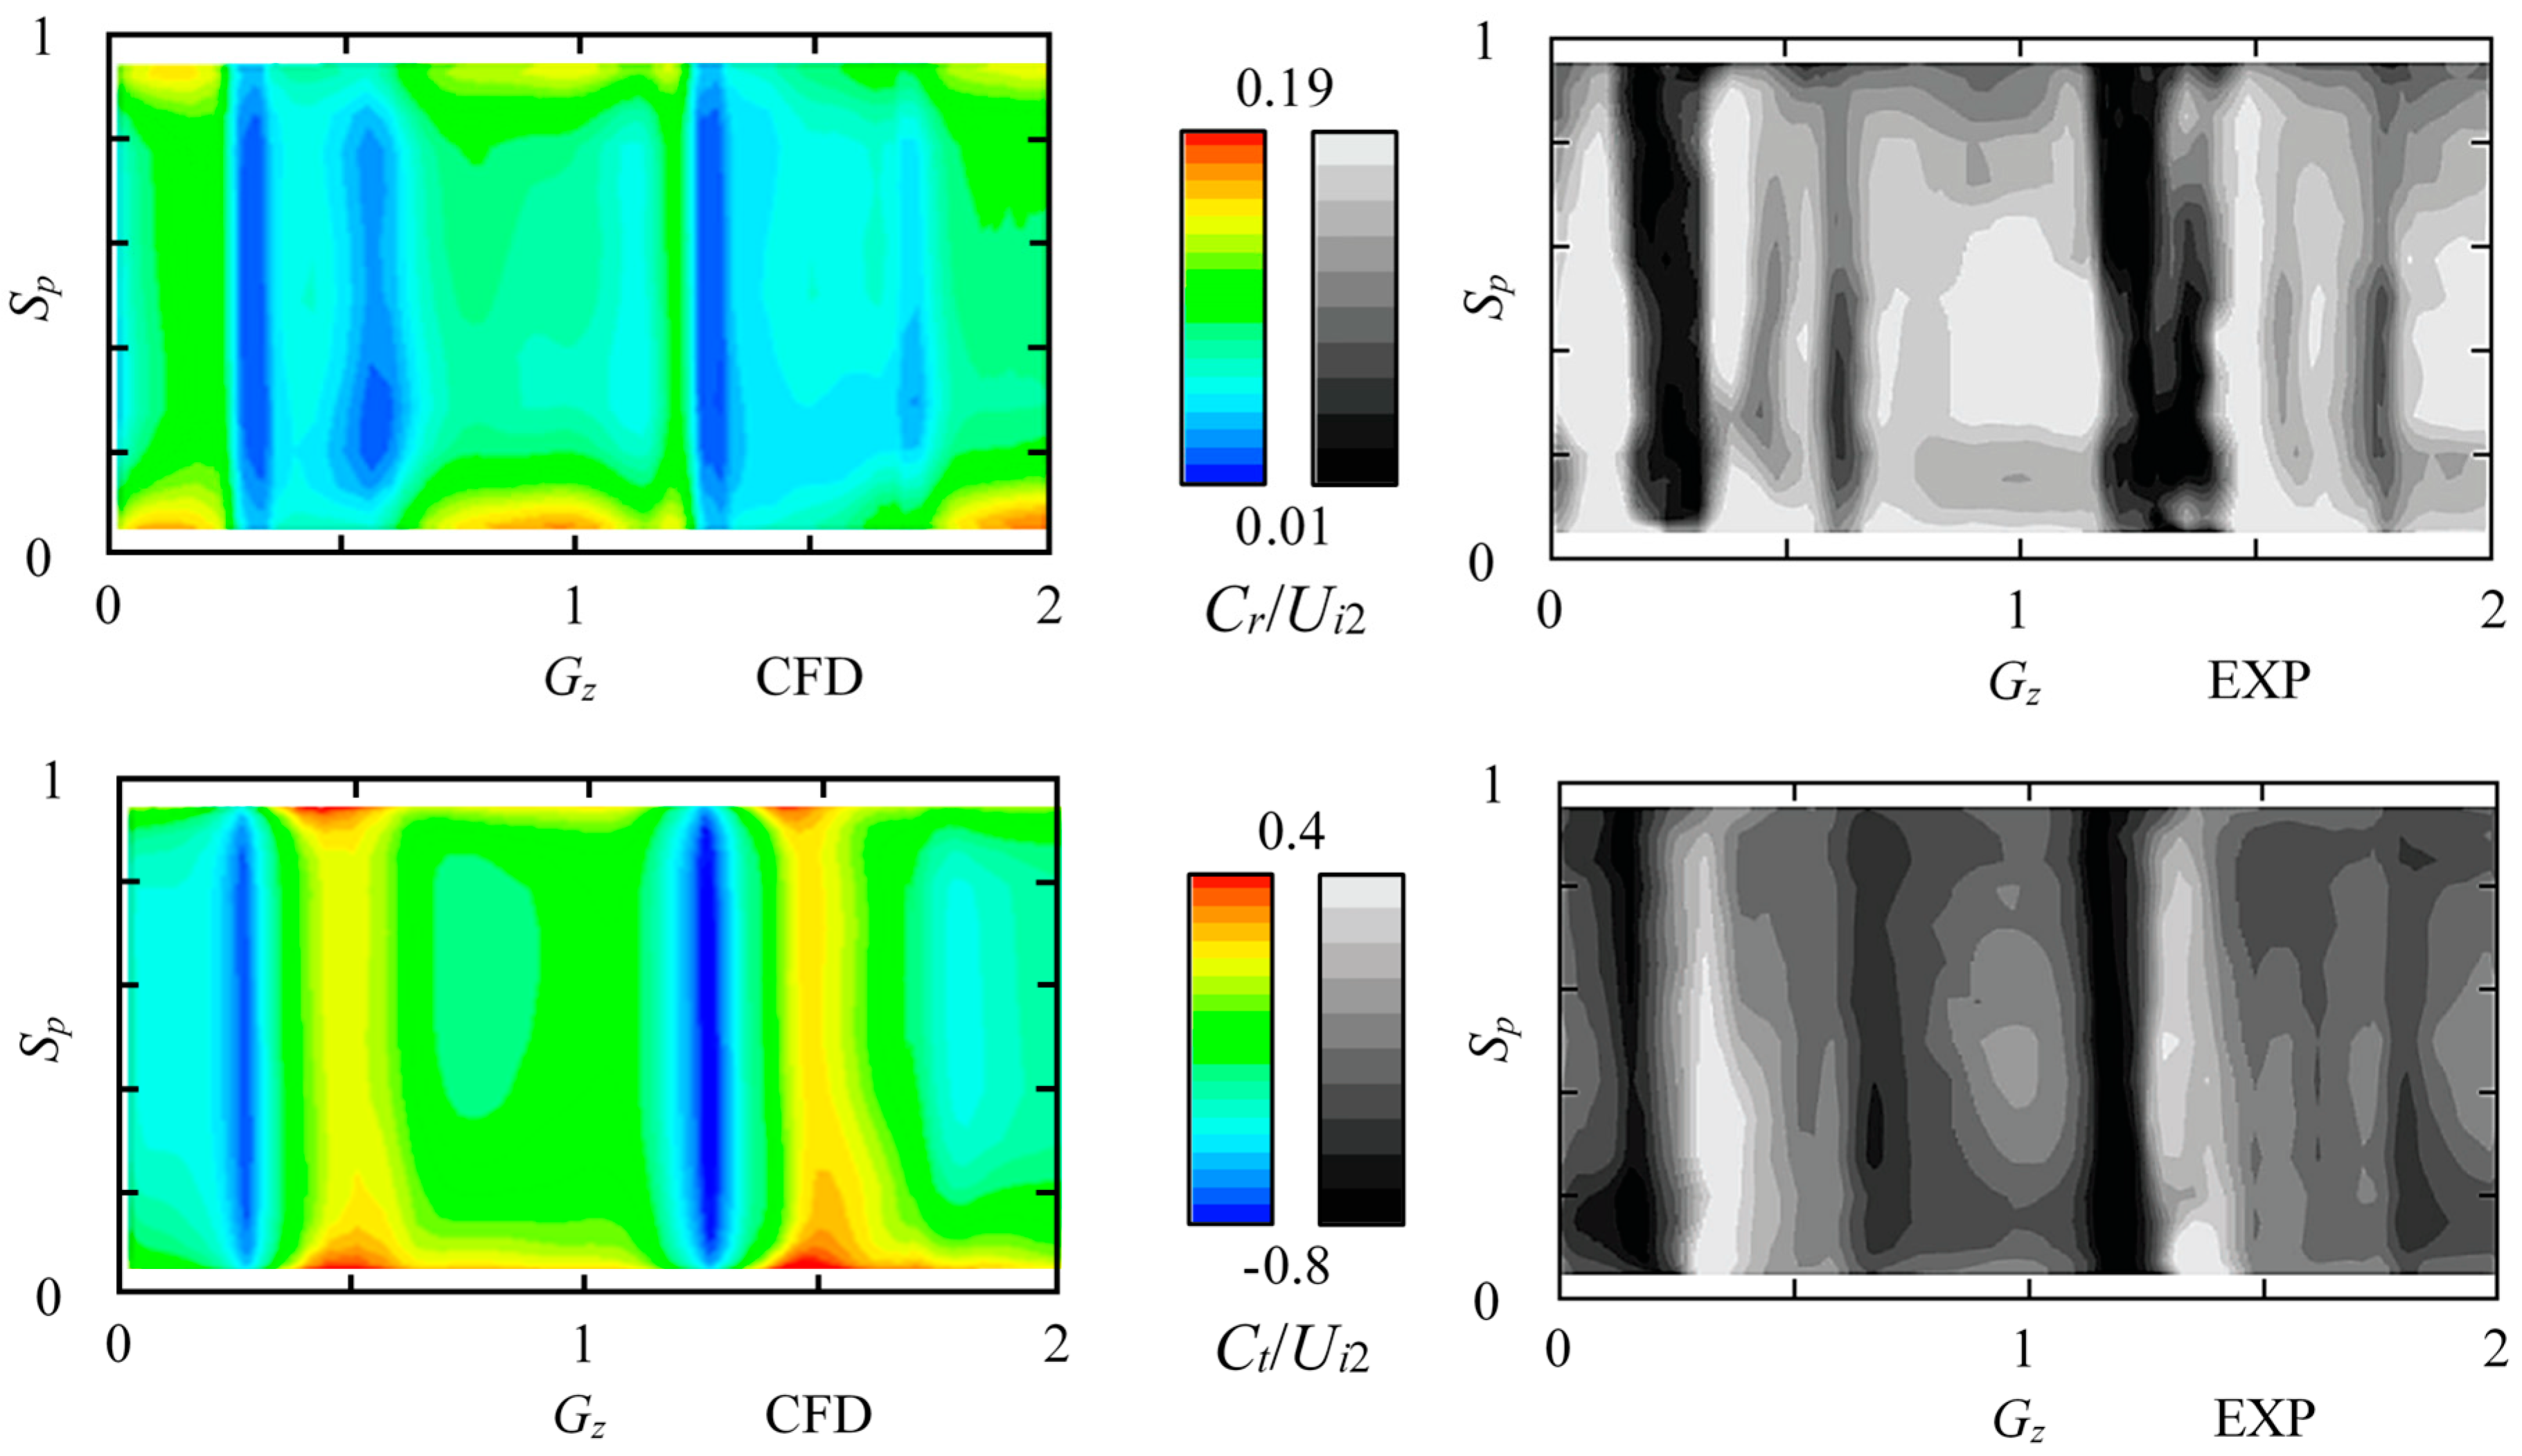
4. Numerical-Experimental Verification Study
5. Transient Flow Field Analysis at Lower-Load
5.1. Velocity Fields
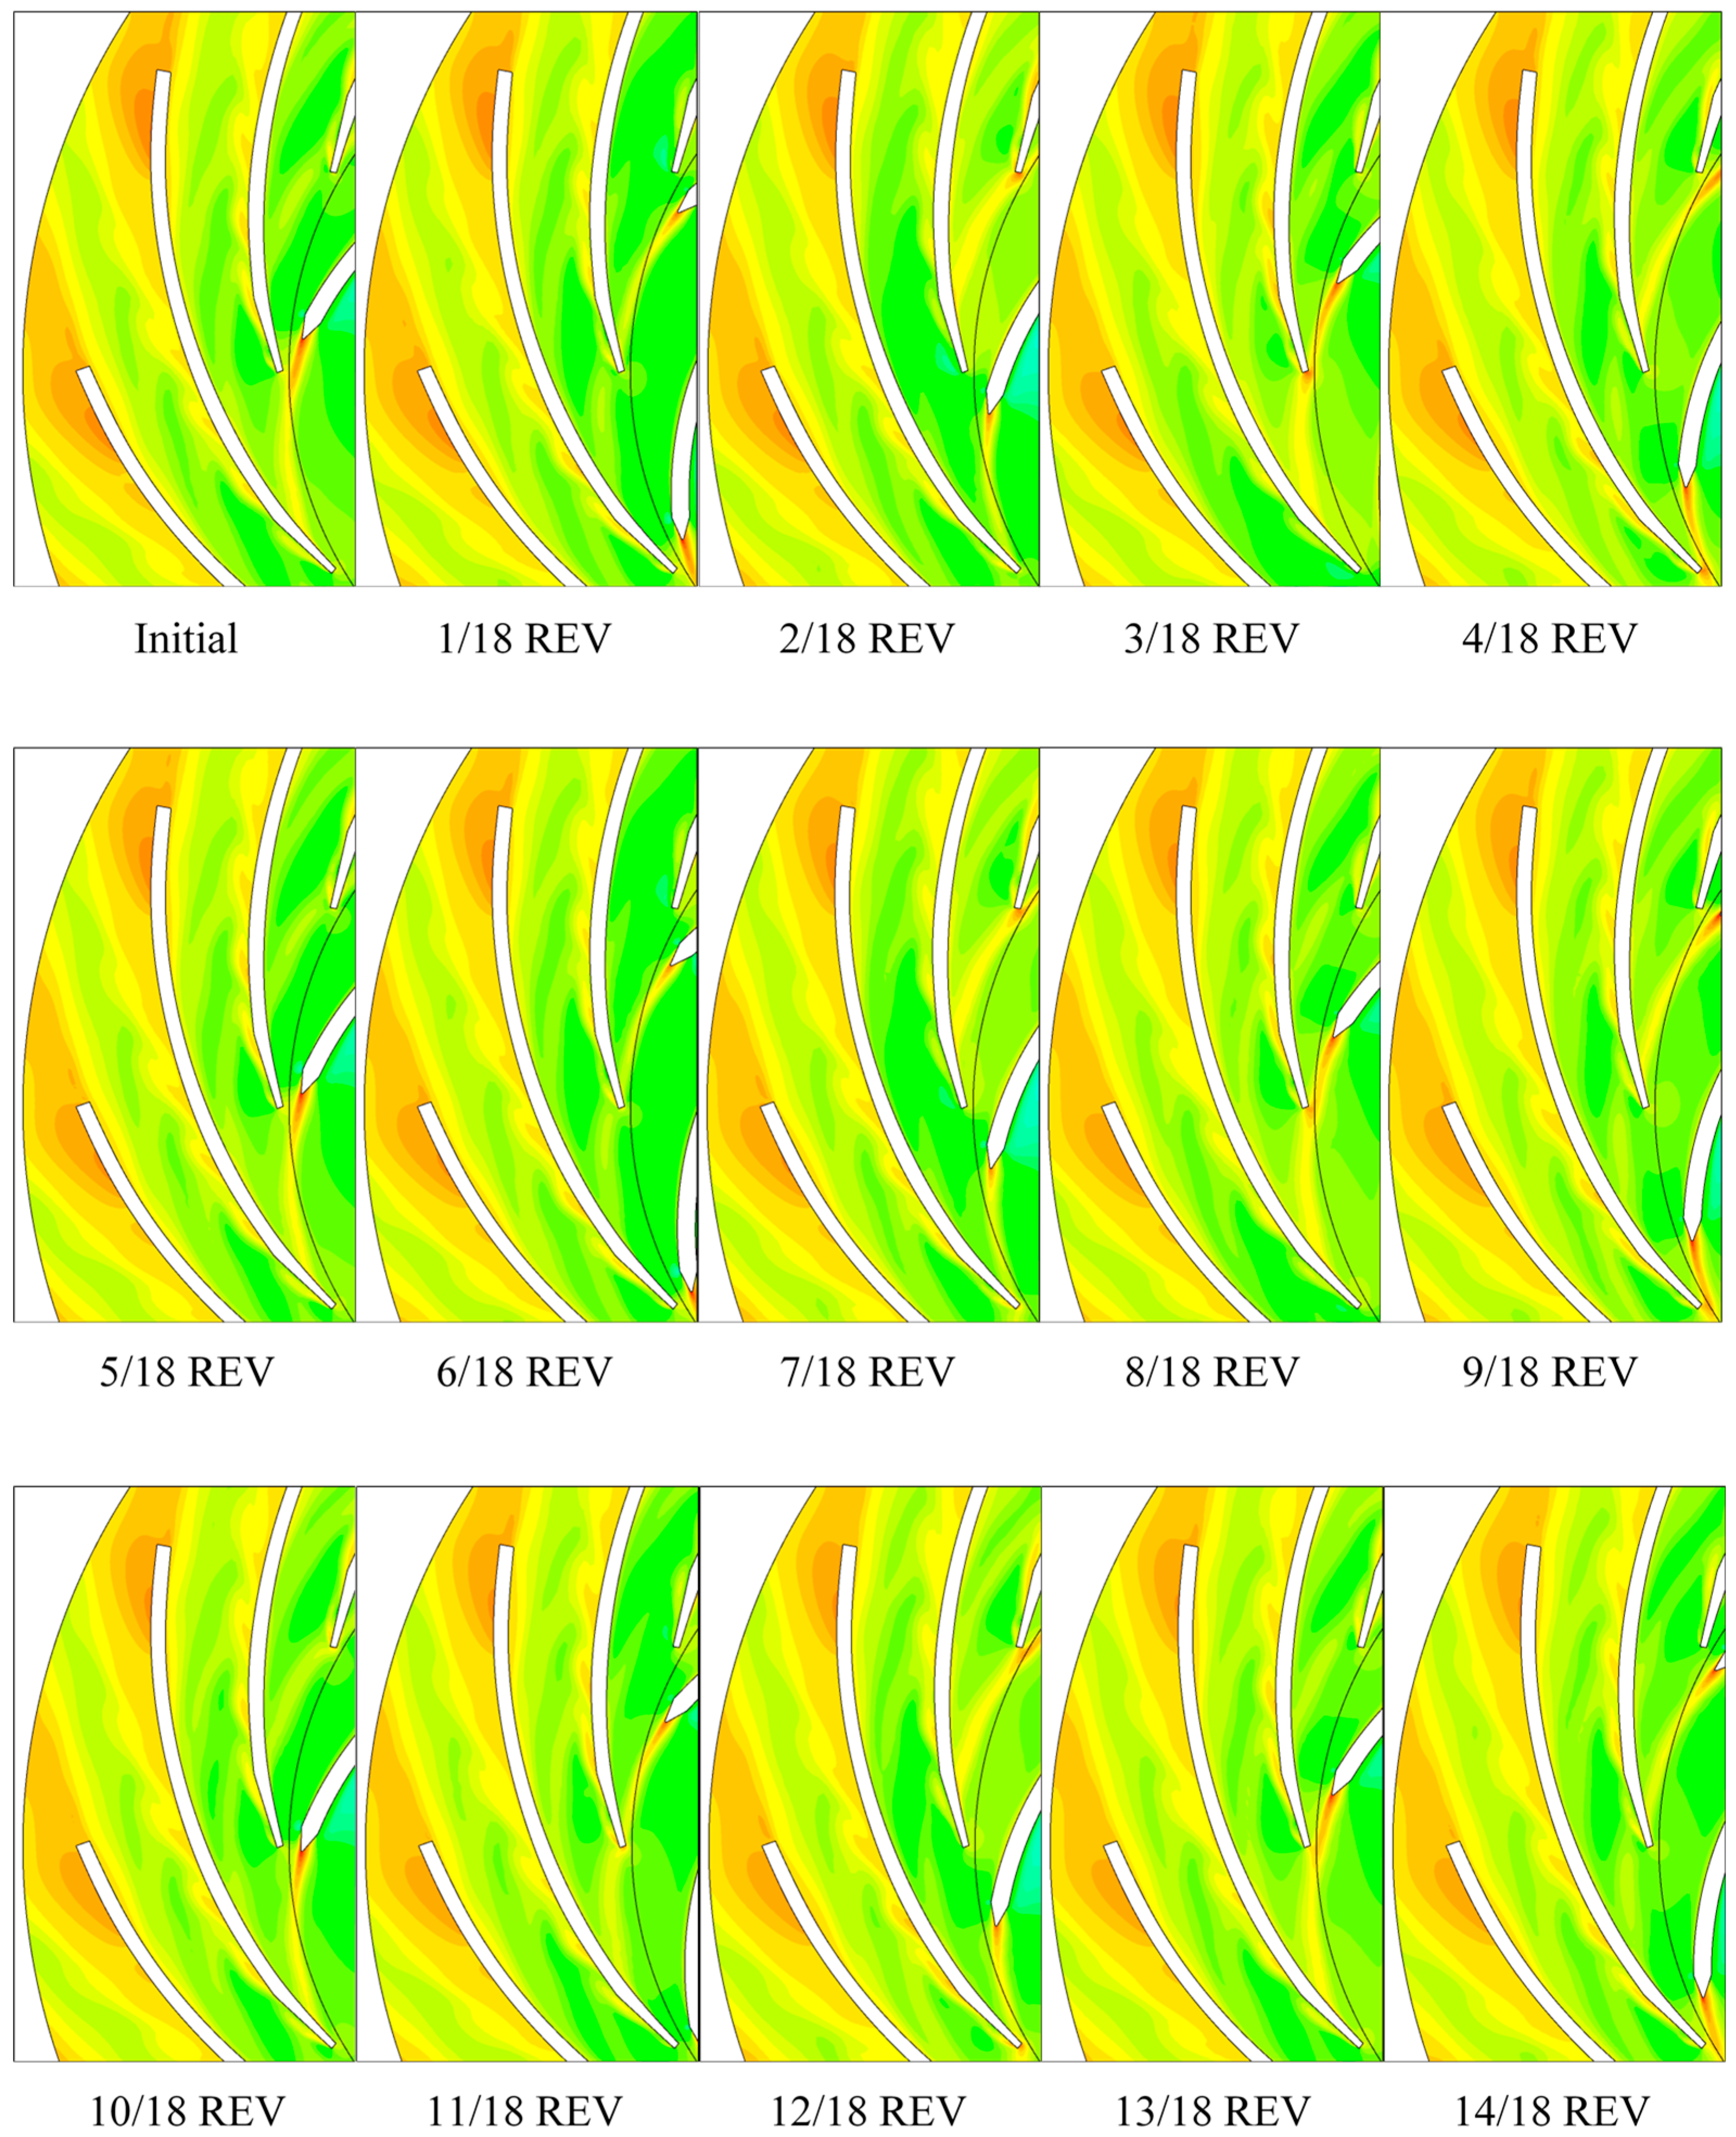
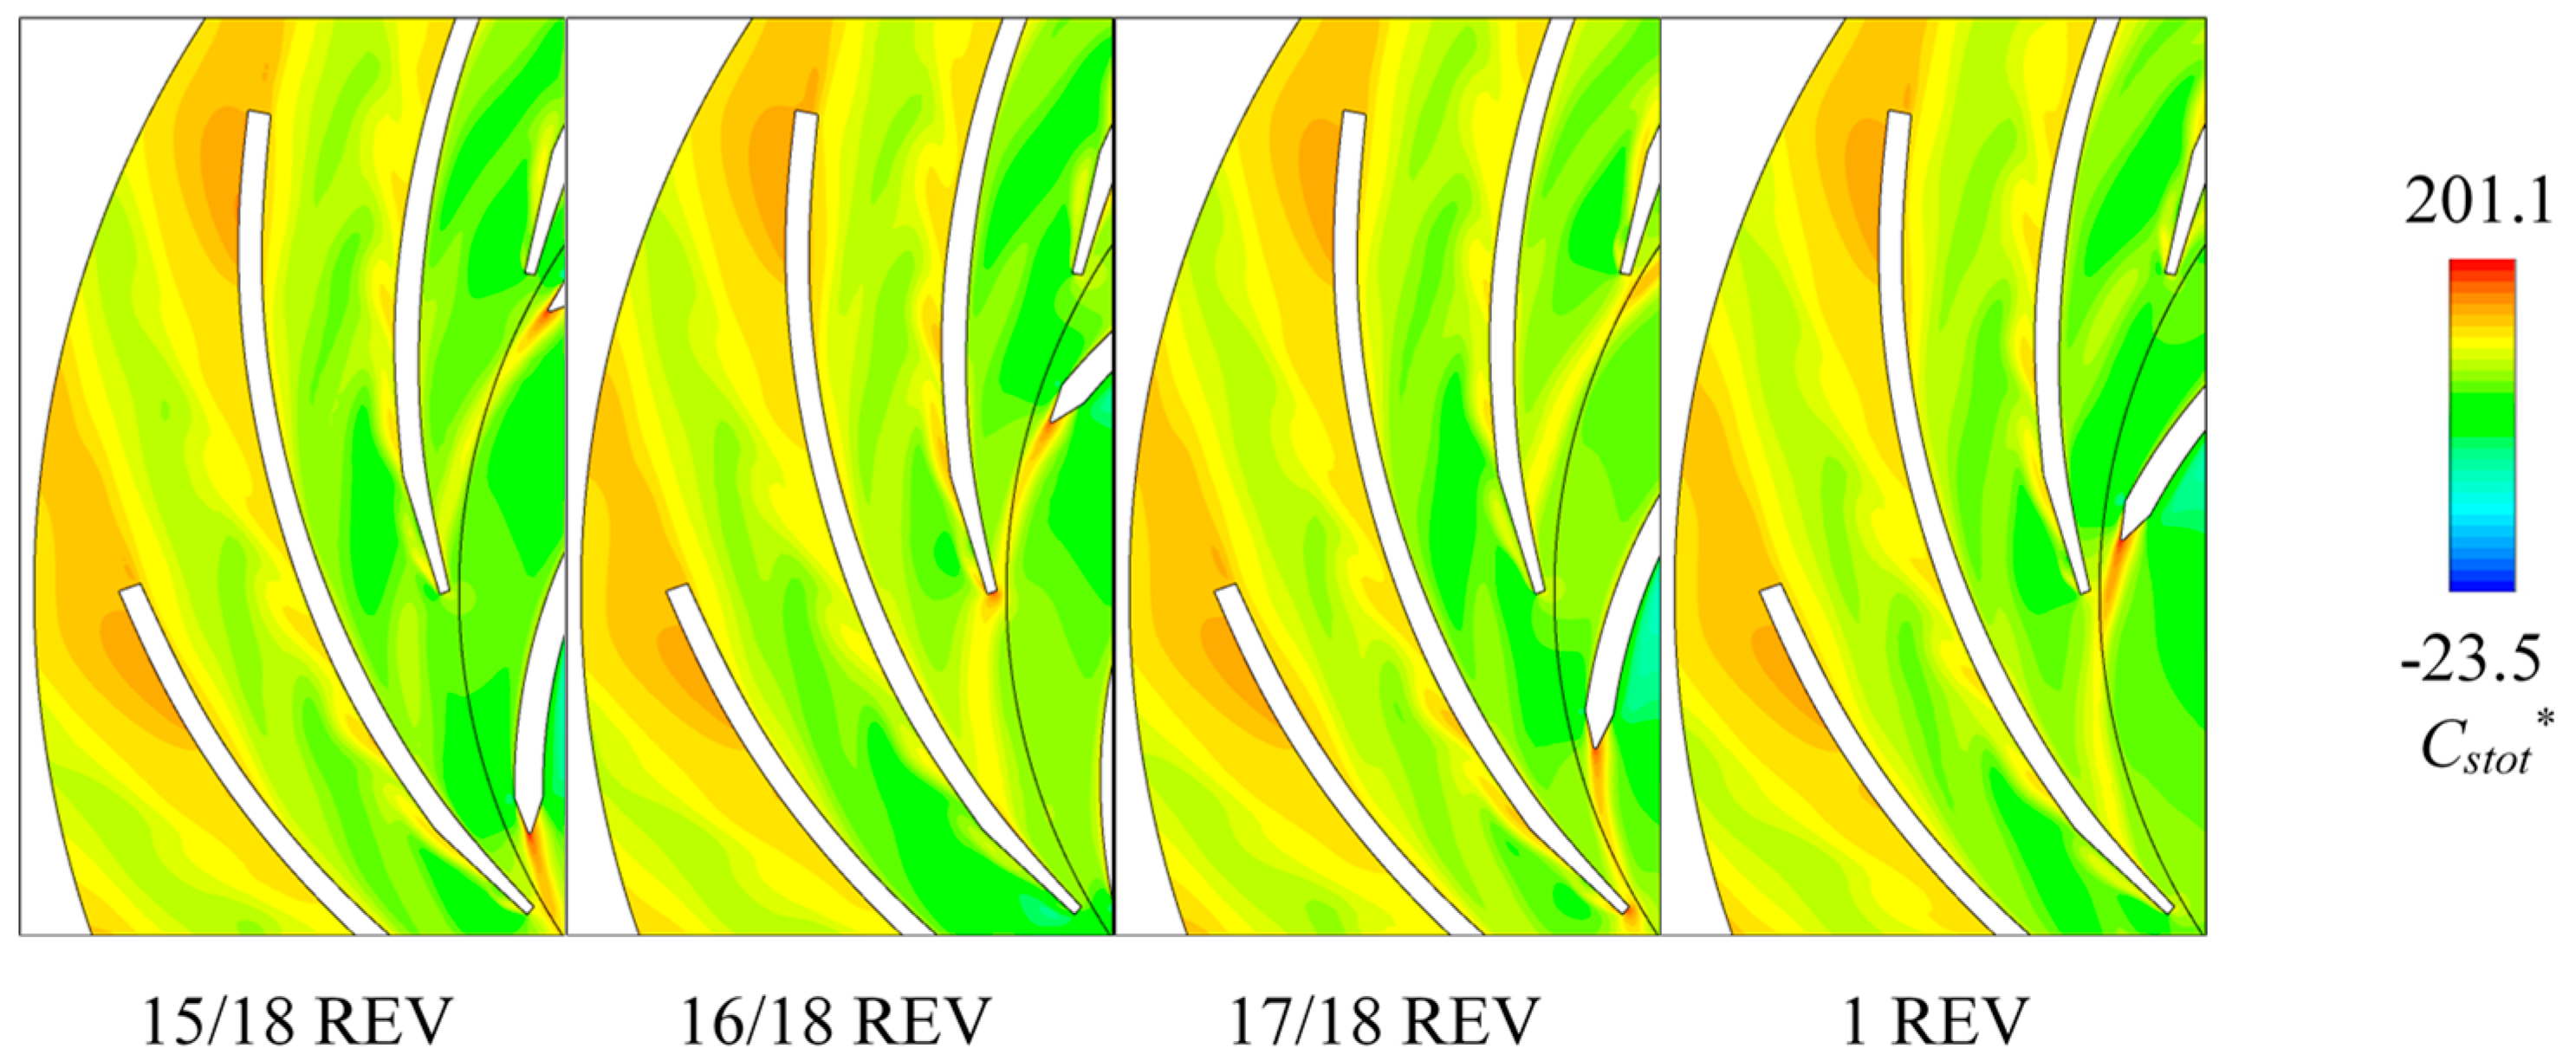
5.2. Energy Dissipation Analysis
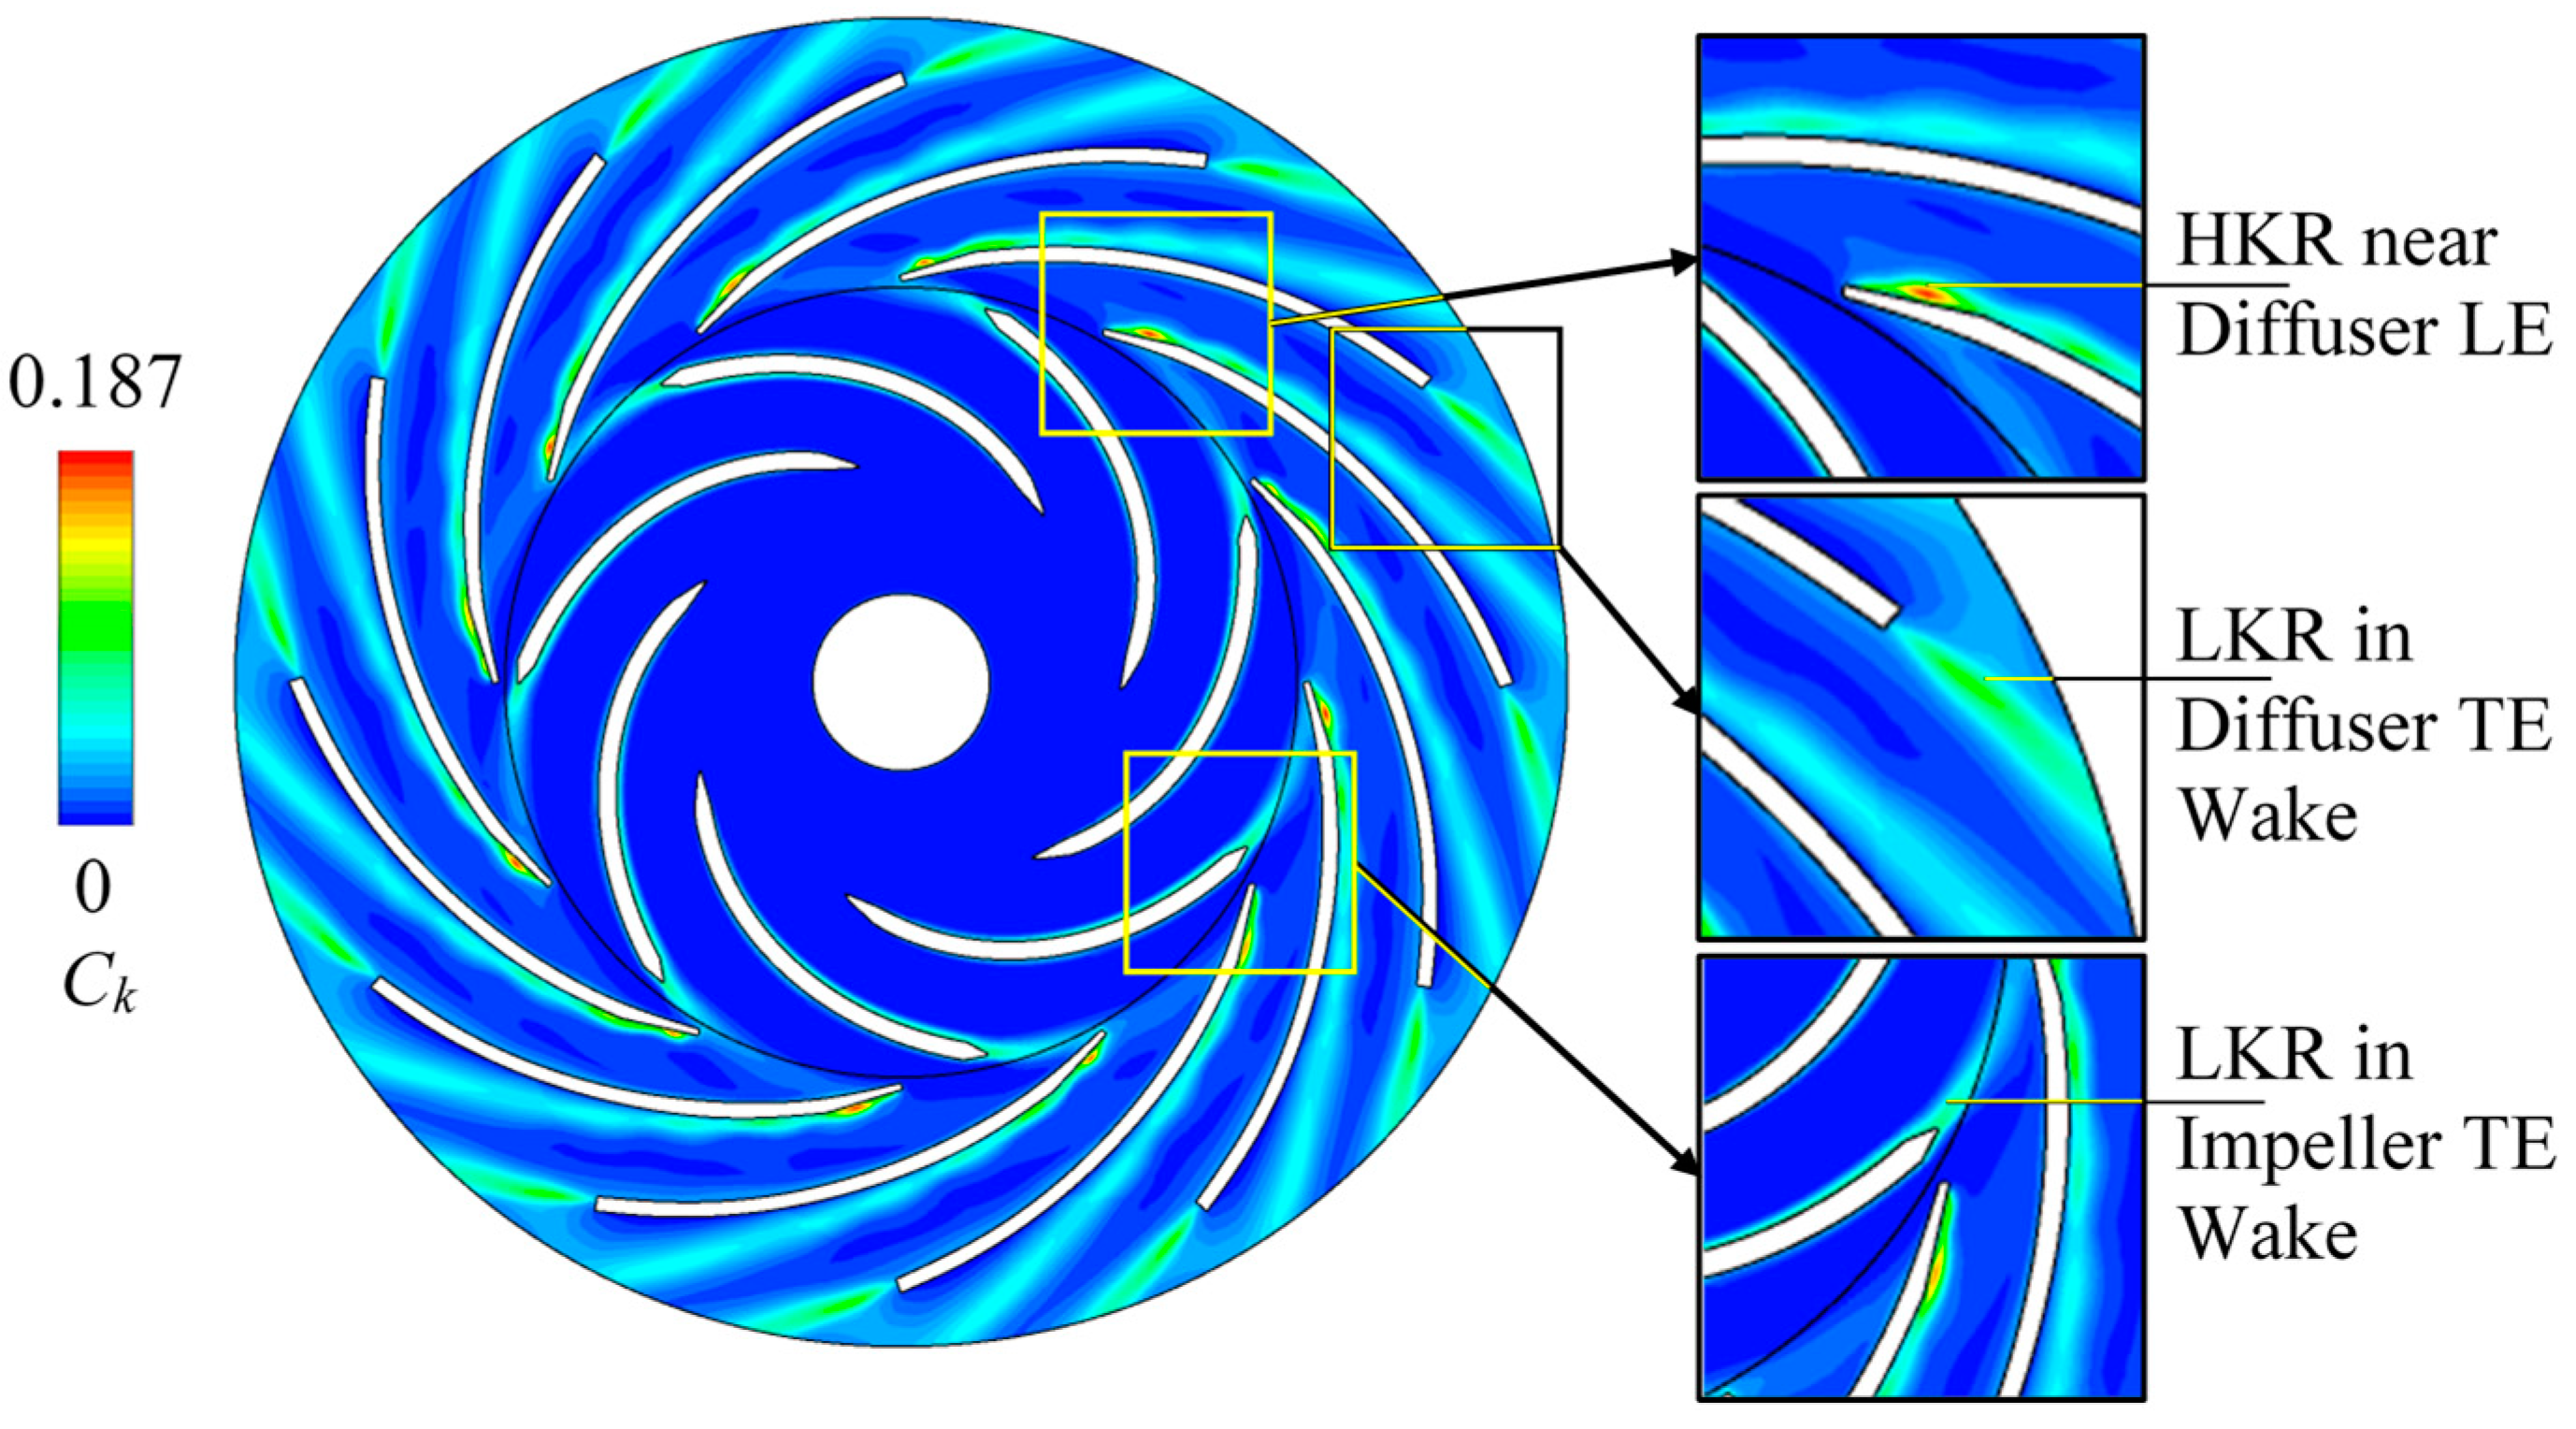
5.3. Turbulence Kinetic Energy Fields
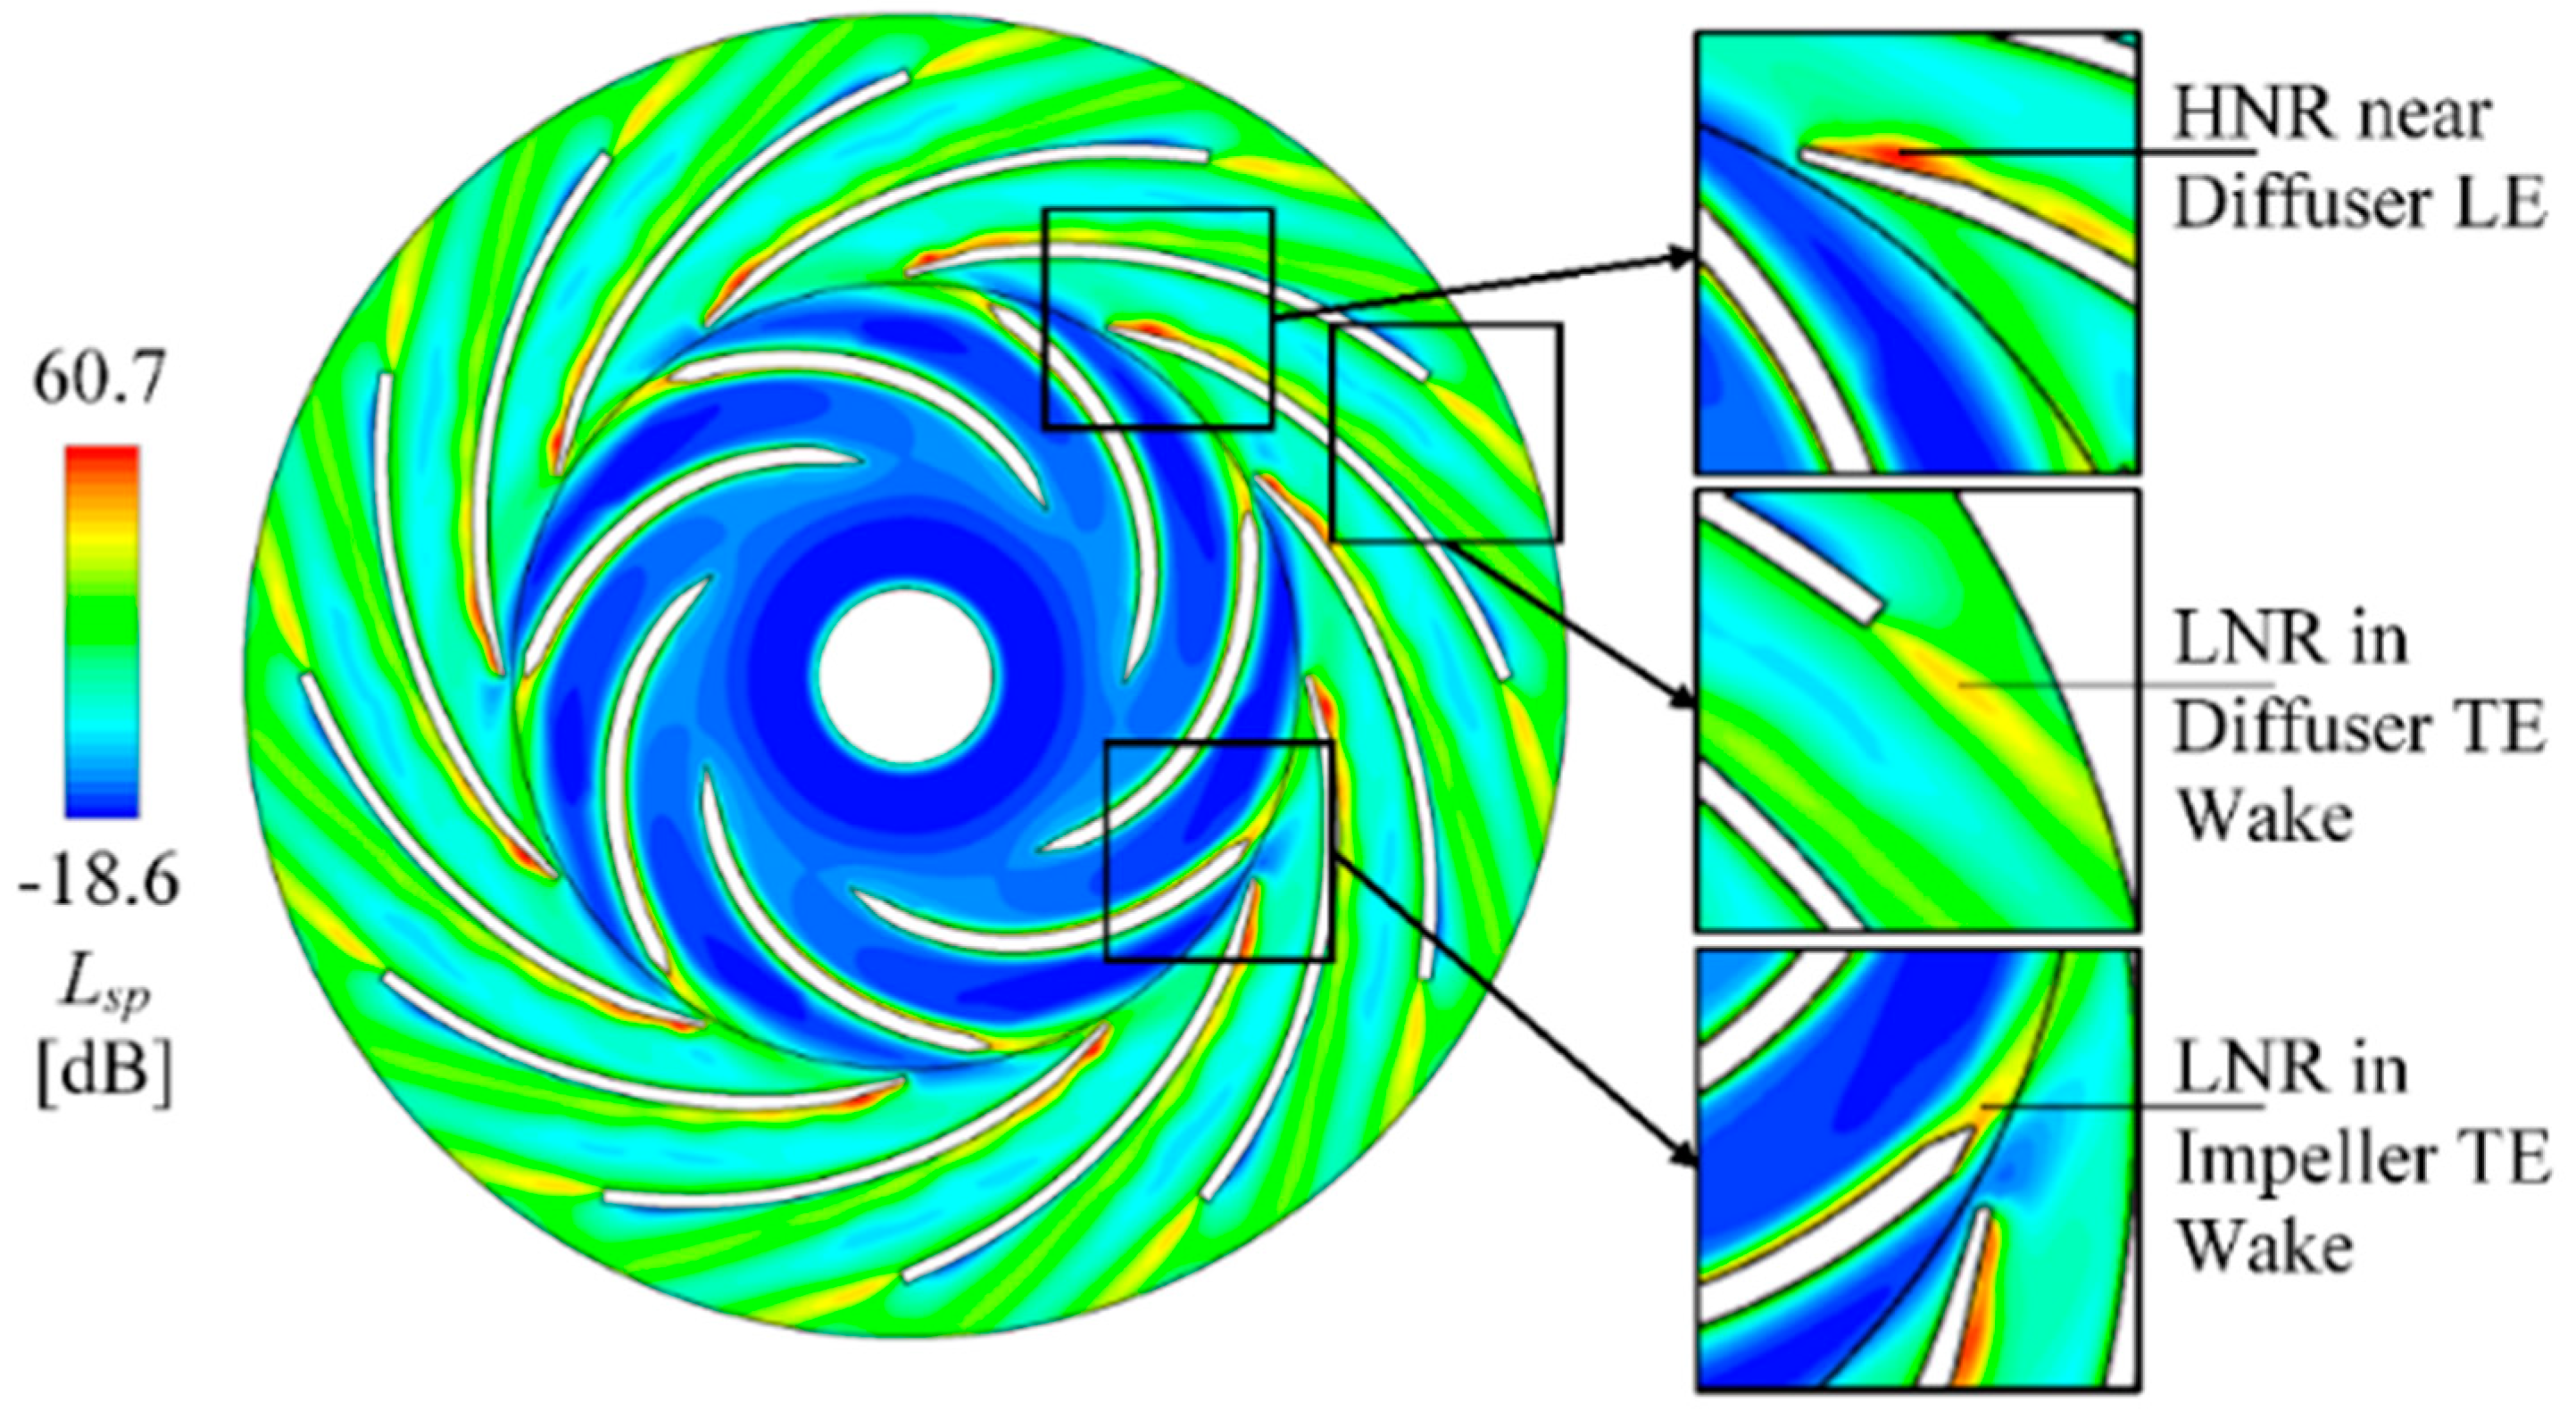
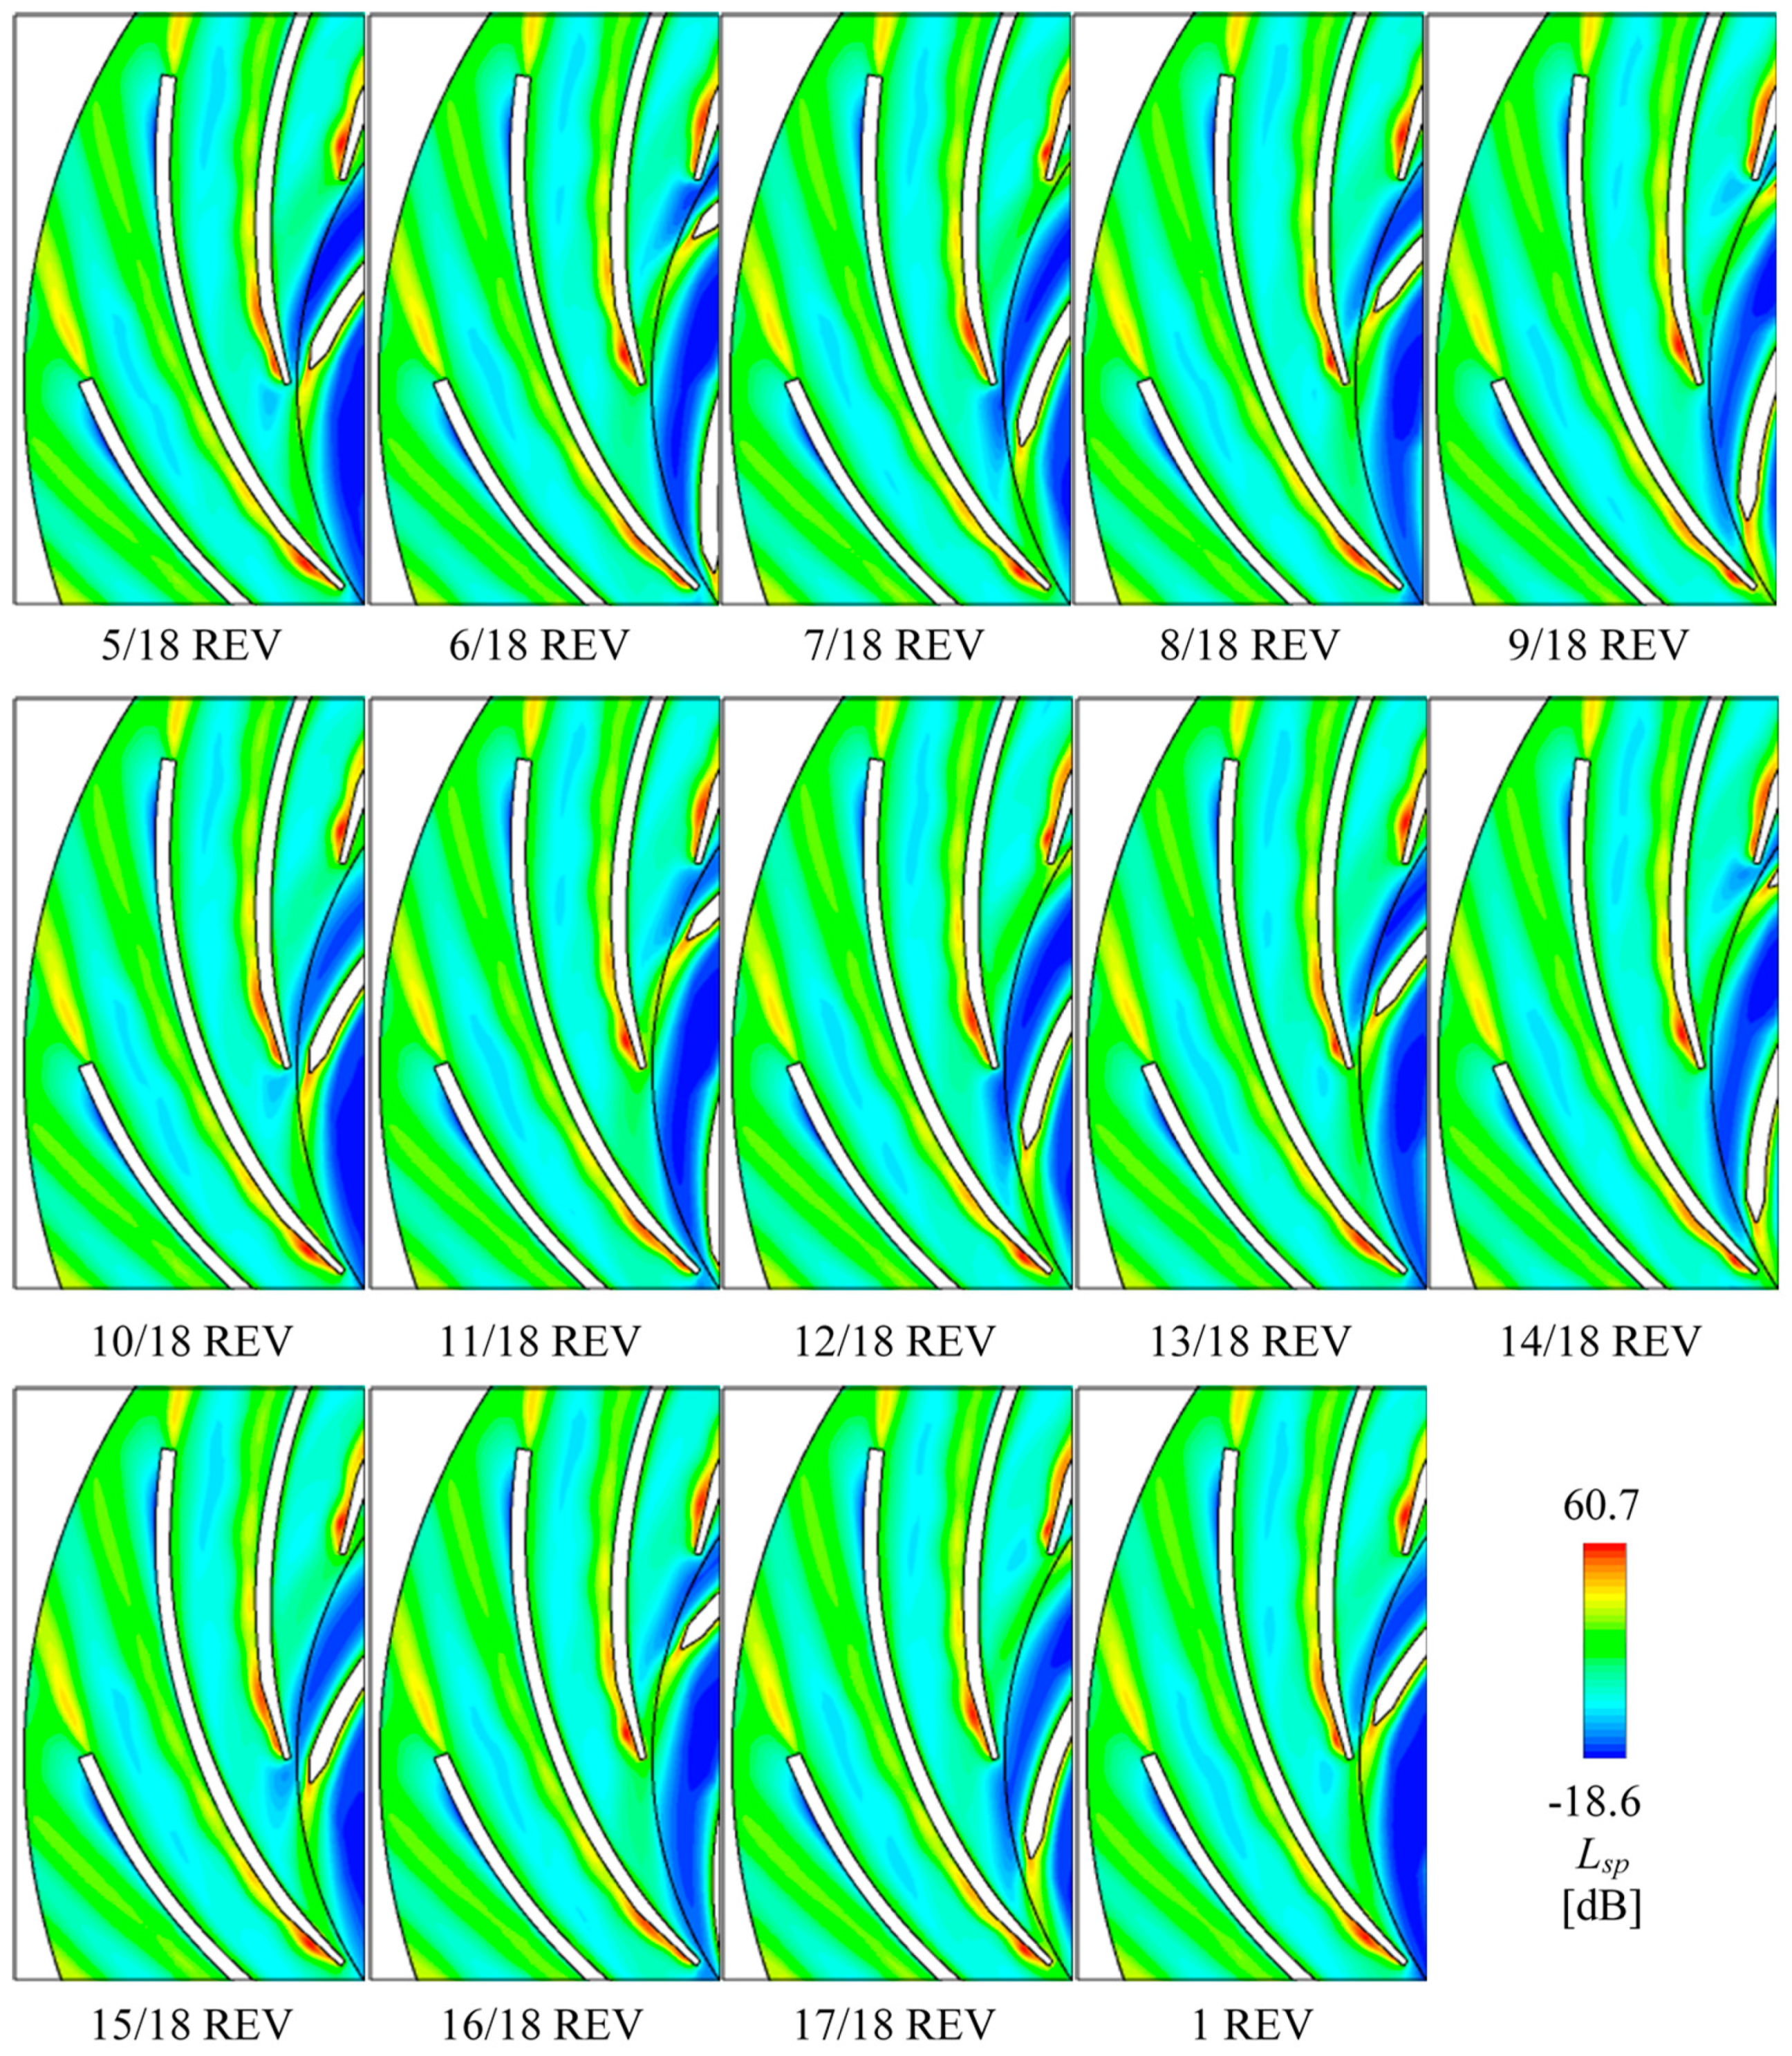
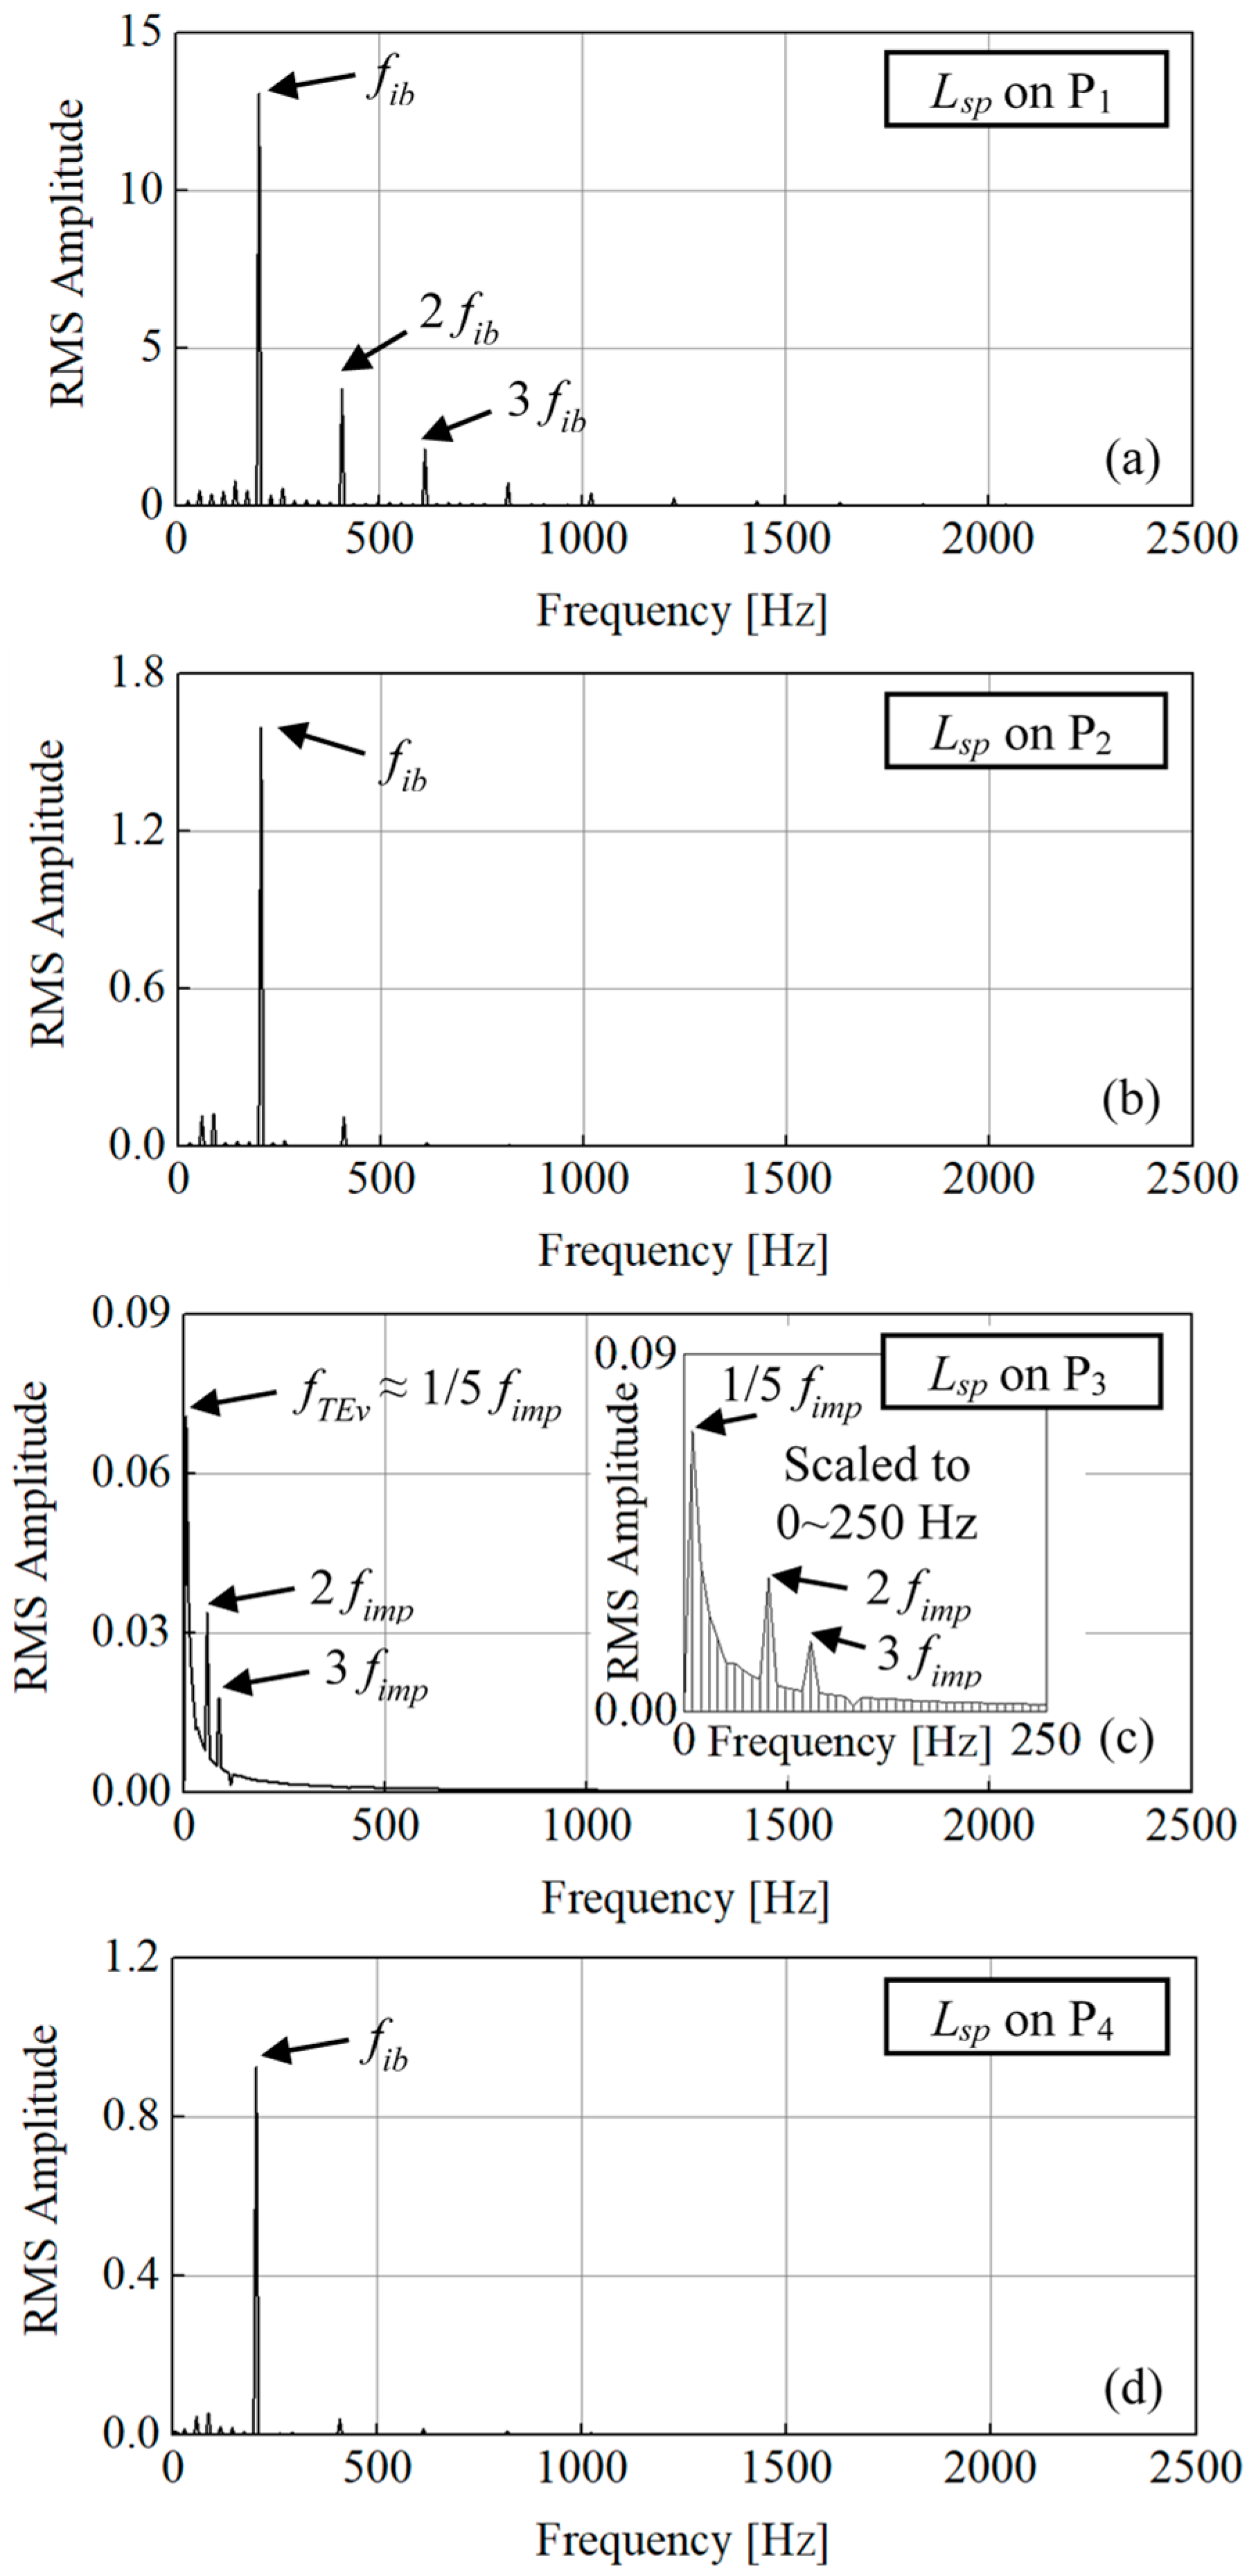
5.4. Flow Induced Noise
6. Conclusions
- (1)
- The temperature and static entropy patterns can be successfully found by applying the total energy governing equations. The flow energy which transferred to internal energy can be quantitatively known. The flow-induced noise, which might be another energy dissipation source, can be also predicted based on the turbulence flow modeling. It is found strongly relative to the turbulence kinetic energy and dissipation rate.
- (2)
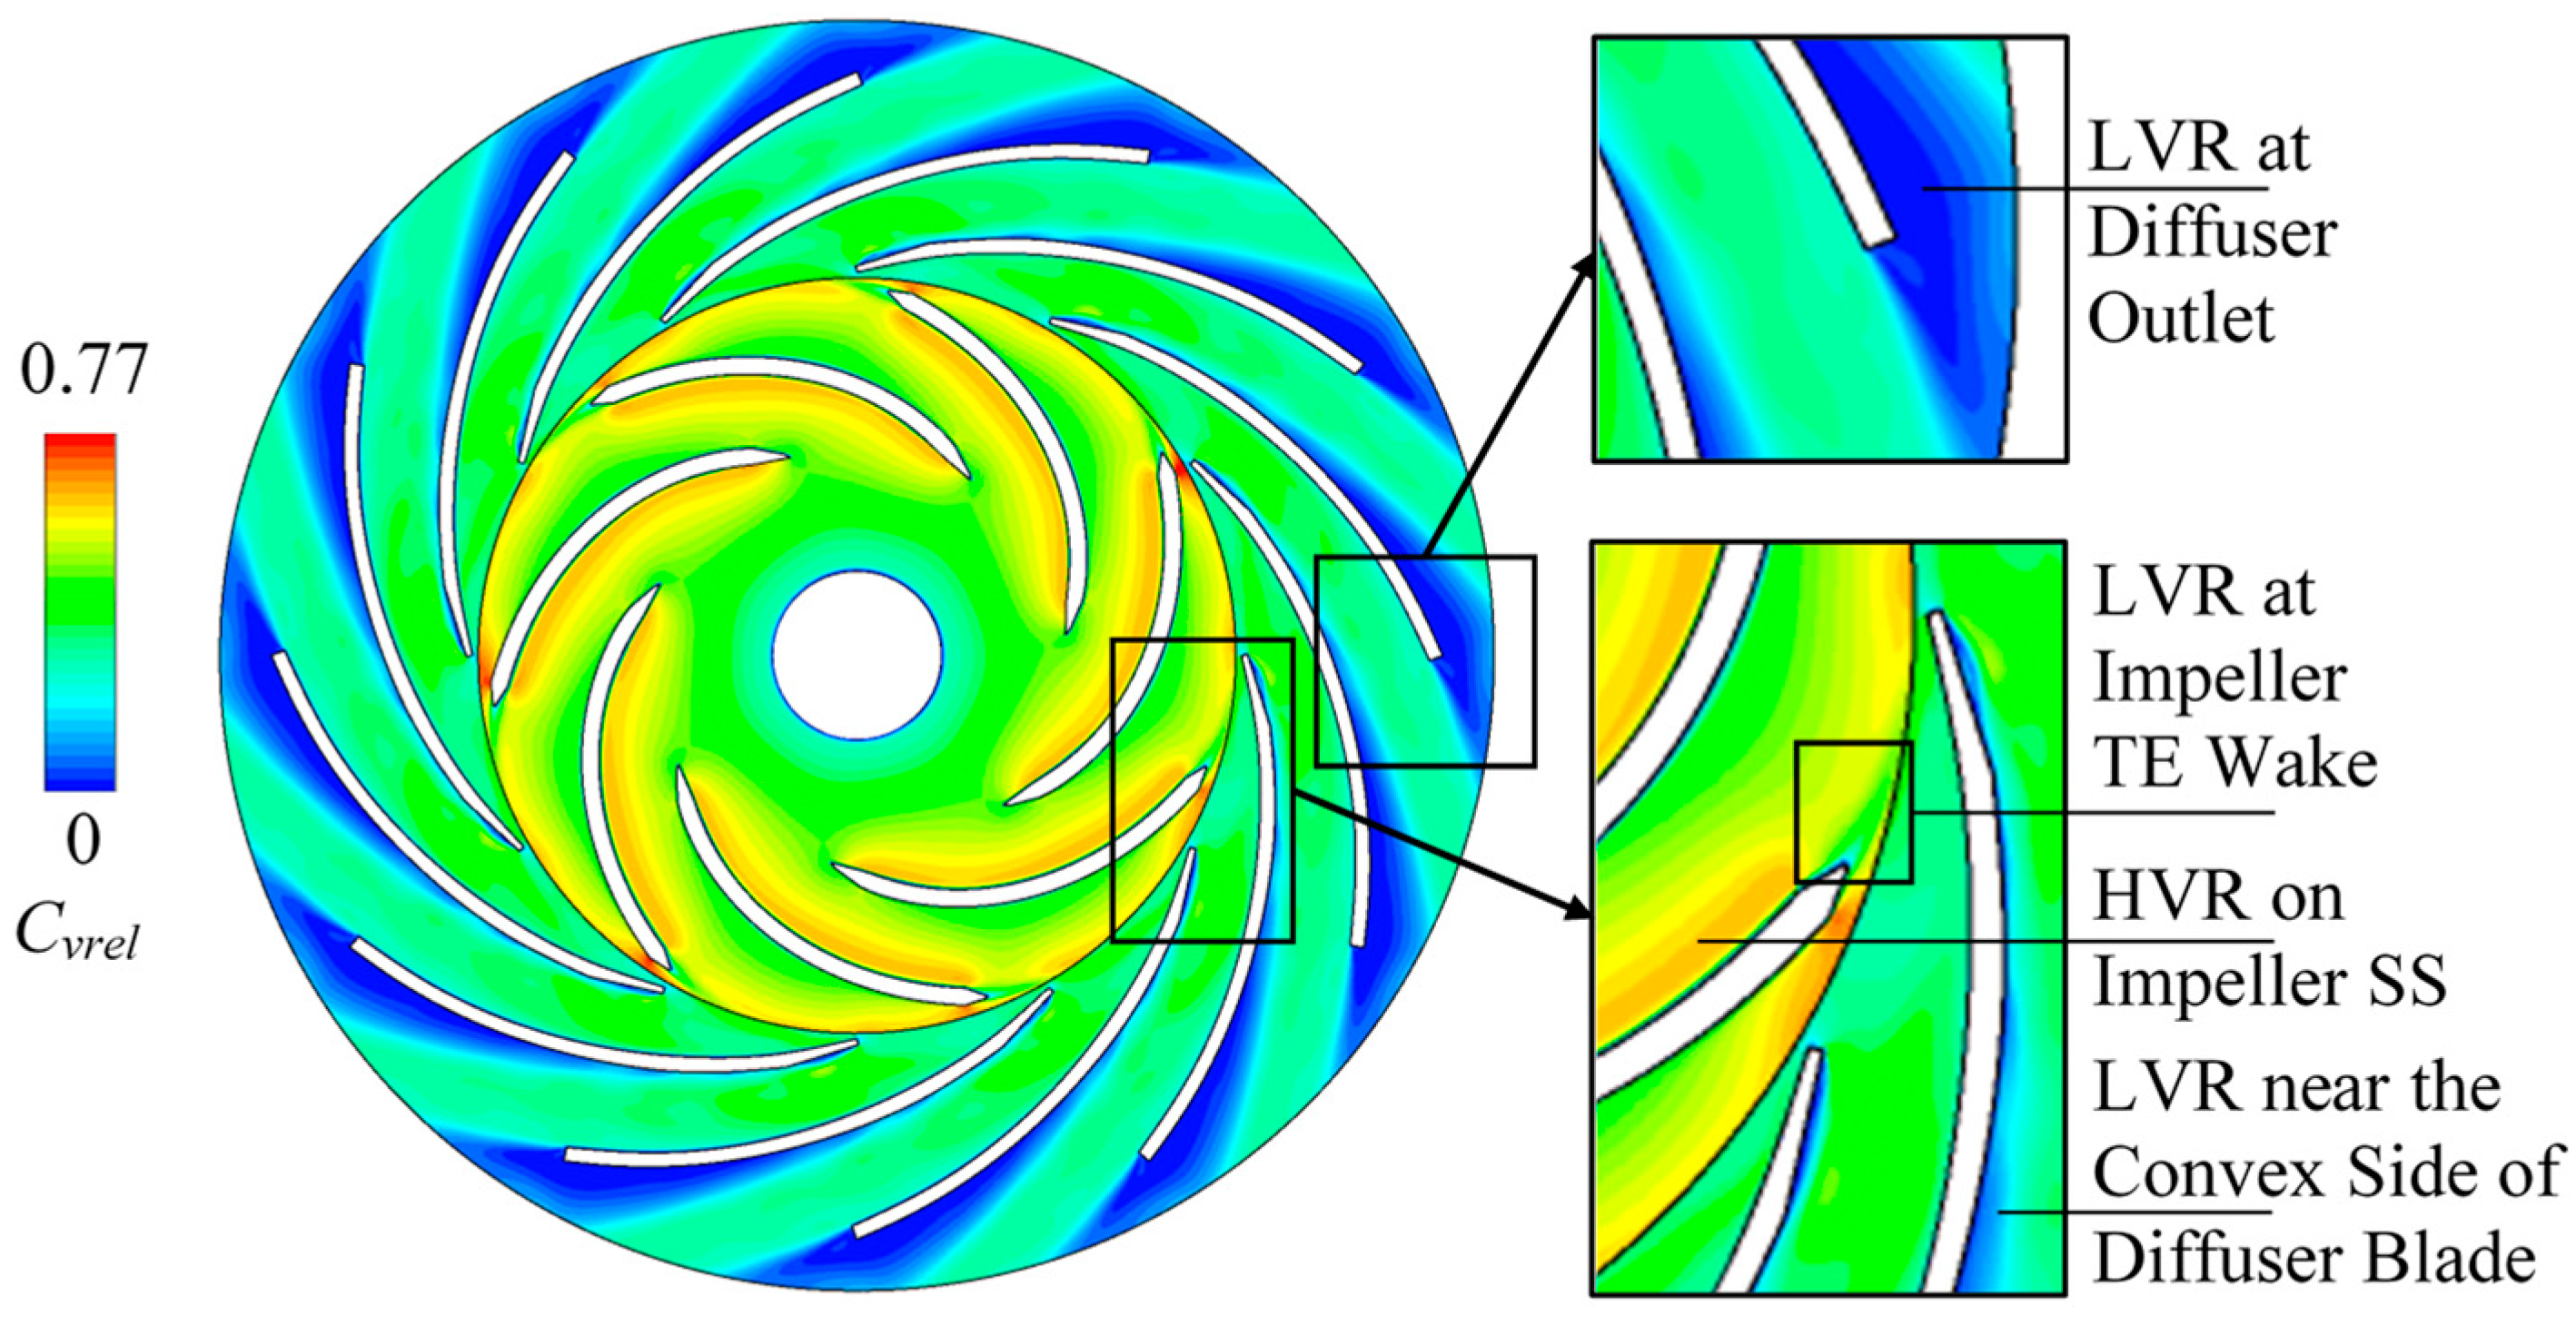
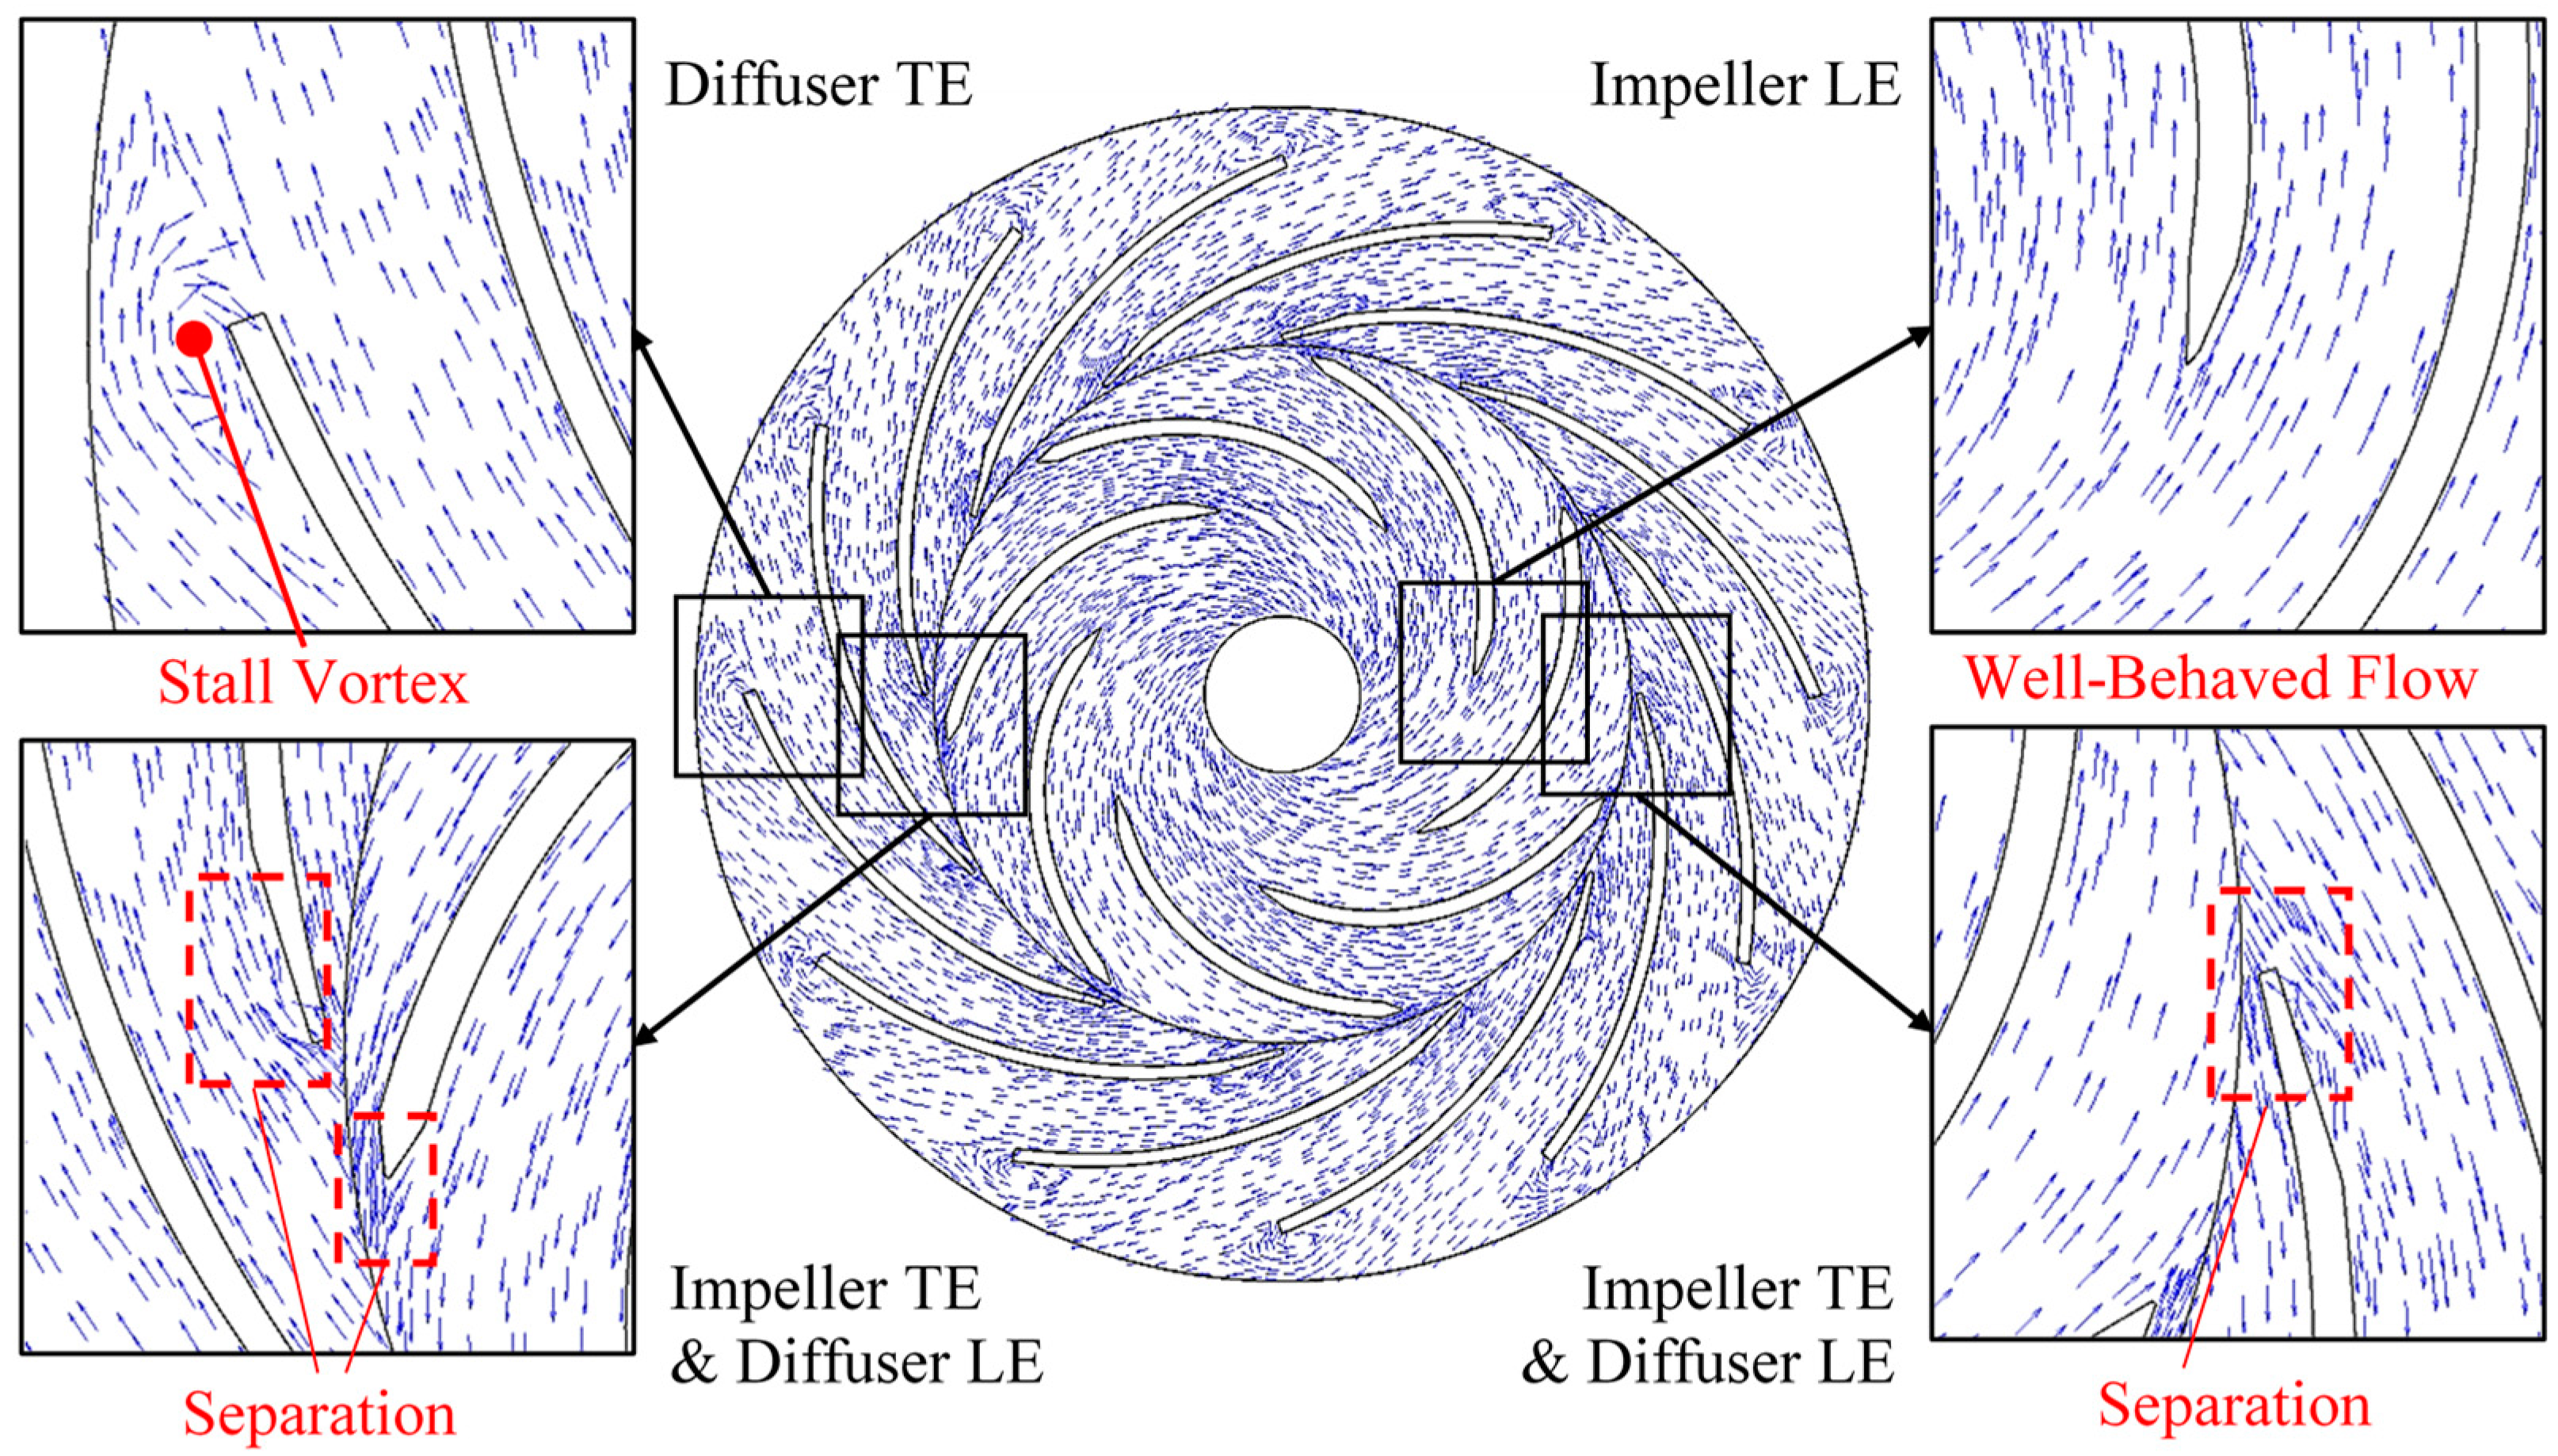
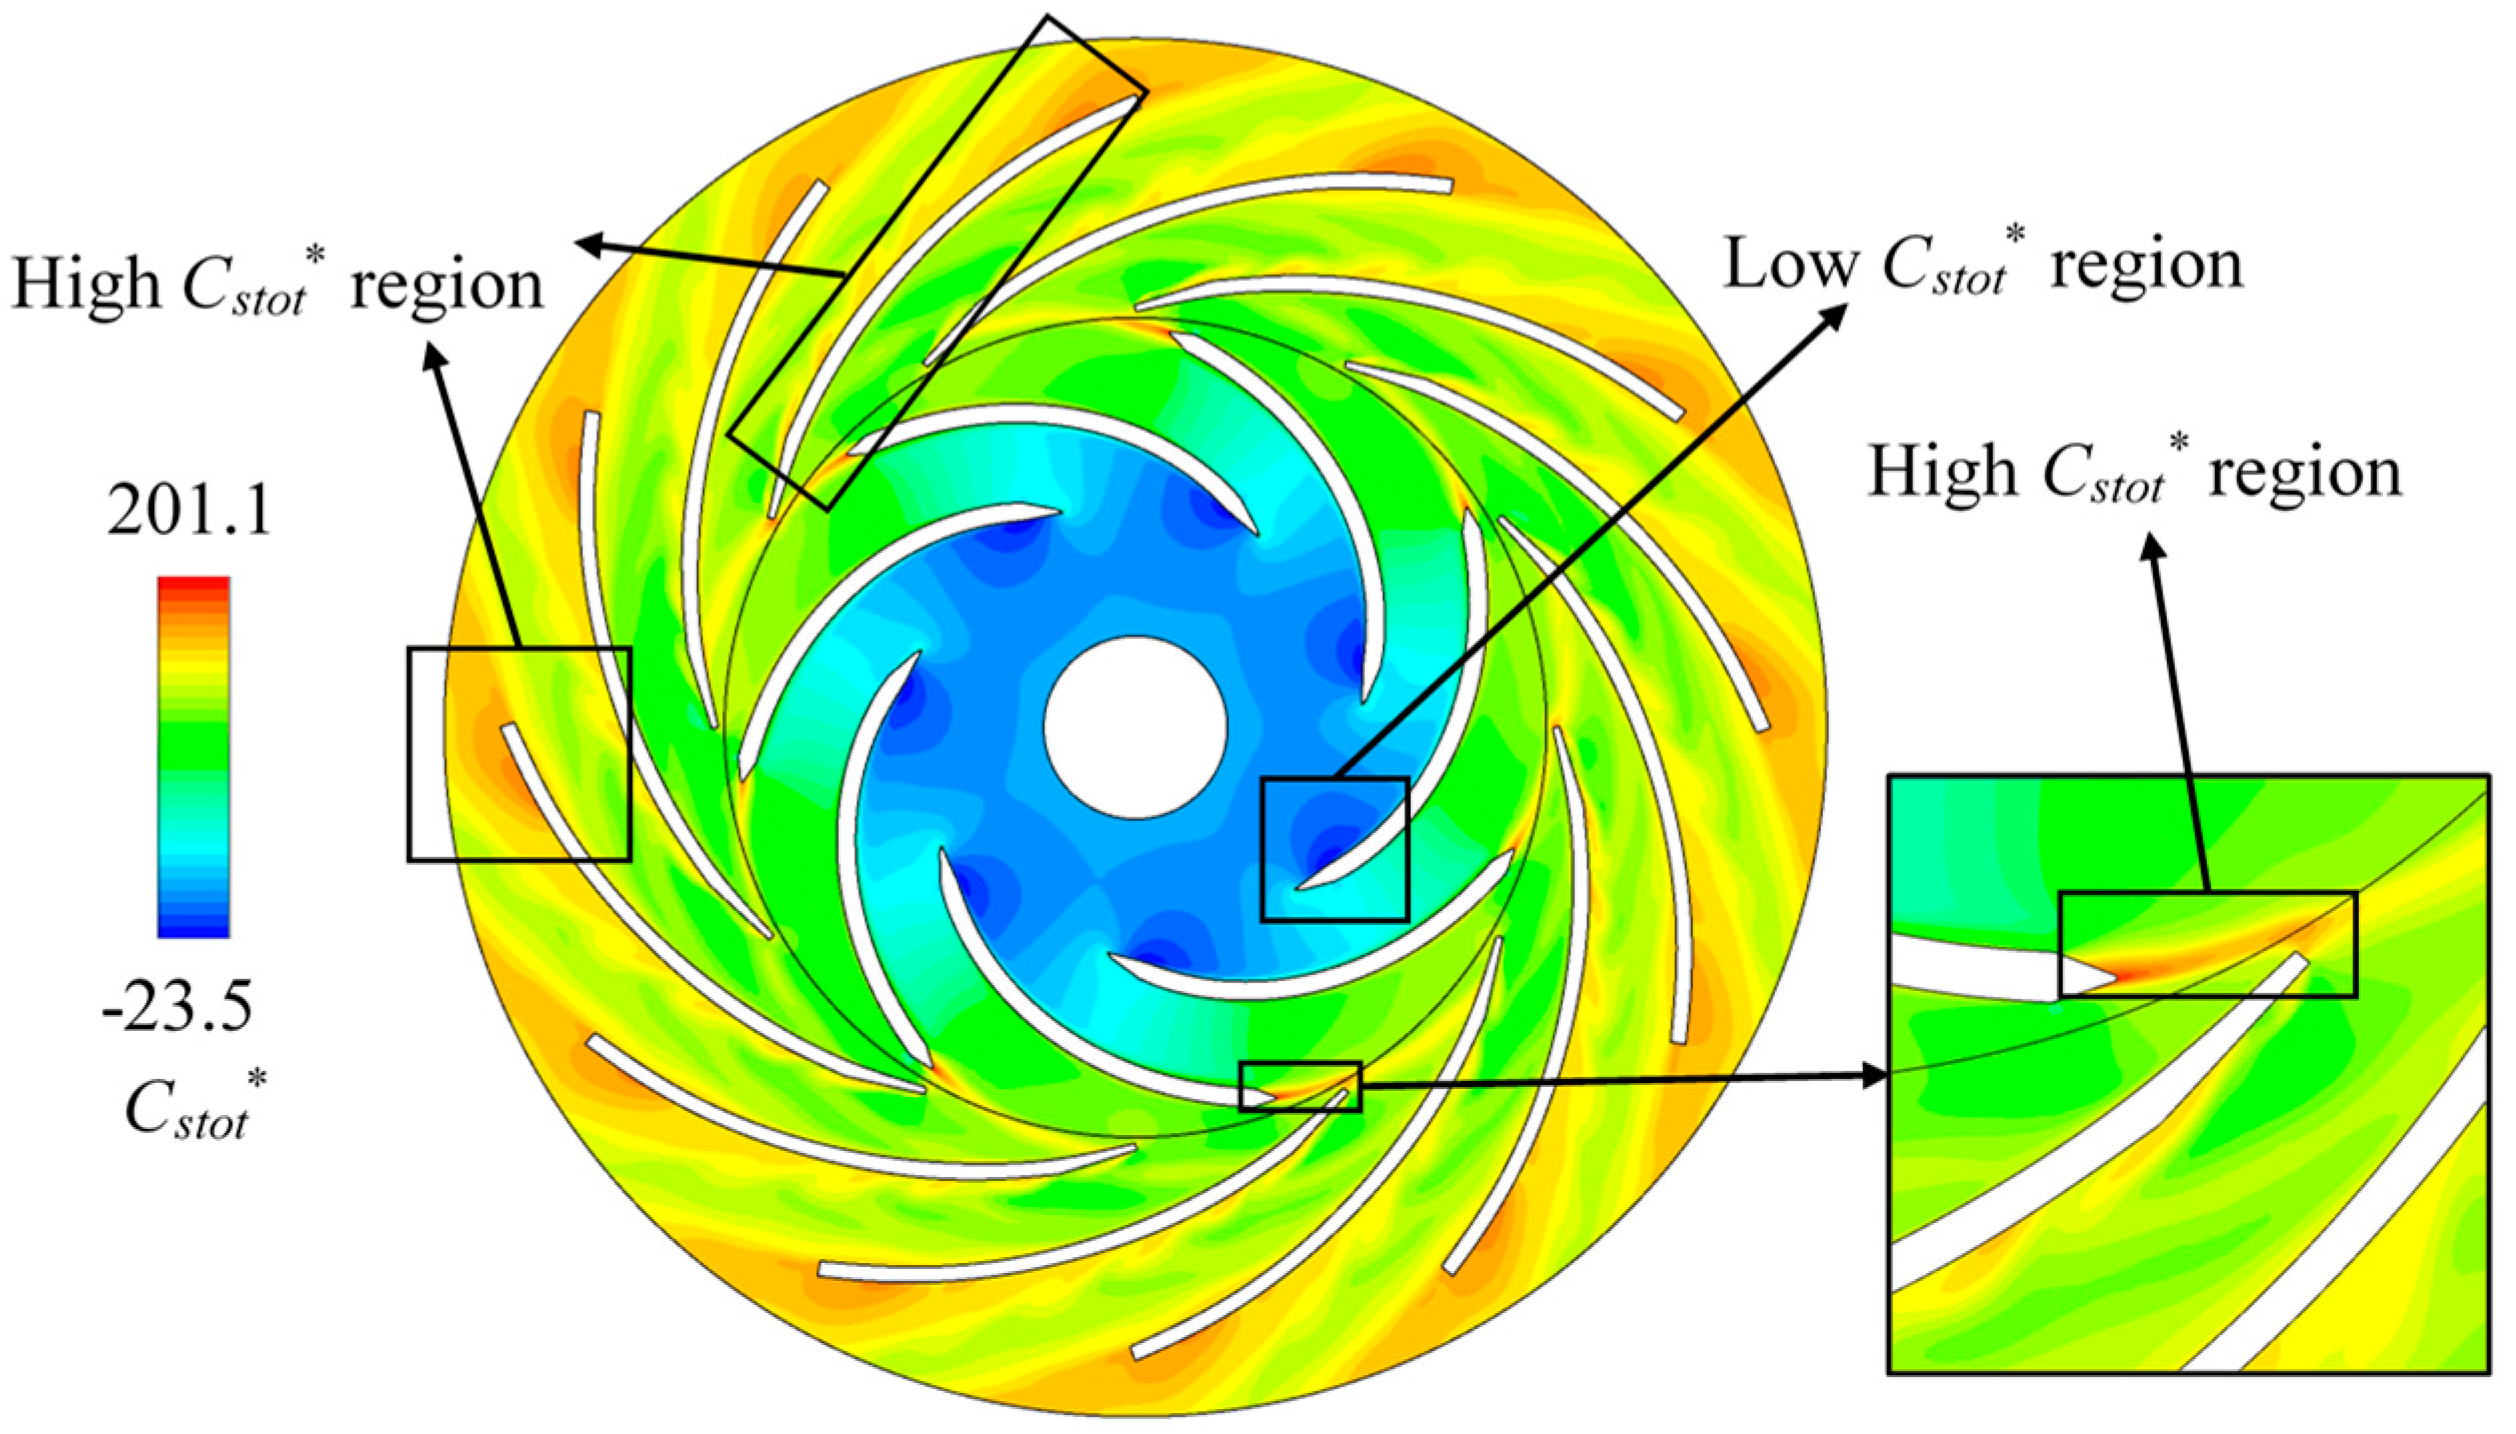
- The high static entropy sites are related to the local low velocity regions. According to the vectors of relative velocity, these low velocity regions have undesirable flow regime. The main high static entropy sites locate in the impeller trailing-edge wake, on the diffuser blade leading-edge and convex side, in the diffuser blade trailing-edge stall vortex near outlet and in the diffuser blade trailing-edge wake. The high noise sites overlap some of the high static entropy sites. These overlapped noisy sites are also due to the local undesirable flow regime. There is an exception as stall vortex near diffuser blade trailing-edge. The flow-induced noise is constantly very low because of the local low turbulence kinetic energy. Accordingly, different flow structures have different energy dissipation mechanisms. In this case, rotor-stator interaction affects both the internal energy and the flow-induced noise. The stalled vortex flow mainly causes the internal energy variation but weak in producing noise.
- (3)
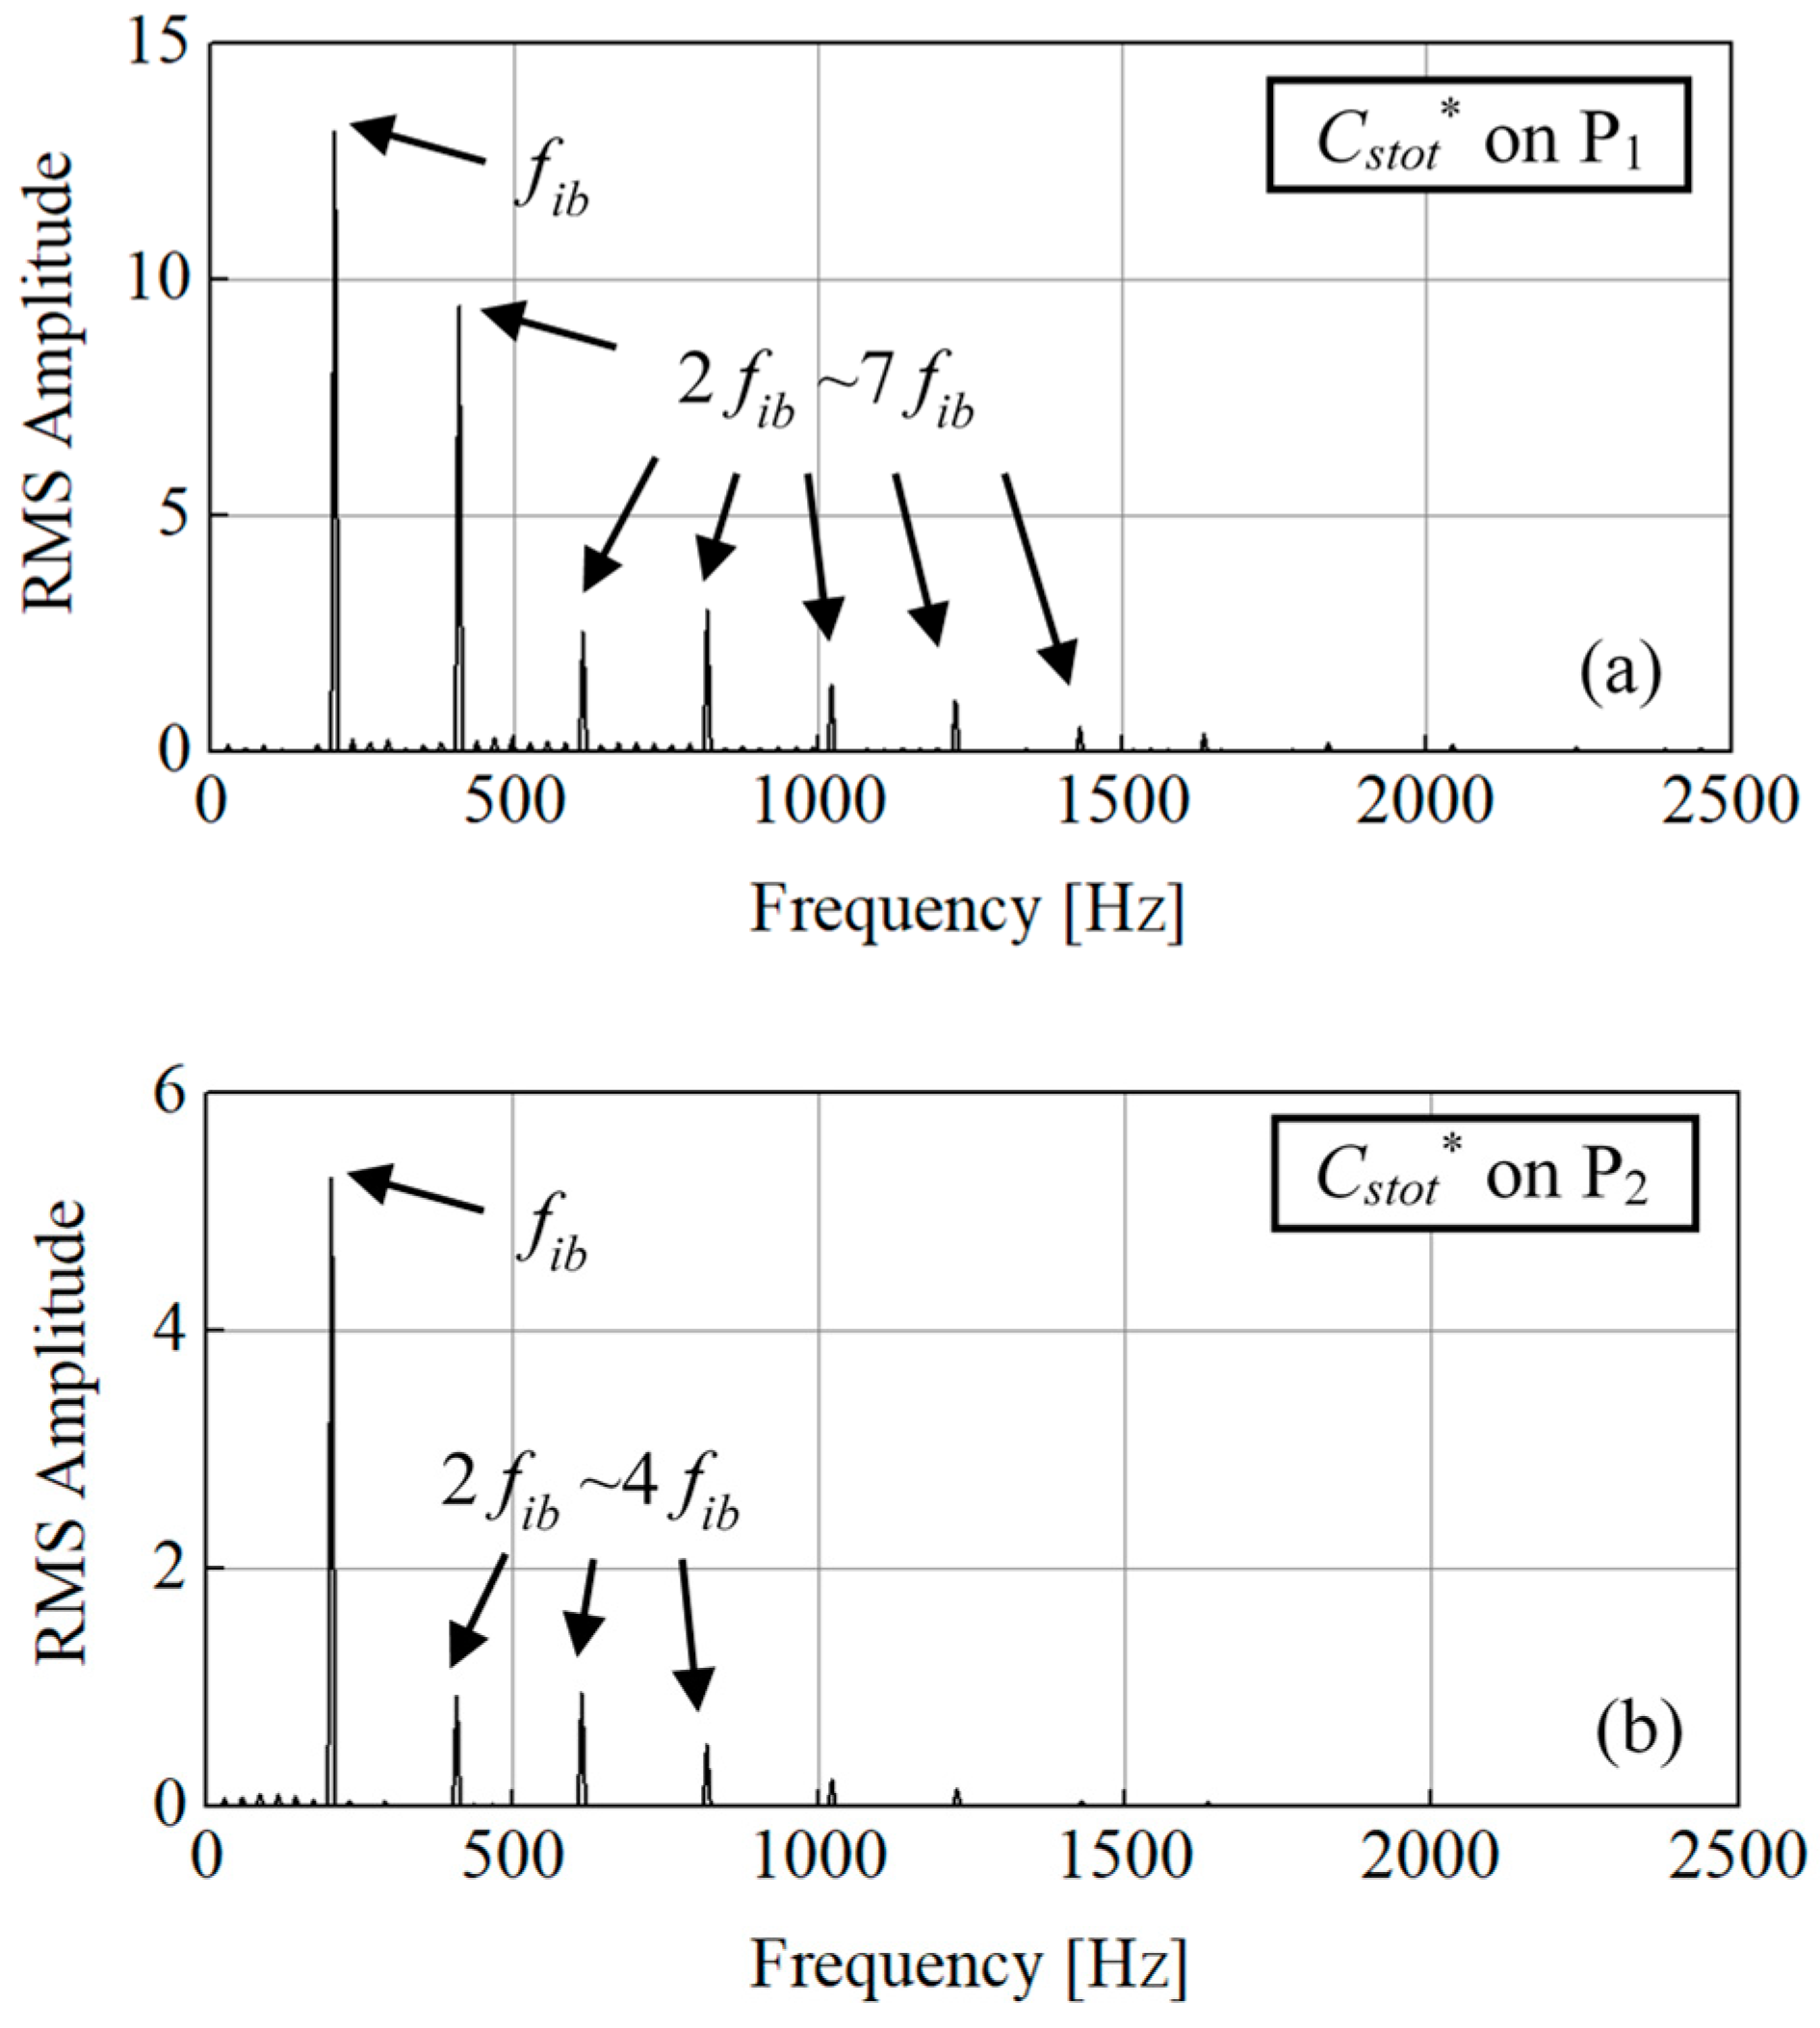
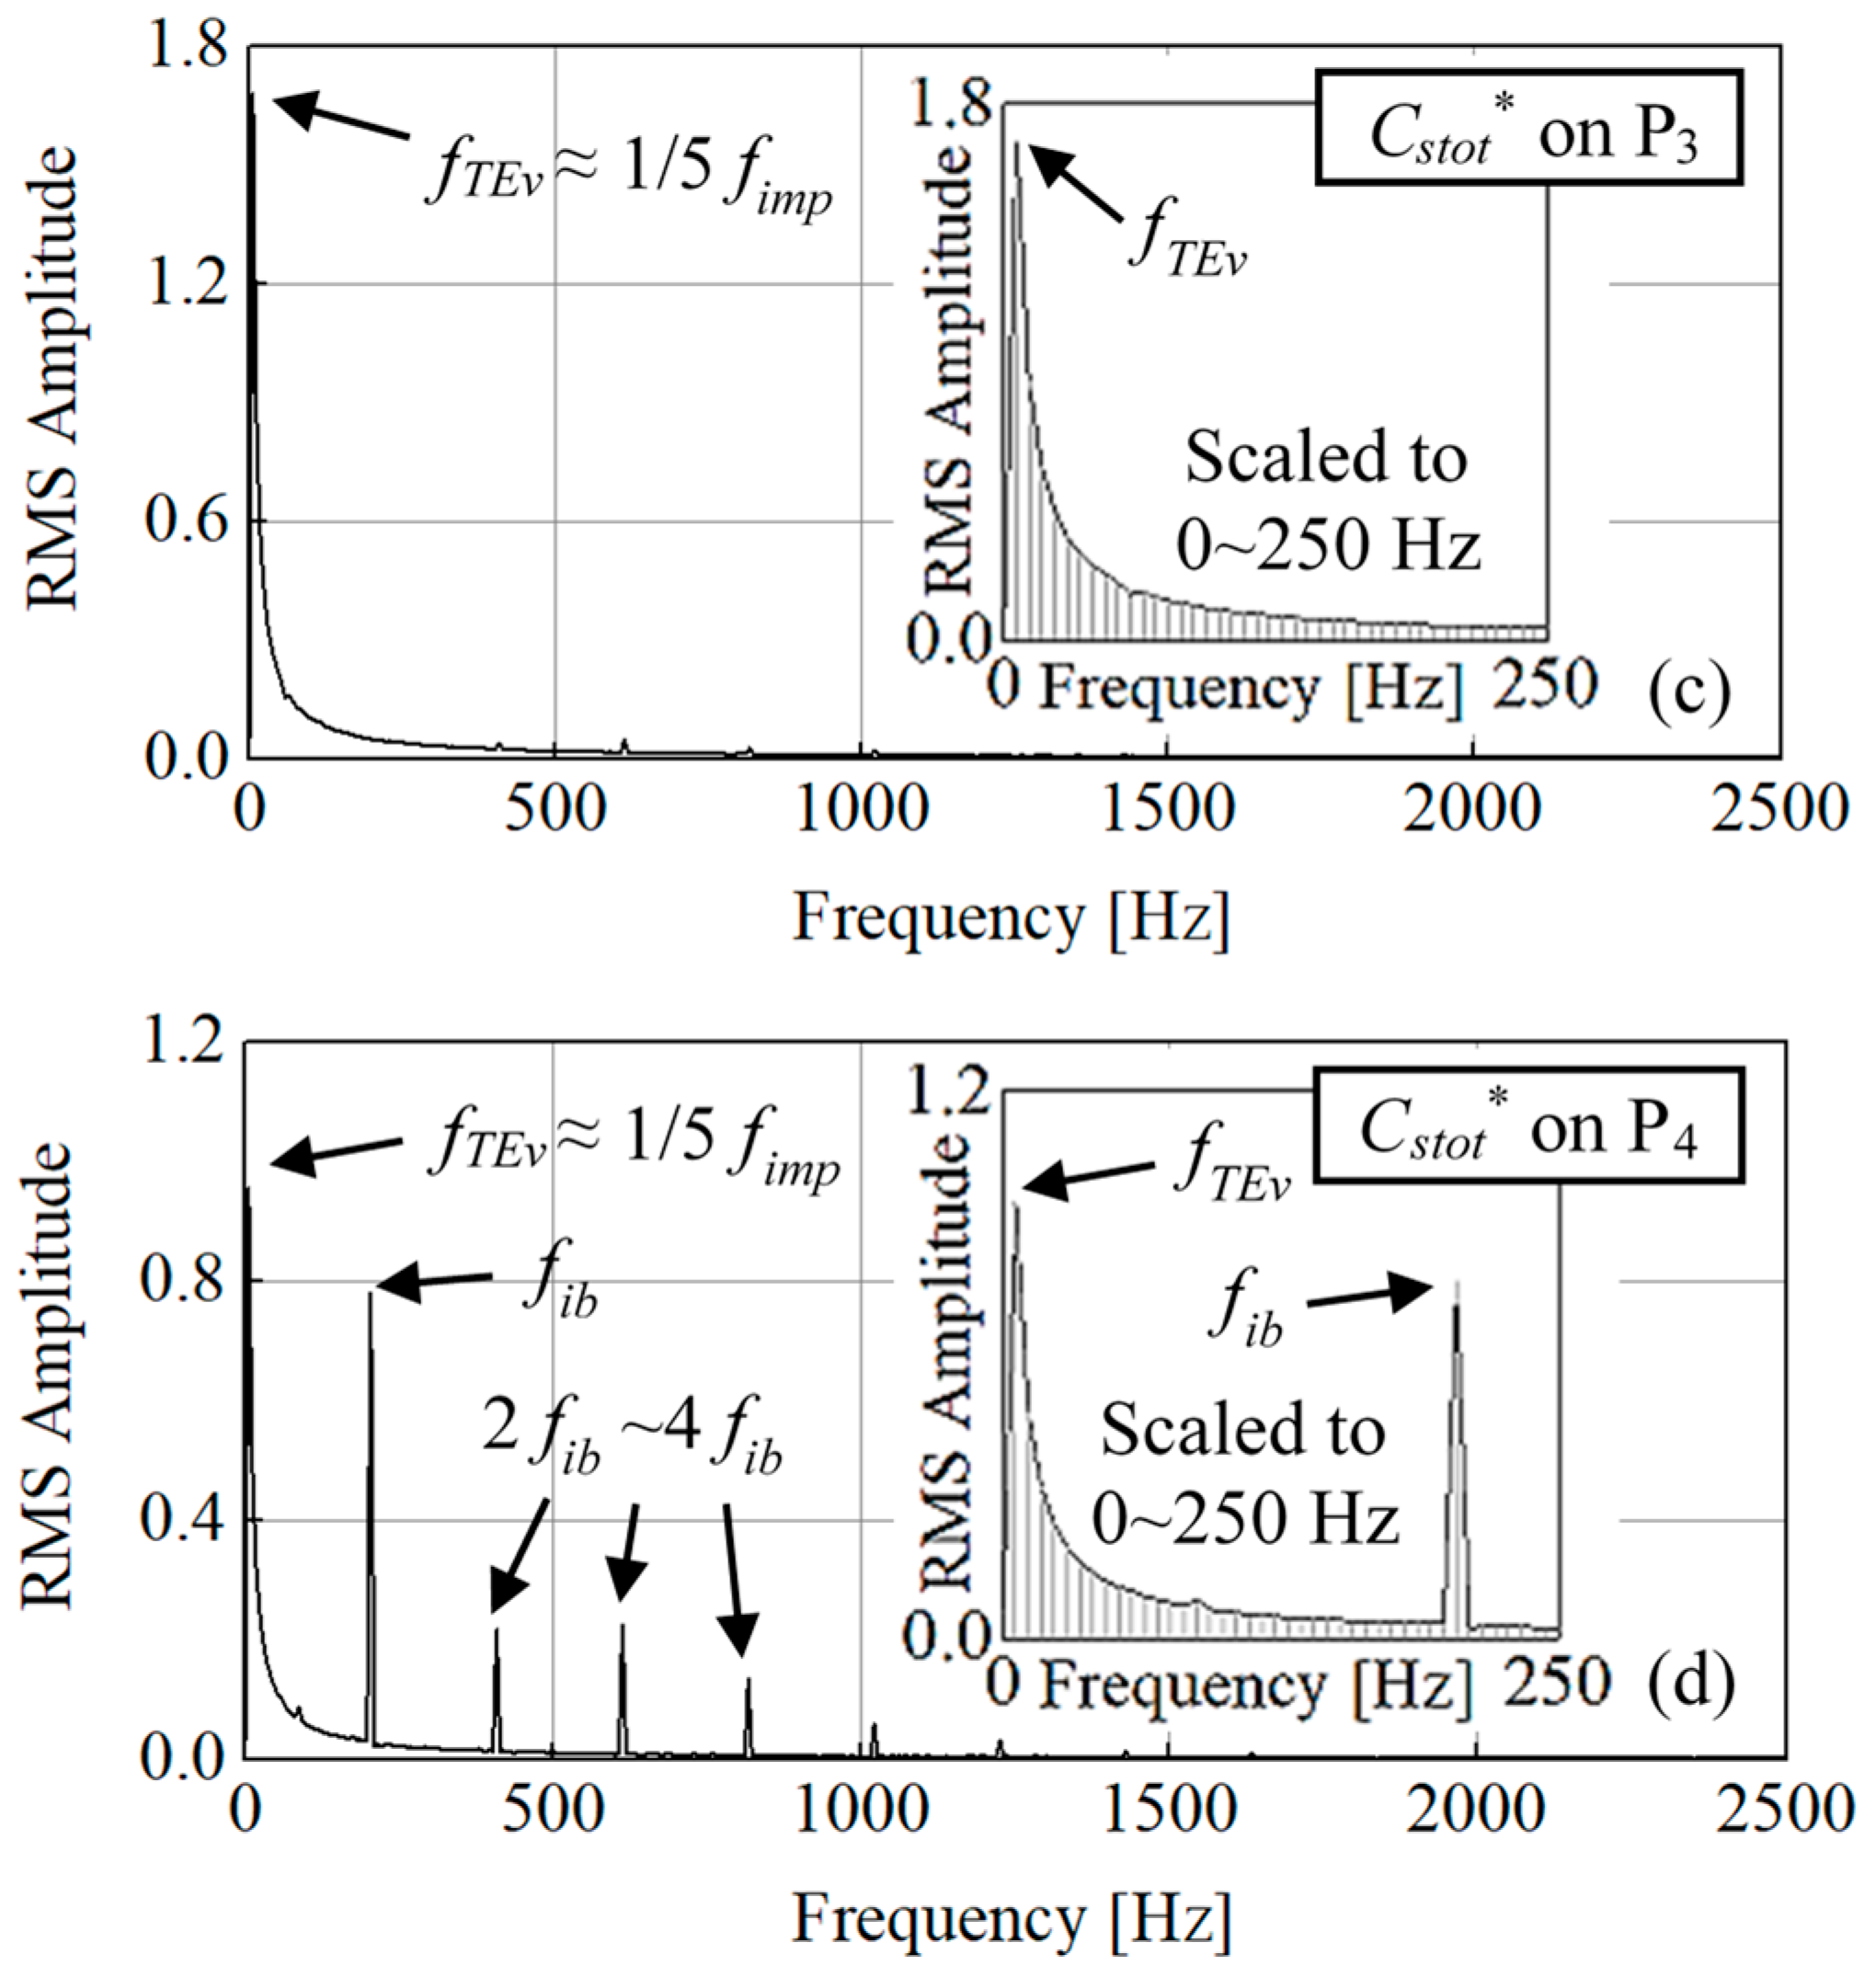
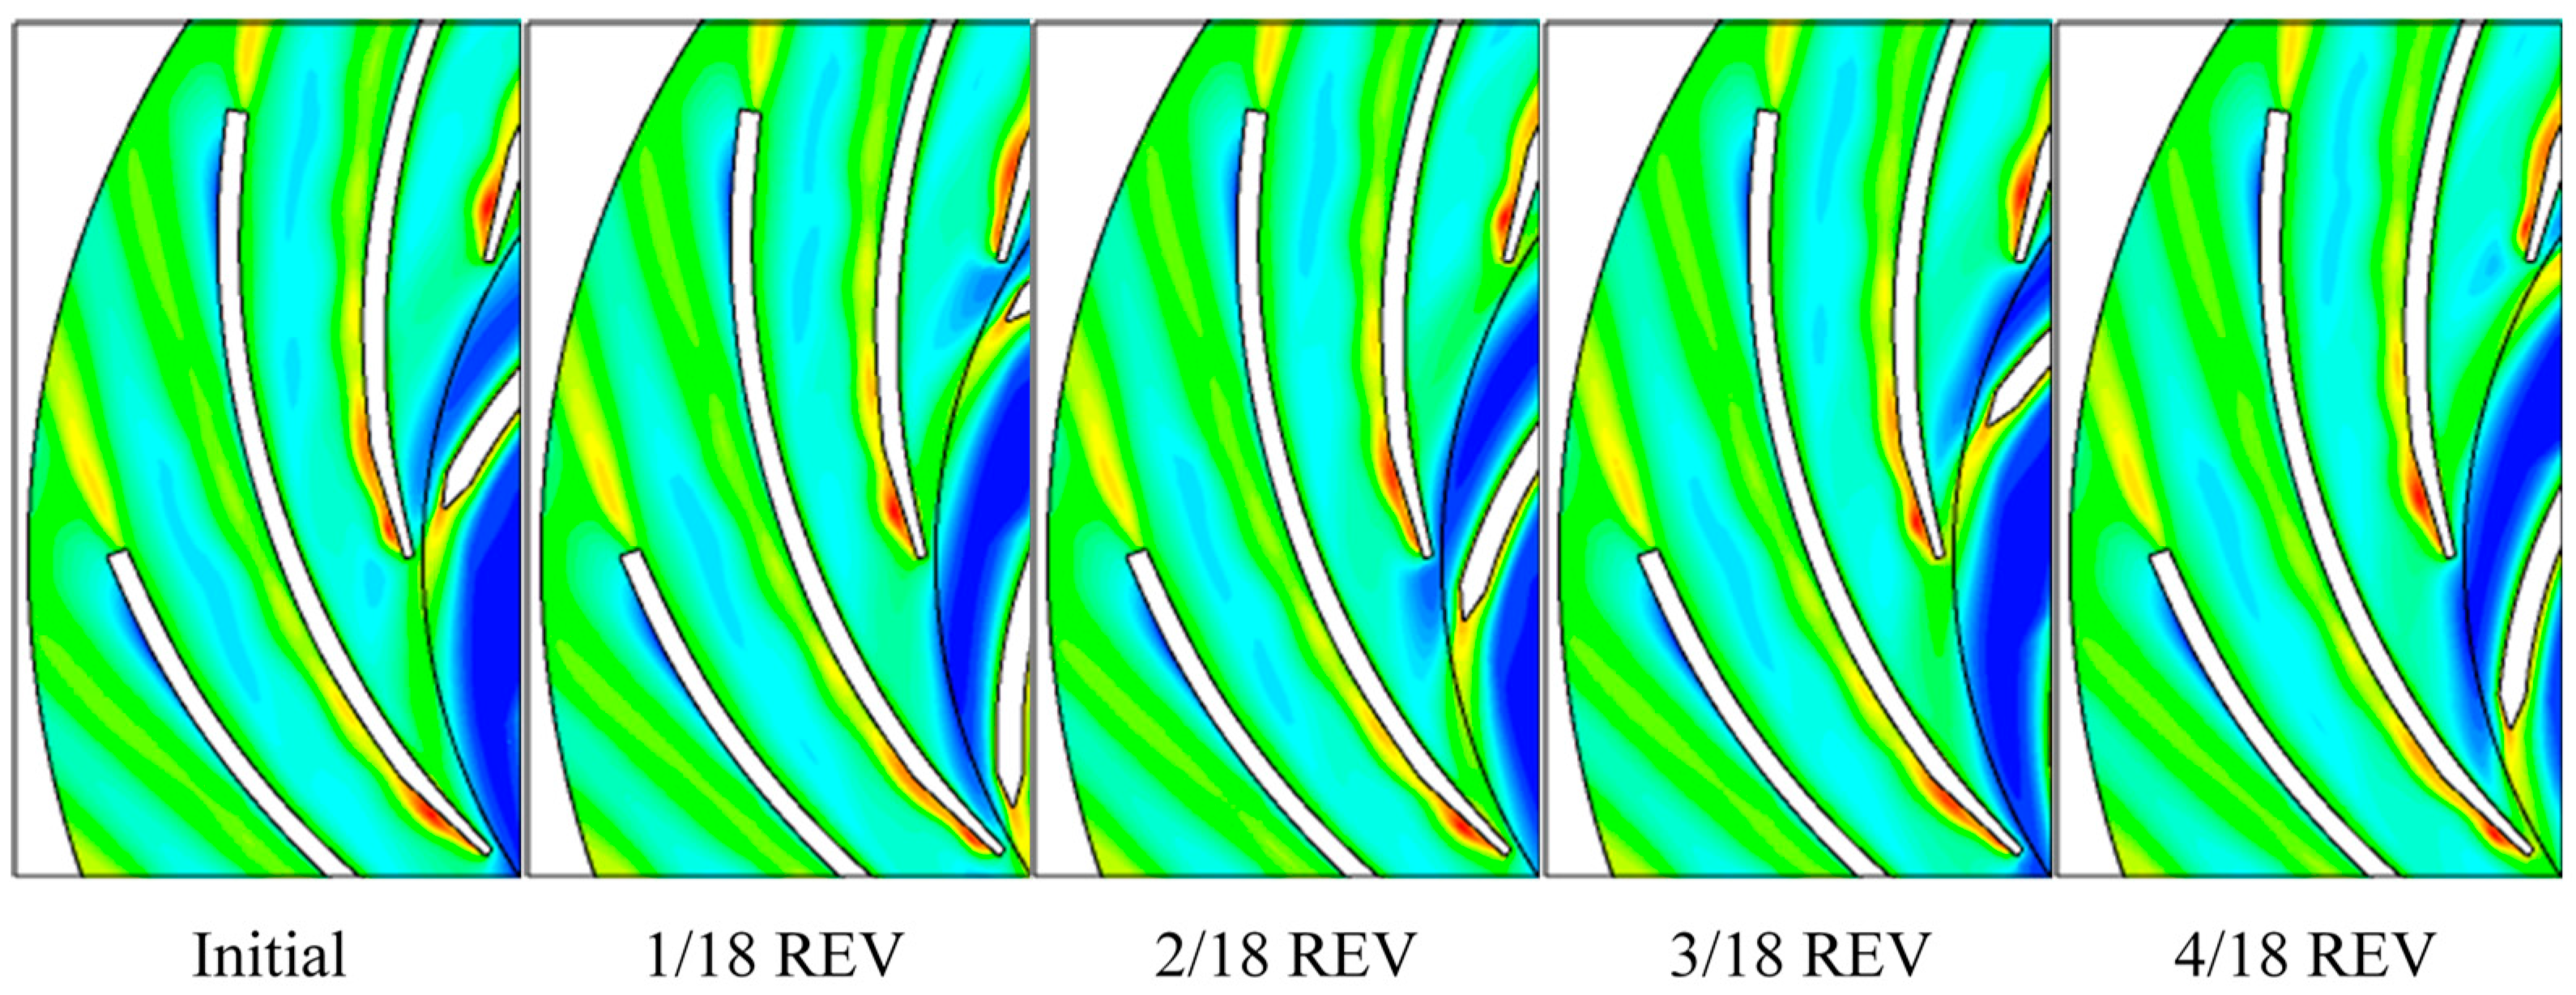
- These high energy dissipation regions perform differently during rotor-stator interaction. Based on the frequency analysis, the transient characteristics of energy dissipation during impeller rotation can be clarified in detail. The flow regime on the diffuser blade leading-edge, on the diffuser blade’s convex side and in the diffuser blade trailing-edge wake are influenced mainly by the impeller frequency or the impeller blade frequency. It shows that the rotor-stator interaction affects the flow regime, energy dissipation and flow-induced noise from diffuser inlet to outlet. The diffuser blade trailing-edge stall vortex is not strongly influenced by rotor-stator interaction. It keeps the stall frequency that is about 1/5 impeller frequency. This stall frequency also affects the diffuser trailing-edge wake region.
Author Contributions
Funding
Conflicts of Interest
Nomenclature
| Latin Letters | |||
| Ain | impeller inflow area | Q | flow rate |
| ch | heat capacity | Rcn | Cone radius |
| Ck | turbulence kinetic energy coefficient | Rd1 | Diffuser blade inlet radius |
| Cr | radial component of velocity | Rd2 | Diffuser blade outlet radius |
| Cstot* | energy dissipation coefficient | Rhub | Hub arc radius |
| Ct | tangential component of velocity | Ri1 | Impeller blade inlet radius |
| Cvrel | relative velocity coefficient | Ri2 | Impeller blade outlet radius |
| Cφ | flow rate coefficient | Rin | Impeller inflow radius |
| Cω | production term coefficient in SST model | Rshr | Shroud arc radius |
| F1 | blending function in SST model | s* | specific entropy |
| fib | impeller blade frequency | Sij | strain tensor |
| fimp | impeller frequency | Sp | spanwise position |
| fTEv | diffuser trailing-edge stall frequency | t | time |
| g | acceleration of gravity | T | temperature |
| Gz | relative impeller blade channel position | Tin | temperature at inlet boundary |
| hb | Height of impeller/diffuser blade | Tout | temperature at outlet boundary |
| hcn | Height of cone | u | velocity |
| hhub | Height over cone on hub | Ui2 | Rotational linear speed at impeller outlet |
| hsta | static enthalpy | Vc | sound speed |
| htot | total enthalpy | Vin | velocity at inlet boundary |
| k | turbulence kinetic energy | Vout | velocity at outlet boundary |
| lk-ω | turbulence scale in SST model | Vrel | relative velocity |
| Lsp | sound power level | WA | sound power |
| Mt | specific turbulence kinetic energy | Wref | reference sound power |
| n | Rotational speed | x | coodinate component |
| P | turbulence production term in SST model | y+ | dimensionless height off-wall |
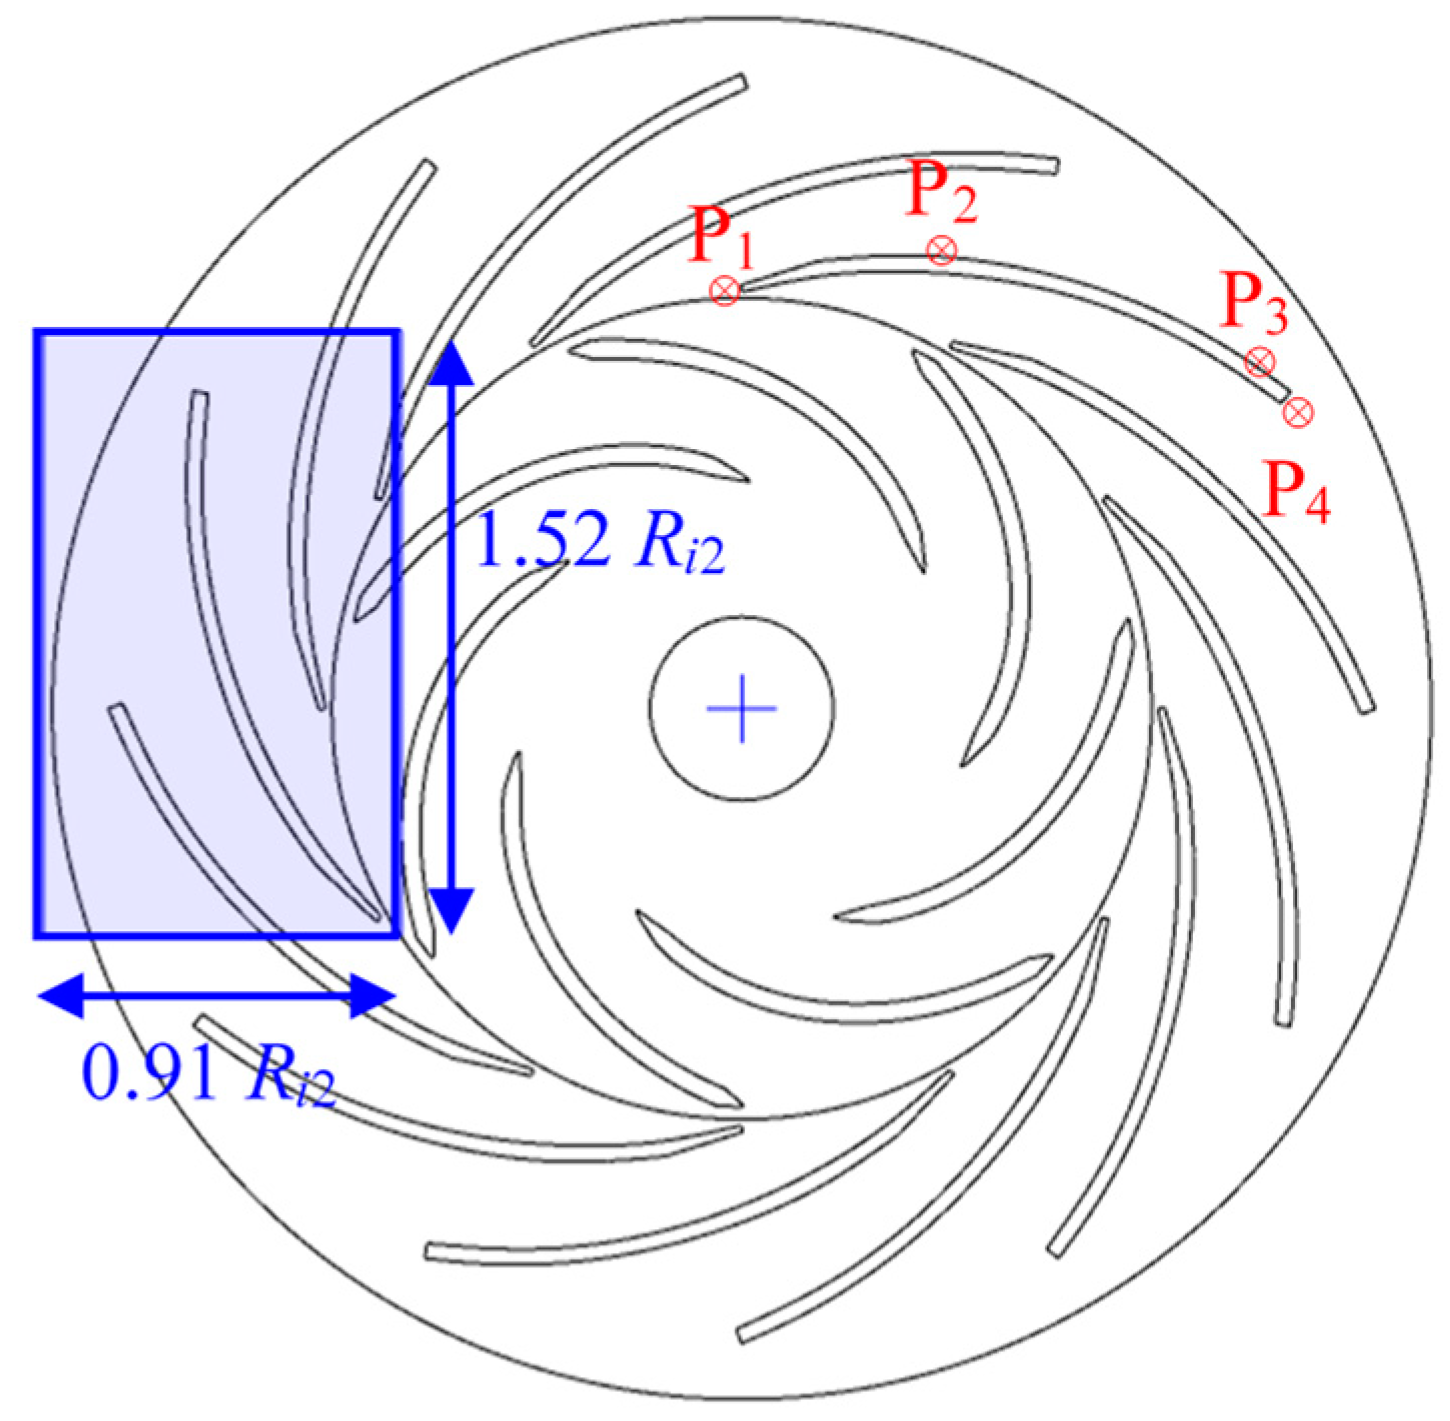
| P1, P2, P3, P4 | monitoring point 1 to 4 | Zd | Diffuser blade number |
| pin | pressure at inlet boundary | Zi | Impeller blade number |
| pout | pressure at outlet boundary | ||
| Greek Letters | |||
| αε | model constant in acoustic analogy | μt | eddy viscosity |
| βk | model constant in SST model | ρ | density |
| ΔCstot | specific entropy difference coefficient | σk | model constant in SST model |
| δij | Kroneker delta | σω | model constant in SST model |
| ε | eddy dissipation rate | ϕ | denotation for arbitrary parameter |
| λt | thermal conductivity | in governing equations | |
| μ | dynamic viscosity | ω | specific turbulence dissipation rate |
| Acronyms | |||
| CFD | computational fluid dynamics | LNR | low noise region |
| EXP | experiment | LVR | low Cvrel region |
| GGI | general grid interface | RANS | Reynolds-averaged Navier-Stokes |
| HKR | high k region | REV | impeller revolution |
| HNR | high noise region | RMS | root mean square |
| HVR | high Cvrel region | SS | blade suction side |
| LE | blade leading-edge | SST | shear stress transport |
| LKR | low k region | TE | blade trailing-edge |
References
- Çengel, Y.A.; Boles, M.A. Thermodynamics an Engineering Approach; McGraw-Hill: New York, NY, USA, 2015. [Google Scholar]
- Zemansky, M.W. Heat and Thermodynamics; McGraw-Hill: New York, NY, USA, 1968. [Google Scholar]
- Cattaert, A.E. High pressure pump efficiency determination from temperature and pressure measurements. In Proceedings of the Power Engineering Society Conference and Exposition in Africa, Johannesburg, South Africa, 16–20 July 2007. [Google Scholar]
- Lavenda, B.H. A New Perspective on Thermodynamics; Springer: Berlin/Heidelberg, Germany, 2010. [Google Scholar]
- Diaconescu, I. Analysis of irreversible thermodynamic processes from control valves. In Proceedings of the 3rd WSEAS International Conference on Energy Planning, Energy Saving, Environmental Education, Braila, Romania, 24–26 February 2009. [Google Scholar]
- Esfahani, J.A.; Modirkhazeni, M.; Mohammadi, S. Accuracy analysis of predicted velocity profiles of laminar duct flow with entropy generation method. Appl. Math. Mech. 2013, 34, 971–984. [Google Scholar] [CrossRef]
- Yoon, S.; Vandeputte, T.; Mistry, H.; Ong, J.; Stein, A. Loss audit of a turbine stage. In Proceedings of the ASME Turbo Expo 2015: Turbine Technical Conference and Exposition, Montreal, QC, Canada, 15–19 June 2015. [Google Scholar]
- Jia, W.; Liu, H. Loss sources analysis of shroud leakage flow in highly-loaded turbine. J. Propuls. Technol. 2014, 35, 33–42. [Google Scholar]
- VanZante, D.E.; To, W.M.; Chen, J.P. Blade row interaction effects on the performance of a moderately loaded NASA transonic compressor stage. In Proceedings of the ASME Turbo Expo 2002: Power for Land, Sea, and Air, Amsterdam, The Netherlands, 3–6 June 2002. [Google Scholar]
- Liu, Z.H.; Shinji, M.; Miyagawa, K. Internal flow and loss mechanisms of specific speed 160 m-kW shroudless hydro turbine. IOP Conf. Ser. Earth Environ. Sci. 2018, 163, 012054. [Google Scholar] [CrossRef]
- Sun, Y.; Ren, Y. Unsteady loss analyses of the flow in single-stage transonic compressor. J. Tsinghua Univ. (Sci. Technol.) 2009, 49, 759–762. [Google Scholar]
- Li, D.; Gong, R.; Wang, H.; Xiang, G.; Wei, X.; Qin, D. Entropy production analysis for hump characteristics of a pump turbine model. Chin. J. Mech. Eng. 2016, 29, 803–812. [Google Scholar] [CrossRef]
- Kluxen, R.; Behre, S.; Jeschke, P.; Guendogdu, Y. Loss mechanisms of interplatform steps in a 1.5-stage axial flow turbine. J. Turbomach. 2017, 139, 031007. [Google Scholar] [CrossRef]
- Soltanmohamadi, R.; Lakzian, E. Improved design of wells turbine for wave energy conversion using entropy generation. Meccanica 2016, 51, 1713–1722. [Google Scholar] [CrossRef]
- Zeinalpour, M.; Mazaheri, K. Entropy minimization in turbine cascade using continuous adjoint formulation. Eng. Optim. 2015, 48, 213–230. [Google Scholar] [CrossRef]
- Acosta, A.J.; Brennen, C.E.; Caughey, T.K.; Caughey, T.K. Rotor-stator interaction in a diffuser pump. Nat. Genet. 1988, 17, 58–64. [Google Scholar]
- Zhang, N.; Gao, B.; Li, Z.; Ni, D.; Jiang, Q. Unsteady flow structure and its evolution in a low specific speed centrifugal pump measured by PIV. Exp. Therm. Fluid Sci. 2018, 97, 133–144. [Google Scholar] [CrossRef]
- Tao, R.; Xiao, R.; Liu, W. Investigation of the flow characteristics in a main nuclear power plant pump with eccentric impeller. Nucl. Eng. Des. 2018, 327, 70–81. [Google Scholar] [CrossRef]
- Lighthill, M.J. On sound generated aerodynamically I: general theory. Proc. R. Soc. Lond. (Ser. A) 1952, 211, 564–587. [Google Scholar]
- Langthjem, M.A.; Olhoff, N. A numerical study of flow-induced noise in a two-dimensional centrifugal pump. part I. hydrodynamics. J. Fluids Struct. 2004, 19, 349–368. [Google Scholar] [CrossRef]
- Chen, M. Fundamentals of Viscous Fluid Dynamics; Higher Education Press: Beijing, China, 1993. [Google Scholar]
- Terentiev, L. The Turbulence Closure Model Based on Linear Anisotropy Invariant Analysis; VDM Verlag: Saarbrucken, Germany, 2008. [Google Scholar]
- Menter, F.R. Two-Equation Eddy-Viscosity Turbulence Models for Engineering Applications. AIAA J. 1994, 32, 1598–1605. [Google Scholar] [CrossRef]
- Launder, B.E.; Spalding, D.B. The numerical computation of turbulent flows. Comput. Methods Appl. Mech. Eng. 1974, 3, 269–289. [Google Scholar] [CrossRef]
- Wilcox, D.C. Formulation of the k-ω Turbulence Model Revisited. AIAA J. 2008, 46, 2823–2838. [Google Scholar] [CrossRef]
- Proudman, I. The generation of noise by isotropic turbulence. Proc. R. Soc. A 1952, 214, 119–132. [Google Scholar]
- Ubaldi, M.; Zunino, P.; Barigozzi, G.; Cattanel, A. An experimental investigation of stator induced unsteadiness on centrifugal impeller outflow. J. Turbomach. 1996, 118, 41–54. [Google Scholar] [CrossRef]
- Bert, P.F.; Combès, J.F.; Kueny, J.L. Unsteady flow calculation in a centrifugal pump using a finite element method. In Proceedings of the XVIII IAHR Symposium on Hydraulic Machinery and Cavitation, Valencia, Spain, 16–19 September 1996. [Google Scholar]
- Canepa, E.; Cattenei, A.; Ubaldi, M.; Zunino, P. Wake-boundary layer interaction on the vaned diffuser of a centrifugal state. Proc. Inst. Mech. Eng. Part A J. Power Energy 2005, 219, 401–411. [Google Scholar] [CrossRef]
- Petit, P.; Nilsson, H. Numerical investigations of unsteady flow in a centrifugal pump with a vaned diffuser. Int. J. Rotating Mach. 2013, 2013, 961580. [Google Scholar] [CrossRef]
- Huang, X.; Li, Y.; Liu, Z.; Yang, W. Numerical investigation of flow features in the vaneless region of a centrifugal pump by large eddy simulation. Eng. Comput. 2018, 35, 395–410. [Google Scholar] [CrossRef]
- Zhao, X.; Wang, Z.; Xiao, Y.; Luo, Y. Thermodynamic analysis of energy dissipation and unsteady flow characteristic in a centrifugal dredge pump under over-load conditions. Proc. Inst. Mech. Eng. Part C J. Mech. Eng. Sci. 2019, 2019, 0954406218824350. [Google Scholar] [CrossRef]
- Menter, F.R.; Esch, T. Elements of industrial heat transfer predictions. In Proceedings of the 16th Brazilian Congress of Mechanical Engineering, Minas Gerais, Brazil, 26–30 November 2001. [Google Scholar]
- Cheng, A.H.-D.; Cheng, D.T. Heritage and early history of the boundary element method. Eng. Anal. Bound. Elem. 2005, 29, 268–302. [Google Scholar] [CrossRef]
- Day, M.A. The no-slip condition of fluid dynamics. Erkenntnis 2004, 33, 285–296. [Google Scholar] [CrossRef]
- Berten, S.; Dupont, P.; Fabre, L.; Kayal, M.; Avellan, F.; Farhat, M. Experimental investigation of flow instabilities and rotating stall in a high-energy centrifugal pump stage. In Proceedings of the ASME Fluids Engineering Division Summer Conference, Vail, CO, USA, 2–6 August 2009. [Google Scholar]
- Wang, H.; Tsukamoto, H. Experimental and numerical study of unsteady flow in a diffuser pump at off-design conditions. J. Fluids Eng. 2003, 125, 767–778. [Google Scholar] [CrossRef]


| Parameter | Value and (Unit) |
|---|---|
| Impeller blade inlet radius Ri1 | 0.120 (m) |
| Impeller blade outlet radius Ri2 | 0.210 (m) |
| Diffuser blade inlet radius Rd1 | 0.222 (m) |
| Diffuser blade outlet radius Rd2 | 0.332 (m) |
| Hub arc radius Rhub | 0.100 (m) |
| Shroud arc radius Rshr | 0.025 (m) |
| Impeller inflow radius Rin | 0.092 (m) |
| Cone radius Rcn | 0.009 (m) |
| Height of cone hcn | 0.026 (m) |
| Height over cone on hub hhub | 0.087 (m) |
| Height of impeller/diffuser blade hb | 0.020 (m) |
| Impeller blade number Zi | 7 (-) |
| Diffuser blade number Zd | 12 (-) |
| Parameter | Value and (Unit) |
|---|---|
| Rotational speed n | 2000 (r/min) |
| Rotational linear speed at impeller outlet Ui2 | 43.98 (m/s) |
| Flow rate coefficient Cφ | 0.048 |
| Fluid medium dynamic viscosity μ | 1.83 × 10⁻⁵ (kg/m·s) |
| Fluid medium density ρ | 1.2 (kg/m3) |
| Fluid medium thermal conductivity λt | 0.0261 (W/m·K) |
| Fluid specific heat capacity ch | 1004 (J/kg·K) |
© 2019 by the authors. Licensee MDPI, Basel, Switzerland. This article is an open access article distributed under the terms and conditions of the Creative Commons Attribution (CC BY) license (http://creativecommons.org/licenses/by/4.0/).
Share and Cite
Tao, R.; Zhao, X.; Wang, Z. Evaluating the Transient Energy Dissipation in a Centrifugal Impeller under Rotor-Stator Interaction. Entropy 2019, 21, 271. https://doi.org/10.3390/e21030271
Tao R, Zhao X, Wang Z. Evaluating the Transient Energy Dissipation in a Centrifugal Impeller under Rotor-Stator Interaction. Entropy. 2019; 21(3):271. https://doi.org/10.3390/e21030271
Chicago/Turabian StyleTao, Ran, Xiaoran Zhao, and Zhengwei Wang. 2019. "Evaluating the Transient Energy Dissipation in a Centrifugal Impeller under Rotor-Stator Interaction" Entropy 21, no. 3: 271. https://doi.org/10.3390/e21030271