The Effect of Adhesive Additives on Silica Gel Water Sorption Properties

 , , , , and
Abstract
:1. Introduction
1.1. Adsorption Chillers
1.2. Methods to Maximize the Cooling Efficiency of the Adsorption Chiller
1.2.1. The Adjustment of Adsorption and Desorption Time
1.2.2. Increasing the Number of Beds
1.2.3. The Intensification of Heat Exchange in the Bed
1.2.4. Reducing the Thermal Capacity of the Bed
1.2.5. The Use of Glues and Binders
2. Materials and Methods
2.1. Materials
- Glue 1: Poly(vinyl alcohol) at a concentration of 5%;
- Glue 2: Hydroxyethylcellulose at a concentration of 1.25%;
- Glue 3: 2-Hydroxyethylcellulose at a concentration of 5%.
2.2. Samples Preparation
- -
- Three different types of glues;
- -
- Two drying methods;
- -
- Two different granulations of adsorbent.
2.3. Methods
3. Results and Discussion
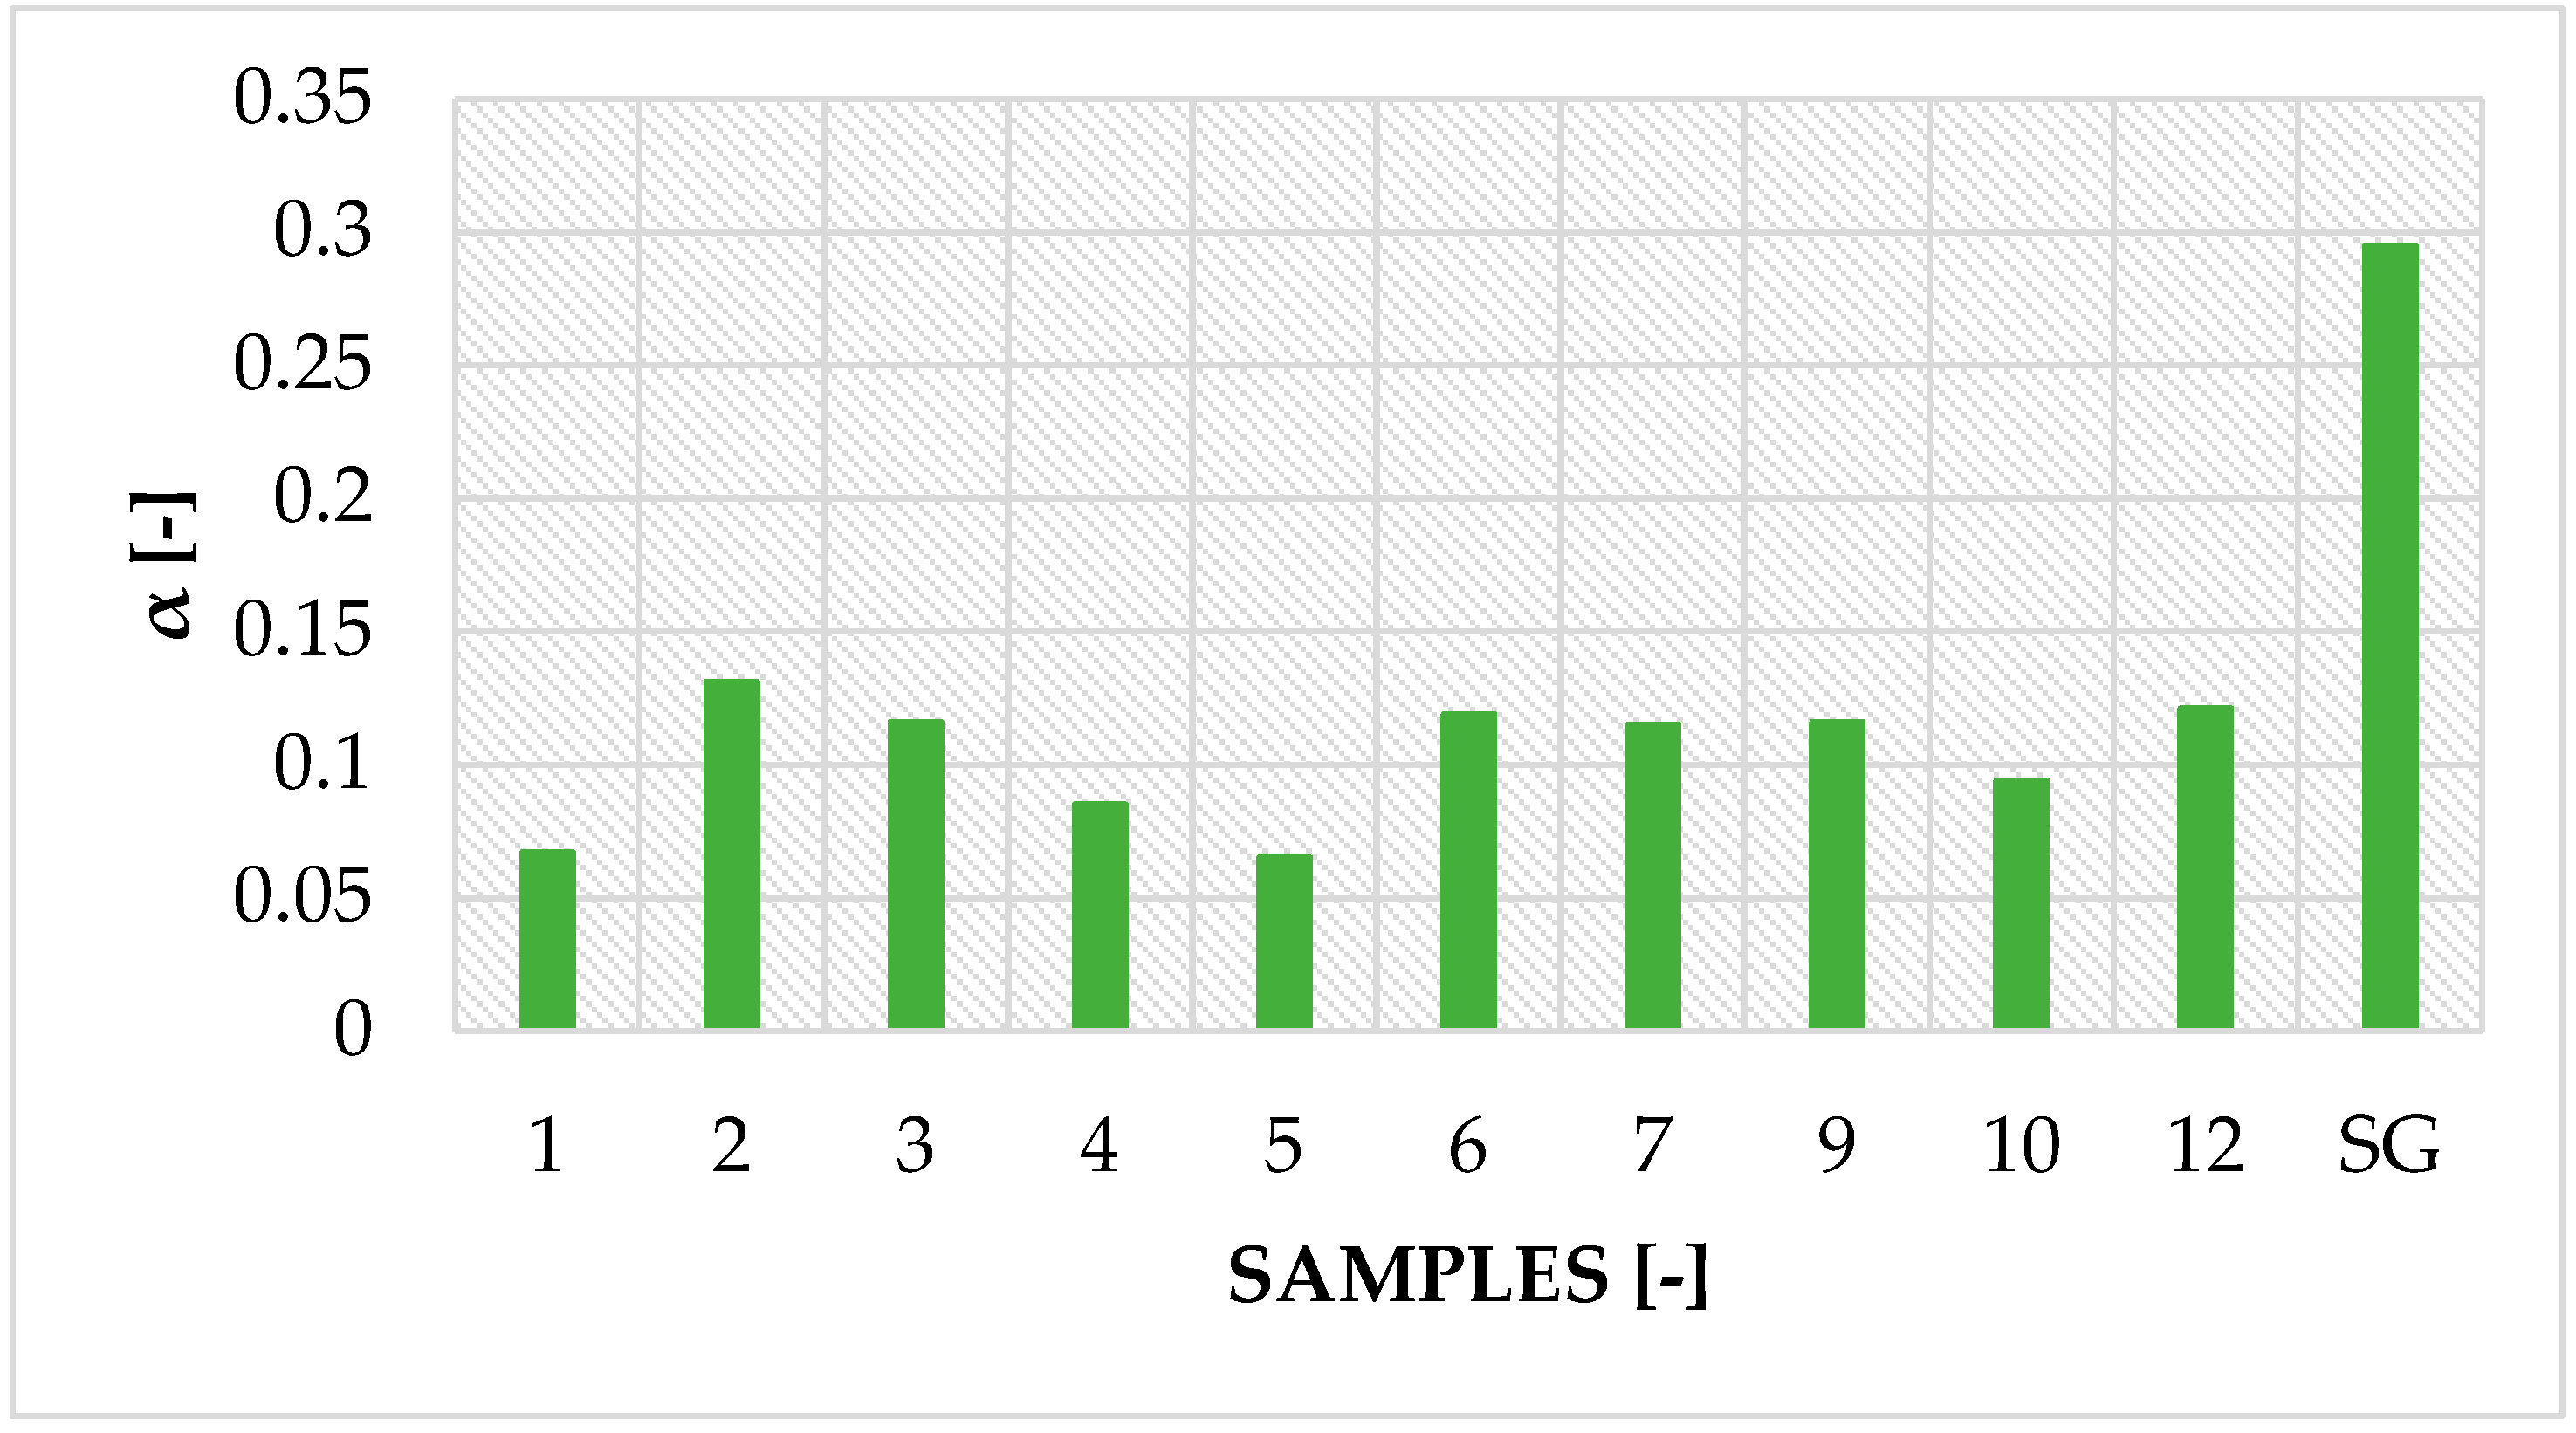
3.1. Sorption Properties of Modified Silica Gel (SG) Samples
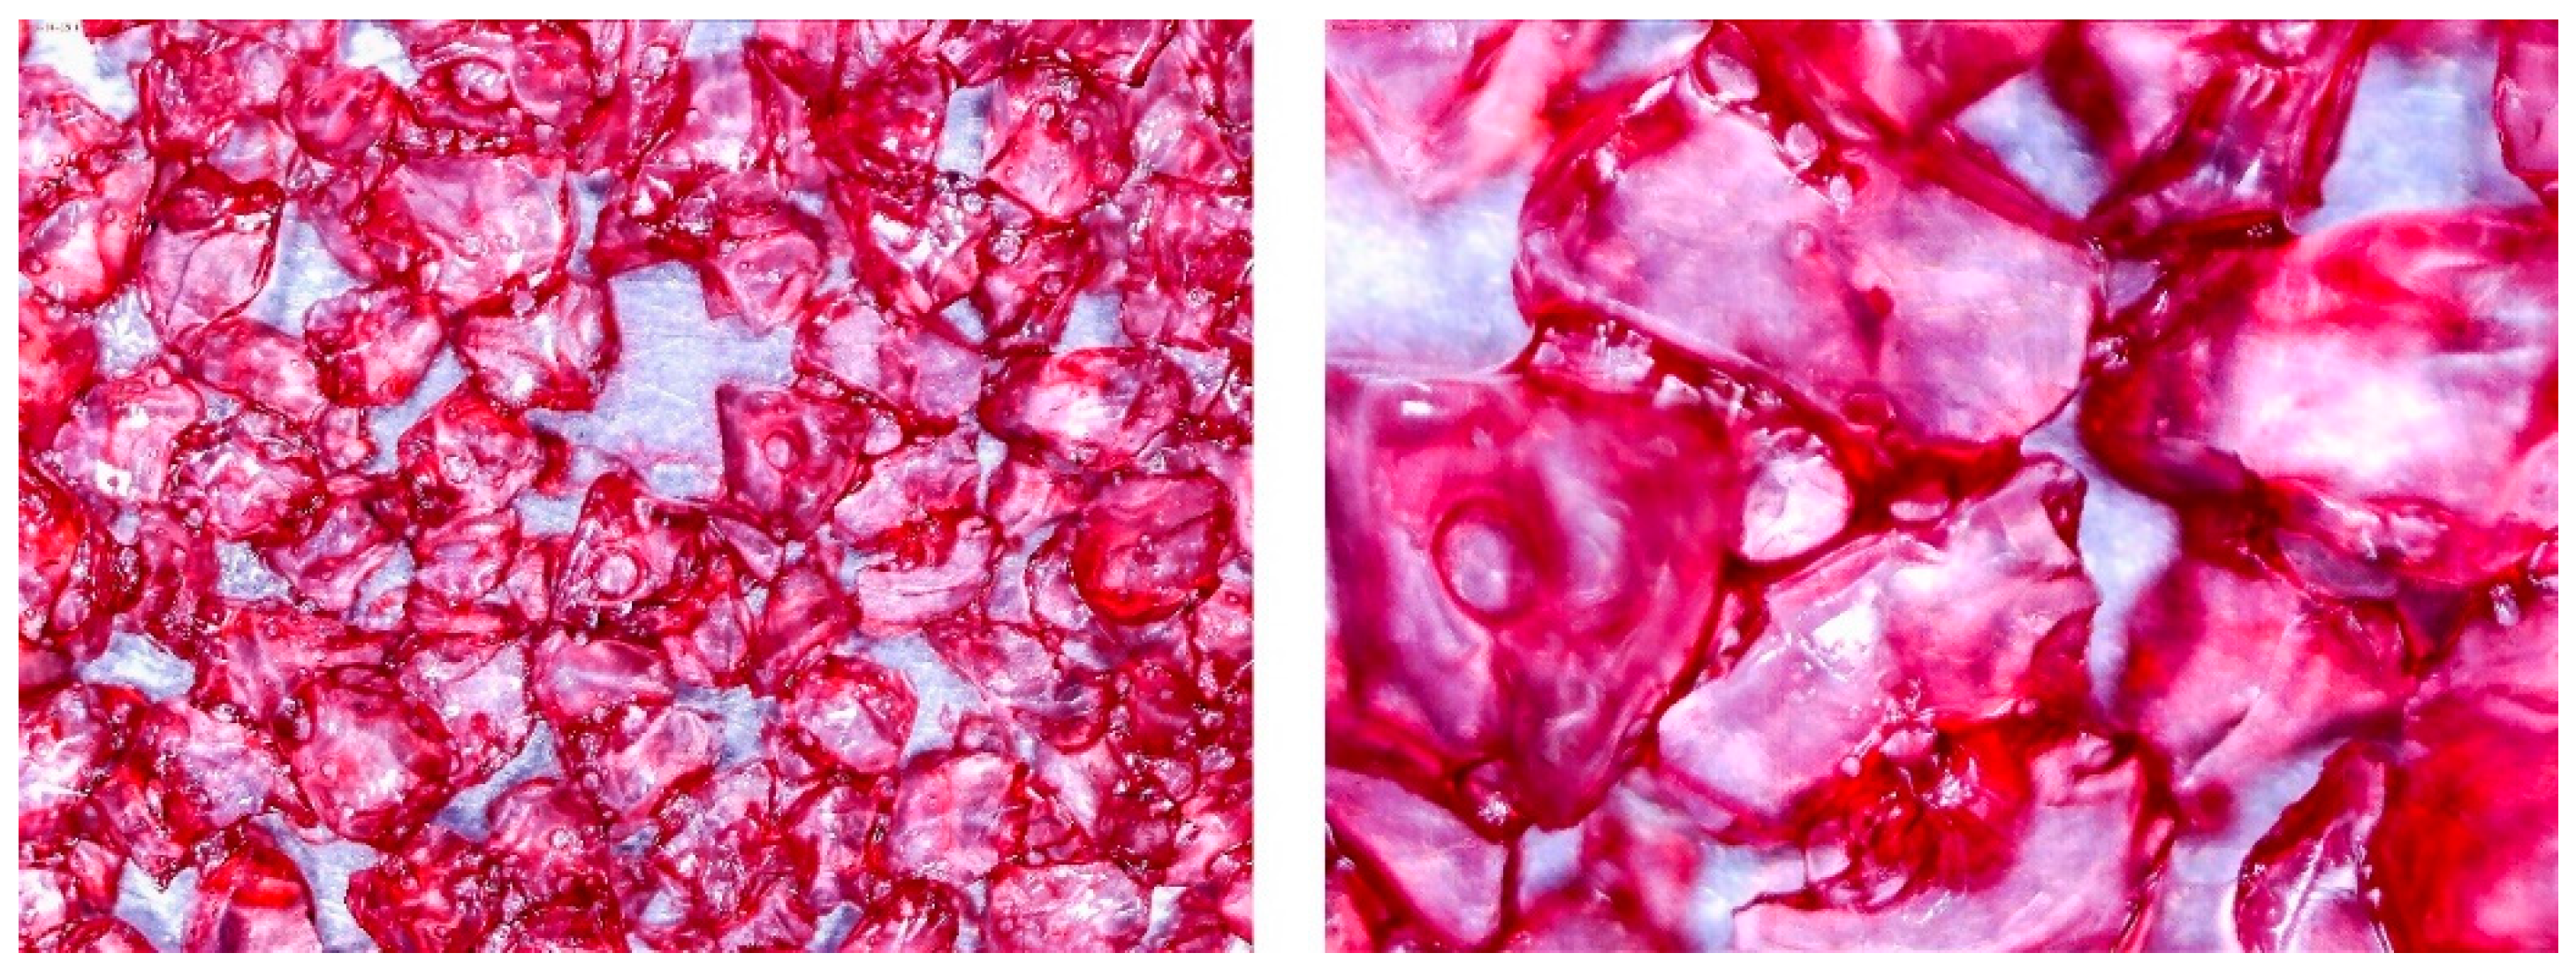
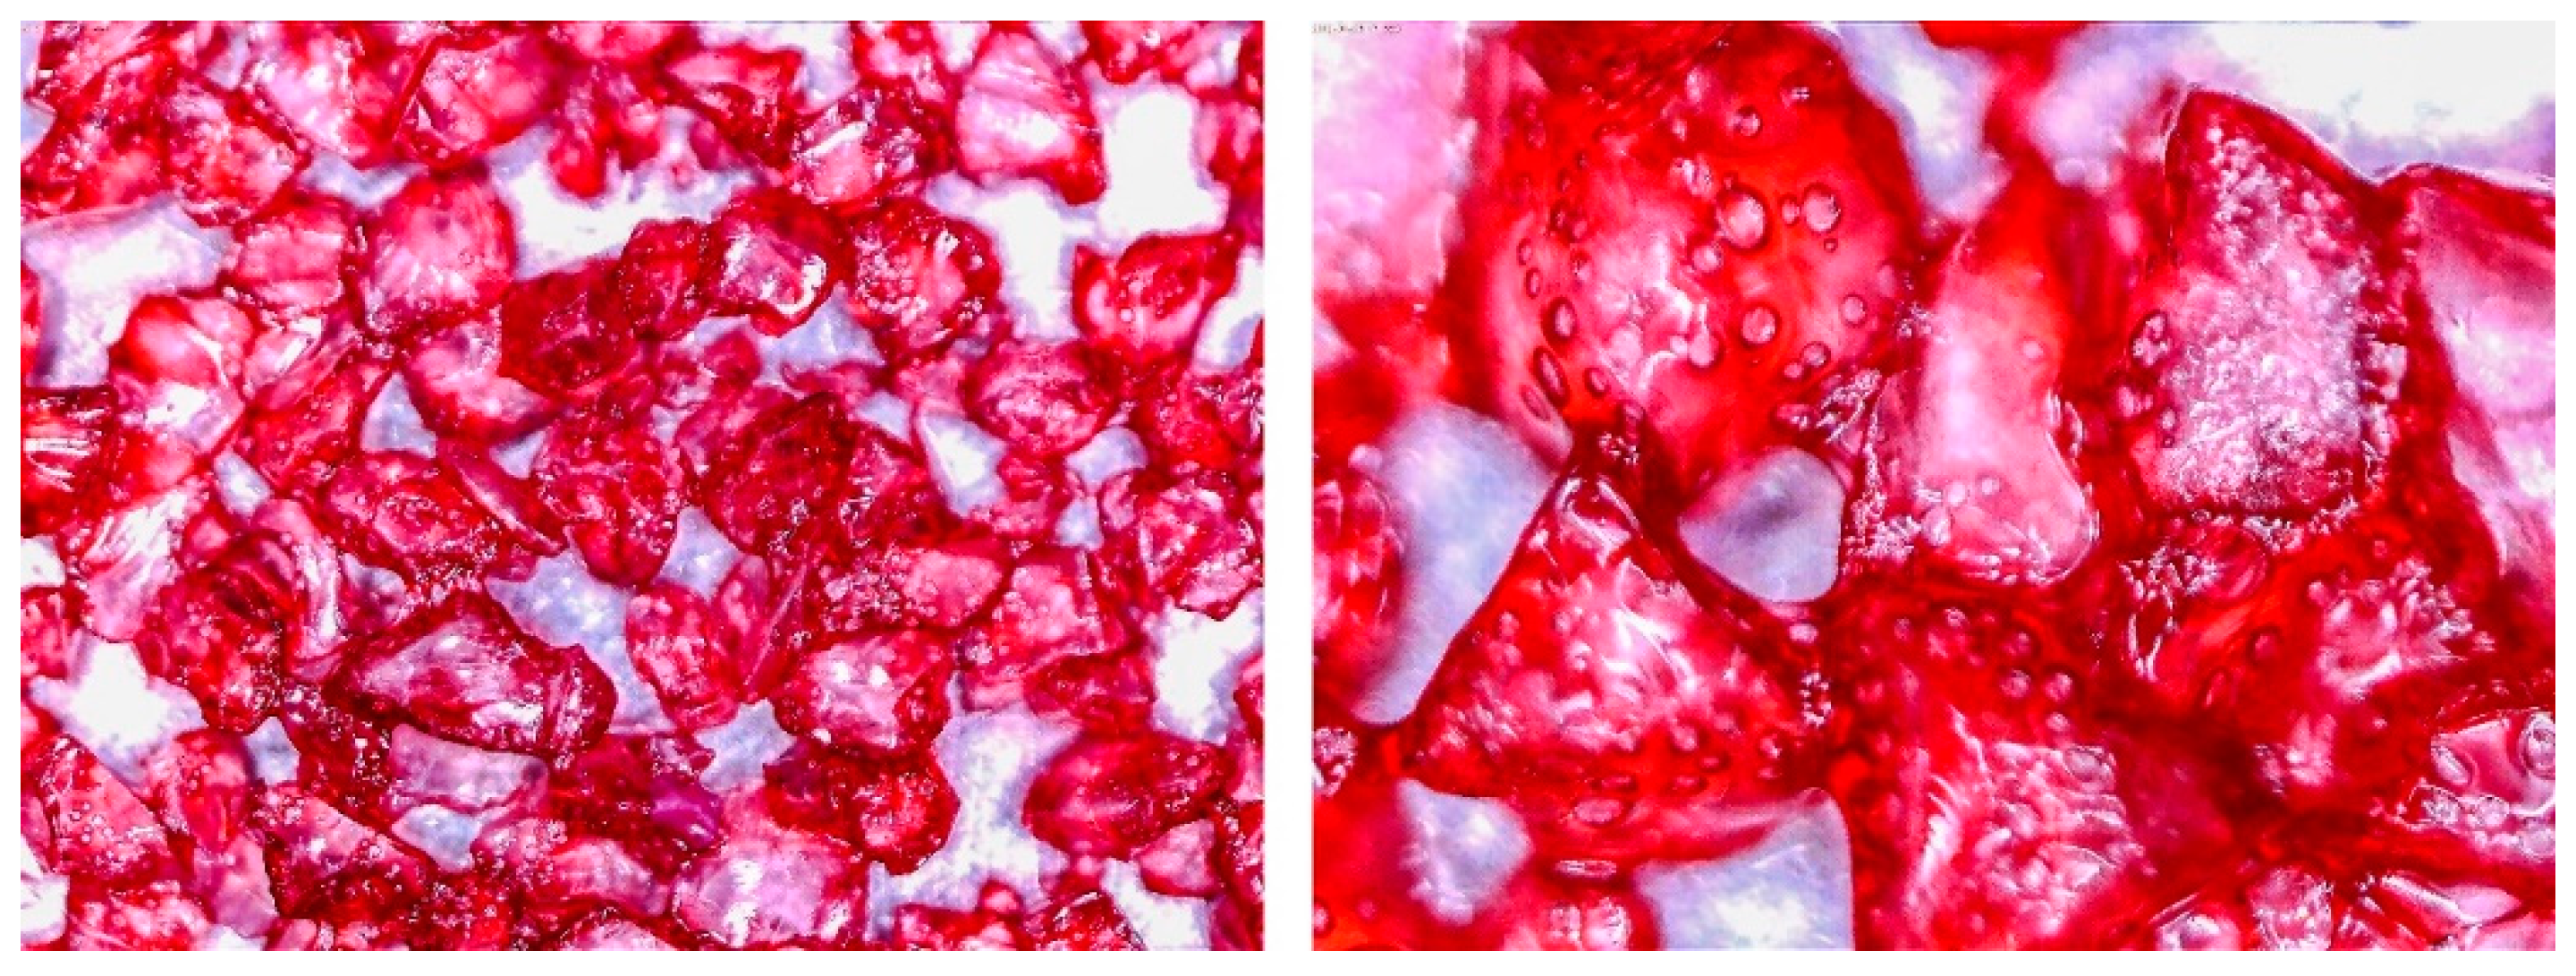
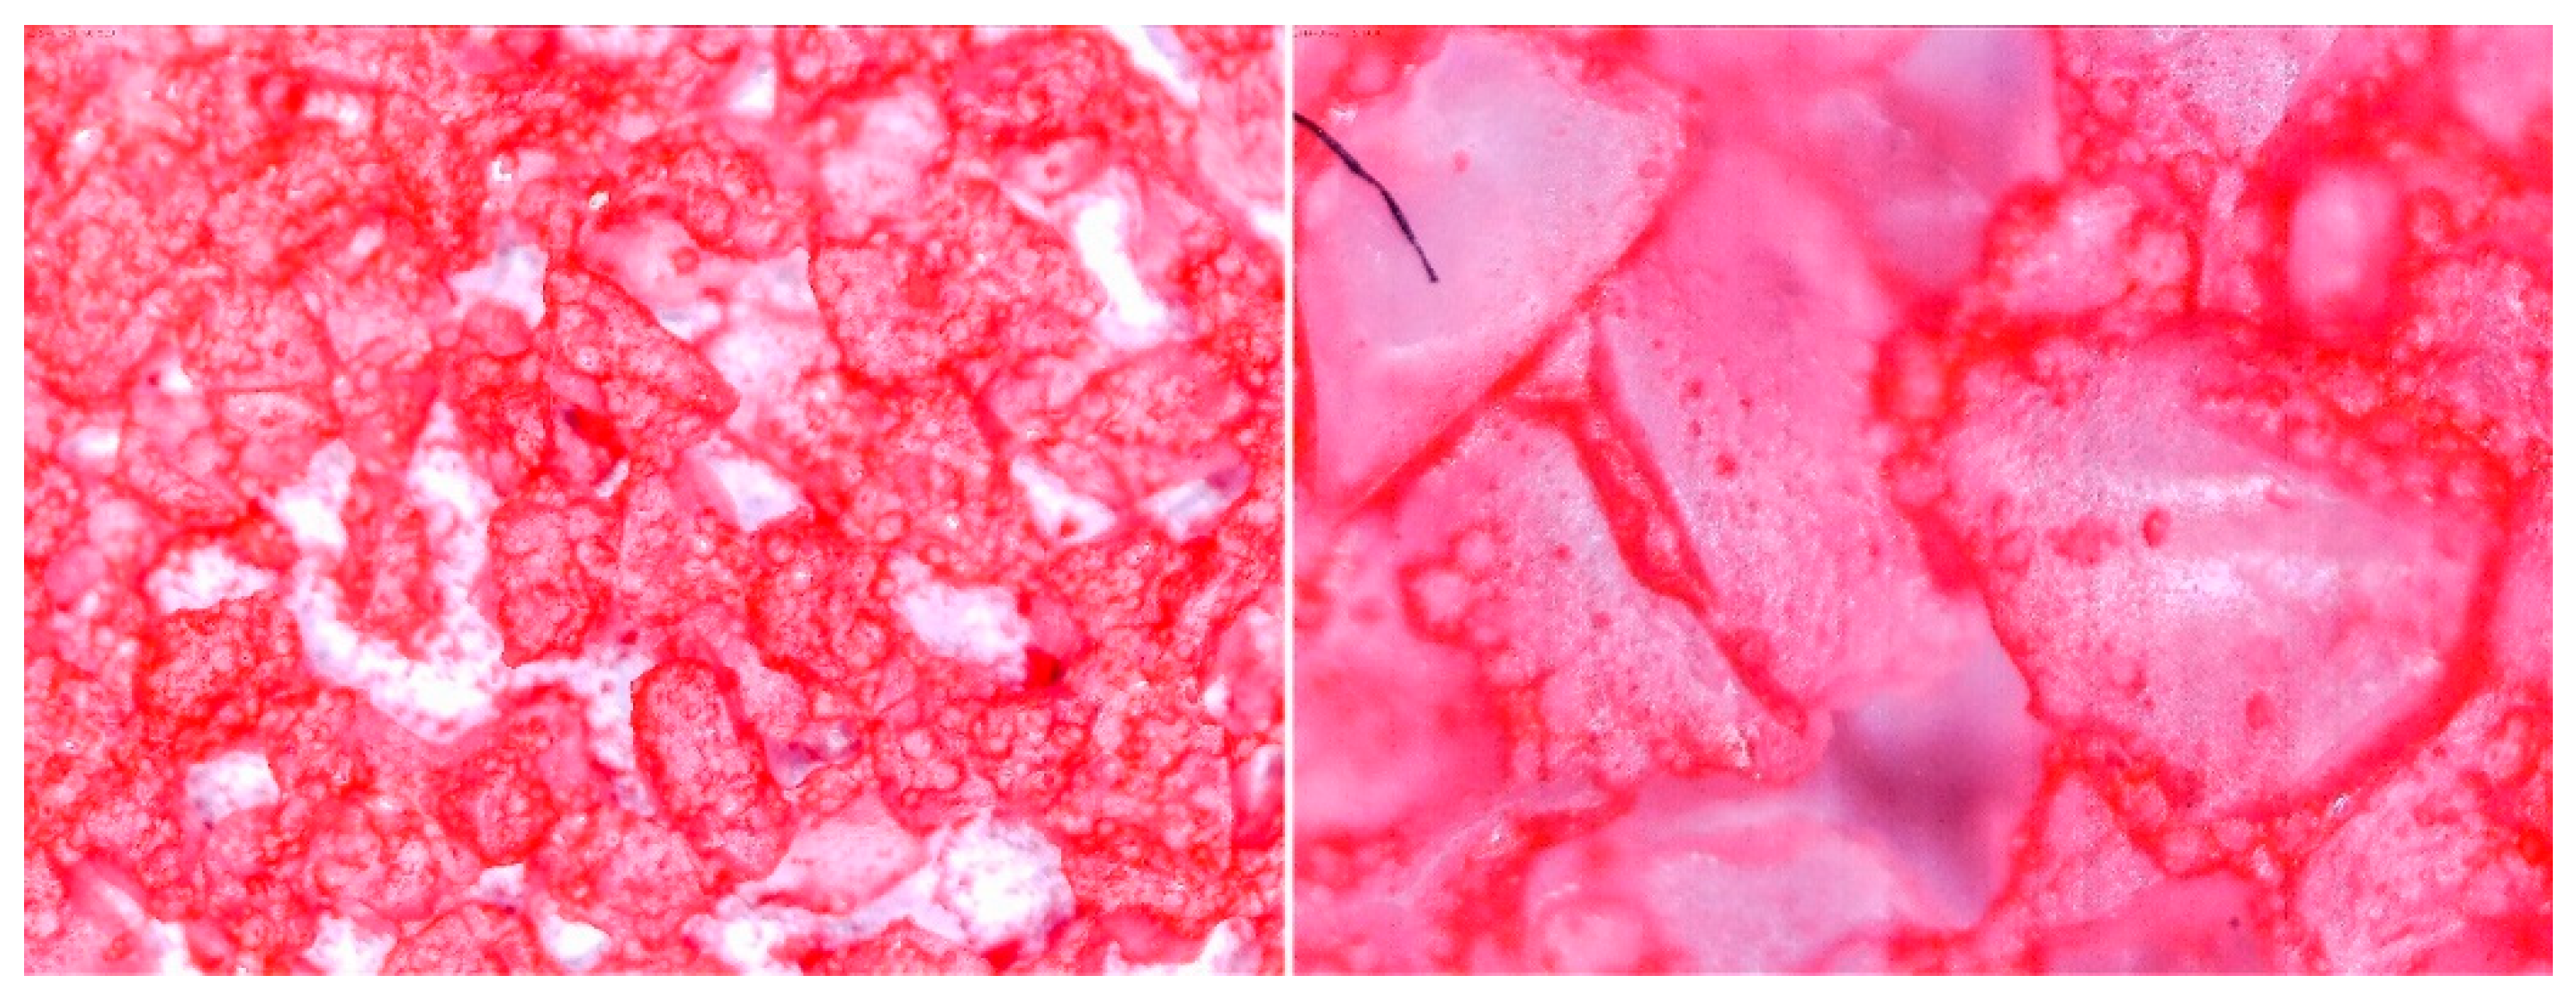
3.2. Observation of Prepared Samples under the Optical Microscope
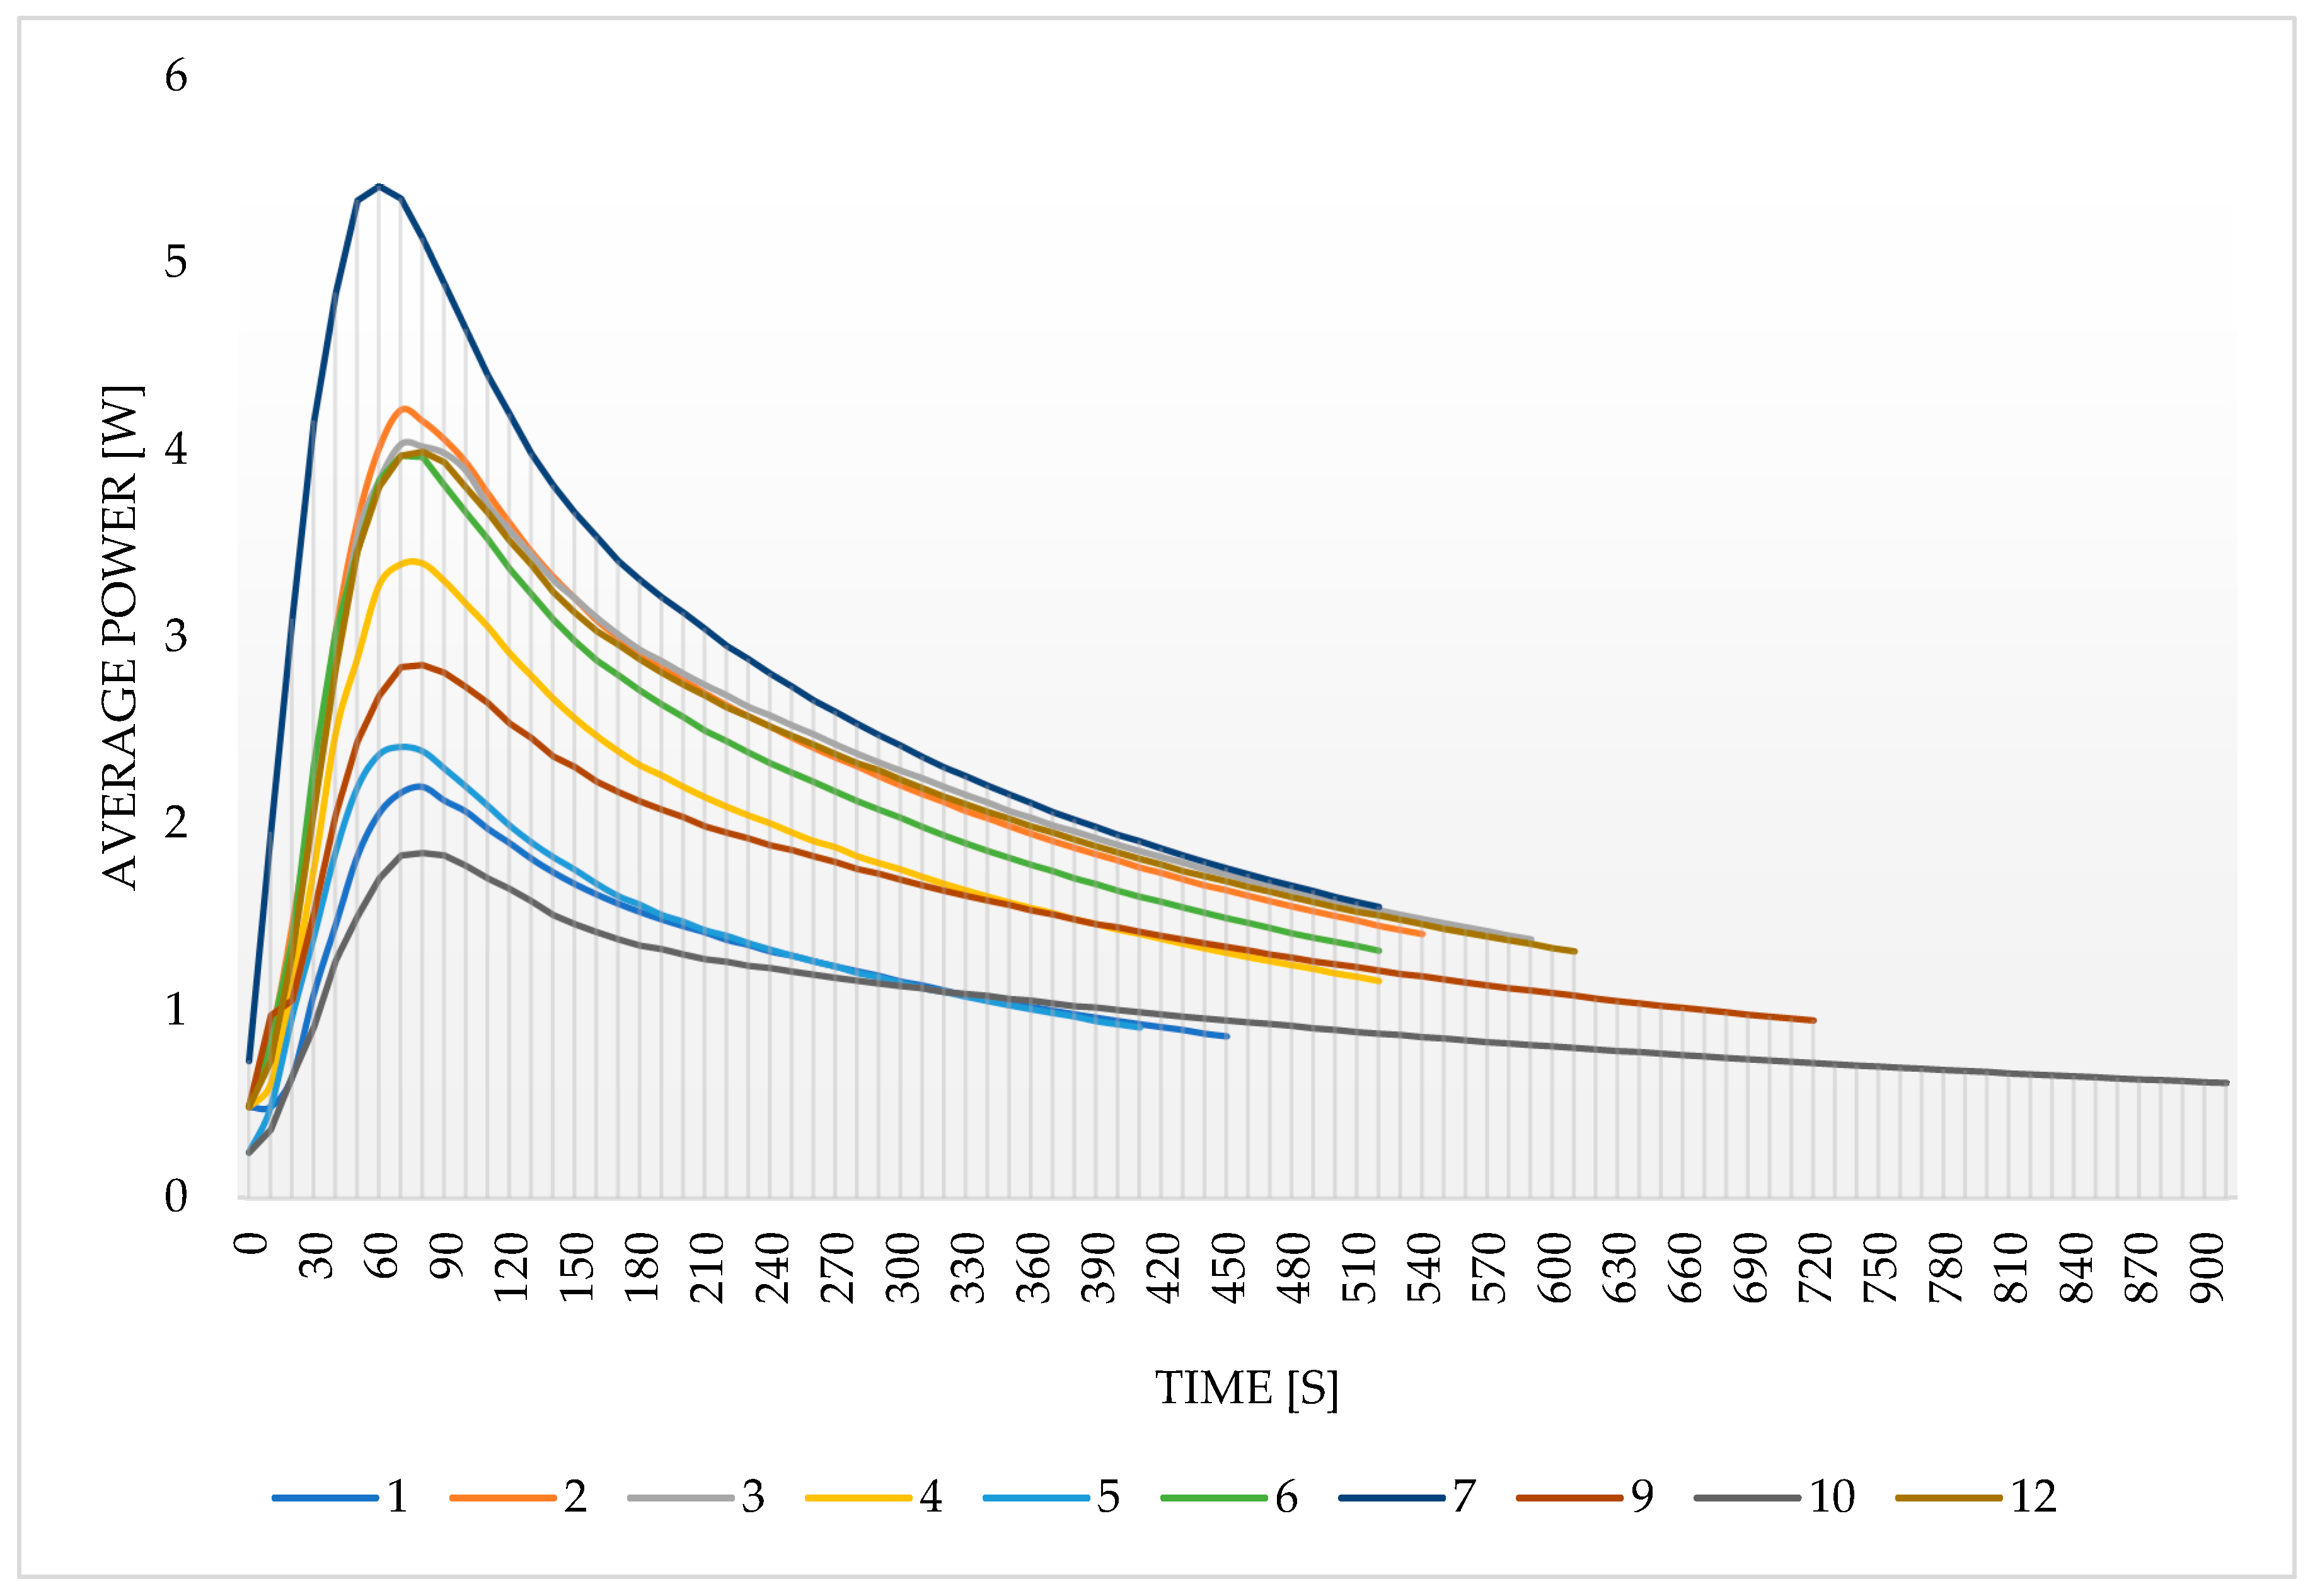
3.3. The Average Desorption Power
4. Conclusions
Author Contributions
Funding
Acknowledgments
Conflicts of Interest
References
- Japan Refrigeration and Air Conditioning Industry Association (JRAIA) World Air Conditioner Demand by Region. 2019, p. 10. Available online: https://www.jraia.or.jp/english/World_AC_Demand.pdf (accessed on 11 March 2020).
- IEA The Future of Cooling Opportunities for Energy- Efficient Air Conditioning. 2018. Available online: https://pronto-core-cdn.prontomarketing.com/449/wp-content/uploads/sites/2/2018/06/Melanie-Slade-The-Future-of-Cooling-Opportunities-for-Energy-Efficient-Air-Conditioning.pdf (accessed on 11 March 2020).
- Sztekler, K.; Kalawa, W.; Mika, L.; Krzywanski, J.; Grabowska, K.; Sosnowski, M.; Nowak, W.; Siwek, T.; Bieniek, A. Modeling of a Combined Cycle Gas Turbine Integrated with an Adsorption Chiller. Energies 2020, 13, 515. [Google Scholar] [CrossRef] [Green Version]
- Gwadera, M.; Kupiec, K. Absorpcyjne Urządzenia Chłodnicze. PWN. 1958. Available online: https://www.infona.pl/resource/bwmeta1.element.baztech-article-BPP2-0013-0023 (accessed on 11 March 2020).
- Stefański, S.; Mika, Ł.; Sztekler, K.; Kalawa, W.; Lis, Ł.; Nowak, W. Adsorption Bed Configurations for Adsorption Cooling Application. E3S Web Conf. 2019, 108. Available online: https://www.e3s-conferences.org/articles/e3sconf/abs/2019/34/e3sconf_ef18_01010/e3sconf_ef18_01010.html (accessed on 11 March 2020).
- Younes, M.M.; El-Sharkawy, I.I.; Kabeel, A.E.; Saha, B.B. A review on adsorbent-adsorbate pairs for cooling applications. Appl. Therm. Eng. 2017, 114, 394–414. [Google Scholar] [CrossRef]
- Shabir, F.; Sultan, M.; Miyazaki, T.; Saha, B.B.; Askalany, A.; Ali, I.; Zhou, Y.; Ahmad, R.; Shamshiri, R.R. Recent updates on the adsorption capacities of adsorbent-adsorbate pairs for heat transformation applications. Renew. Sustain. Energy Rev. 2020, 119, 109630. [Google Scholar] [CrossRef]
- Grabowska, K.; Krzywanski, J.; Nowak, W.; Wesolowska, M. Construction of an innovative adsorbent bed configuration in the adsorption chiller—Selection criteria for effective sorbent-glue pair. Energy 2018, 151, 317–323. [Google Scholar] [CrossRef]
- Shahzad, M.W.; Burhan, M.; Ng, K.C. Pushing desalination recovery to the maximum limit: Membrane and thermal processes integration. Desalination 2017, 416, 54–64. [Google Scholar] [CrossRef]
- Son, H.S.; Shahzad, M.W.; Ghaffour, N.; Ng, K.C. Pilot studies on synergetic impacts of energy utilization in hybrid desalination system: Multi-effect distillation and adsorption cycle (MED-AD). Desalination 2020, 477, 114266. [Google Scholar] [CrossRef]
- Zajaczkowski, B. Optimizing performance of a three-bed adsorption chiller using new cycle time allocation and mass recovery. Appl. Therm. Eng. 2016, 100, 744–752. [Google Scholar] [CrossRef]
- Hinze, M.; Ranft, F.; Drummer, D.; Schwieger, W. Reduction of the heat capacity in low-temperature adsorption chillers using thermally conductive polymers as heat exchangers material. Energy Convers. Manag. 2017, 145, 378–385. [Google Scholar] [CrossRef]
- Krzywanski, J.; Grabowska, K.; Herman, F.; Pyrka, P.; Sosnowski, M.; Prauzner, T.; Nowak, W. Optimization of a three-bed adsorption chiller by genetic algorithms and neural networks. Energy Convers. Manag. 2017, 153, 313–322. [Google Scholar] [CrossRef]
- Li, X.H.; Hou, X.H.; Zhang, X.; Yuan, Z.X. A review on development of adsorption cooling—Novel beds and advanced cycles. Energy Convers. Manag. 2015, 94, 221–232. [Google Scholar] [CrossRef]
- Vodianitskaia, P.J.; Soares, J.J.; Melo, H.; Gurgel, J.M. Experimental chiller with silica gel: Adsorption kinetics analysis and performance evaluation. Energy Convers. Manag. 2017, 132, 172–179. [Google Scholar] [CrossRef]
- Sharafian, A.; Fayazmanesh, K.; McCague, C.; Bahrami, M. Thermal conductivity and contact resistance of mesoporous silica gel adsorbents bound with polyvinylpyrrolidone in contact with a metallic substrate for adsorption cooling system applications. Int. J. Heat Mass Transf. 2014, 79, 64–71. [Google Scholar] [CrossRef]
- Chiguma, J.; Johnson, E.; Shah, P.; Gornopolskaya, N.; Jones, W.E., Jr. Thermal Diffusivity and Thermal Conductivity of Epoxy-Based Nanocomposites by the Laser Flash and Differential Scanning Calorimetry Techniques. Open J. Compos. Mater. 2013, 3, 51–62. [Google Scholar] [CrossRef] [Green Version]
- Askalany, A.A.; Henninger, S.K.; Ghazy, M.; Saha, B.B. Effect of improving thermal conductivity of the adsorbent on performance of adsorption cooling system. Appl. Therm. Eng. 2017, 110, 695–702. [Google Scholar] [CrossRef]
- El-Sharkawy, I.I.; Pal, A.; Miyazaki, T.; Saha, B.B.; Koyama, S. A study on consolidated composite adsorbents for cooling application. Appl. Therm. Eng. 2016, 98, 1214–1220. [Google Scholar] [CrossRef] [Green Version]
- Dzigbor, A.; Chimphango, A. Evaluating the potential of using ethanol/water mixture as a refrigerant in adsorption cooling system by using activated carbon—Sodium chloride composite adsorbent. Int. J. Refrig. 2019, 97, 132–142. [Google Scholar] [CrossRef]
- Aristov, Y.I.; Sapienza, A.; Ovoshchnikov, D.S.; Freni, A.; Restuccia, G. Reallocation of adsorption and desorption times for optimisation of cooling cycles. Int. J. Refrig. 2012, 35, 525–531. [Google Scholar] [CrossRef]
- Sapienza, A.; Gullì, G.; Calabrese, L.; Palomba, V.; Frazzica, A.; Brancato, V.; La Rosa, D.; Vasta, S.; Freni, A.; Bonaccorsi, L.; et al. An innovative adsorptive chiller prototype based on 3 hybrid coated/granular adsorbers. Appl. Energy 2016, 179, 929–938. [Google Scholar] [CrossRef]
- Restuccia, G.; Freni, A.; Russo, F.; Vasta, S. Experimental investigation of a solid adsorption chiller based on a heat exchanger coated with hydrophobic zeolite. Appl. Therm. Eng. 2005, 25, 1419–1428. [Google Scholar] [CrossRef]
- Freni, A.; Bonaccorsi, L.; Calabrese, L.; Caprì, A.; Frazzica, A.; Sapienza, A. SAPO-34 coated adsorbent heat exchanger for adsorption chillers. Appl. Therm. Eng. 2015, 82, 1–7. [Google Scholar] [CrossRef]
- Kim, D.S.; Chang, Y.S.; Lee, D.Y. Modelling of an adsorption chiller with adsorbent-coated heat exchangers: Feasibility of a polymer-water adsorption chiller. Energy 2018, 164, 1044–1061. [Google Scholar] [CrossRef]
- Chang, K.S.; Chen, M.T.; Chung, T.W. Effects of the thickness and particle size of silica gel on the heat and mass transfer performance of a silica gel-coated bed for air-conditioning adsorption systems. Appl. Therm. Eng. 2005, 25, 2330–2340. [Google Scholar] [CrossRef]


| No. | Glue Mass (g) | SG Mass (g) | Glue Number and Concentration | SG Sample and Drying Procedure | Observations |
|---|---|---|---|---|---|
| 1 | 4.317 | 2.417 | 3/5% | SG 1000, drying 75 °C | Multilayered on the edges |
| 2 | 4.011 | 2.428 | 3/5% | SG 1000, drying 20 °C | Big noncovered spaces |
| 3 | 4.44 | 2.930 | 3/5% | SG 1000 + SG < 200, drying 75 °C | Covered tight |
| 4 | 4.41 | 2.952 | 3/5% | SG 1000 + SG < 200, drying 20 °C | Irregular thickens of the layer |
| 5 | 4.083 | 2.401 | 2/1.25% | SG 1000, drying 75 °C | Big noncovered spaces |
| 6 | 3.895 | 2.407 | 2/1.25% | SG 1000, drying 20 °C | Multilayered on the edges |
| 7 | 4.425 | 2.927 | 2/1.25% | SG 1000 + SG < 200, drying 75 °C | Wholes from water evaporation |
| 8 | 4.435 | 2.444 | 2/1.25% | SG 1000 + SG < 200, drying 20 °C | Porous, many cracks and weak adherence |
| 9 | 3.57 | 2.462 | 1/5% | SG 1000, drying 75 °C | Locally high density |
| 10 | 3.573 | 2.766 | 1/5% | SG 1000, drying 20 °C | Irregular density |
| 11 | 3.55 | 2.417 | 1/5% | SG 1000 + SG < 200, drying 75 °C | Porous, many cracks and weak adherence |
| 12 | 3.57 | 2.428 | 1/5% | SG 1000 + SG < 200, drying 20 °C | Irregular thickens of the layer |
| No. | Silica Gel Mixed with Adhesive on A Metal Tray Resembling A Heat Exchanger | No. | Silica Gel Mixed with Adhesive on A Metal Tray Resembling A Heat Exchanger |
|---|---|---|---|
| 1 | 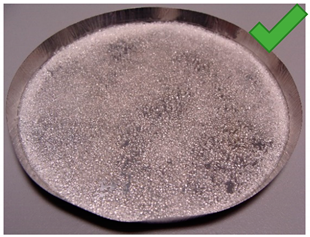 | 7 | 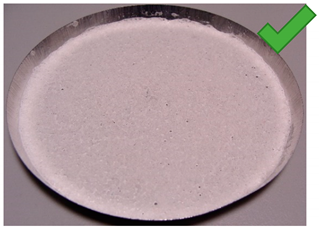 |
| 2 | 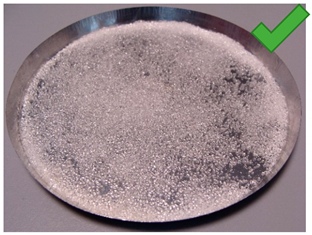 | 8 | 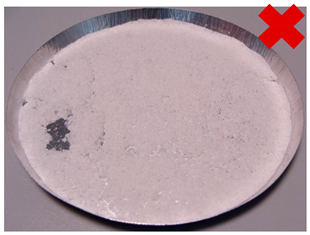 |
| 3 | 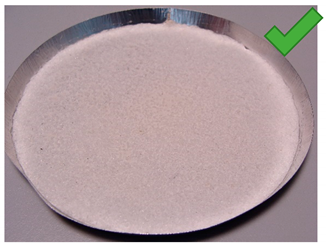 | 9 | 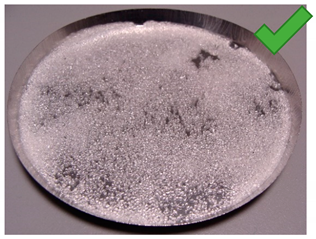 |
| 4 | 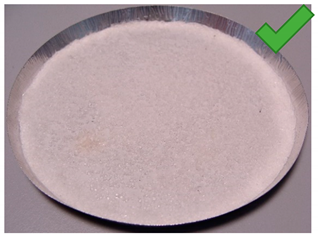 | 10 |  |
| 5 | 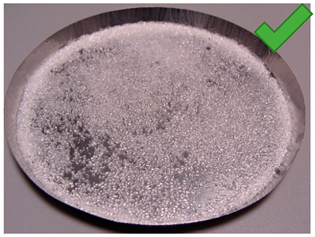 | 11 | 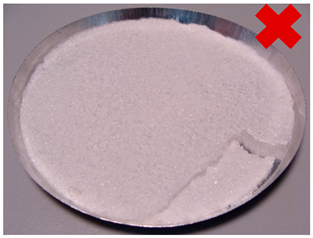 |
| 6 | 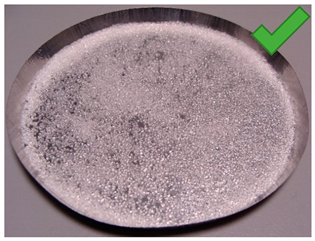 | 12 | 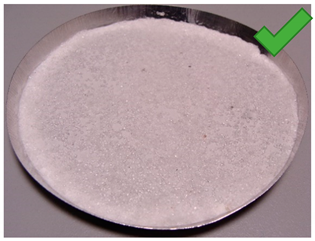 |
© 2020 by the authors. Licensee MDPI, Basel, Switzerland. This article is an open access article distributed under the terms and conditions of the Creative Commons Attribution (CC BY) license (http://creativecommons.org/licenses/by/4.0/).
Share and Cite
Sztekler, K.; Kalawa, W.; Mlonka-Medrala, A.; Nowak, W.; Mika, Ł.; Krzywanski, J.; Grabowska, K.; Sosnowski, M.; Debniak, M. The Effect of Adhesive Additives on Silica Gel Water Sorption Properties. Entropy 2020, 22, 327. https://doi.org/10.3390/e22030327
Sztekler K, Kalawa W, Mlonka-Medrala A, Nowak W, Mika Ł, Krzywanski J, Grabowska K, Sosnowski M, Debniak M. The Effect of Adhesive Additives on Silica Gel Water Sorption Properties. Entropy. 2020; 22(3):327. https://doi.org/10.3390/e22030327
Chicago/Turabian StyleSztekler, Karol, Wojciech Kalawa, Agata Mlonka-Medrala, Wojciech Nowak, Łukasz Mika, Jaroslaw Krzywanski, Karolina Grabowska, Marcin Sosnowski, and Marcin Debniak. 2020. "The Effect of Adhesive Additives on Silica Gel Water Sorption Properties" Entropy 22, no. 3: 327. https://doi.org/10.3390/e22030327