


Visibility Graph Analysis of Heartbeat Time Series: Comparison of Young vs. Old, Healthy vs. Diseased, Rest vs. Exercise, and Sedentary vs. Active

Abstract
:1. Introduction
2. Materials and Methods
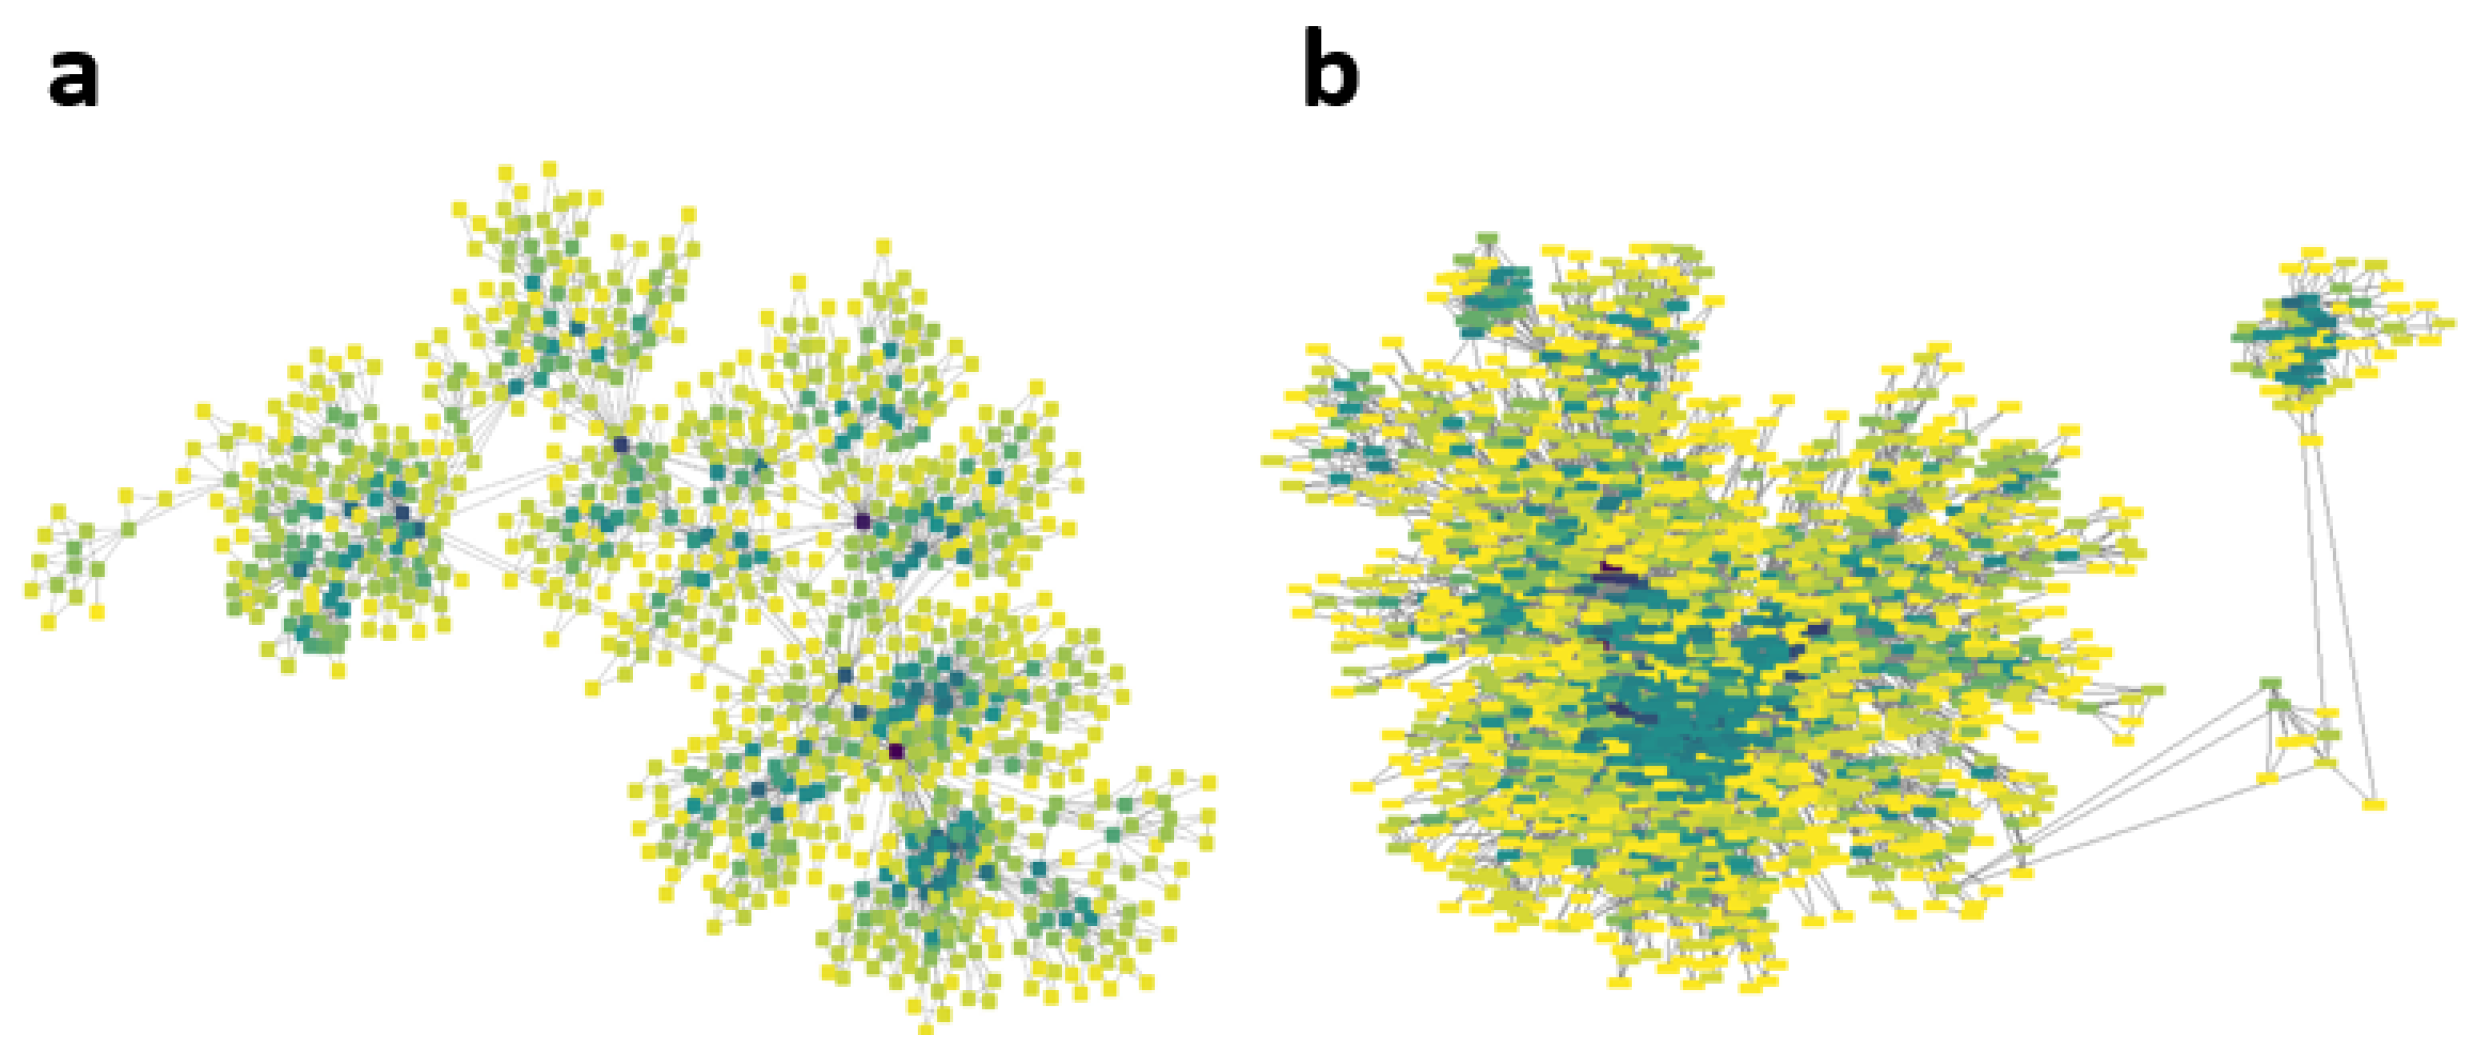
2.1. Visibility Algorithm
- A node is visible at least to its nearest neighbors (left and right).
- The edges do not have a direction.
- Visibility is not affected by the scaling of either horizontal or vertical axes, nor horizontal or vertical translations.
2.2. k-M Slope, Average Degree, and Average Path 0 for White, Pink, and Brownian Noise
2.3. Heartbeat Time Series
2.3.1. Young and Elderly Healthy Subjects
2.3.2. Healthy Subjects and CHF Patients
- 54 registers over 24 h from subjects with normal sinus rhythm R–R interval (30 men, aged 28.5–76; 26 women, aged 58–73).
- 29 registers over 24 h from subjects with CHF, New York Heart Association (NYHA) classifications I, II, and III.
- 15 registers over 24 h from subjects with severe CHF, NYHA classifications III and IV (11 men, aged 22–71; 4 women, aged 54–63).
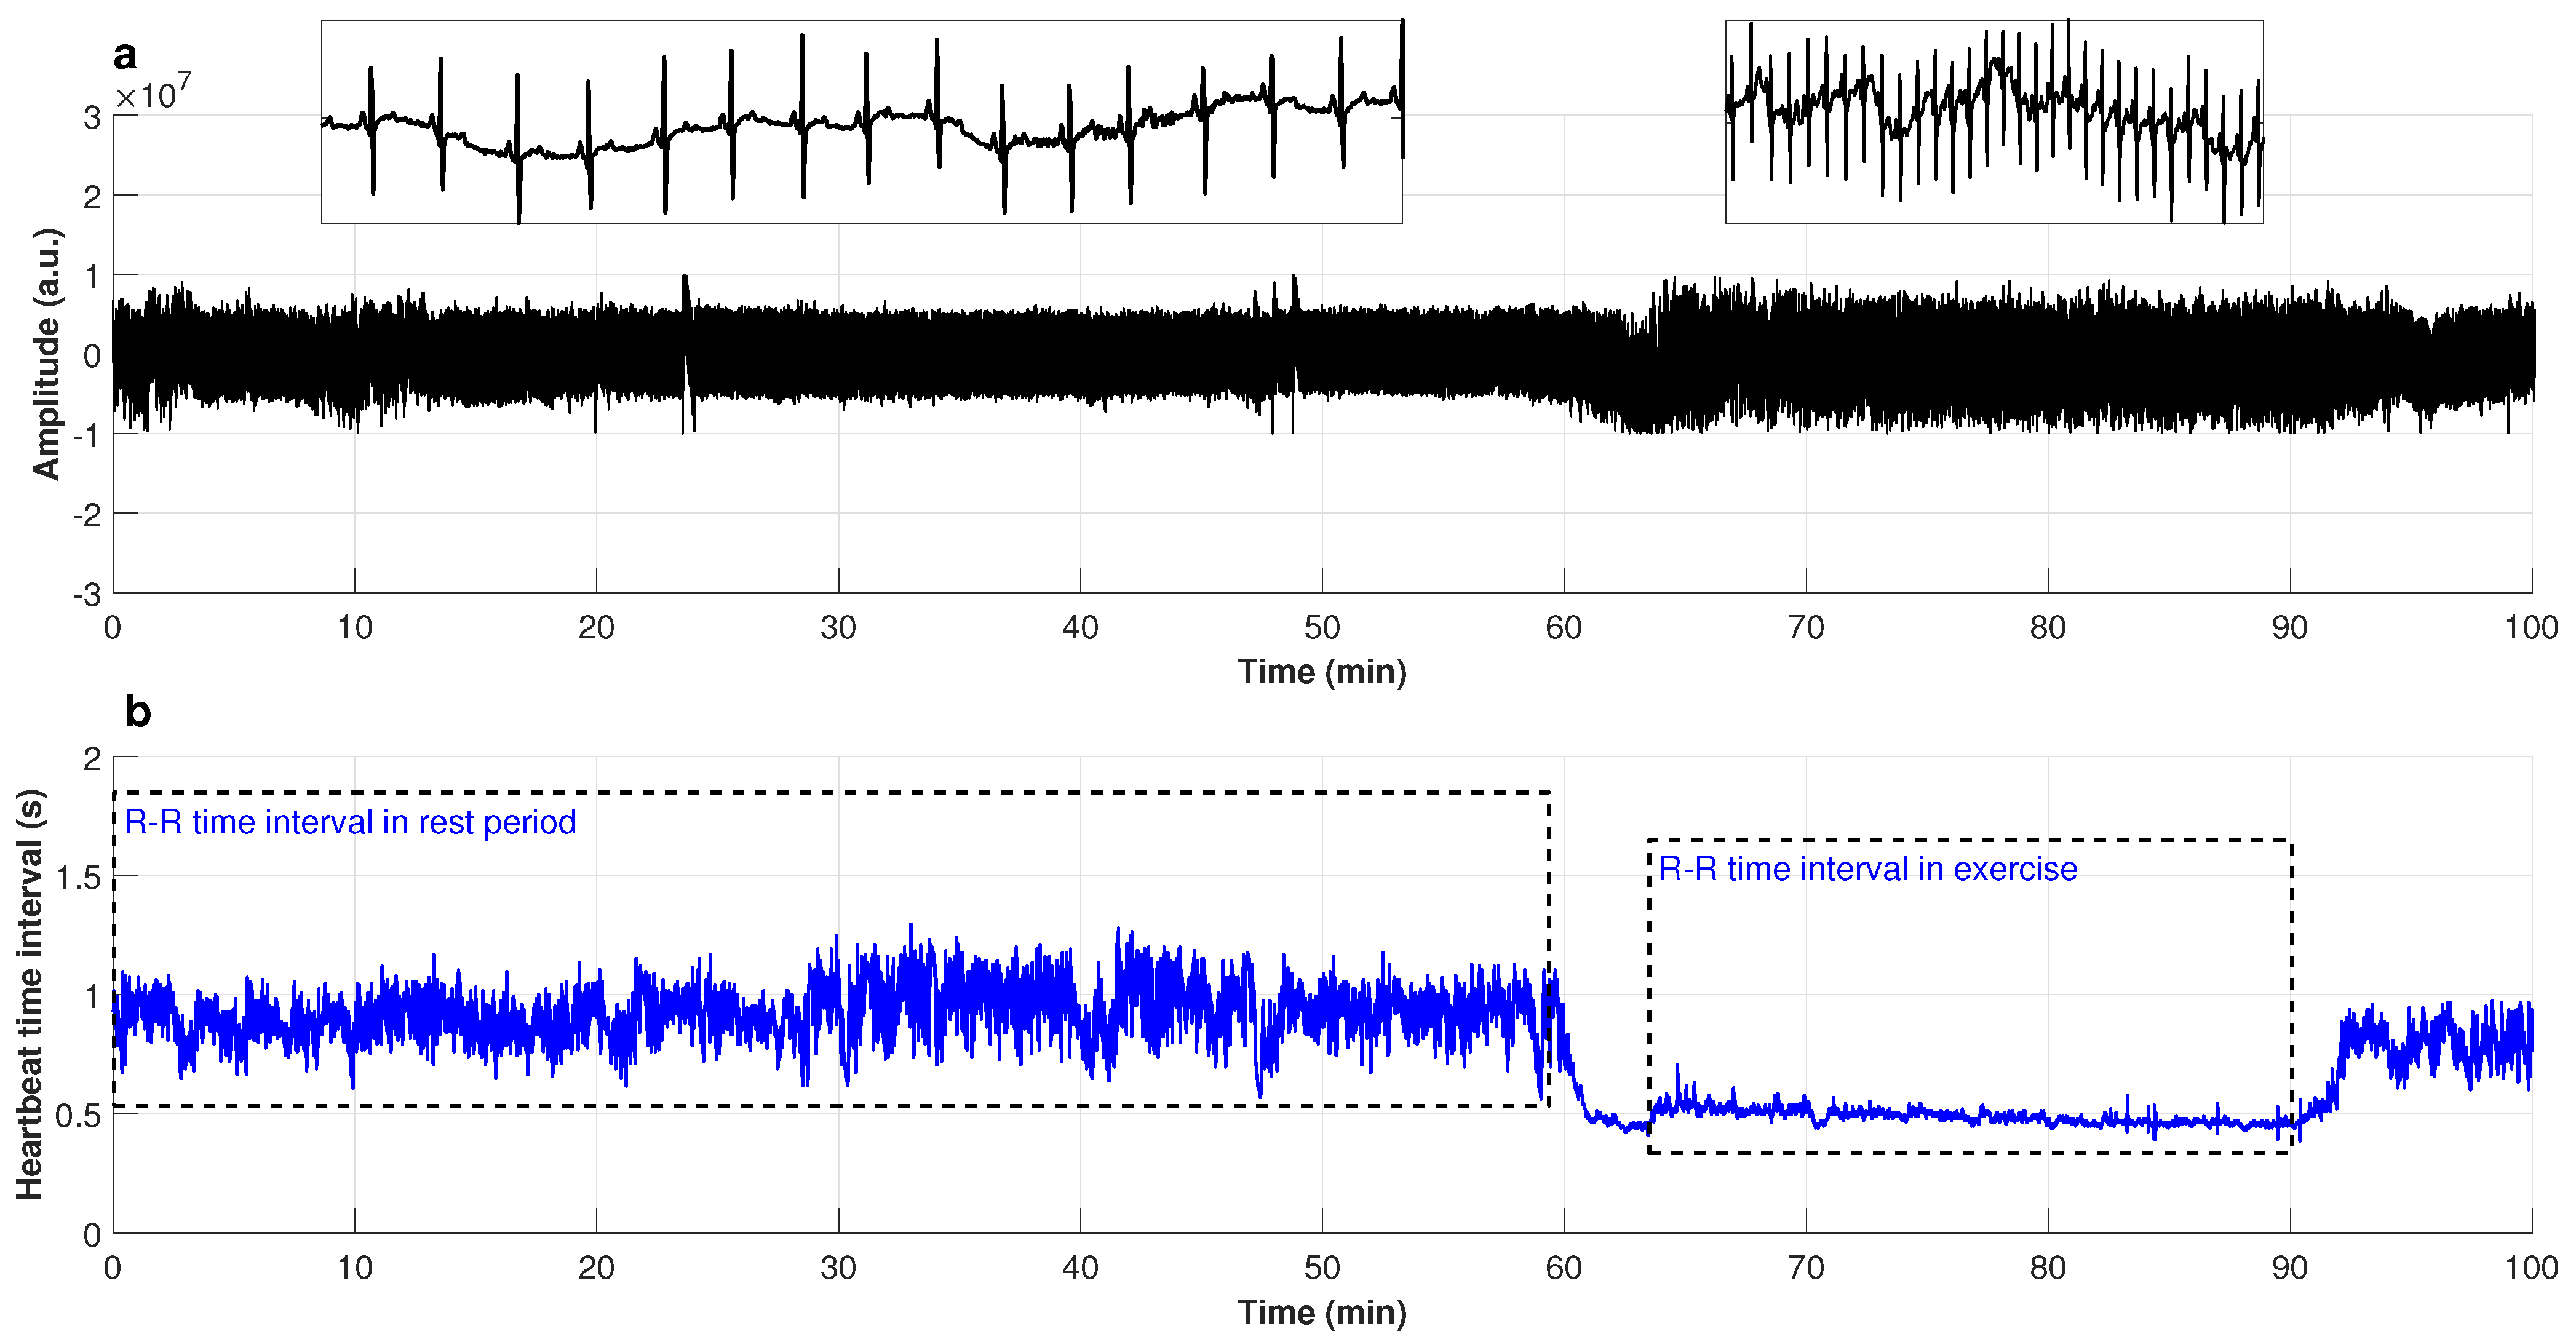
2.3.3. Cardiac Interbeat Series Obtained at Rest and While Exercising
3. Results
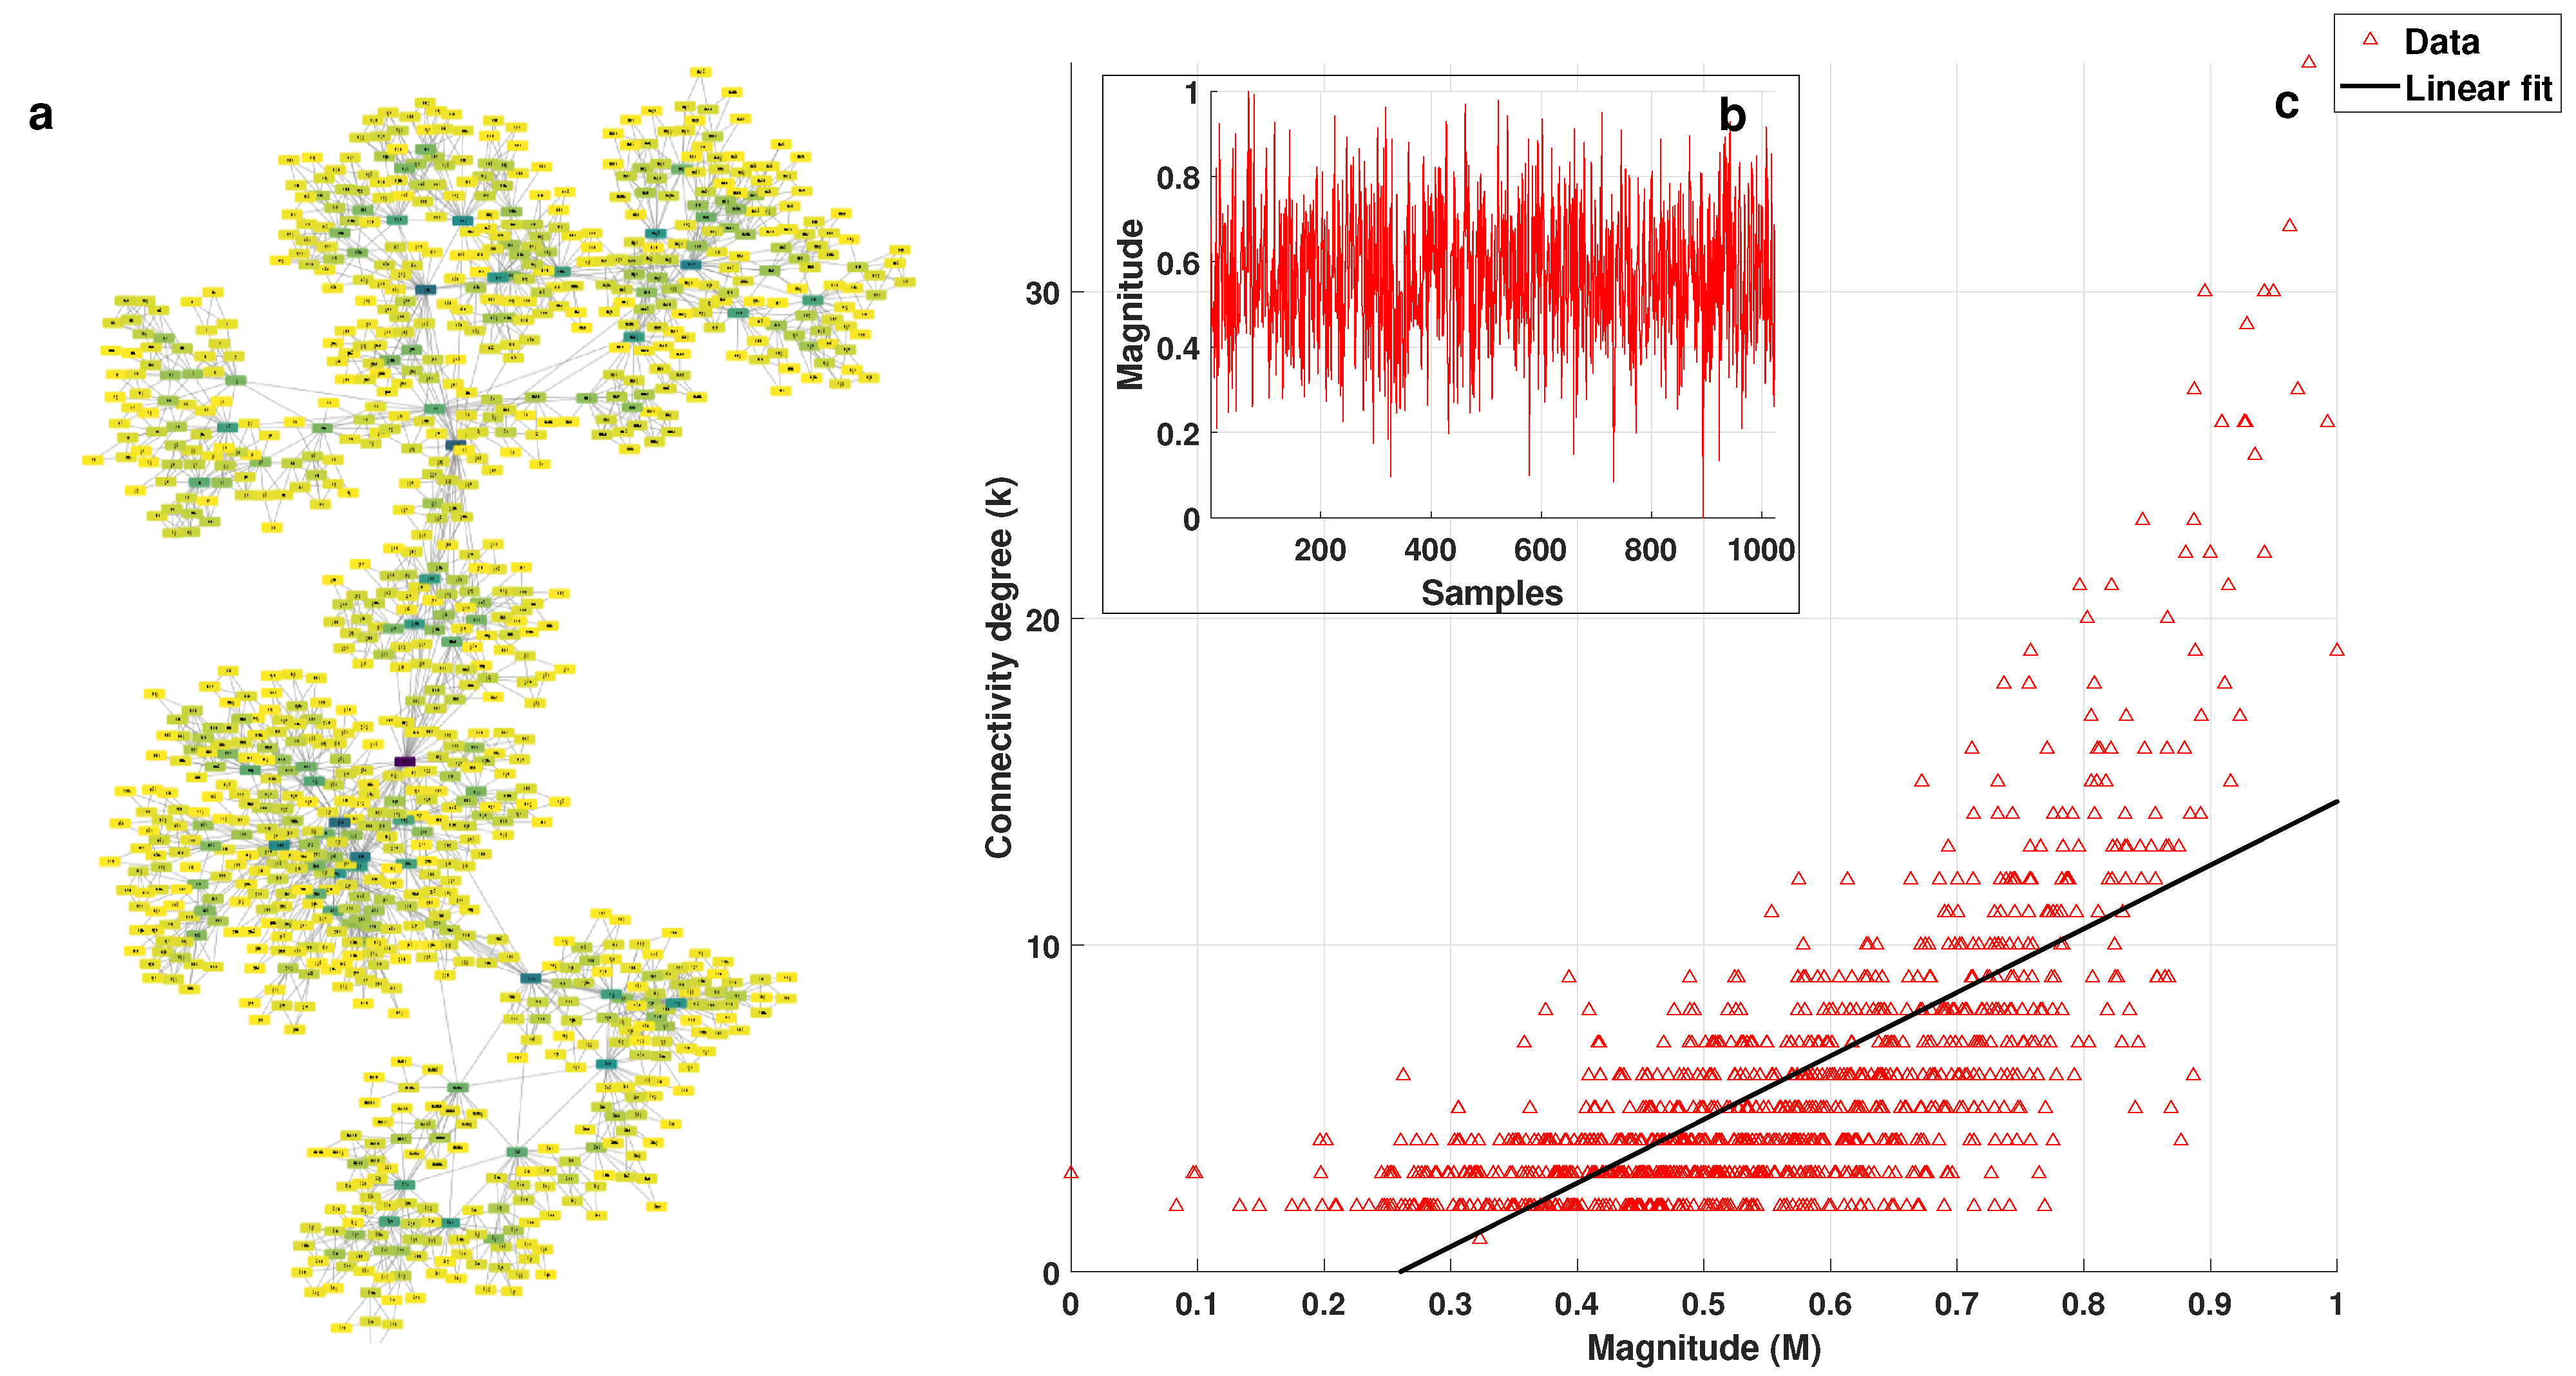
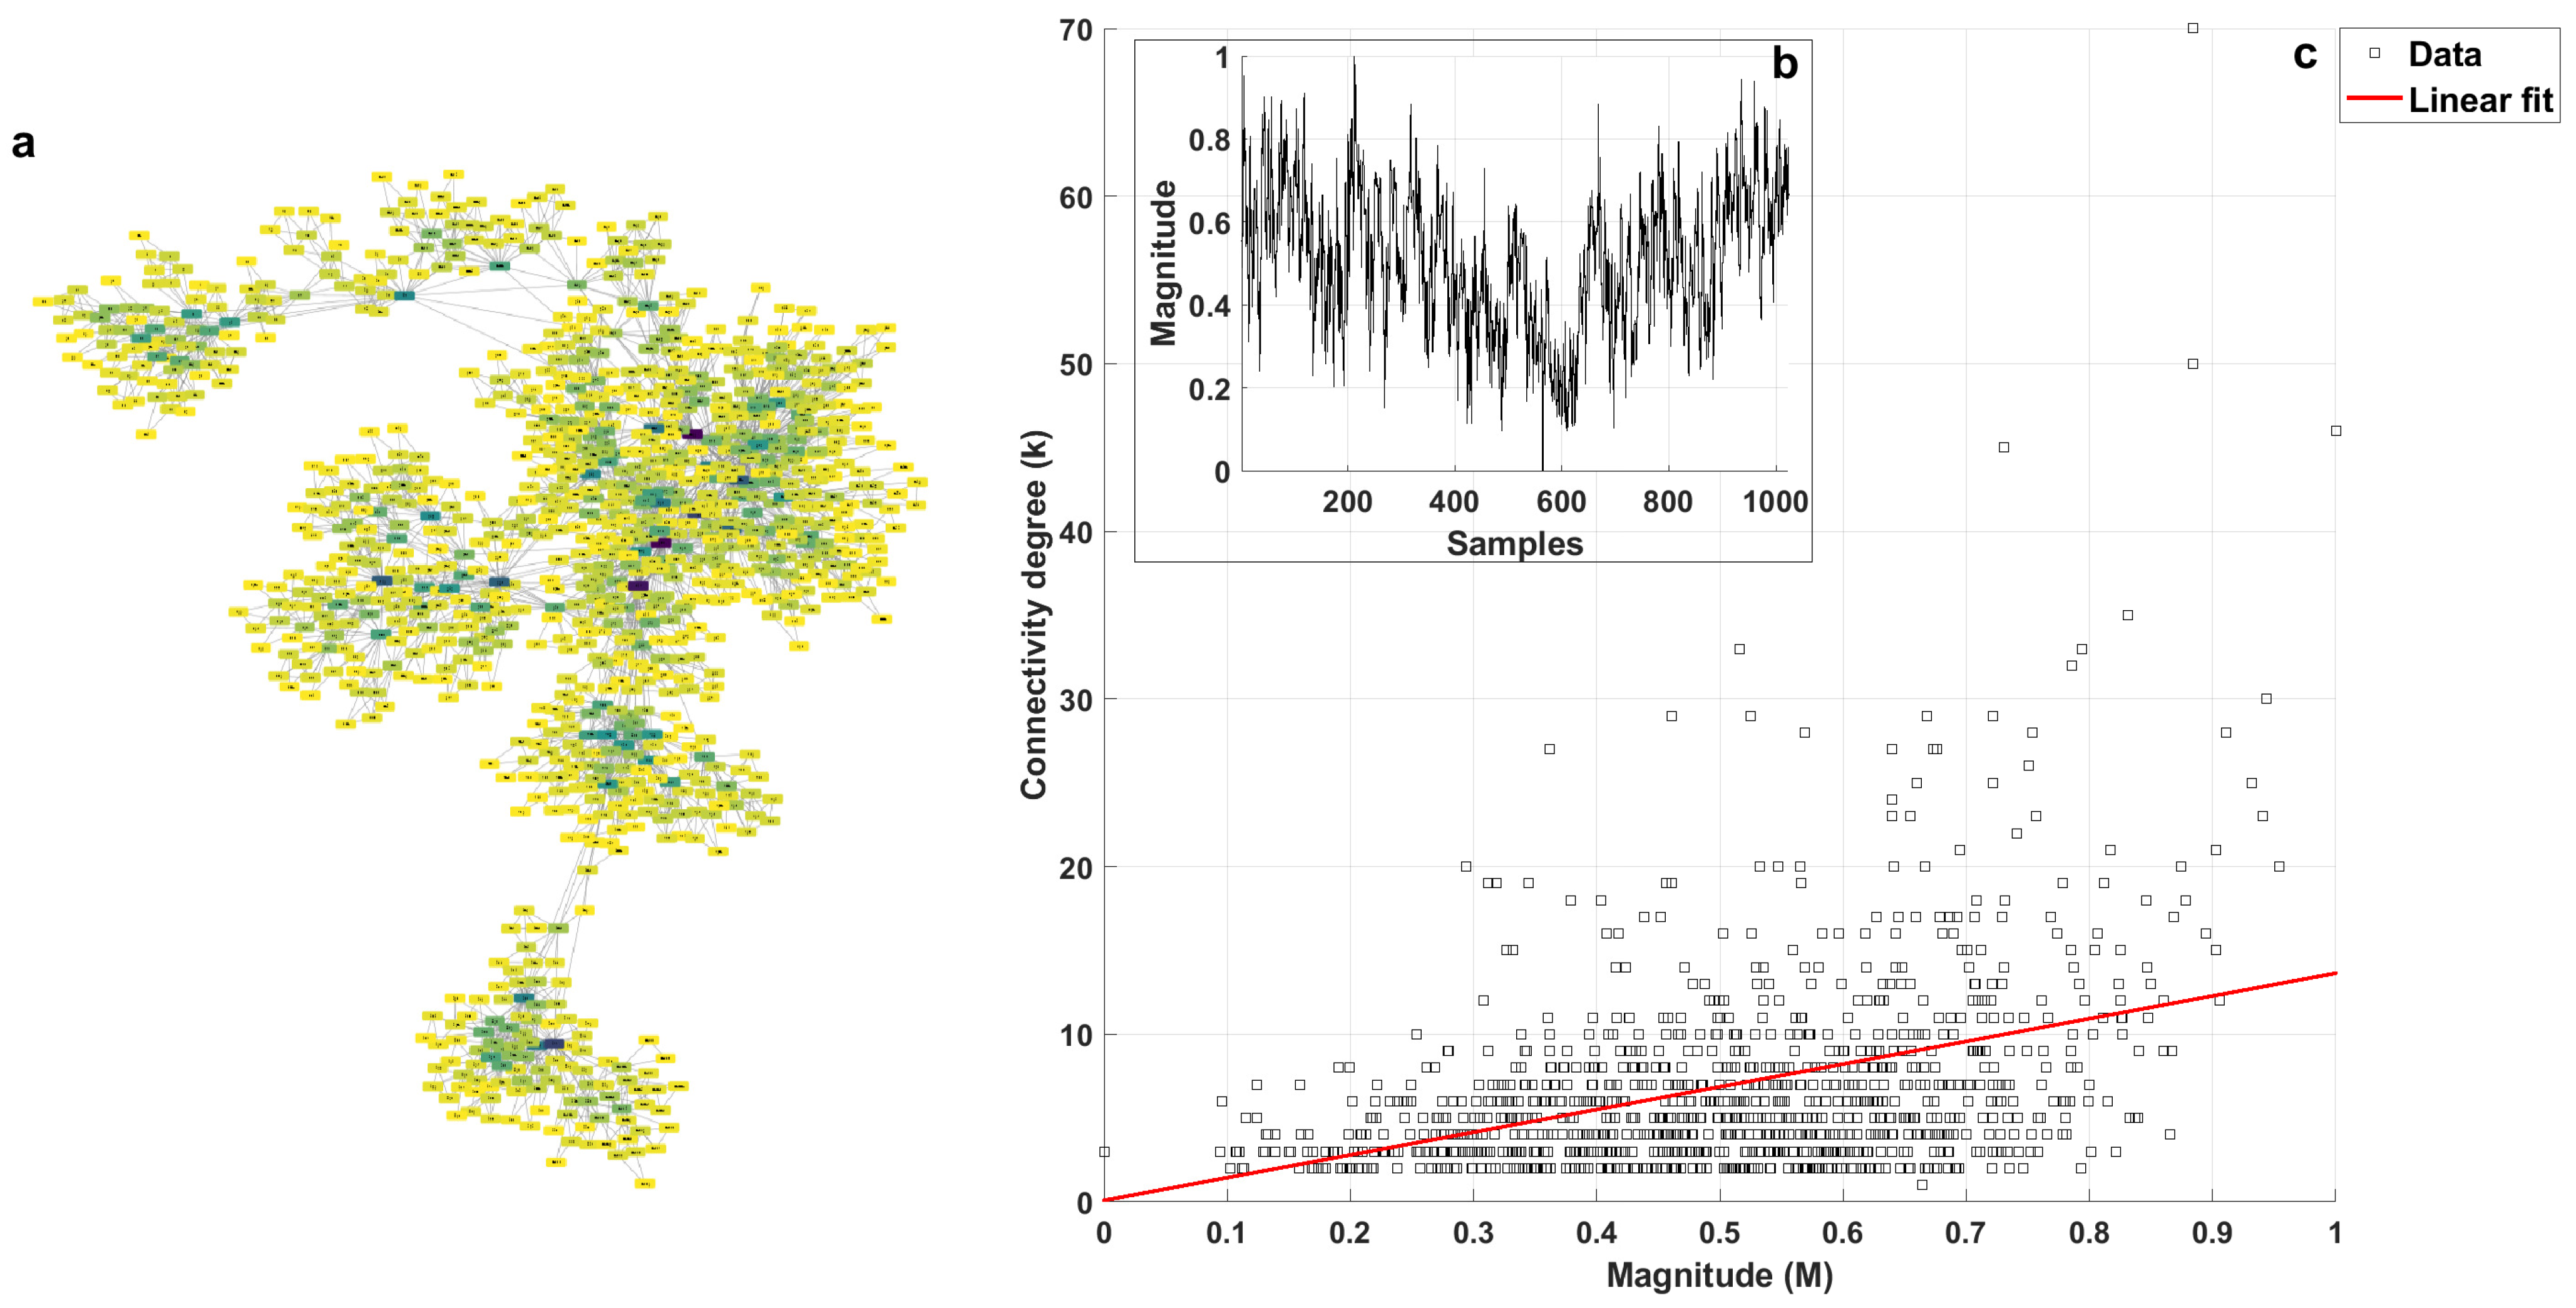
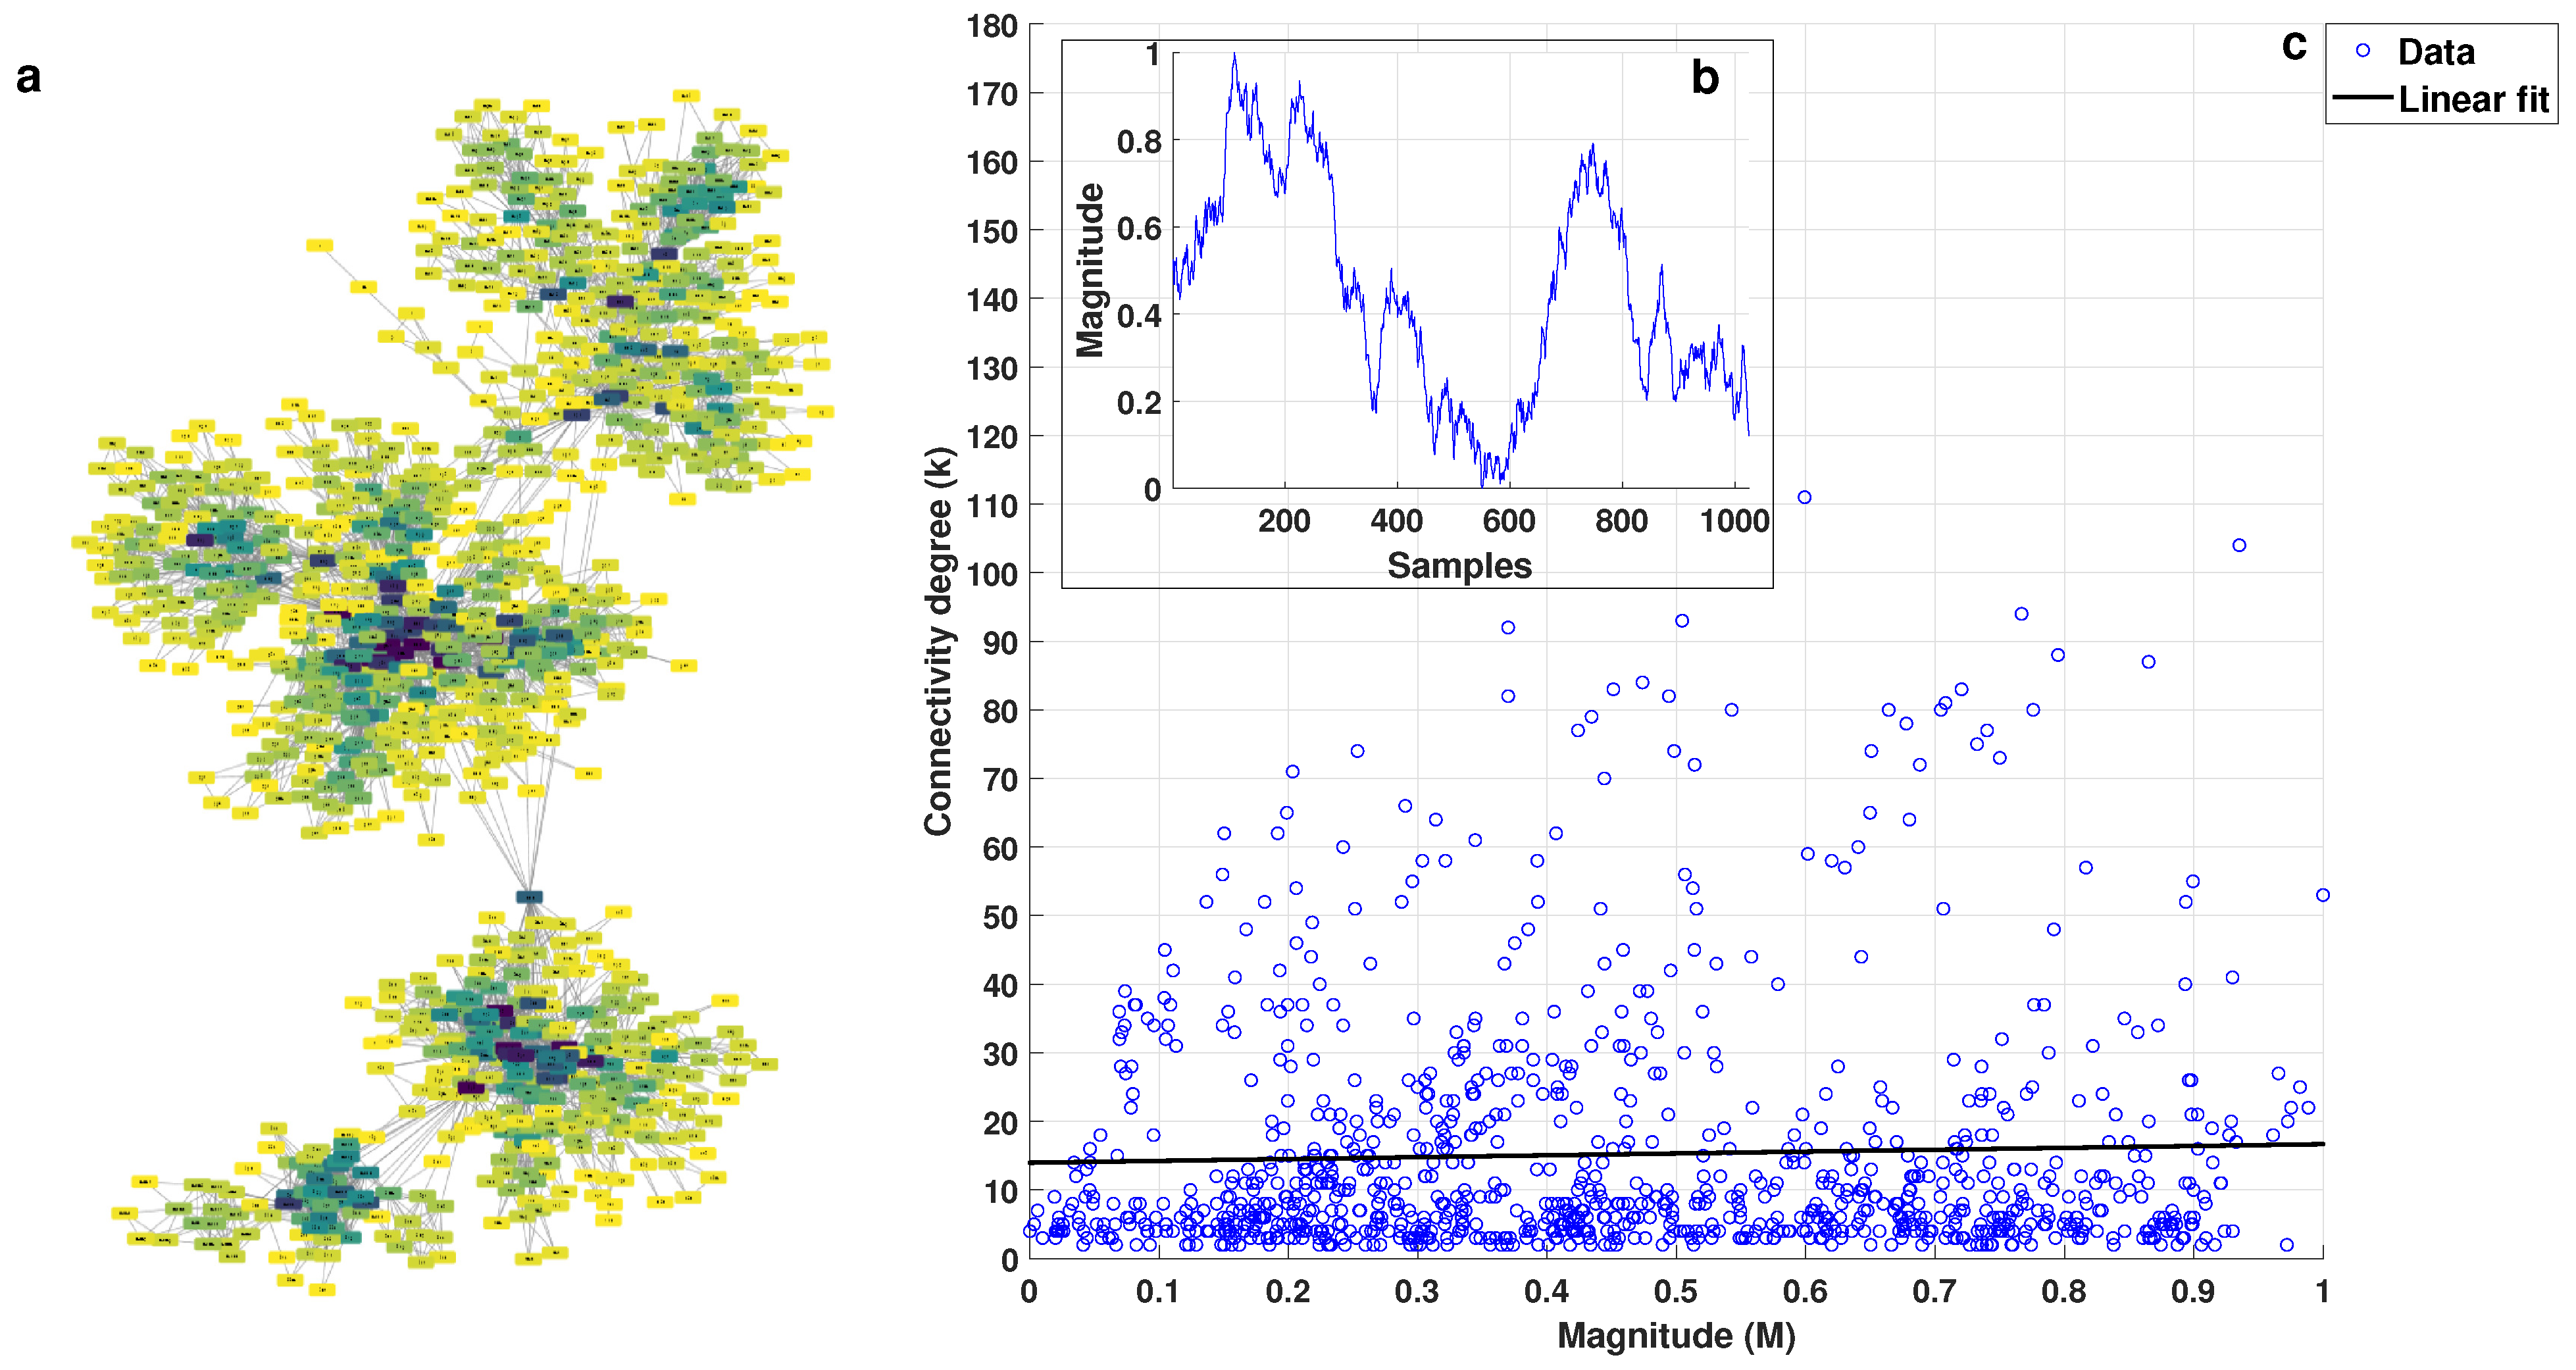
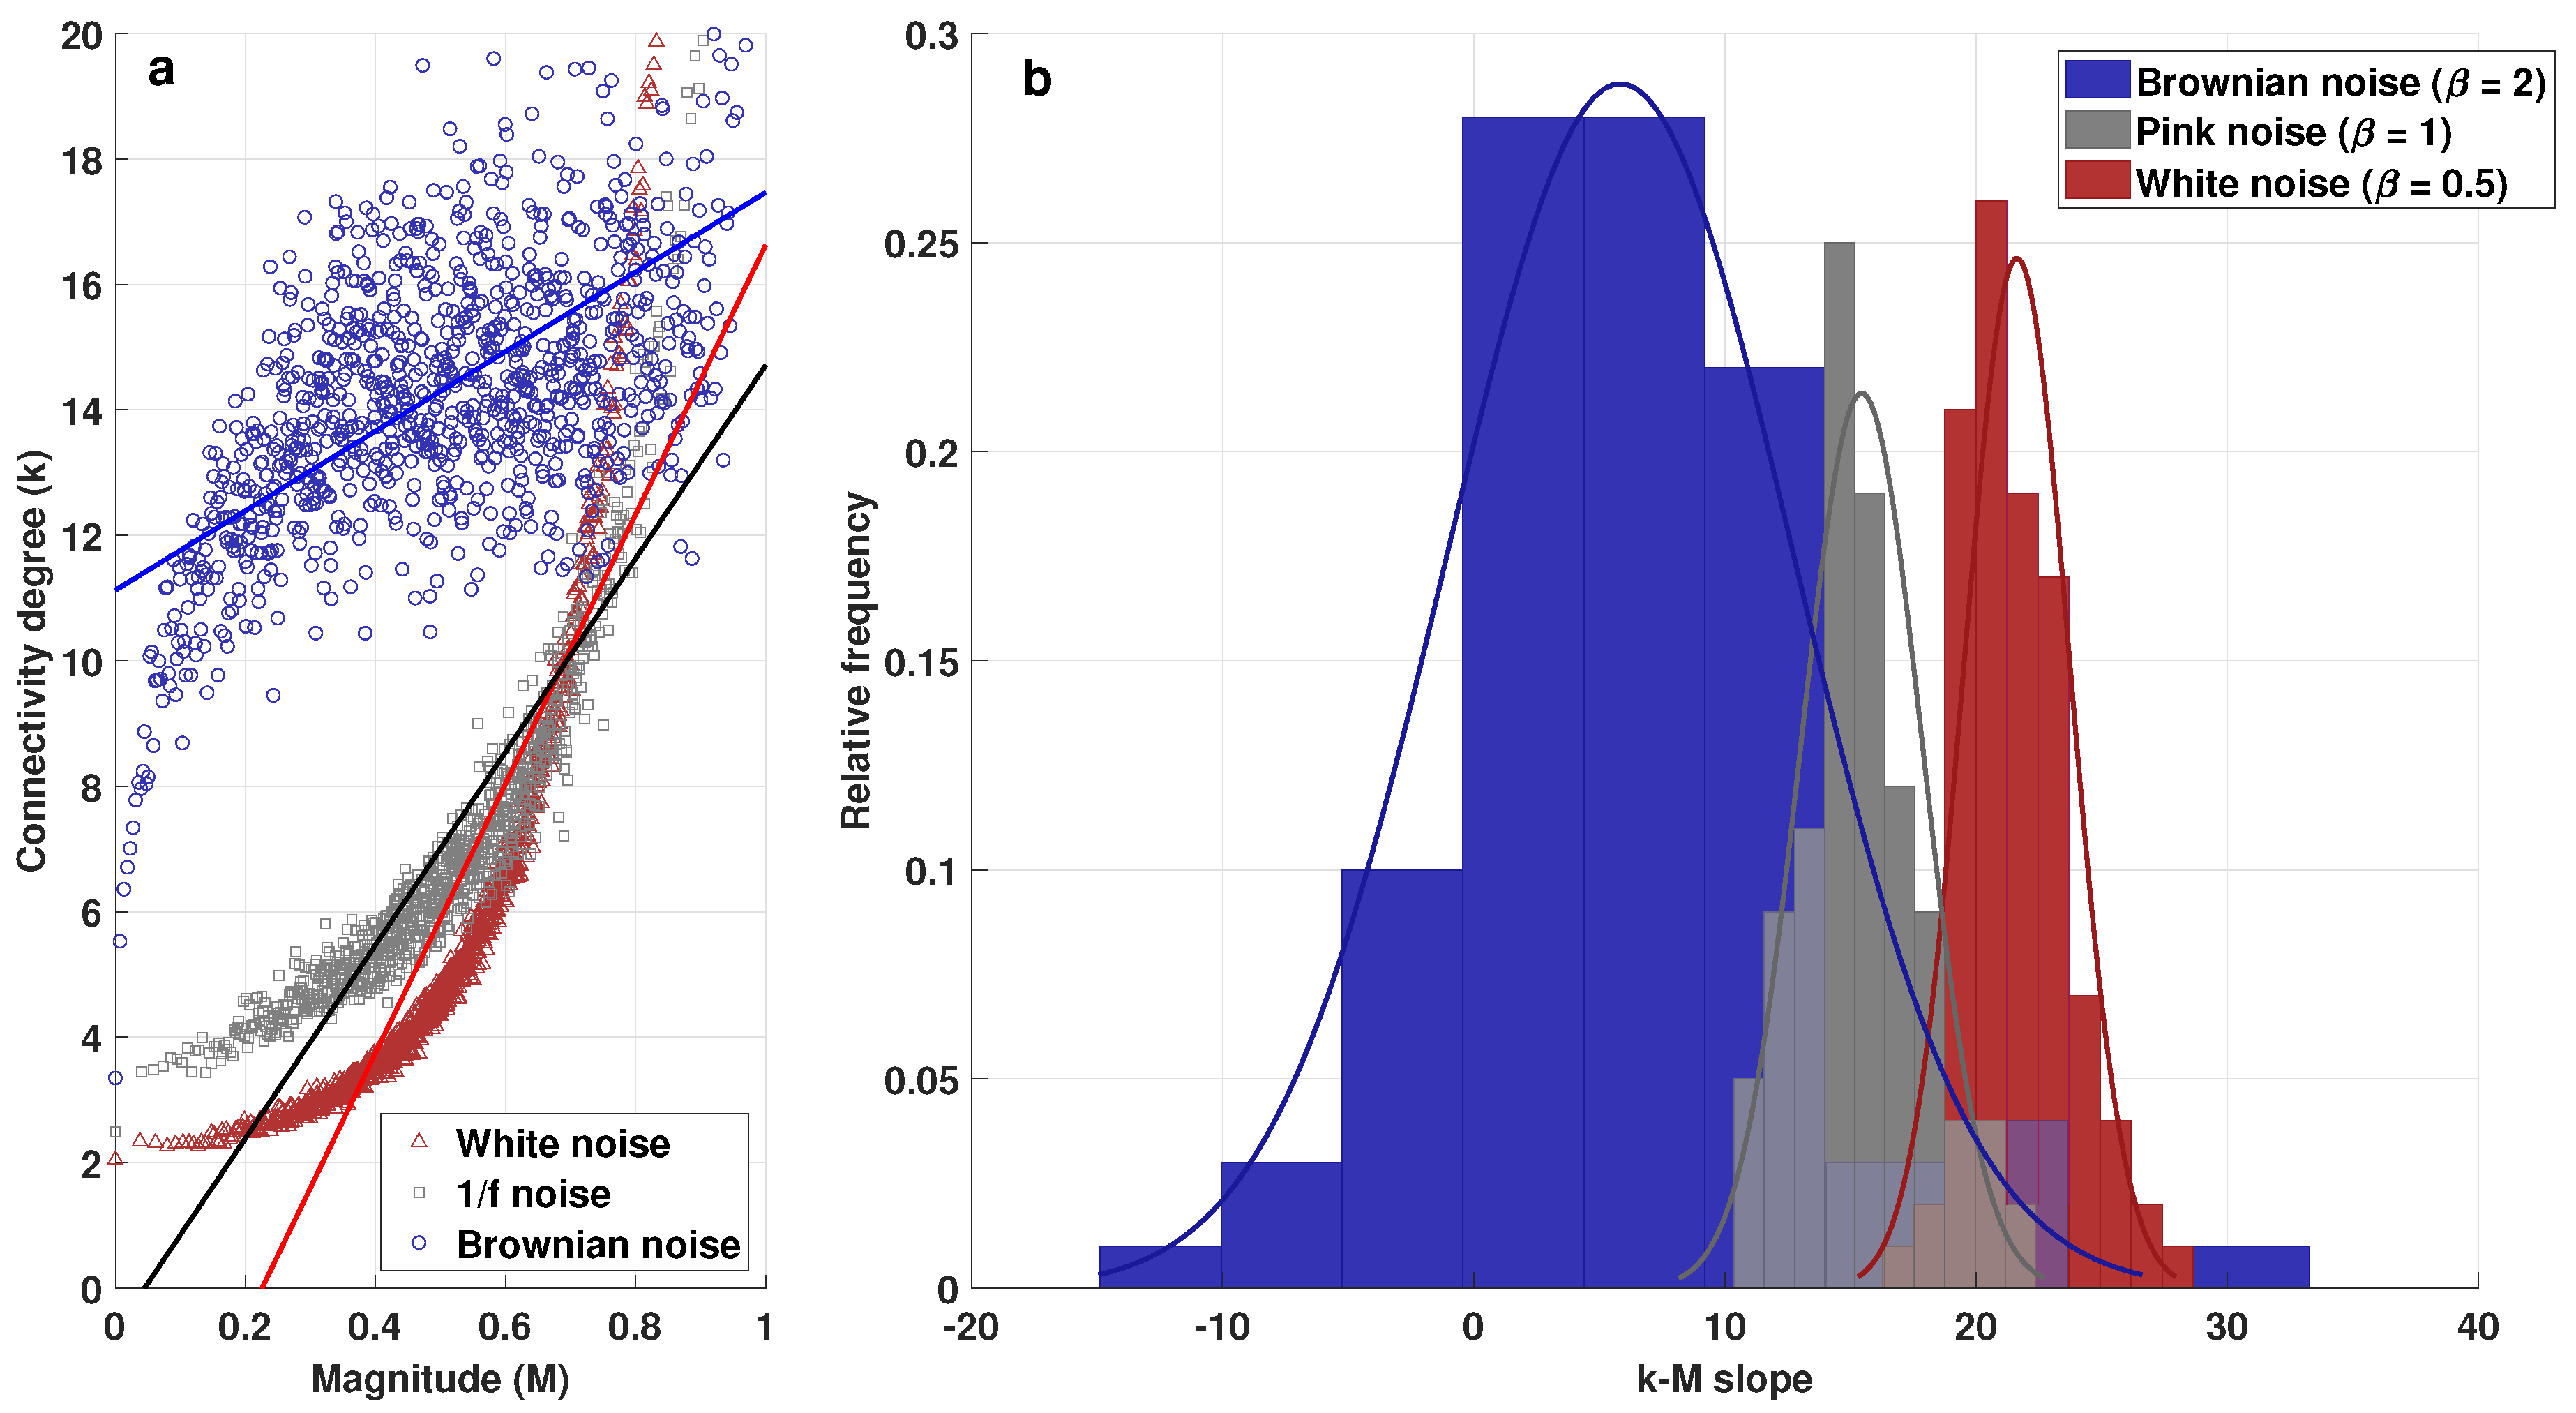
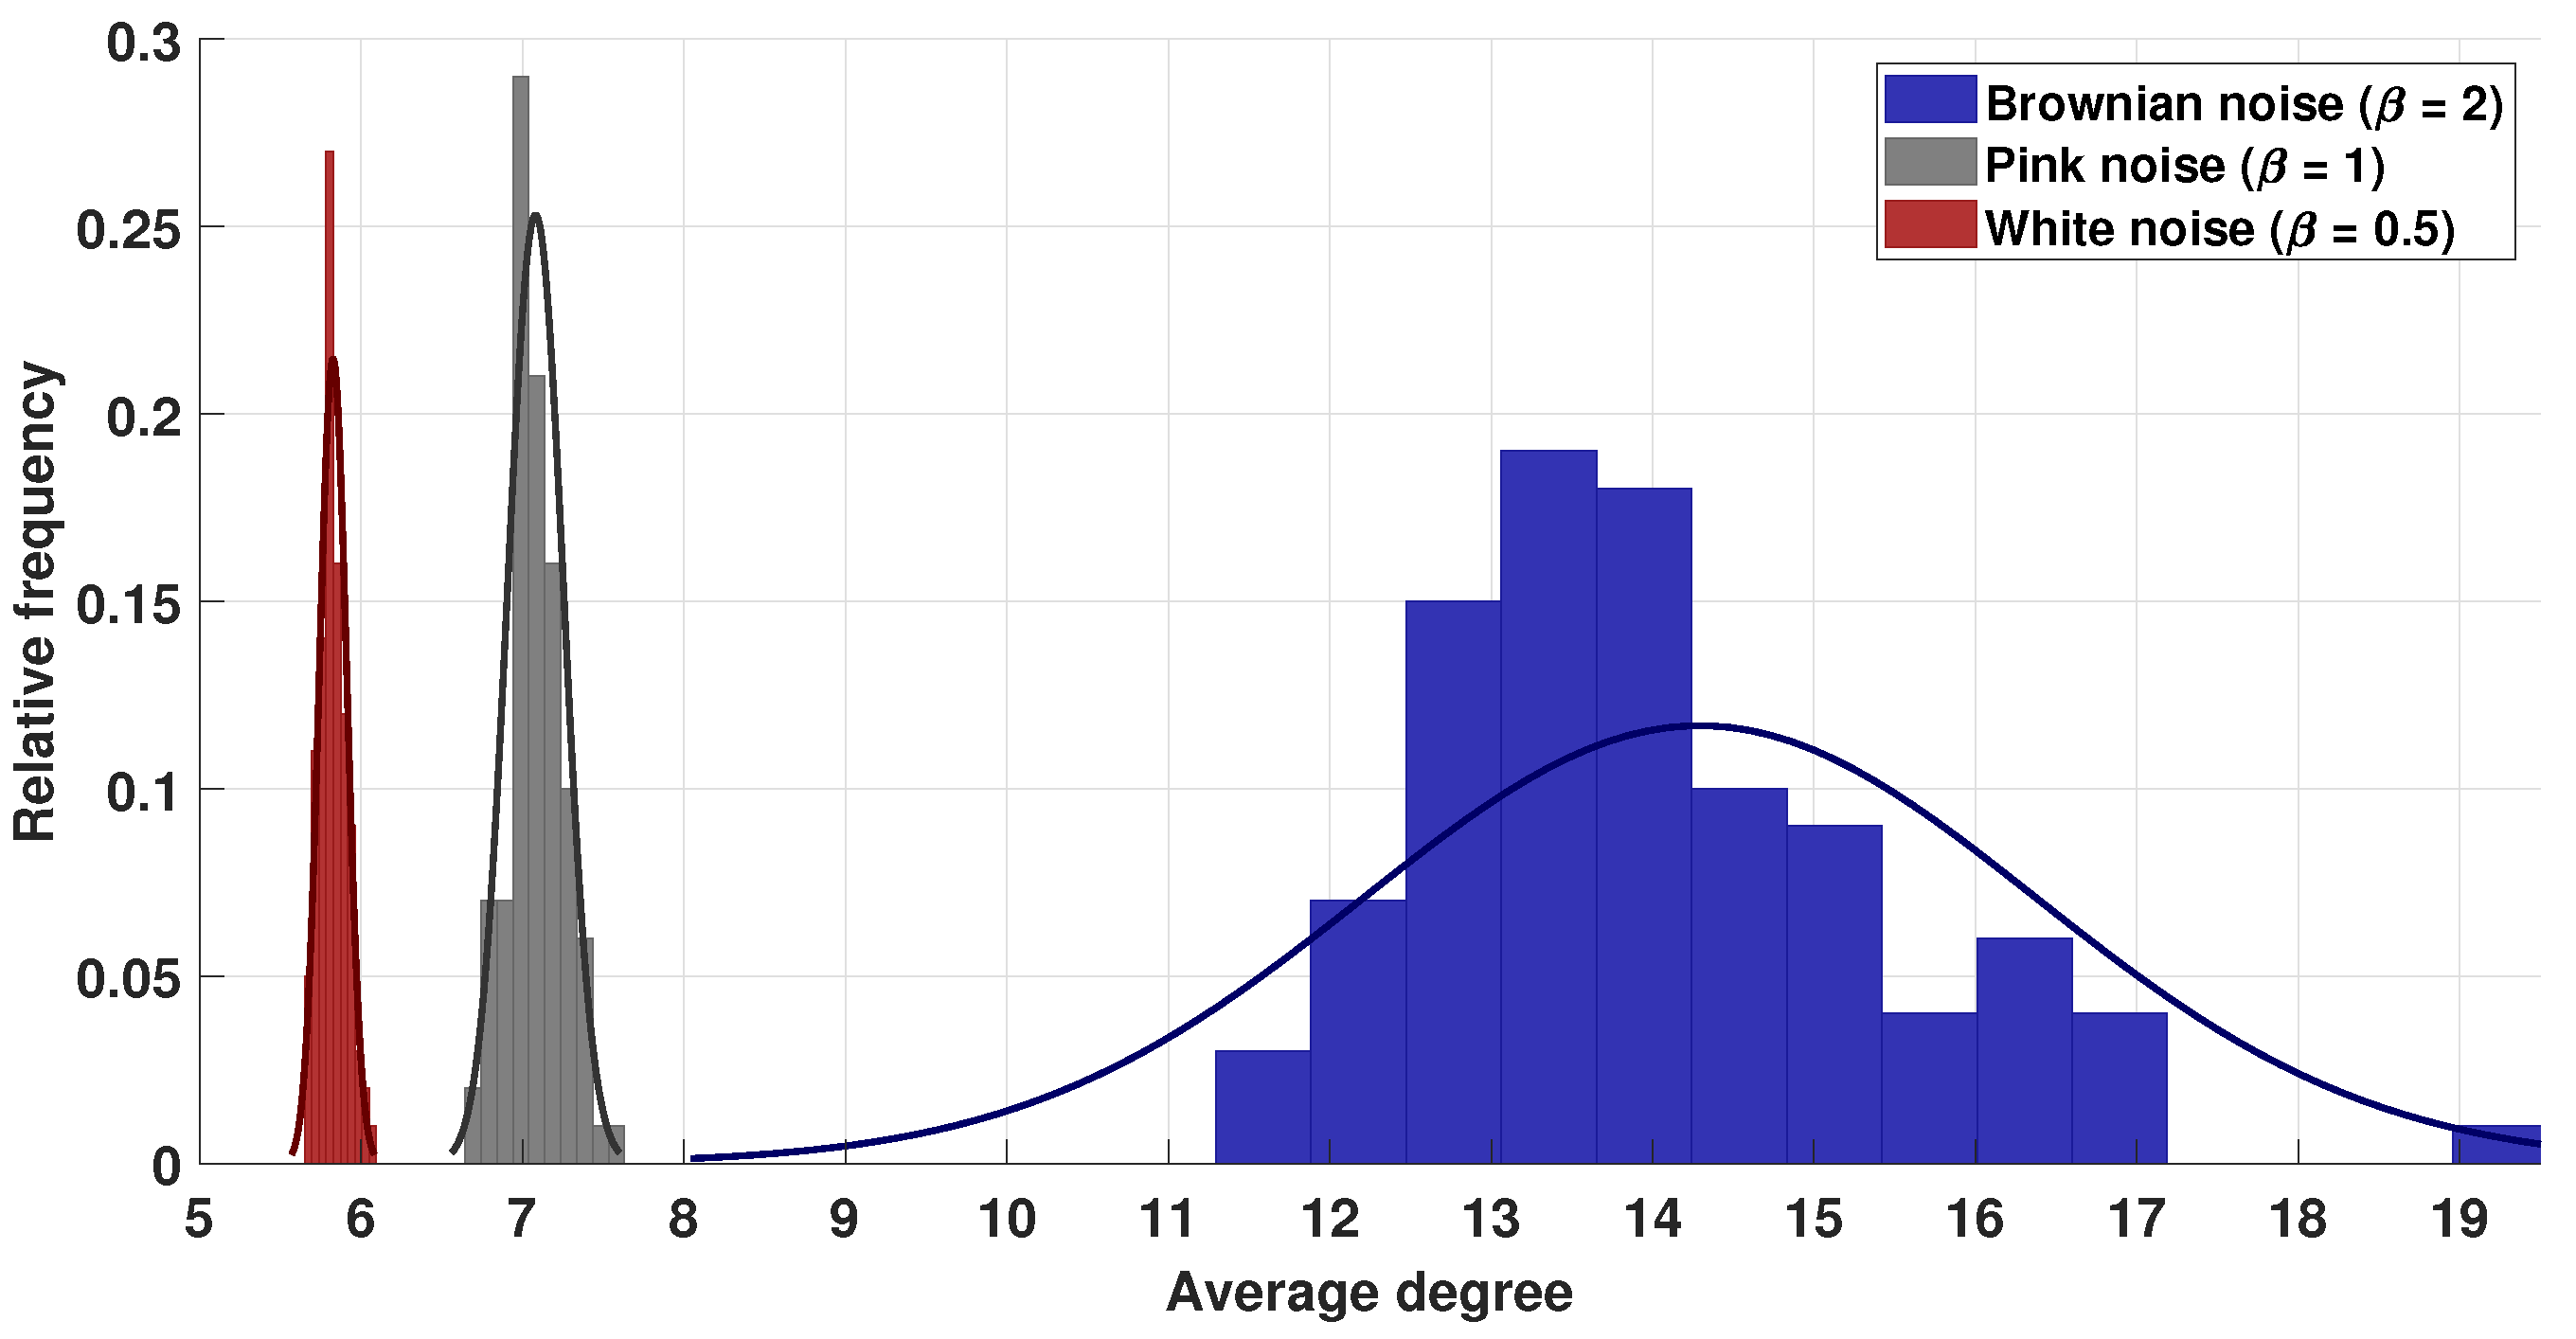
3.1. Visibility Parameters from White, Pink, and Brownian Noise
- White noise has more dispersion between nodes, providing a lower average degree in the network and a greater average path length.
- With Brownian noise, the nodes form many large clusters with high connectivity, leading to a greater average degree and a lower average path length.
- For pink noise, the average path length and average degree values were between those obtained for white and Brownian noise.
3.2. Analysis of Physionet Database
3.3. Heartbeat Time Series of Exercising Subjects
- Series recorded of young subjects and middle aged adults at rest did not show significant differences ().
- Series of young subjects at rest comparing with those during exercise showed significant differences ().
- Series of middle-aged adults at rest comparing with those recorded while exercising showed significant differences ().
- Series of young subjects and middle-aged adults during exercise showed significant difference ().
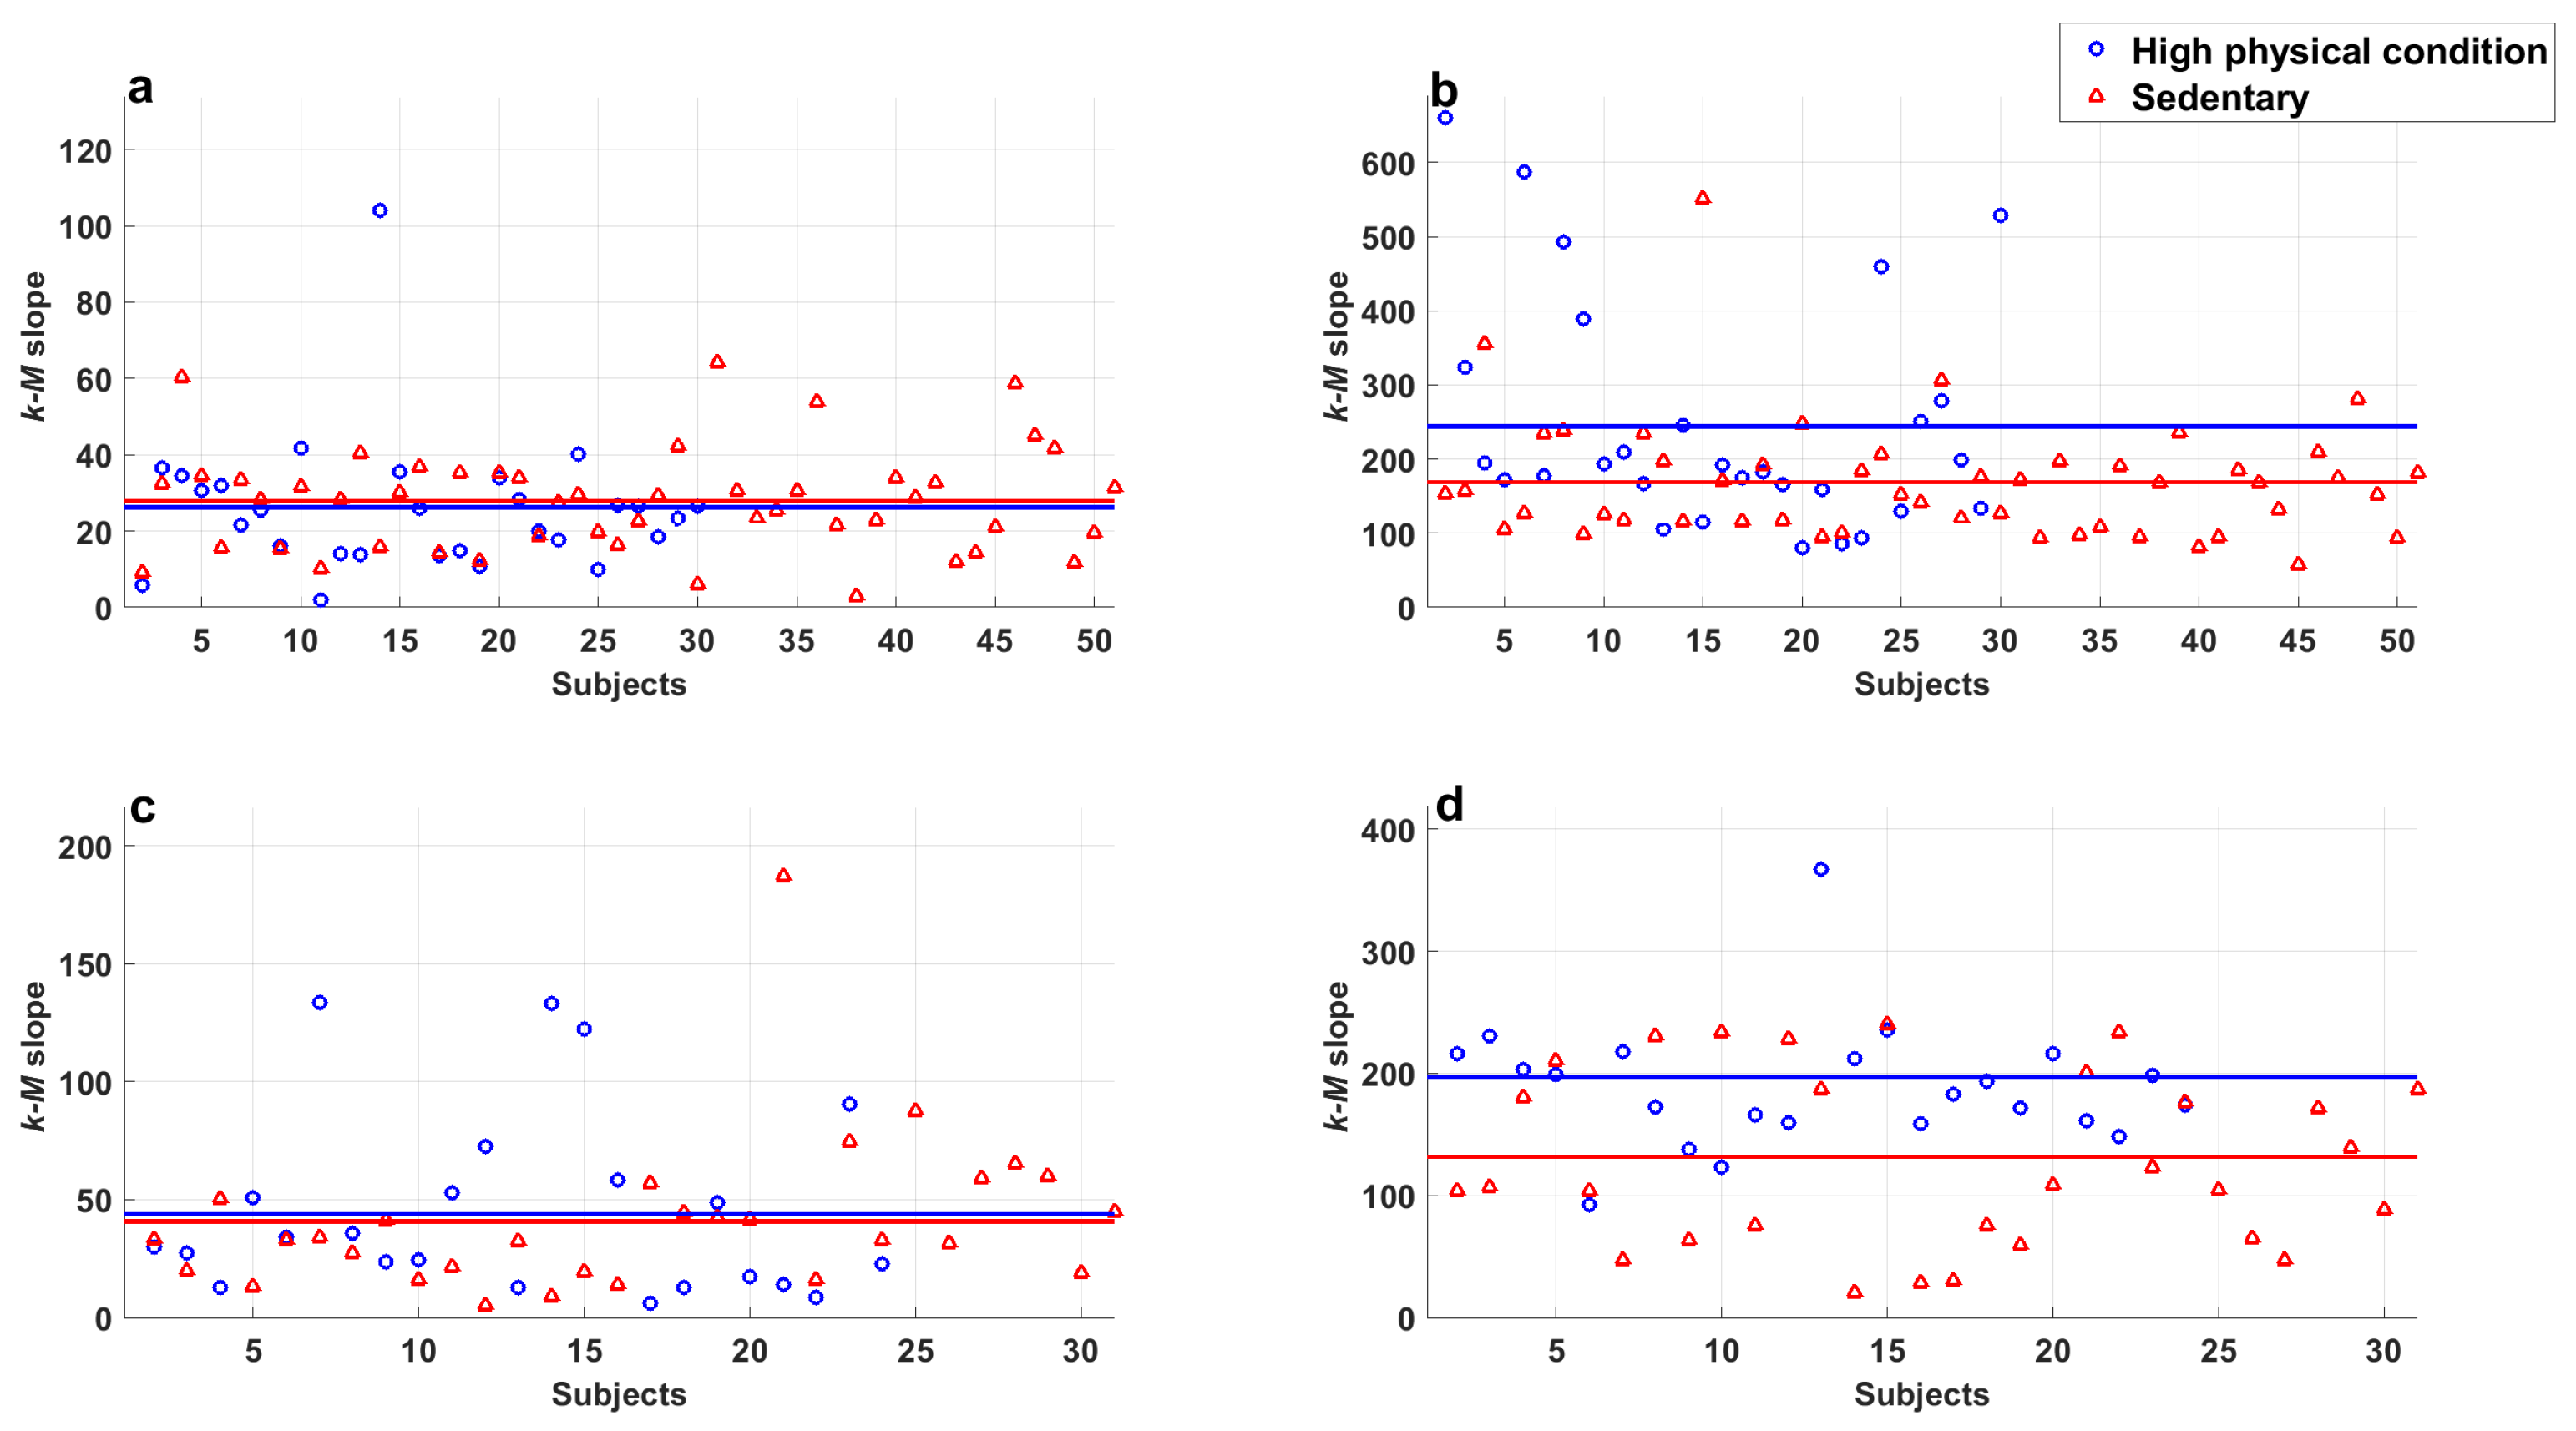
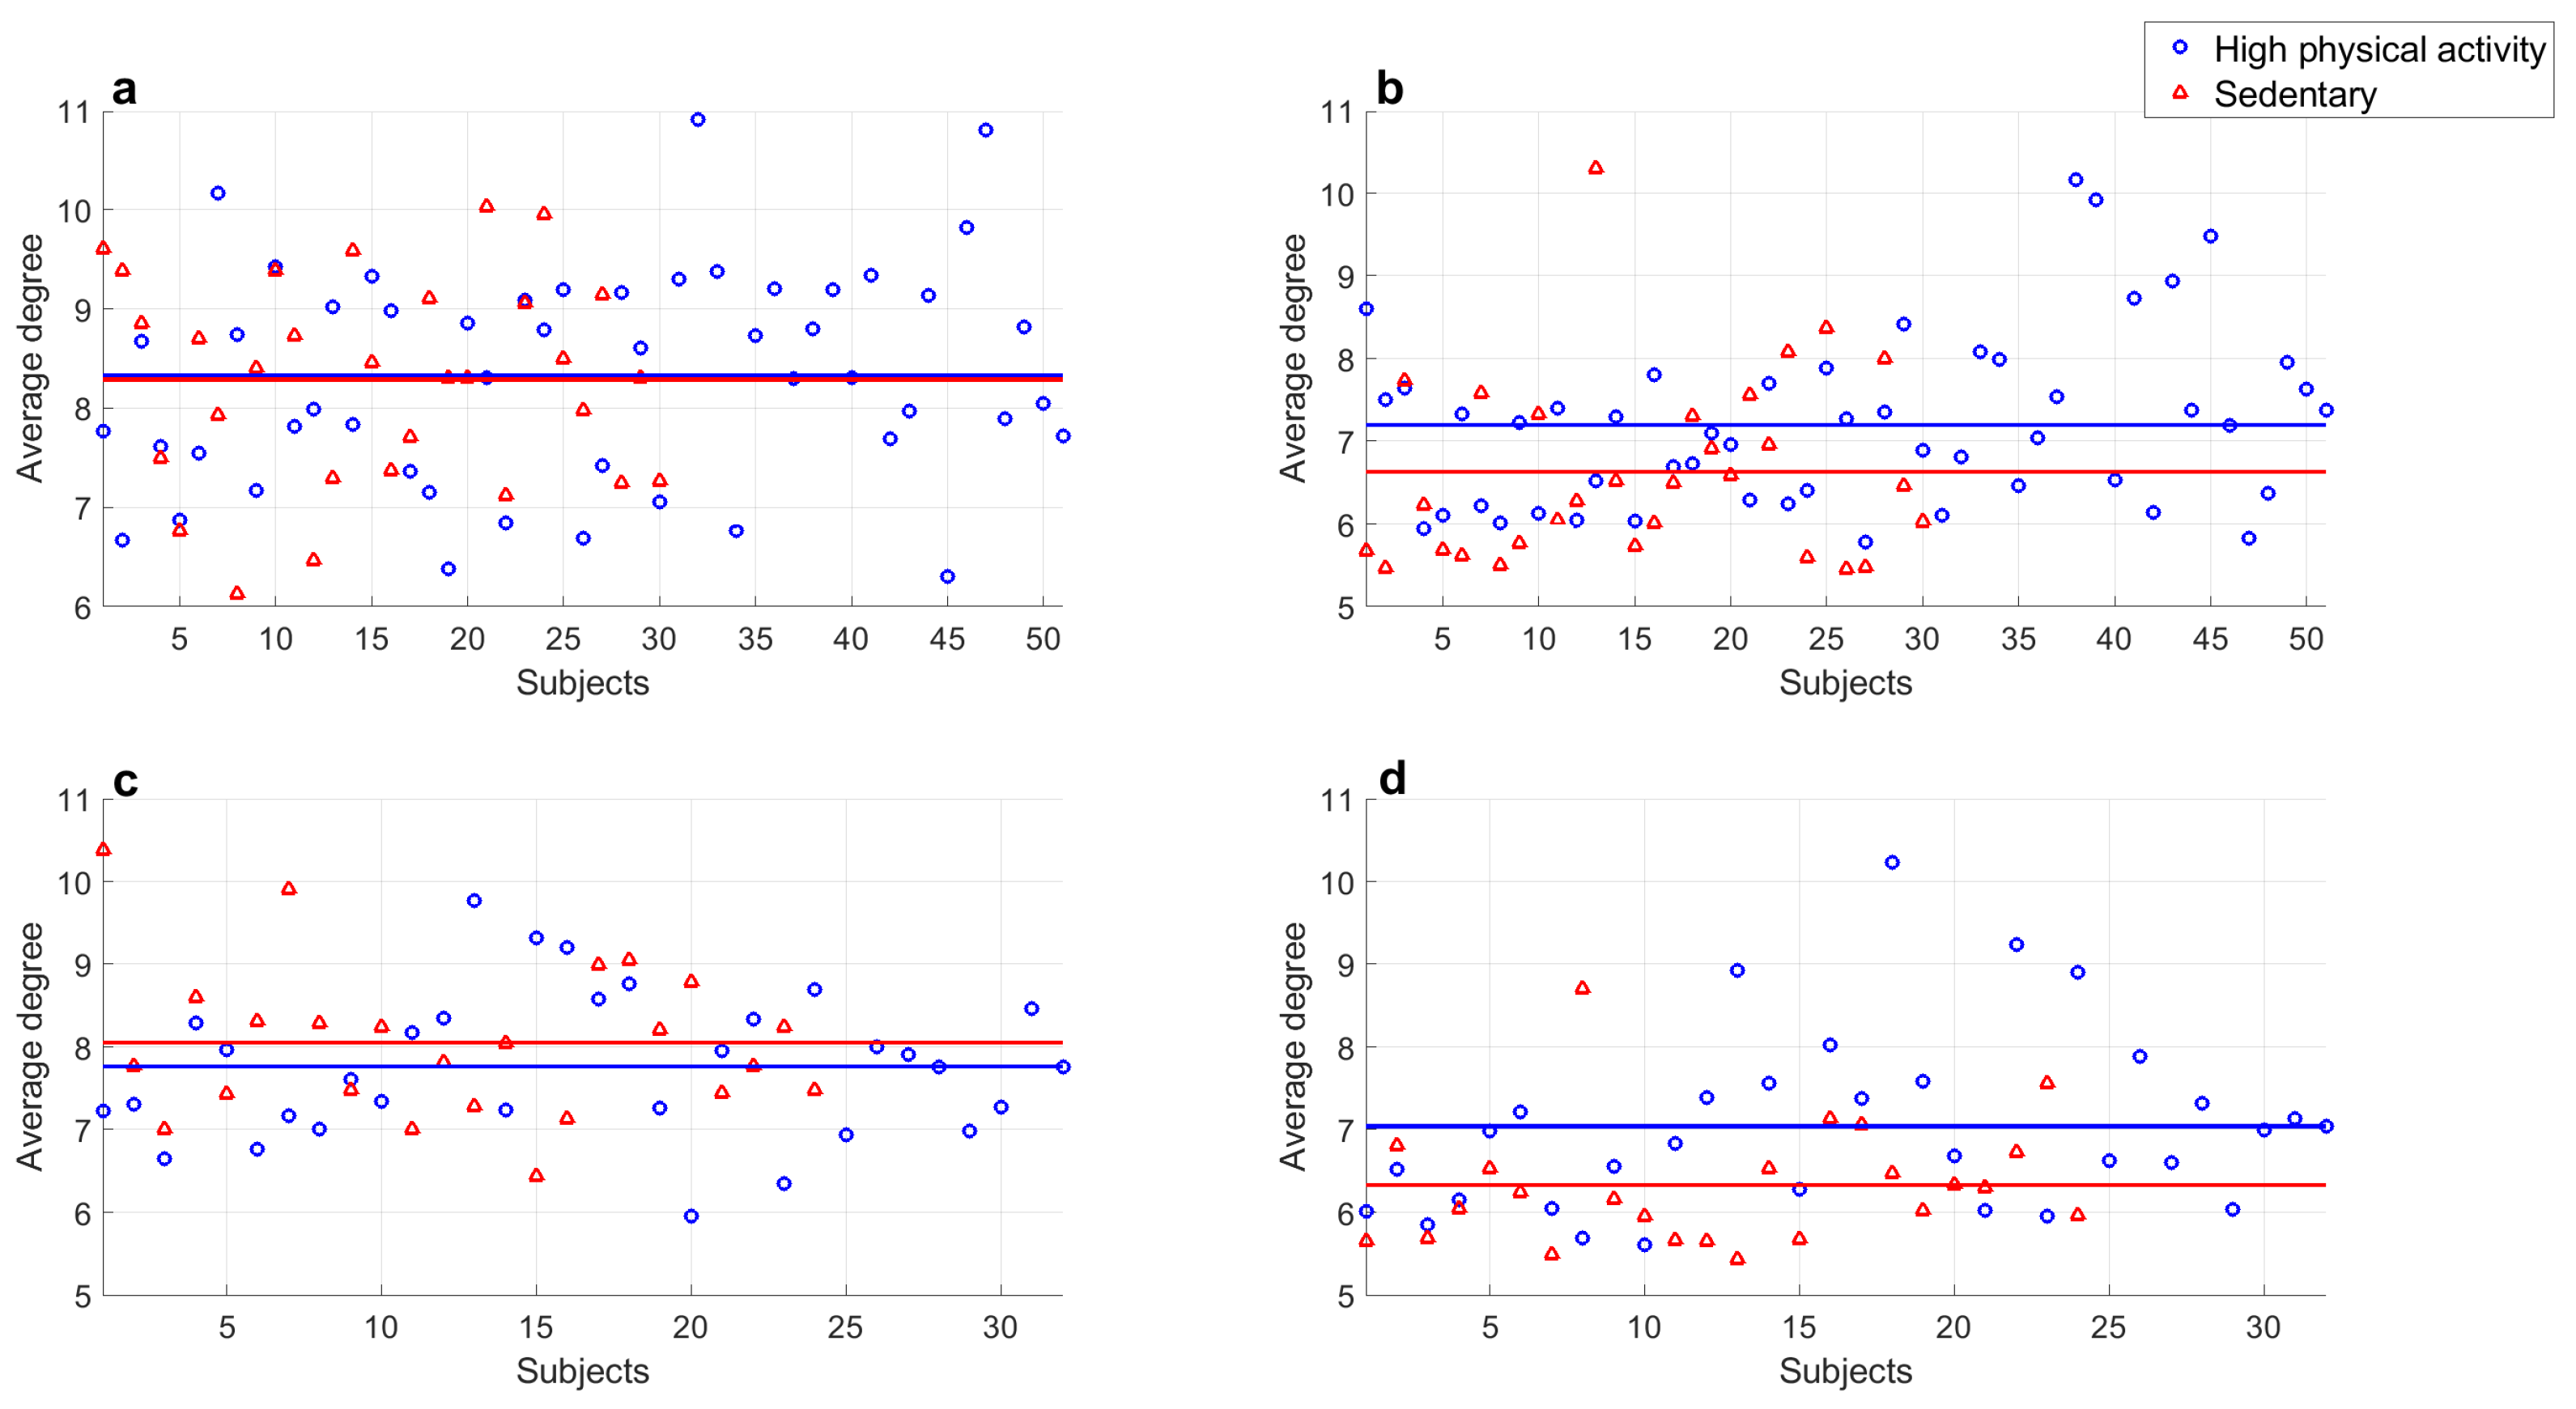
- There were no significant differences between series of subjects with high physical activity levels and sedentary subjects in both populations at rest ( in all cases).
- There were significant differences found between series of subjects with high physical activity levels and sedentary subjects in both populations at rest and those recorded during exercise ( in all cases).
- A significant difference was found in series recorded during exercise of young subjects with high physical activity levels and sedentary subjects ().
- A significant difference was found in series recorded during exercise of middle-aged adults with high physical activity levels and sedentary subjects ().
- Series of young subjects who exercise regularly and sedentary middle-aged adults during exercise did not show a significant difference ().
- Average degree values of series recorded of subjects of both groups at rest showed significant differences ().
- Average degree values of young subjects’ series at rest compared with those during exercise showed significant differences ().
- Average degree values of middle-aged adults’ series at rest compared with those recorded while exercising also showed significant differences ().
- Series of young subjects and middle aged adults during exercise did not show a significant difference ().
- Series of young subjects with high physical activity levels and sedentary subjects at rest did not show a significant difference ().
- Series of middle-aged adults with high physical activity levels and sedentary subjects at rest did not show a significant difference ().
- Significant differences were found between the average degree values of series of subjects with high physical activity levels and sedentary subjects from both populations at rest and those recorded during exercise ( in all cases).
- A significant difference was found in exercise series of young subjects with high and low physical activity levels ().
- A significant difference was found in exercise series of middle-aged subjects with high and low physical activity levels ().
- Series of young subjects and middle-aged adults classified with high physical activity levels while exercising did not show a significant difference ().
- Series of sedentary young subjects and middle-aged adults in exercise period did not show a significant difference ().
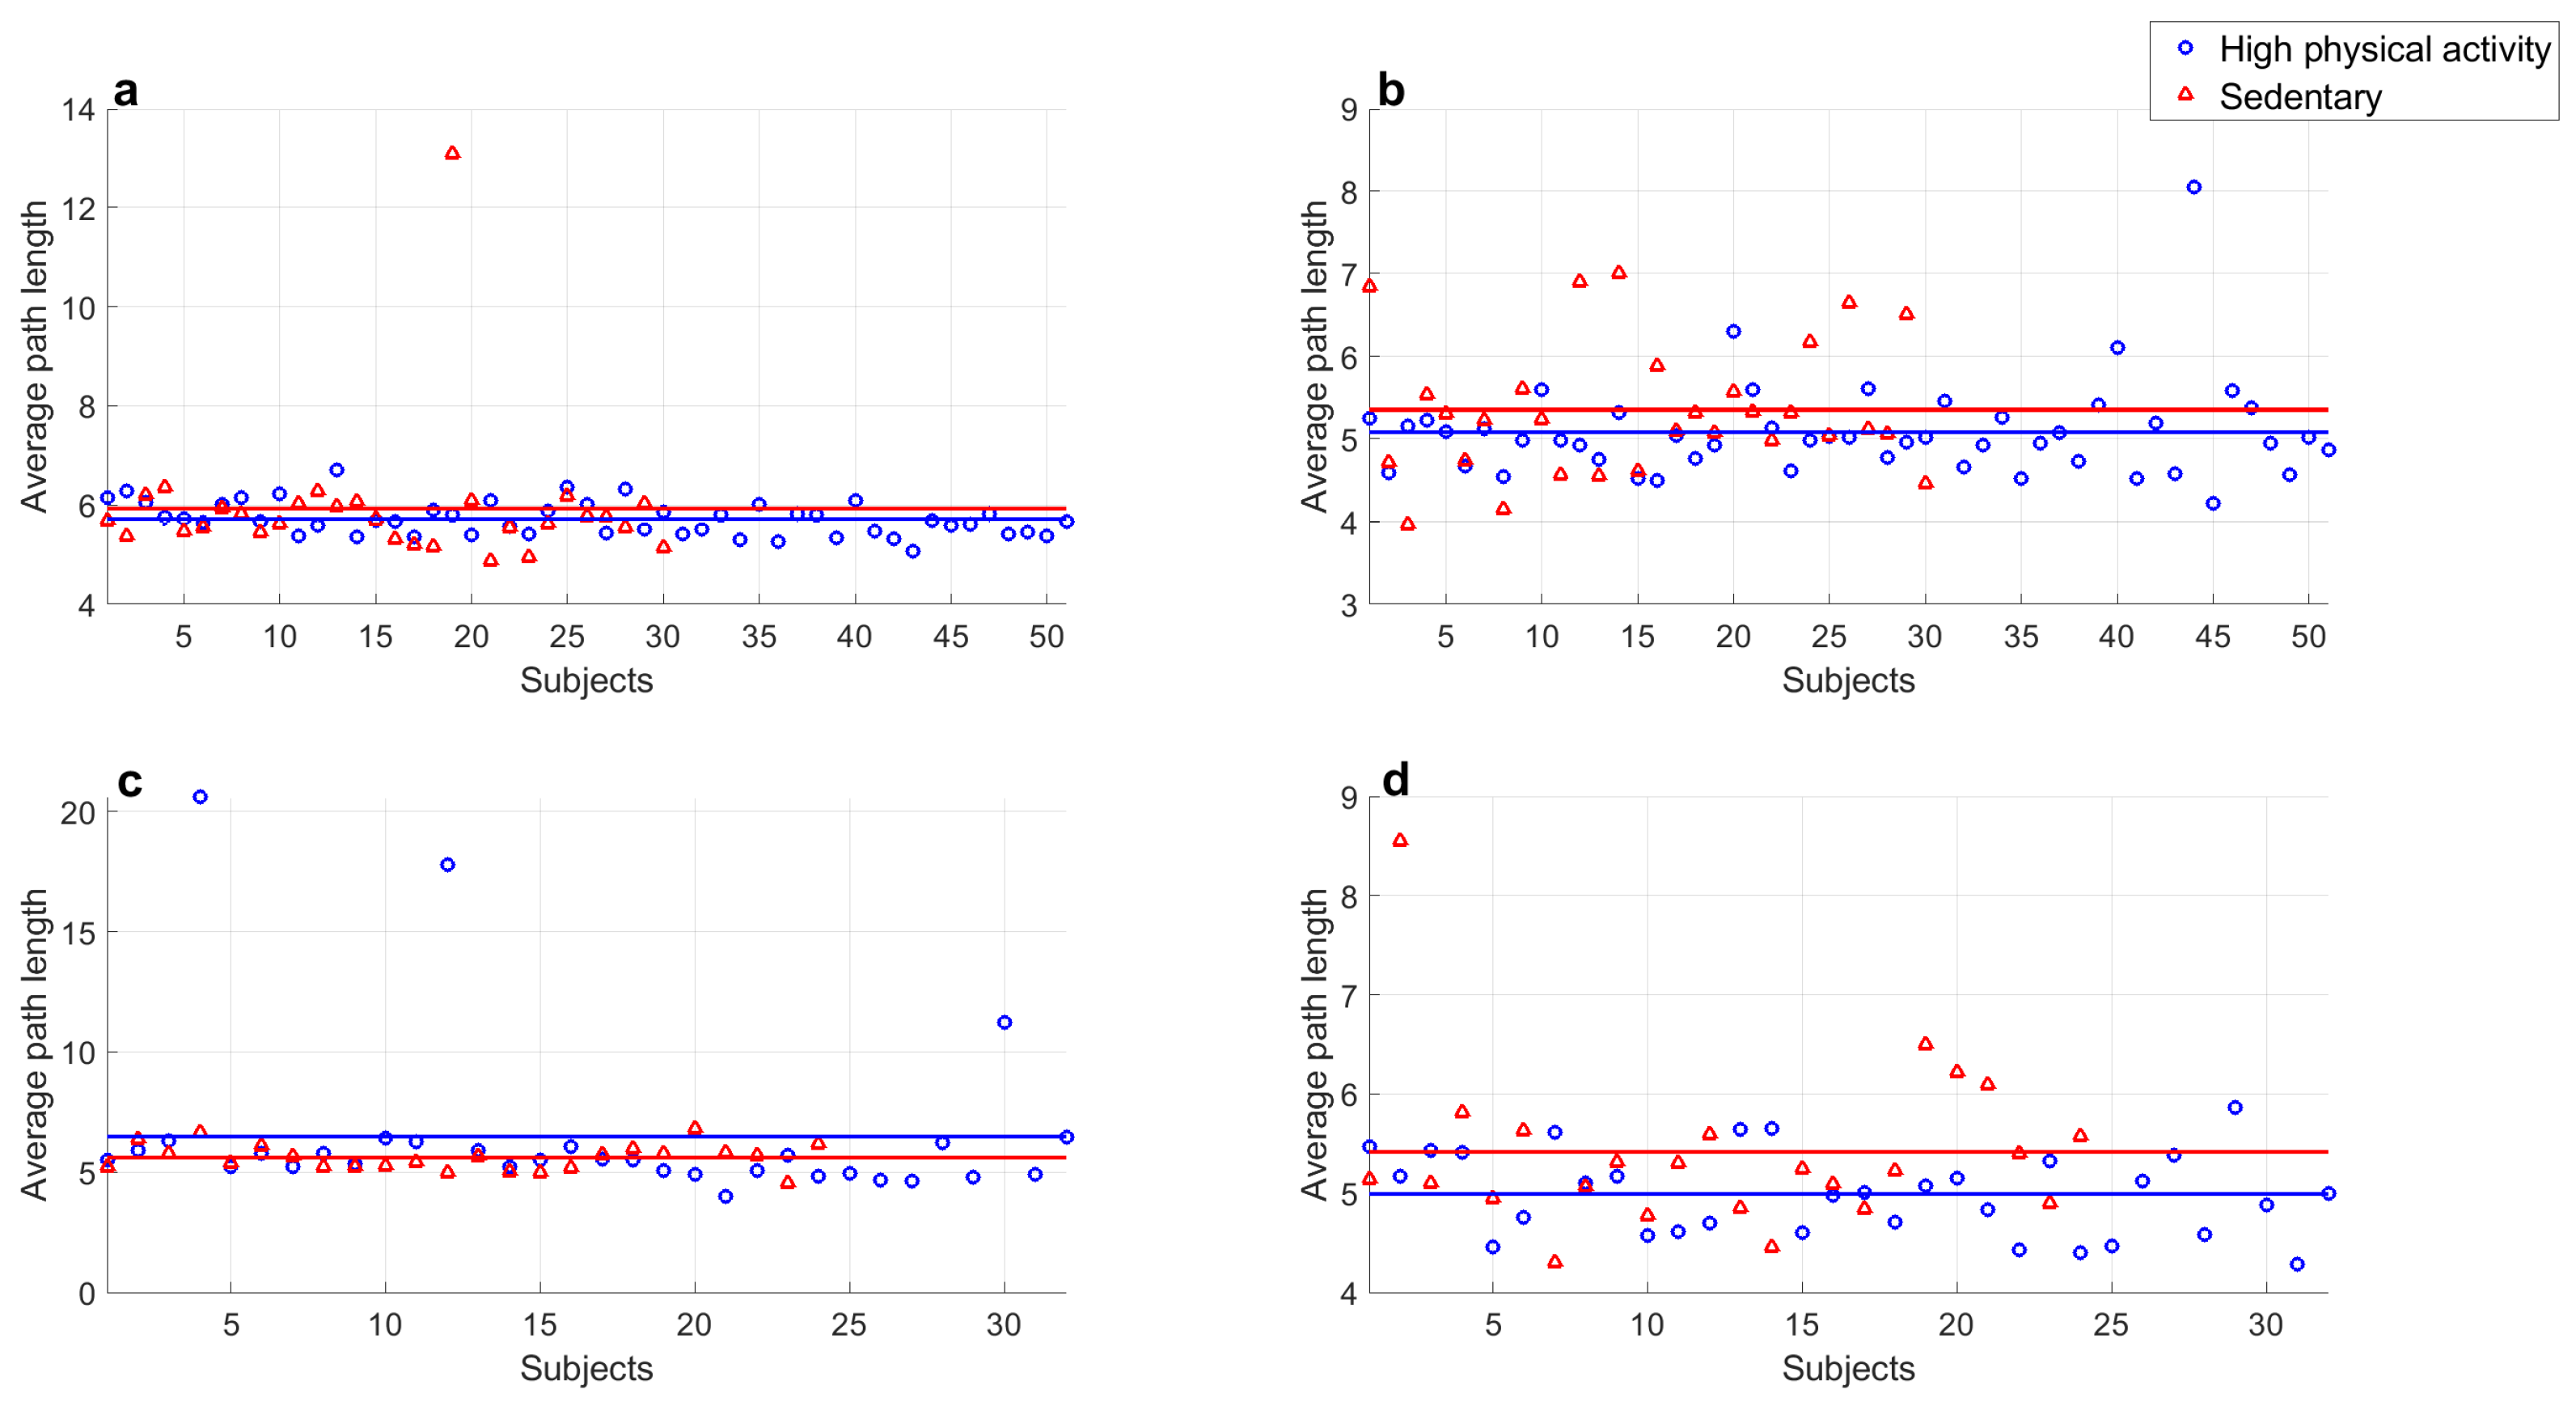
- Average path length values of series of both groups at rest did not show significant differences ().
- Average path length values of series during rest period and exercise of both groups showed significant differences ( in all cases).
- Average path length values of series of both groups recorded during exercise did not show significant differences ().
- Average path length values of middle-aged adults with high physical activity levels at rest and during exercise showed a significant difference ().
- Average path length values of young subjects with high physical activity levels at rest and during exercise showed a significant difference ().
4. Discussion
5. Conclusions
Author Contributions
Funding
Institutional Review Board Statement
Data Availability Statement
Acknowledgments
Conflicts of Interest
Abbreviations
| ANOVA | Analysis of Variance |
| CHF | Congestive heart failure |
| DFA | Detrended fluctuation analysis |
| ECG | Electrocardiogram |
| GHVE | Grouped horizontal visibility entropy |
| GIC | Graphical index complexity |
| HRV | Heart rate variability |
| HVE | Horizontal visibility entropy |
| IPAQ | International Physical Activity Questionnaire |
| LSD | Least significant difference |
| NYHA | New York Heart Association |
| PSVG | Power of scale-freeness in visibility graph |
| VG | Visibility graph |
| VGA | Visibility graph algorithm |
References
- Salcedo-Martínez, A.; Zamora-Justo, J.; Pérez-López, N.; Gálvez-Coyt, G.; Muñoz-Diosdado, A. The detrended fluctuation analysis of heartbeat intervals in time series during stress tests. AIP Conf. Proc. 2019, 2090, 050013. [Google Scholar]
- Salcedo-Martínez, A.; Zamora-Justo, J.; Muñoz-Diosdado, A. Analysis of the Hurst exponent in RR series of healthy subjects and congestive patients in a state of sleep and wakefulness and in healthy subjects in physical activity. AIP Conf. Proc. 2021, 2348, 040009. [Google Scholar]
- Bhaduri, A.; Bhaduri, S.; Ghosh, D. Visibility graph analysis of heart rate time series and bio-marker of congestive heart failure. Phys. A Stat. Mech. Appl. 2017, 482, 786–795. [Google Scholar] [CrossRef]
- Aguilar-Molina, A.M.; Angulo-Brown, F.; Muñoz-Diosdado, A. Multifractal Spectrum Curvature of RR Tachograms of Healthy People and Patients with Congestive Heart Failure, a New Tool to Assess Health Conditions. Entropy 2019, 21, 581. [Google Scholar] [CrossRef]
- Zamora-Justo, J.; Gutiérrez-Calleja, R.; Muñoz-Diosdado, A. Acquisition software development for monitor Holter prototype signals and its use for pre-diagnosis of cardiac damage based on nonlinear dynamic techniques. AIP Conf. Proc. 2016, 1747, 090001. [Google Scholar] [CrossRef]
- Melo, R.C.; Quitério, R.J.; Takahashi, A.C.M.; Silva, E.; Martins, L.E.B.; Catai, A.M. High eccentric strength training reduces heart rate variability in healthy older men. Br. J. Sports Med. 2008, 42, 59–63. [Google Scholar] [CrossRef]
- Milan-Mattos, J.C.; Porta, A.; Perseguini, N.M.; Minatel, V.; Rehder-Santos, P.; Takahashi, A.C.M.; Mattiello, S.M.; Catai, A.M. Influence of age and gender on the phase and strength of the relation between heart period and systolic blood pressure spontaneous fluctuations. J. Appl. Physiol. 2018, 124, 791–804. [Google Scholar] [CrossRef] [PubMed]
- De Abreu, R.; Porta, A.; Rehder-Santos, P.; Cairo, B.; Da Silva, C.D.; De Favari Signini, E.; Sakaguchi, C.A.; Catai, A.M. Effects of inspiratory muscle-training intensity on cardiovascular control in amateur cyclists. Am. J. Physiol. Regul. Intgr. Comp. Physiol. 2019, 317, R891–R902. [Google Scholar] [CrossRef] [PubMed]
- Takahashi, A.C.M.; Porta, A.; Melo, R.C.; Quitério, R.J.; da Silva, E.; Borghi-Silva, A.; Tobaldini, E.; Montano, N.; Catai, A.M. Aging reduces complexity of heart rate variability assessed by conditional entropy and symbolic analysis. Intern. Emerg. Med. 2012, 7, 229–235. [Google Scholar] [CrossRef] [PubMed]
- La Rovere, M.T.; Porta, A.; Schwartz, P.J. Autonomic Control of the Heart and Its Clinical Impact. A Personal Perspective. Front. Physiol. 2020, 11, 582. [Google Scholar] [CrossRef]
- Guzzetti, S.; Mezzetti, S.; Magatelli, R.; Porta, A.; De Angelis, G.; Rovelli, G.; Malliani, A. Linear and non-linear 24 h heart rate variability in chronic heart failure. Auton. Neurosci. Basic Clin. 2000, 86, 114–119. [Google Scholar] [CrossRef] [PubMed]
- Ivanov, P.C.; Amaral, L.A.N.; Goldberger, A.L.; Havlin, S.; Rosenblum, M.G.; Stanley, H.E.; Struzik, Z.R. From 1/f noise to multifractal cascades in heartbeat dynamics. Chaos 2001, 11, 641–652. [Google Scholar] [CrossRef] [PubMed]
- Solís-Montufar, E.; Gálvez-Coyt, G.; Muñoz-Diosdado, A. Entropy Analysis of RR-Time Series From Stress Tests. Front. Physiol. 2020, 11, 981. [Google Scholar] [CrossRef]
- Catai, A.M.; Takahashi, A.C.M.; Perseguini, N.M.; Milan, J.C.; Minatel, V.; Rehder-Santos, P.; Marchi, A.; Bari, V.; Porta, A. Effect of the postural challenge on the dependence of the cardiovascular control complexity on age. Entropy 2014, 16, 6686–6704. [Google Scholar] [CrossRef]
- Shi, B.; Zhang, Y.; Yuan, C.; Wang, S.; Li, P. Entropy Analysis of Short-Term Heartbeat Interval Time Series during Regular Walking. Entropy 2017, 19, 568. [Google Scholar] [CrossRef]
- Porta, A.; Tobaldini, E.; Guzzetti, S.; Furlan, R.; Montano, N.; Gnecchi-Ruscone, T. Assessment of cardiac autonomic modulation during graded head-up tilt by symbolic analysis of heart rate variability. Am. J. Physiol. Heart Circ. Physiol. 2007, 293, H702–H708. [Google Scholar] [CrossRef] [PubMed]
- Albert, B.; Barabási, A.R. Statistical mechanics of complex networks. Rev. Mod. Phys. 2002, 74, 47. [Google Scholar] [CrossRef]
- Newman, M.E.J. Networks: An introduction; Oxford University Press: Oxford, UK, 2010. [Google Scholar]
- Telesca, L.; Lovallo, M.; Ramírez-Rojas, A.; Flores-Marquez, L. Relationship between the Frequency Magnitude Distribution and the Visibility Graph in the Synthetic Seismicity Generated by a Simple Stick-Slip System with Asperities. PLoS ONE 2014, 9, e106233. [Google Scholar] [CrossRef] [PubMed]
- Aguilar-SanJuan, B.; Guzmán-Vargas, L. Earthquake magnitude time series: Scaling behavior of visibility networks. Eur. Phys. J. B 2013, 86, 454. [Google Scholar] [CrossRef]
- Zhang, J.; Small, M. Complex network from pseudoperiodic time series: Topology versus dynamics. Phys. Rev. Lett. 2006, 96, 238701. [Google Scholar] [CrossRef]
- Xu, X.; Zhang, J.; Small, M. Superfamily phenomena and motifs of networks induced from time series. Proc. Natl. Acad. Sci. USA 2008, 105, 19601–19605. [Google Scholar] [CrossRef] [PubMed]
- Gao, Z.K.; Jin, N.D.; Wang, W.X.; Lai, Y.C. Motif distributions in phase space networks for characterizing experimental two-phase flow patterns with chaotic features. Phys. Rev. E 2010, 82, 016210. [Google Scholar] [CrossRef]
- Gao, Z.K.; Zhang, X.W.; Jin, N.D.; Donner, R.V.; Marwan, N.; Kurths, J. Recurrence networks from multivariate signals for uncovering dynamic transitions of horizontal oil-water stratified flows. Europhys. Lett. 2013, 103, 50004. [Google Scholar] [CrossRef]
- Lacasa, L.; Luque, B.; Ballesteros, F.; Luque, J.; Nuno, J.C. From time series to complex networks: The visibility graph. Proc. Natl. Acad. Sci. USA 2008, 105, 4972–4975. [Google Scholar] [CrossRef]
- Quian, M.C.; Jiang, Z.Q.; Zhou, W.X. Universal and nonuniversal allometric scaling behaviors in the visibility graphs of world stock market indices. J. Phys. A Math. Theor. 2010, 43, 335002. [Google Scholar] [CrossRef]
- Wang, N.; Li, D.; Wang, Q. Visibility graph analysis on quarterly macroeconomic series of China based on complex network theory. Phys. A Stat. Mech. Appl. 2012, 391, 6543–6555. [Google Scholar] [CrossRef]
- Long, Y. Visibility graph network analysis of gold price time series. Phys. A Stat. Mech. Appl. 2013, 392, 3374–3384. [Google Scholar] [CrossRef]
- Zhang, R.; Ashuri, Y.S.B.; Deng, Y. Forecasting construction cost index based on visibility graph: A network approach. Phys. A Stat. Mech. Appl. 2018, 493, 239–252. [Google Scholar] [CrossRef]
- Ni, X.; Jiang, Z.Q.; Zhou, W.X. Degree distributions of the visibility graphs mapped from fractional Brownian motions and multifractal random walks. Phys. Lett. A 2009, 373, 3822–3826. [Google Scholar] [CrossRef]
- Elsner, J.B.; Jagger, T.H.; Fogarty, E.A. Visibility network of United States hurricanes. Geophys. Res. Lett. 2009, 36, L16702. [Google Scholar] [CrossRef]
- Chen, S.; Hu, Y.; Mahadevan, S.; Deng, Y. A visibility graph averaging aggregation operator. Phys. A Stat. Mech. Appl. 2014, 403, 1–12. [Google Scholar] [CrossRef]
- Jiang, W.; Wei, B.; Zhan, J.; Xie, C.; Zhou, D. A visibility graph power averaging aggregation operator: A methodology based on network analysis. Comput. Ind. Eng. 2016, 101, 260–268. [Google Scholar] [CrossRef]
- Zhu, G.; Li, Y.; Wen, P.P. An efficient visibility graph similarity algorithm and its application on sleep stages classification. In Proceedings of the International Conference on Brain Informatics, Macau, China, 4–7 December 2012; Springer: Berlin/Heidelberg, Germany, 2012; pp. 185–195. [Google Scholar]
- Nilanjana, P.; Anirban, B.; Susmita, B.; Dipak, G. Noninvasive alarm generation for sudden cardiac arrest: A pilot study with visibility graph technique. Transl. Biomed. 2016, 7, 79. [Google Scholar]
- Yu, M.; Hillebrand, A.; Gouw, A.A.; Stam, C.J. Horizontal visibility graph transfer entropy (HVG-TE): A novel metric to characterize directed connectivity in large-scale brain networks. NeuroImage 2017, 156, 249–264. [Google Scholar] [CrossRef] [PubMed]
- Bhaduri, A.; Ghosh, D. Quantitative Assessment of Heart Rate Dynamics during Meditation: An ECG Based Study with Multi-Fractality and Visibility Graph. Front. Physiol. 2016, 7, 44. [Google Scholar] [CrossRef] [PubMed]
- Telesca, L.; Lovallo, M. Analysis of seismic sequences by using the method of visibility graph. Europhys. Lett. 2012, 97, 50002. [Google Scholar] [CrossRef]
- Telesca, L.; Lovallo, M.; Ramírez-Rojas, A.; Flores-Marquez, L. Investigating the time dynamics of seismicity by using the visibility graph approach: Application to seismicity of Mexican subduction zone. Phys. A Stat. Mech. Appl. 2013, 392, 6571–6577. [Google Scholar] [CrossRef]
- Telesca, L.; Lovallo, M.; Toth, L. Visibility graph analysis of 2002–2011 Pannonian seismicity. Phys. A Stat. Mech. Appl. 2014, 416, 219–224. [Google Scholar] [CrossRef]
- Khoshnevis, N.; Taborda, R.; Azizzadeh-Roodpish, S.; Telesca, L. Analysis of the 2005–2016 Earthquake Sequence in Northern Iran Using the Visibility Graph Method. Pure Appl. Geophys. 2017, 174, 4003–4019. [Google Scholar] [CrossRef]
- Azizzadeh-Roodpish, S.; Cramer, C.H. Visibility Graph Analysis of Alaska Crustal and Aleutian Subduction Zone Seismicity: An Investigation of the Correlation between b Value and k–M Slope. Pure Appl. Geophys. 2018, 175, 4241–4252. [Google Scholar] [CrossRef]
- Perez-Oregon, J.; Muñoz-Diosdado, A.; Rudolf-Navarro, A.H.; Angulo-Brown, F. Some Common Features Between a Spring-Block Self-Organized Critical Model, Stick–Slip Experiments with Sandpapers and Actual Seismicity. Pure Appl. Geophys. 2019, 177, 889–903. [Google Scholar] [CrossRef]
- Donner, R.V.; Donges, J.F. Visibility graph analysis of geophysical time series: Potentials and possible pitfalls. Acta Geophys. 2011, 60, 589–623. [Google Scholar] [CrossRef]
- Campanharo, A.S.L.O.; Sirer, M.I.; Malmgren, R.D.; Ramos, F.M.; Amaral, L.A.N. Duality between time series and networks. PLoS ONE 2011, 6, e23378. [Google Scholar] [CrossRef] [PubMed]
- Bak, P.; Christensen, K.; Danon, L.; Scanlon, T. Unified Scaling Law for Earthquakes. Phys. Rev. Lett. 2002, 88, 178501. [Google Scholar] [CrossRef] [PubMed]
- Davidsen, J.; Goltz, C. Are seismic waiting time distributions universal? Geophys. Res. Lett. 2004, 31, 5. [Google Scholar] [CrossRef]
- Azizzadeh-Roodpish, S.; Khoshnevis, N.; Cramer, C.H. Visibility graph analysis of southern California. In Proceedings of the Annual Meeting of the Seismological Society of America, Denver, CO, USA, 18–20 April 2017; Volume 10. [Google Scholar]
- Iyengar, N.; Peng, C.K.; Morin, R.; Goldberger, A.L.; Lipsitz, L.A. Age-related alterations in the fractal scaling of cardiac interbeat interval dynamics. Am. J. Physiol. Regul. Integr. Comp. Physiol. 1996, 271, R1078–R1084. [Google Scholar] [CrossRef]
- Ivanov, P.C.; Amaral, L.A.N.; Goldberger, A.L.; Havlin, S.; Rosemblum, M.G.; Struzik, Z.R.; Stanley, H.E. Multifractality in human heartbeat dynamics. Nature 1999, 399, 461–465. [Google Scholar] [CrossRef]
- Bernaola-Galván, P.A.; Gómez-Extremera, M.; Romance, A.R.; Carpena, P. Correlations in magnitude series to assess nonlinearities: Application to multifractal models and heartbeat fluctuations. Phys. Rev. E 2017, 96, 032218. [Google Scholar] [CrossRef]
- Gómez-Extremera, M.; Bernaola-Galván, P.A.; Vargas, S.; Benítez-Porres, J.; Carpena, P.; Romance, A.R. Differences in nonlinear heart dynamics during rest and exercise and for different training. Physiol. Meas. 2018, 39, 084008. [Google Scholar] [CrossRef]
- Faes, L.; Gómez-Extremera, M.; Pernice, R.; Carpena, P.; Nollo, G.; Porta, A.; Bernaola-Galván, P. Comparison of methods for the assessment of nonlinearity in short-term heart rate variability under different physiopathological states. Chaos 2019, 29, 123114. [Google Scholar] [CrossRef]
- Tsuji, H.; Venditti, F., Jr.; Manders, E.; Evans, J.; Larson, M.; Feldman, C.; Levy, D. Reduced heart rate variability and mortality risk in an elderly cohort. The Framingham Heart Study. Circulation 1994, 90, 878–883. [Google Scholar] [CrossRef] [PubMed]
- Dietrich, F.D.; Schindler, C.; Schwartz, J.; Barthelemy, J.C.; Tschopp, J.M.; Roche, F.; von Eckardstein, A.; Brändli, O.; Leuenberger, P.; Gold, D.R.; et al. Heart rate variability in an ageing population and its association with lifestyle and cardiovascular risk factors: Results of the sapaldia study. Europace 2006, 8, 521–529. [Google Scholar] [CrossRef] [PubMed]
- Ziegler, D.; Zentai, C.P.; Perz, S.; Rathmann, W.; Haastert, B.; Döring, A.; Meisinger, C. Prediction of mortality using measures of cardiac autonomic dysfunction in the diabetic and nondiabetic population: The monica/kora augsburg cohort study. Diabetes Care 2008, 31, 556–561. [Google Scholar] [CrossRef]
- Drawz, P.; Babineau, D.; Brecklin, C.; He, J.; Kallem, R.R.; Soliman, E.Z.; Xie, D.; Appleby, D.; Anderson, A.H.; Rahman, M.; et al. Heart rate variability is a predictor of mortality in chronic kidney disease: A report from the cric study. Am. J. Nephrol. 2013, 38, 517–528. [Google Scholar] [CrossRef]
- Sugihara, G.; Allan, W.; Sobel, D.; Allan, K.D. Nonlinear control of heart rate variability in human infants. Proc. Natl. Acad. Sci. USA 1996, 93, 2608–2613. [Google Scholar] [CrossRef] [PubMed]
- Voss, B.A.; Schulz, S.; Schroeder, R.; Baumert, M.; Caminal, P. Methods derived from nonlinear dynamics for analyzing heart rate variability. Phil. Trans. R. Soc. A 2009, 367, 277–296. [Google Scholar] [CrossRef]
- Guzmán-Vargas, L.; Muñoz-Diosdado, A.; Angulo-Brown, F. Influence of the loss of time-constants repertoire in pathologic heartbeat dynamics. Phys. A Stat. Mech. Appl. 2005, 348, 304–316. [Google Scholar] [CrossRef]
- Peng, C.K.; Havlin, S.; Stanley, H.E.; Goldberger, A.L. Quantification of scaling exponents and crossover phenomena in nonstationary heartbeat time series. Chaos 1995, 5, 82–87. [Google Scholar] [CrossRef]
- Hu, K.; Ivanov, P.C.; Chen, Z.; Carpena, P.; Stanley, H.E. Effect of trends on detrended fluctuation analysis. Phys. Rev. E 2001, 64, 011114/1–011114/19. [Google Scholar] [CrossRef]
- Muñoz-Diosdado, A.; Vargas, L.G.; Rojas, A.R.; Río-Correa, J.L.D.; Brown, F.A. Some cases of crossover behavior in heart interbeat and electroseismic series. Fractals 2005, 13, 253–263. [Google Scholar] [CrossRef]
- Higuchi, T. Approach to an irregular time series on the basis of the fractal theory. Phys. D Nonlinear Phenom. 1988, 31, 277–283. [Google Scholar] [CrossRef]
- Eke, A.; Herman, P.; Kocsis, L.; Kozak, L.R. Fractal characterization of complexity in temporal physiological signals (Review). Physiol. Meas. 2002, 23, R1–R38. [Google Scholar] [CrossRef] [PubMed]
- Goldberger, A.L.; Amaral, L.A.N.; Hausdorff, J.M.; Ivanov, P.C.; Peng, C.K.; Stanley, H.E. Fractal dynamics in physiology: Alterations with disease and aging. Proc. Natl. Acad. Sci. USA 2002, 99, 2466–2472. [Google Scholar] [CrossRef] [PubMed]
- Tulppo, M.; Makikallio, T.; Takala, T.; Seppanen, T.; Huikuri, H. Quantitative beat-to-beat analysis of heart rate dynamics during exercise. Am. J. Physiol. Heart Circ. Physiol. 1996, 271, H244–H252. [Google Scholar] [CrossRef] [PubMed]
- Karasik, R.; Sapir, N.; Ashkenazy, Y.; Ivanov, P.C.; Dvir, I.; Lavie, P.; Havlin, S. Correlation differences in heartbeat fluctuations during rest and exercise. Phys. Rev. E 2002, 66, 062902. [Google Scholar] [CrossRef]
- Aubert, A.E.; Seps, B.; Beckers, F. Heart rate variability in athletes. Sports Med. 2003, 33, 889–919. [Google Scholar] [CrossRef]
- Leicht, A.S.; Sinclair, W.H.; Spinks, W.L. Effect of exercise mode on heart rate variability during steady state exercise. Eur. J. Appl. Physiol. 2008, 102, 195–204. [Google Scholar] [CrossRef]
- Goya-Esteban, R.; Barquero-Perez, O.; Sarabia-Cachadina, E.; de la Cruz-Torres, B.; Naranjo-Orellana, J.; Rojo-Alvarez, J.L. A modified Hilbert-Huang algorithm to assess spectral parameters in intense exercise. In Proceedings of the Computing in Cardiology Conference (CinC), Zaragoza, Spain, 22–25 September 2013; IEEE: Krakow, Poland, 2013; pp. 409–412. [Google Scholar]
- Weippert, M.; Behrens, M.; Rieger, A.; Behrens, K. Sample entropy and traditional measures of heart rate dynamics reveal different modes of cardiovascular control during low intensity exercise. Entropy 2014, 16, 5698–5711. [Google Scholar] [CrossRef]
- Taylor, K.A.; Wiles, J.D.; Coleman, D.D.; Sharma, R.; O’Driscoll, J.M. Continuous cardiac autonomic and haemodynamic responses to isometric exercise. Med. Sci. Sports Exerc. 2017, 49, 1511–1519. [Google Scholar] [CrossRef]
- Richman, J.; Moorman, J. Physiological time-series analysis using approximate entropy and sample entropy. Am. J. Physiol. Heart Circ. Physiol. 2000, 278, H2039–H2049. [Google Scholar] [CrossRef]
- Amaral, L.; Silva, F.A.; Correia, V.B.; Andrade, C.E.F.; Dutra, B.A.; Oliveira, M.V.; de Magalhães, A.C.M.; Volpini, R.A.; Seguro, A.C.; Coimbra, T.M.; et al. Beneficial effects of previous exercise training on renal changes in streptozotocin-induced diabetic female rats. Exp. Biol. Med. 2016, 241, 437–445. [Google Scholar] [CrossRef] [PubMed]
- Jiang, S.; Bian, C.; Ning, X.; Ma, Q.D.Y. Visibility graph analysis on heartbeat dynamics of meditation training. Appl. Phys. Lett. 2013, 102, 253702. [Google Scholar] [CrossRef]
- Choudhary, G.I.; Aziz, W.; Khan, I.R.; Rahardja, S.; Fränti, P. Analysing the Dynamics of Interbeat Interval Time Series Using Grouped Horizontal Visibility Graph. IEEE Access 2019, 7, 9926–9934. [Google Scholar] [CrossRef]
- Nasrolahzadeh, M.; Mohammadpoory, Z.; Haddadnia, J. Analysis of heart rate signals during meditation using visibility graph complexity. Cogn. Neurodyn. 2019, 13, 45–52. [Google Scholar] [CrossRef] [PubMed]
- Kim, J.; Wilhelm, T. What is a complex graph? Phys. A Stat. Mech. Appl. 2008, 387, 2637–2652. [Google Scholar] [CrossRef]
- Goldberger, A.; Amaral, L.; Glass, L.; Hausdorff, J.; Ivanov, P.C.; Mark, R.; Stanley, H.E. PhysioBank, PhysioToolkit, and PhysioNet: Components of a new research resource for complex physiologic signals. Circulation 2000, 101, e215–e220. [Google Scholar] [CrossRef] [PubMed]
- Luque, B.; Lacasa, L.; Ballesteros, F.; Luque, J. Horizontal visibility graphs: Exact results for random time series. Phys. Rev. E 2009, 80, 046103. [Google Scholar] [CrossRef]
- Nuñez, A.; Lacasa, L.; Valero, E.; Gómez, J.; Luque, B. Detecting series periodicity with horizontal visibility graphs. Int. J. Bifurc. Chaos 2012, 22, 1250160. [Google Scholar] [CrossRef]
- Lacasa, L.; Nuñez, A.; Roldán, E.; Parrondo, J.M.R.; Luque, B. Time series irreversibility: A visibility graph approach. Eur. Phys. J. B 2012, 85, 217. [Google Scholar] [CrossRef]
- Pierini, J.O.; Lovallo, M.; Telesca, L. Visibility graph analysis of wind speed records measured in central Argentina. Phys. A Stat. Mech. Appl. 2012, 391, 5041–5048. [Google Scholar] [CrossRef]
- Malamud, B.D.; Turcotte, D.L. Self-Affine Time series: Generation and Analyses. Adv. Geophys. 1999, 40, 1–90. [Google Scholar]
- Mandelbrot, B.B.; Ness, J.W.V. Fractional Brownian motions, fractional noises and applications. SIAM Rev. 1968, 10, 422–437. [Google Scholar] [CrossRef]
- Gálvez-Coyt, G.; Muñoz-Diosdado, A.; Del-Río-Correa, J.L.; Angulo-Brown, F. A comparative study of validity ranges of some fractal methods. Fractals 2010, 18, 235–246. [Google Scholar] [CrossRef]
- Craig, C.; Marshall, A.; Sjöström, M.; Bauman, A.; Booth, M.; Ainsworth, B.; Pratt, M.; Ekelund, U.; Yngve, A.; Sallis, J.; et al. International physical activity questionnaire: 12-country reliability and validity. Med. Sci. Sports Exerc. 2003, 35, 1381–1395. [Google Scholar] [CrossRef]
- Cohen, M.; Taylor, J. Short-term cardiovascular oscillations in man: Measuring and modelling the physiologies. J. Physiol. 2002, 542, 669–683. [Google Scholar] [CrossRef]
- Francis, D.; Willson, K.; Georgiadou, P.; Wensel, R.; Davies, L.; Coats, A.; Piepoli, M. Physiological basis of fractal complexity properties of heart rate variability in man. J. Physiol. 2002, 15, 619–629. [Google Scholar] [CrossRef]


| k-M Slope | Average Degree | Average Path Length | |
|---|---|---|---|
| Young (Fantasia) | |||
| Elderly (Fantasia) | |||
| Healthy (awake) | |||
| CHF (awake) | |||
| Healthy (asleep) | |||
| CHF (asleep) |
| k-M Slope | Average Degree | Average Path Length | |
|---|---|---|---|
| Young (rest) | |||
| Adults (rest) | |||
| Young (exercise) | |||
| Adults (exercise) |
| Condition | Subjects | k-M Slope | Average Degree | Average Path Length |
|---|---|---|---|---|
| Rest | Young subjects with high physical activity levels | |||
| Young subjects with sedentary lifestyle | ||||
| Exercise | Young subjects with high physical activity levels | |||
| Young subjects with sedentary lifestyle | ||||
| Rest | Adults with high physical activity levels | |||
| Adults with sedentary lifestyle | ||||
| Exercise | Adults with high physical activity levels | |||
| Adults with sedentary lifestyle |
Disclaimer/Publisher’s Note: The statements, opinions and data contained in all publications are solely those of the individual author(s) and contributor(s) and not of MDPI and/or the editor(s). MDPI and/or the editor(s) disclaim responsibility for any injury to people or property resulting from any ideas, methods, instructions or products referred to in the content. |
© 2023 by the authors. Licensee MDPI, Basel, Switzerland. This article is an open access article distributed under the terms and conditions of the Creative Commons Attribution (CC BY) license (https://creativecommons.org/licenses/by/4.0/).
Share and Cite
Muñoz-Diosdado, A.; Solís-Montufar, É.E.; Zamora-Justo, J.A. Visibility Graph Analysis of Heartbeat Time Series: Comparison of Young vs. Old, Healthy vs. Diseased, Rest vs. Exercise, and Sedentary vs. Active. Entropy 2023, 25, 677. https://doi.org/10.3390/e25040677
Muñoz-Diosdado A, Solís-Montufar ÉE, Zamora-Justo JA. Visibility Graph Analysis of Heartbeat Time Series: Comparison of Young vs. Old, Healthy vs. Diseased, Rest vs. Exercise, and Sedentary vs. Active. Entropy. 2023; 25(4):677. https://doi.org/10.3390/e25040677
Chicago/Turabian StyleMuñoz-Diosdado, Alejandro, Éric E. Solís-Montufar, and José A. Zamora-Justo. 2023. "Visibility Graph Analysis of Heartbeat Time Series: Comparison of Young vs. Old, Healthy vs. Diseased, Rest vs. Exercise, and Sedentary vs. Active" Entropy 25, no. 4: 677. https://doi.org/10.3390/e25040677