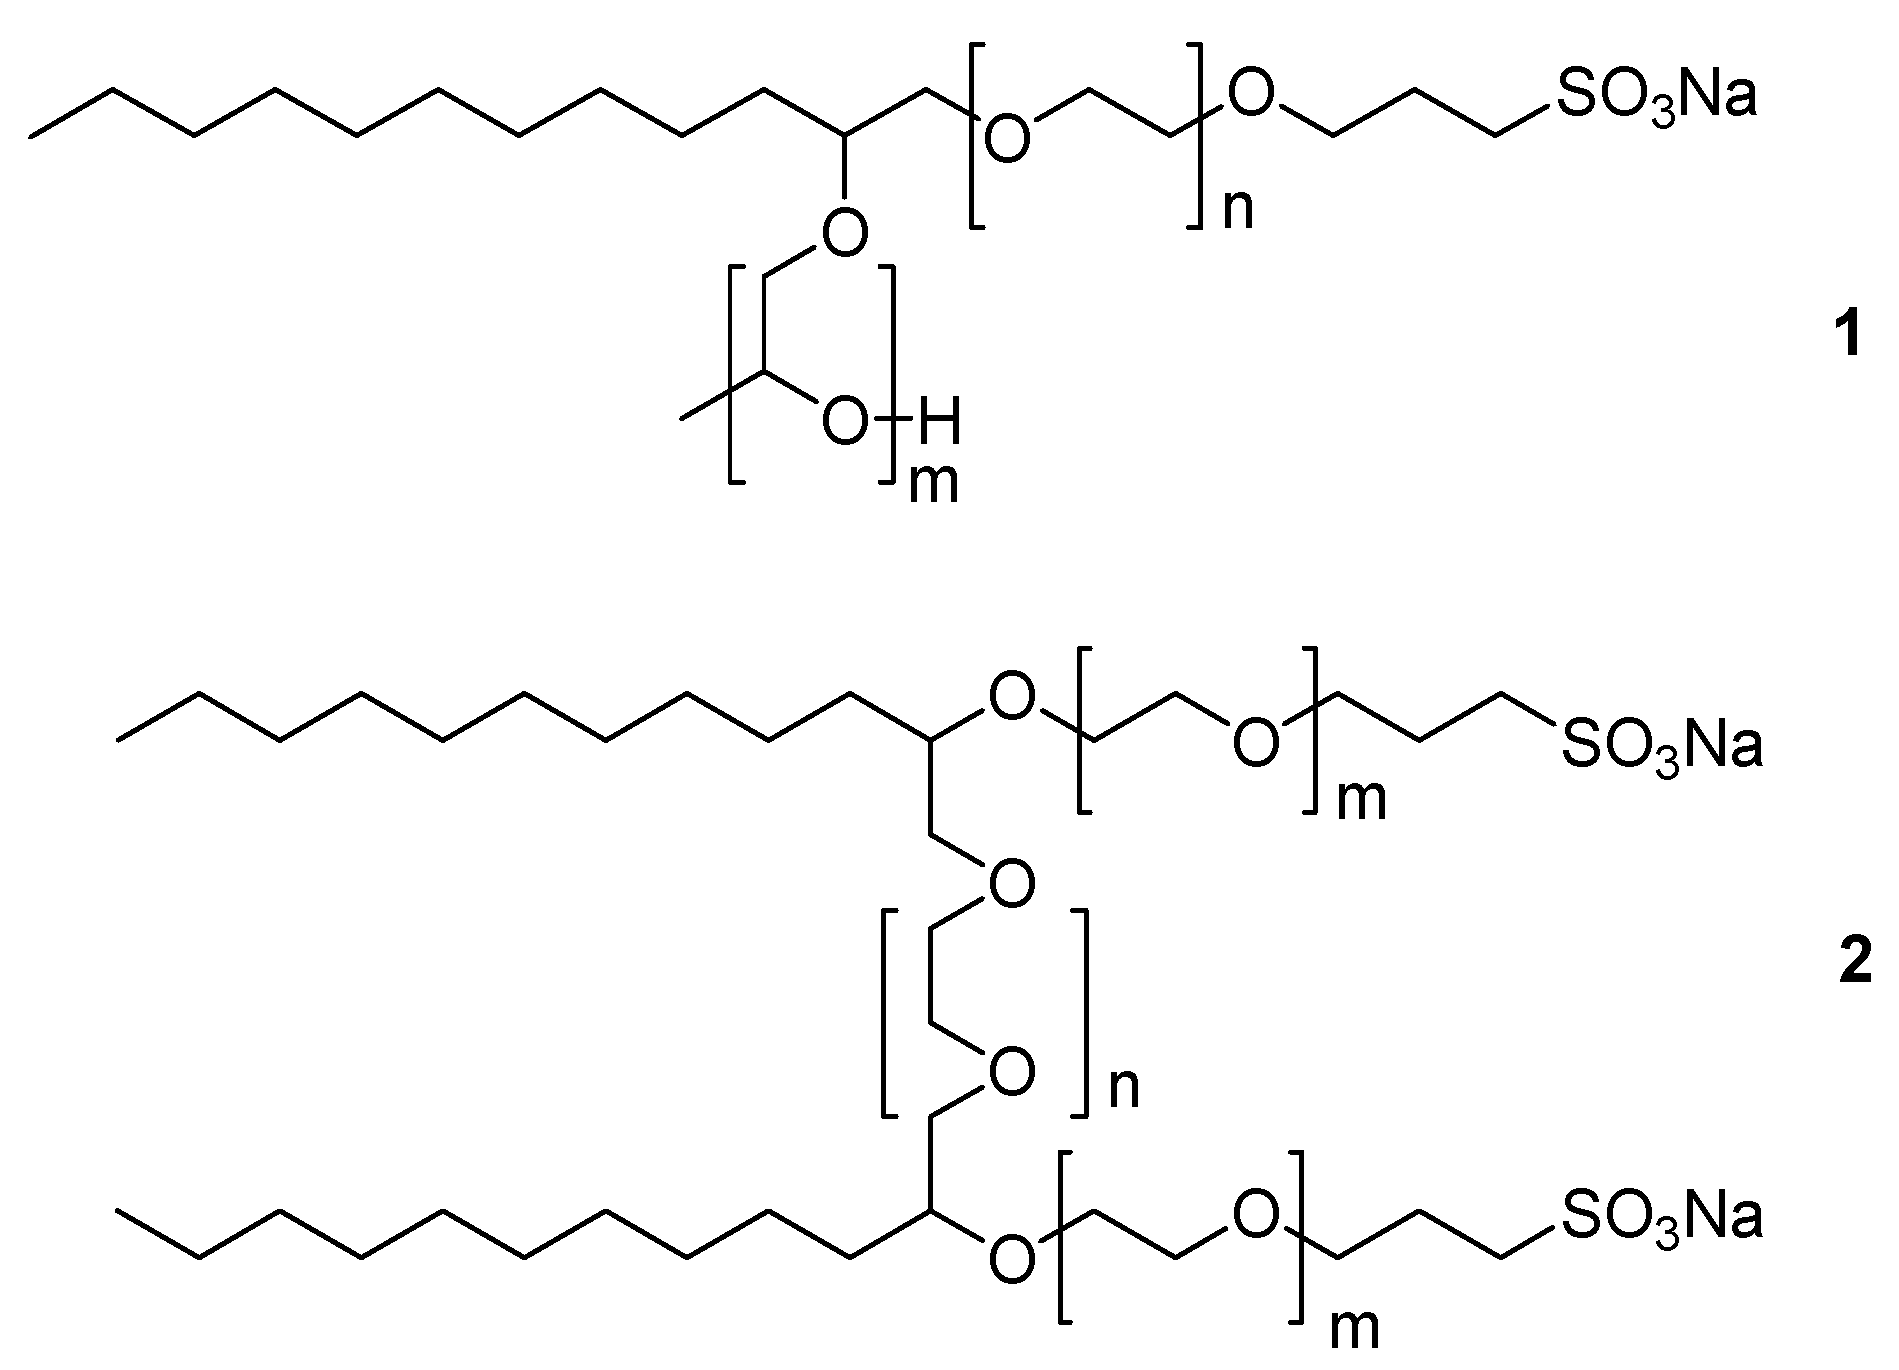
The sulfonate salts have for all practical purposes, no vapor pressure, and must therefore be derivatized prior to GC analysis. The use of several different sulfonate derivatives have been reported,
e.g., as the corresponding sulfonyl chlorides [
2] by reactions with SOCl
2 [
3] or PCl
5 [
4,
5]. Silyl ester formation has also been investigated [
6,
7]. On-line GC-esterification of sulfonates by co- injection of a tetrabutylammonium salt has also been described [
8]. When thionyl chloride was used in combination with DMF, enhanced performance was observed due to formation of Vilsmeier-type salts, and formation of the alkyl chlorides [
9,
2]. We have investigated the use of these methods on the surfactants studied in this work. The results, however, were not satisfactory as incomplete conversion was often observed together with various side reactions.
HPLC analysis
Ionic surfactants are generally analyzed by reverse-phase high performance liquid chromatography, RP-HPLC, which utilizes a non-polar stationary phase and a polar mobile phase. The stationary phase is derivatized with alkyl groups, usually C
8- or C
18-groups. Such systems were also applied for the surfactants in our study. HPLC analysis may, however, have limitations in detecting compounds which are transparent to the detection method used. For HPLC work UV-detection is often the method of choice [
10]. The challenge in this case, however, was the detection of the compounds of interest since these surfactants contained no chromophores.
Bulk-property detectors, which measure differences in physical properties of the mobile phase with or without the solute, such as the refractive index (RI) detectors and conductivity detectors [
11,
12,
13], are universal. They usually respond to all compounds, but generally suffer from poor sensitivity and limited dynamic ranges (10 ng -1 μg), and are affected by changes in the mobile phase composition and temperature. The detector responses are not always linear with respect to concentration and not compatible with solvent gradient HPLC methods. The application of refractive index and conductivity detection was investigated, but exhibited unacceptable noise levels and poor sensitivity and the results were not reproducible. For these reasons derivatization, conductivity- and RI detection was ruled out.
Solute property detectors on the other hand respond to a physical or chemical property of the solute, and are ideally independent of the mobile phase. Examples are spectrophotometry, fluorescence and electrochemical detectors. Even though mobile phase independence is not always fulfilled in practice, high sensitivity with a wide linear response range (10 pg - 1 ng) can usually be achieved. A disadvantage with HPLC methods is that all impurities will not necessarily be detected and they should therefore be used in combination with other methods, e.g., GC and spectroscopic methods.
Indirect Photometric Detection, IPD
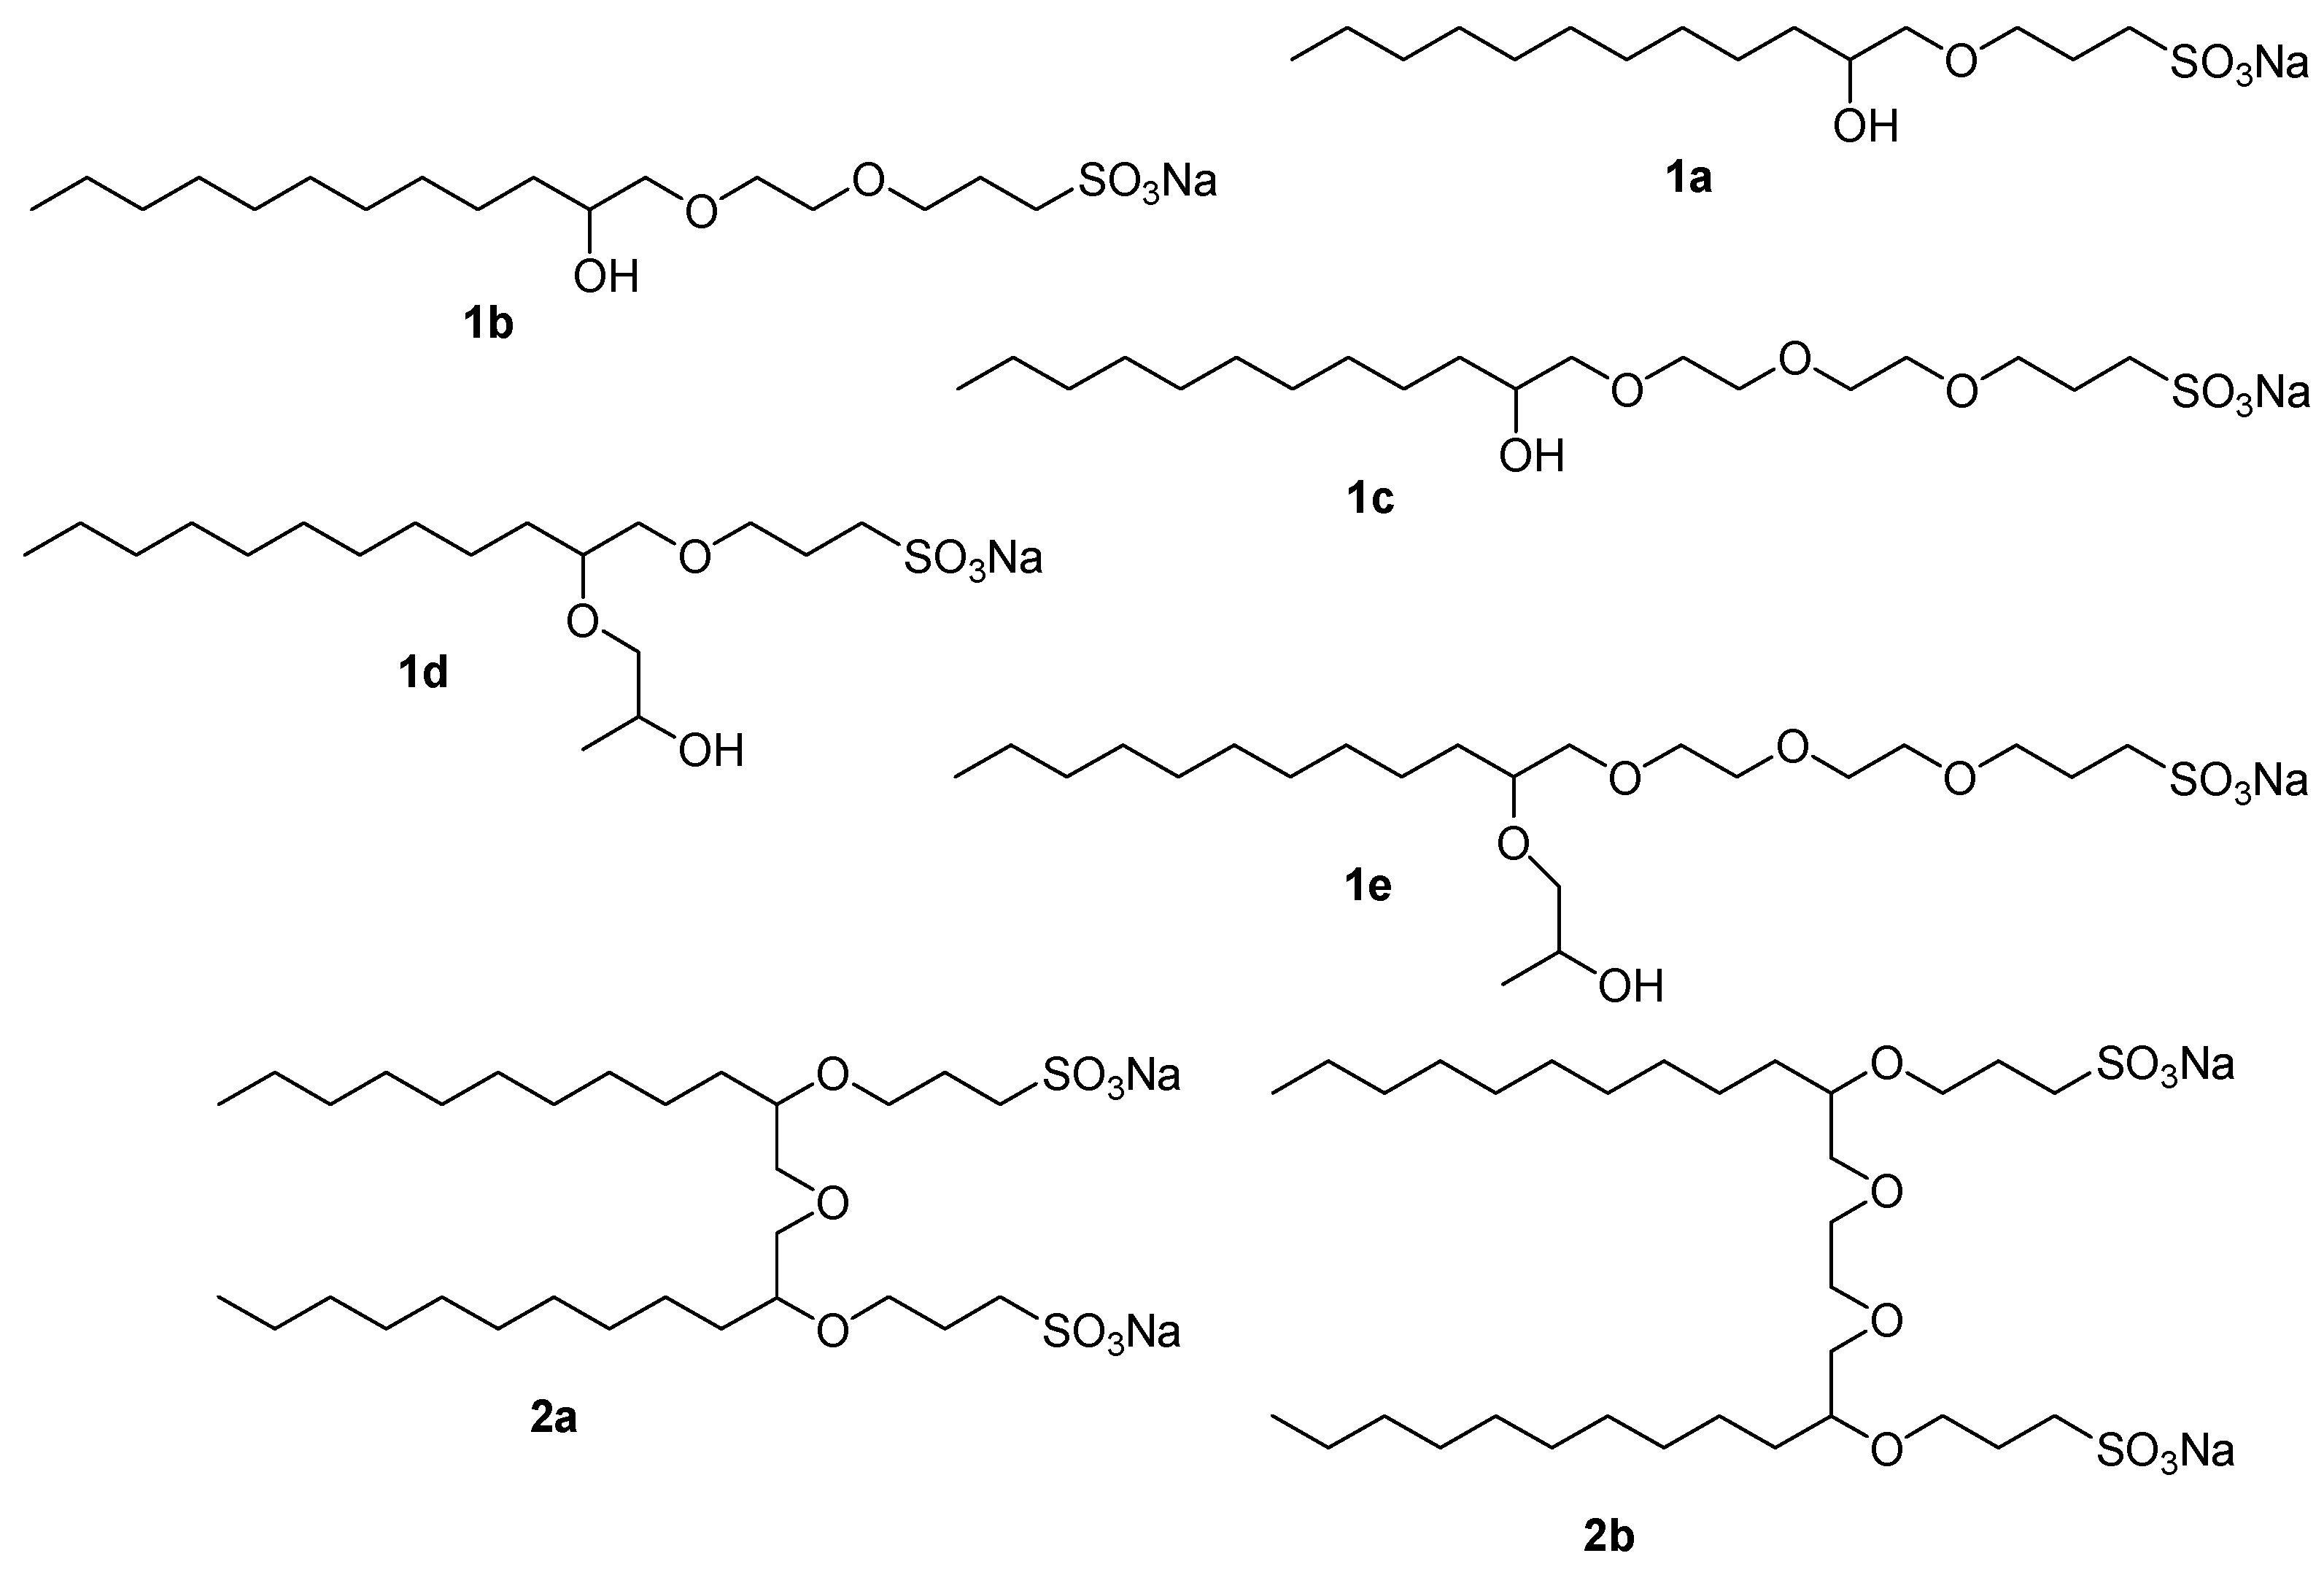
For the detection of surfactants
1a–
e and
2a–
b methods other than direct detection must be used. An alternative UV-detection method is indirect photometric detection, IPD. When a solute gives an insufficient detector response, adding an auxiliary to the mobile phase can enhance sensitivity. The auxiliary can be a UV-absorbing salt, and may work by two different mechanisms; either formation of ion-pairs with the ionic surfactants, resulting in positive signals, or negative signals due to local depletion of the amount of the UV-active salts required for maintaining electroneutrality. This method has all the advantages of UV-detection and avoids derivatization. Common visualization reagents described in the literature are methylene blue [
14], naphthalene sulfonate or disulfonates [
15,
16], copper, cerium or silver salts [
17] and
N-alkyl pyridinium salts [
18,
19]. The pyridinium salts reported in the literature were
N-methylpyridinium chloride,
N-butylpyridinium bromide,
N-octylpyridinium bromide,
N-dodecylpyridinium bromide, and
N-cetylpyridinium bromide. One of the studies concluded that the alkyl moiety should preferably consist of a methyl group [
18] as use of longer alkyl groups resulted in variations of the retention time of a system peak as a function of eluent composition. Although IPD-based RP-HPLC methods are reported to be efficient, they have some limitations, e.g., neutral impurities in most cases remain undetected.
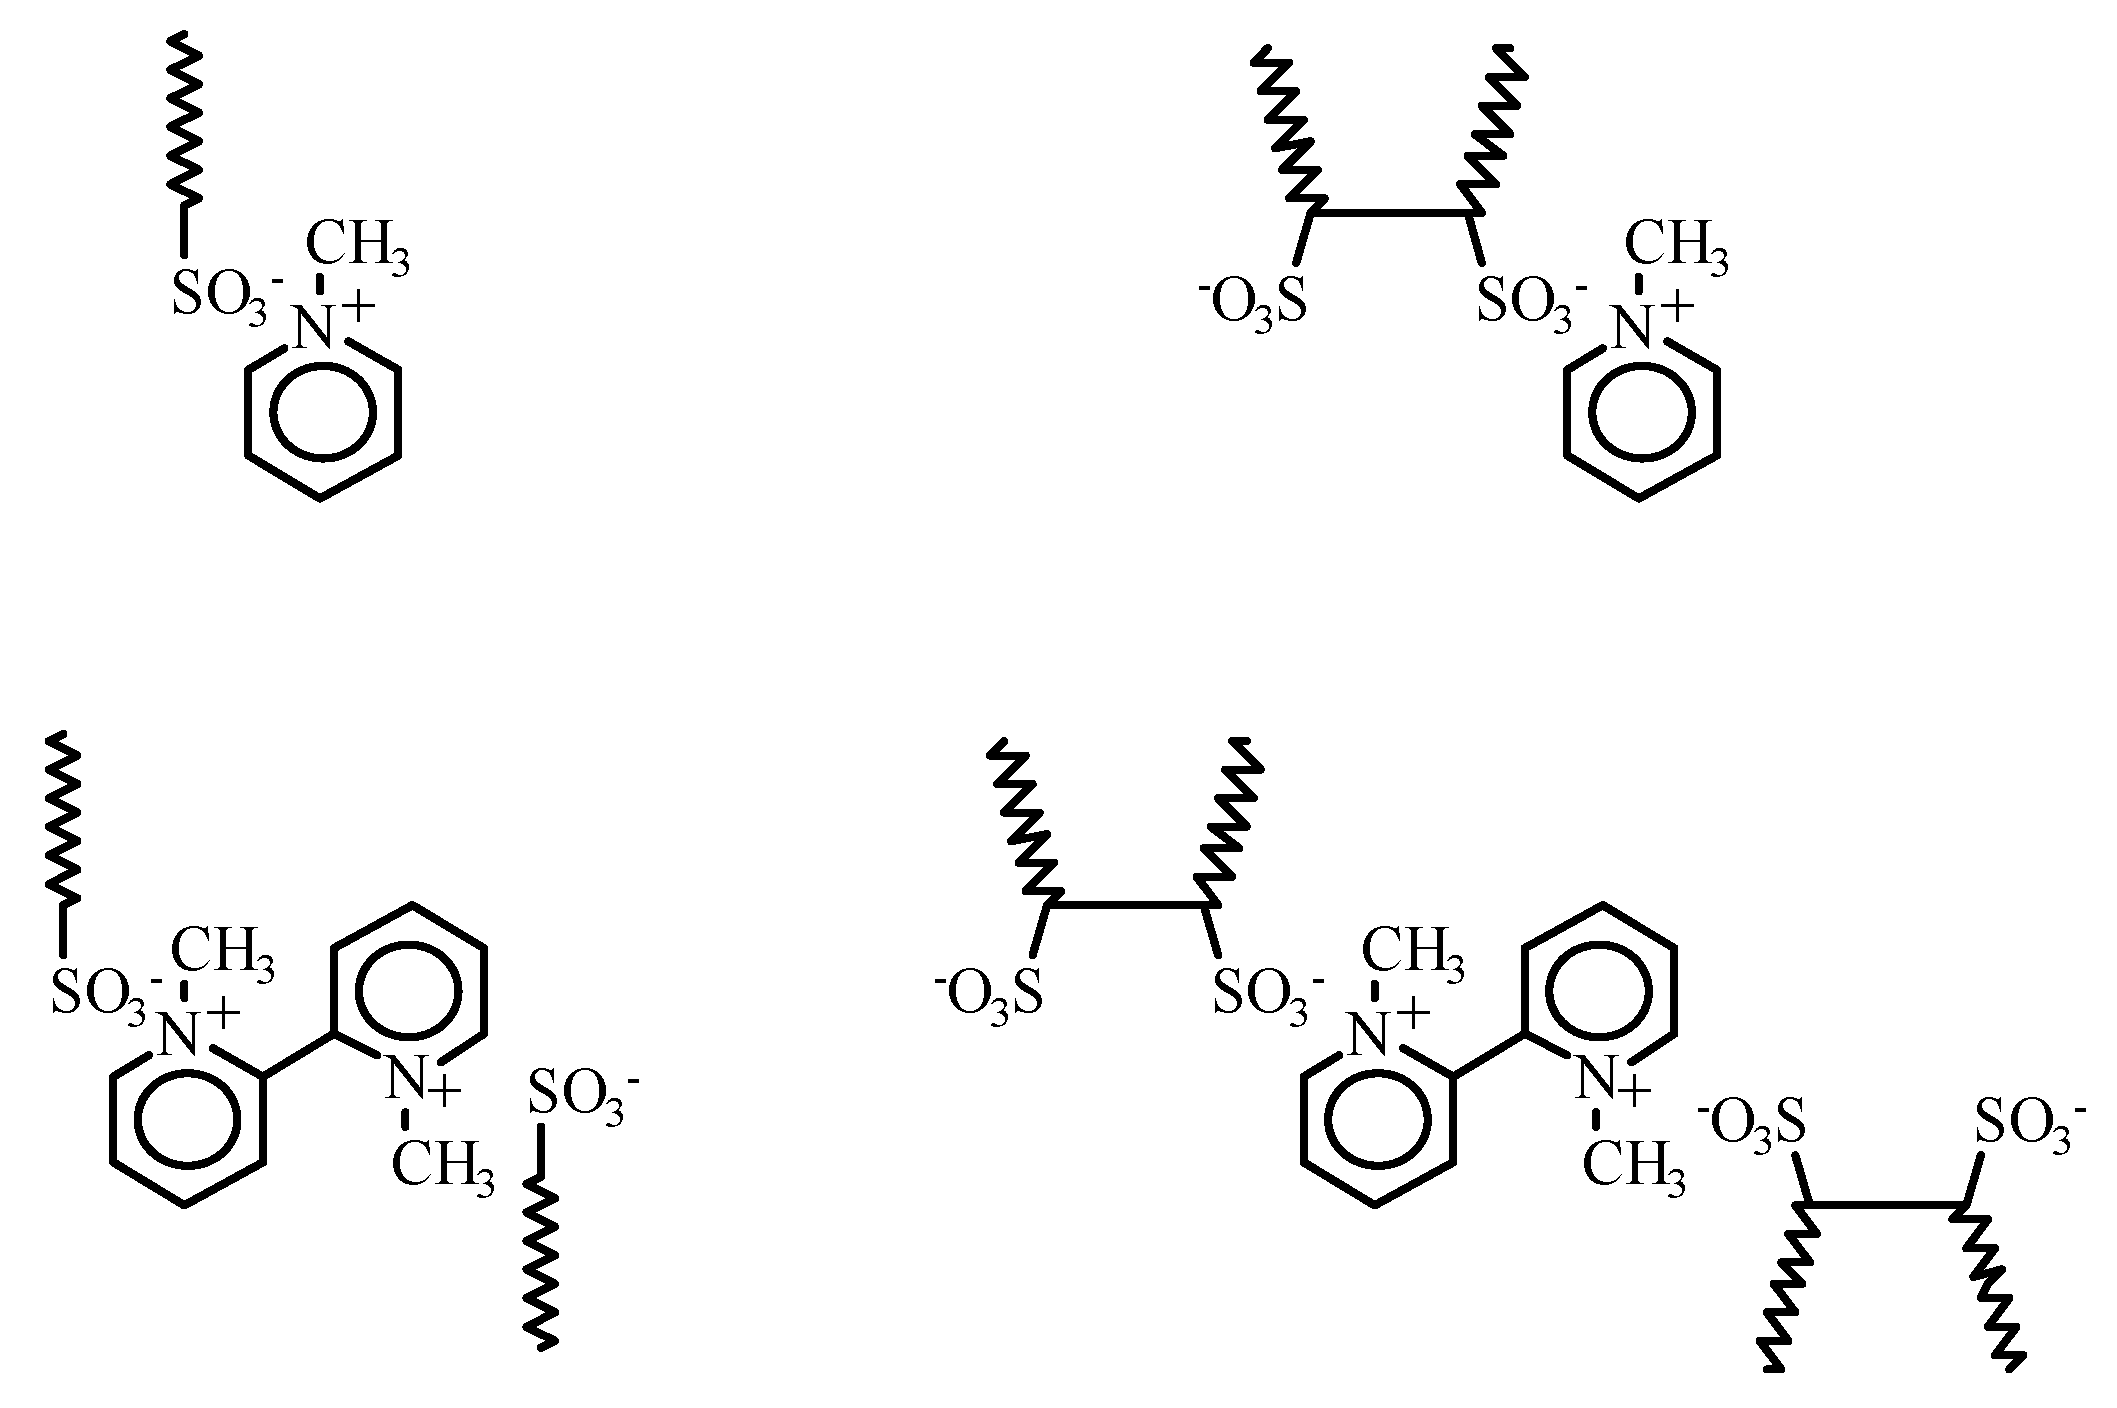
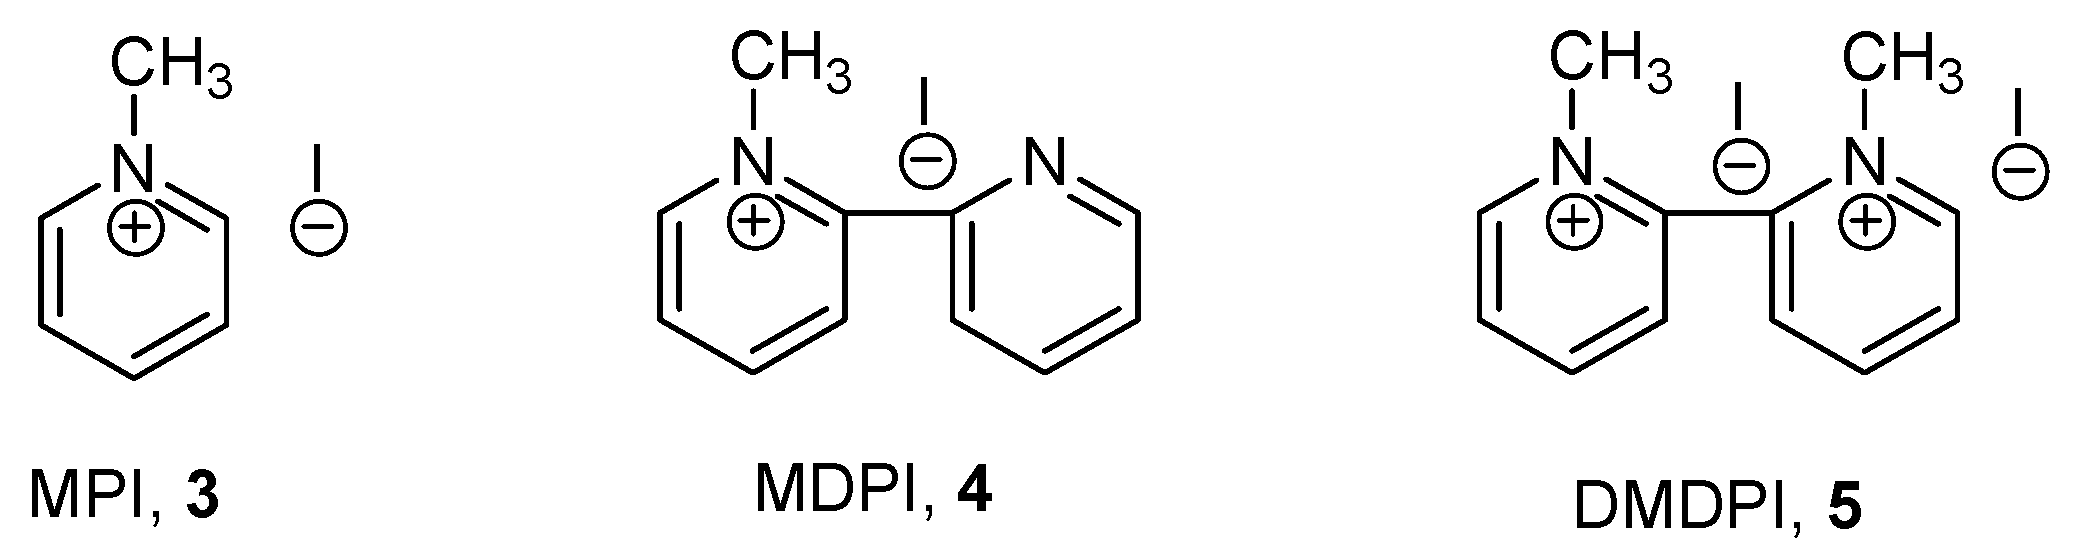
A pyridinium salt frequently used for this application is
N-methylpyridinium chloride. In the development of a HPLC method, detection of
1a–
e and
2a–b was studied using a variety of pyridinium iodides,
3–
5,
Figure 3. They were readily obtained by the reaction of the corresponding pyridines with methyl iodide in dichloromethane.
In this study C -18 reverse phase columns were preferably used. Mixtures of water and acetonitrile were used as eluents. The concentration of the visualization reagent was in the range 0.10-0.25 mM. The salts shown in
Figure 3 were tested as visualization agents. The injected sample volume was 10.0 µL of samples that consisted of surfactants dissolved in the eluent in the concentration range 0.05 - 1.0 mg/mL. Wavelengths between 258 and 300 nm was used for UV-detection depending on the ion- pair reagent used.
It should be noted that HPLC using the ion-pair IPD-method of detection exhibits a characteristic behavior. Thus, in reverse phase HPLC-experiments early in the run, a positive peak will be observed, with the same retention time as the ion-pair reagent (here ca. 2 min) which may be induced by equilibration of the local eluent composition upon injecting the sample [
20]. Later in the chromatogram a large, broad, negative peak is observed, referred to as the
system peak. The area of the system peak is basically equal to the collected area of the peaks of the sample, and is caused by depletion of the UV-active reagent from the mobile phase, when the sample is injected. These two peaks will always appear in the IPD chromatograms.
N-Methylpyridinium iodide (MPI, 3).
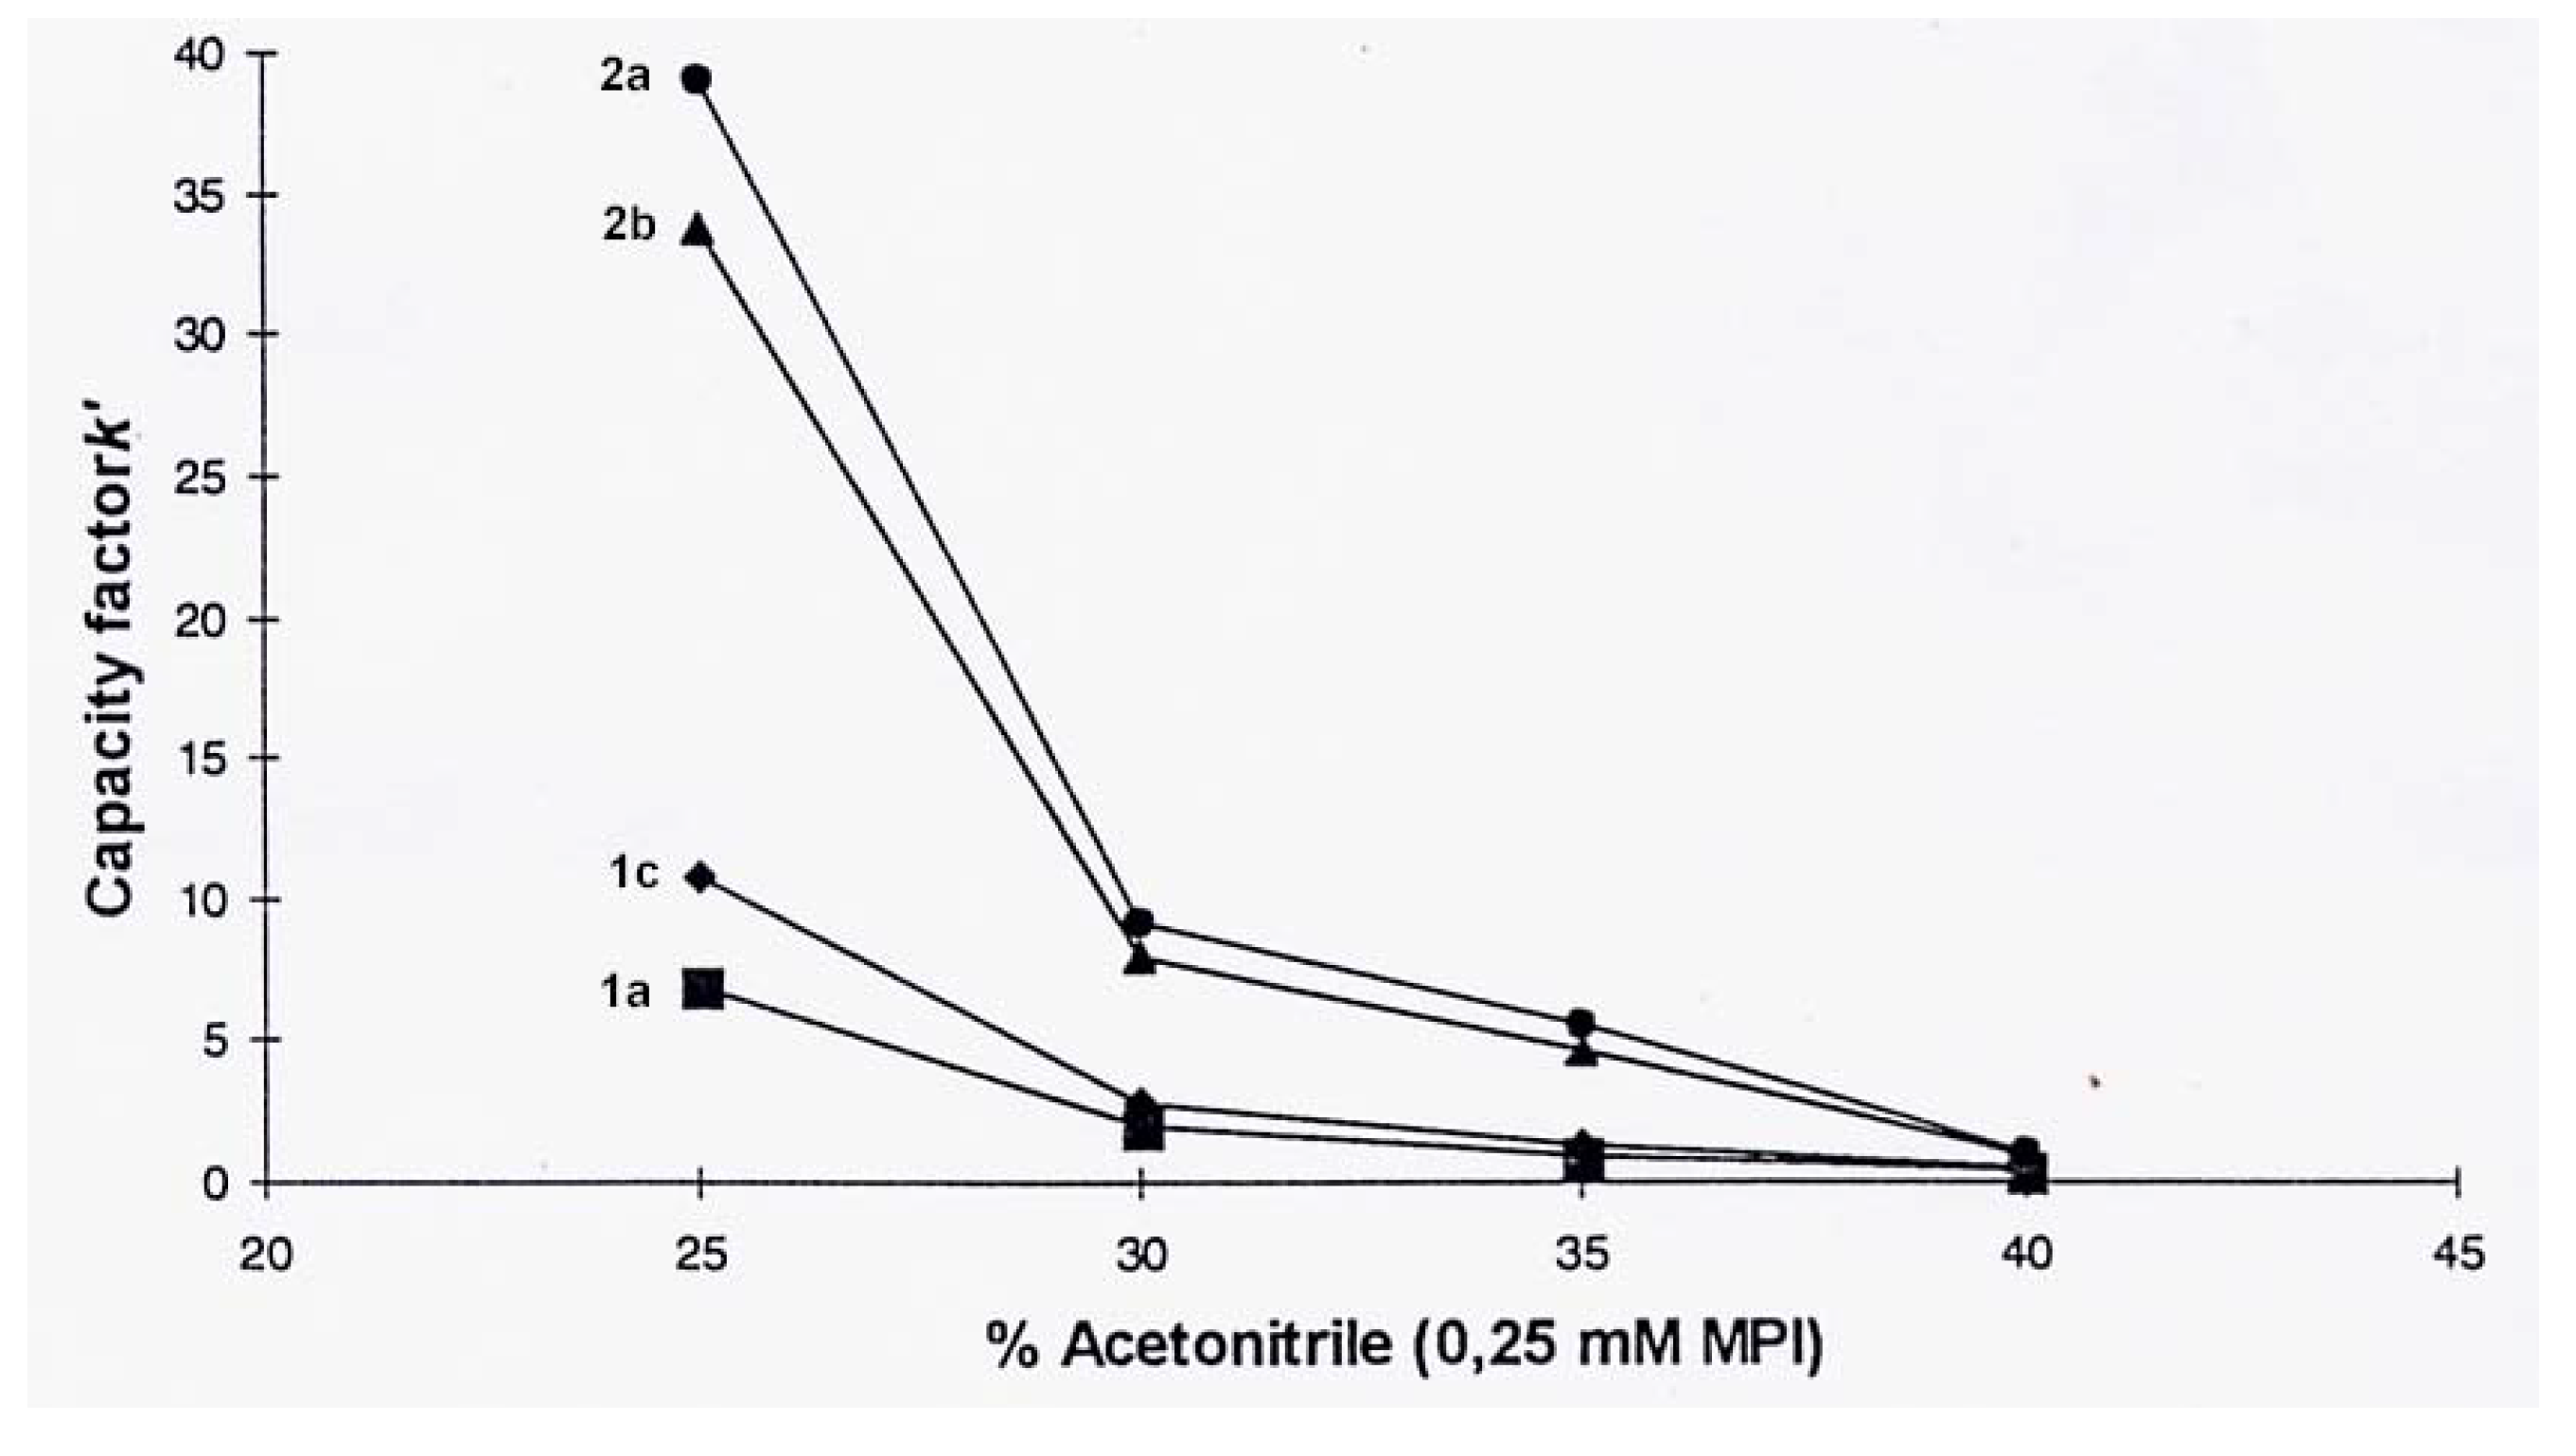
Use of MPI,
3, as the ion-pair reagent (0.25 mM) and a 30:70 water-acetonitrile eluent solution, gave good separation and peak intensity. The capacity was investigated and the capacity factor,
k', was calculated for surfactants
1a,
1c,
2a, and
2b [21]. The
k'- value indicates to what extend a solute is retained on the column, and is a function of the composition of the eluent. The capacity factor as a function of eluent composition is illustrated in
Figure 4.
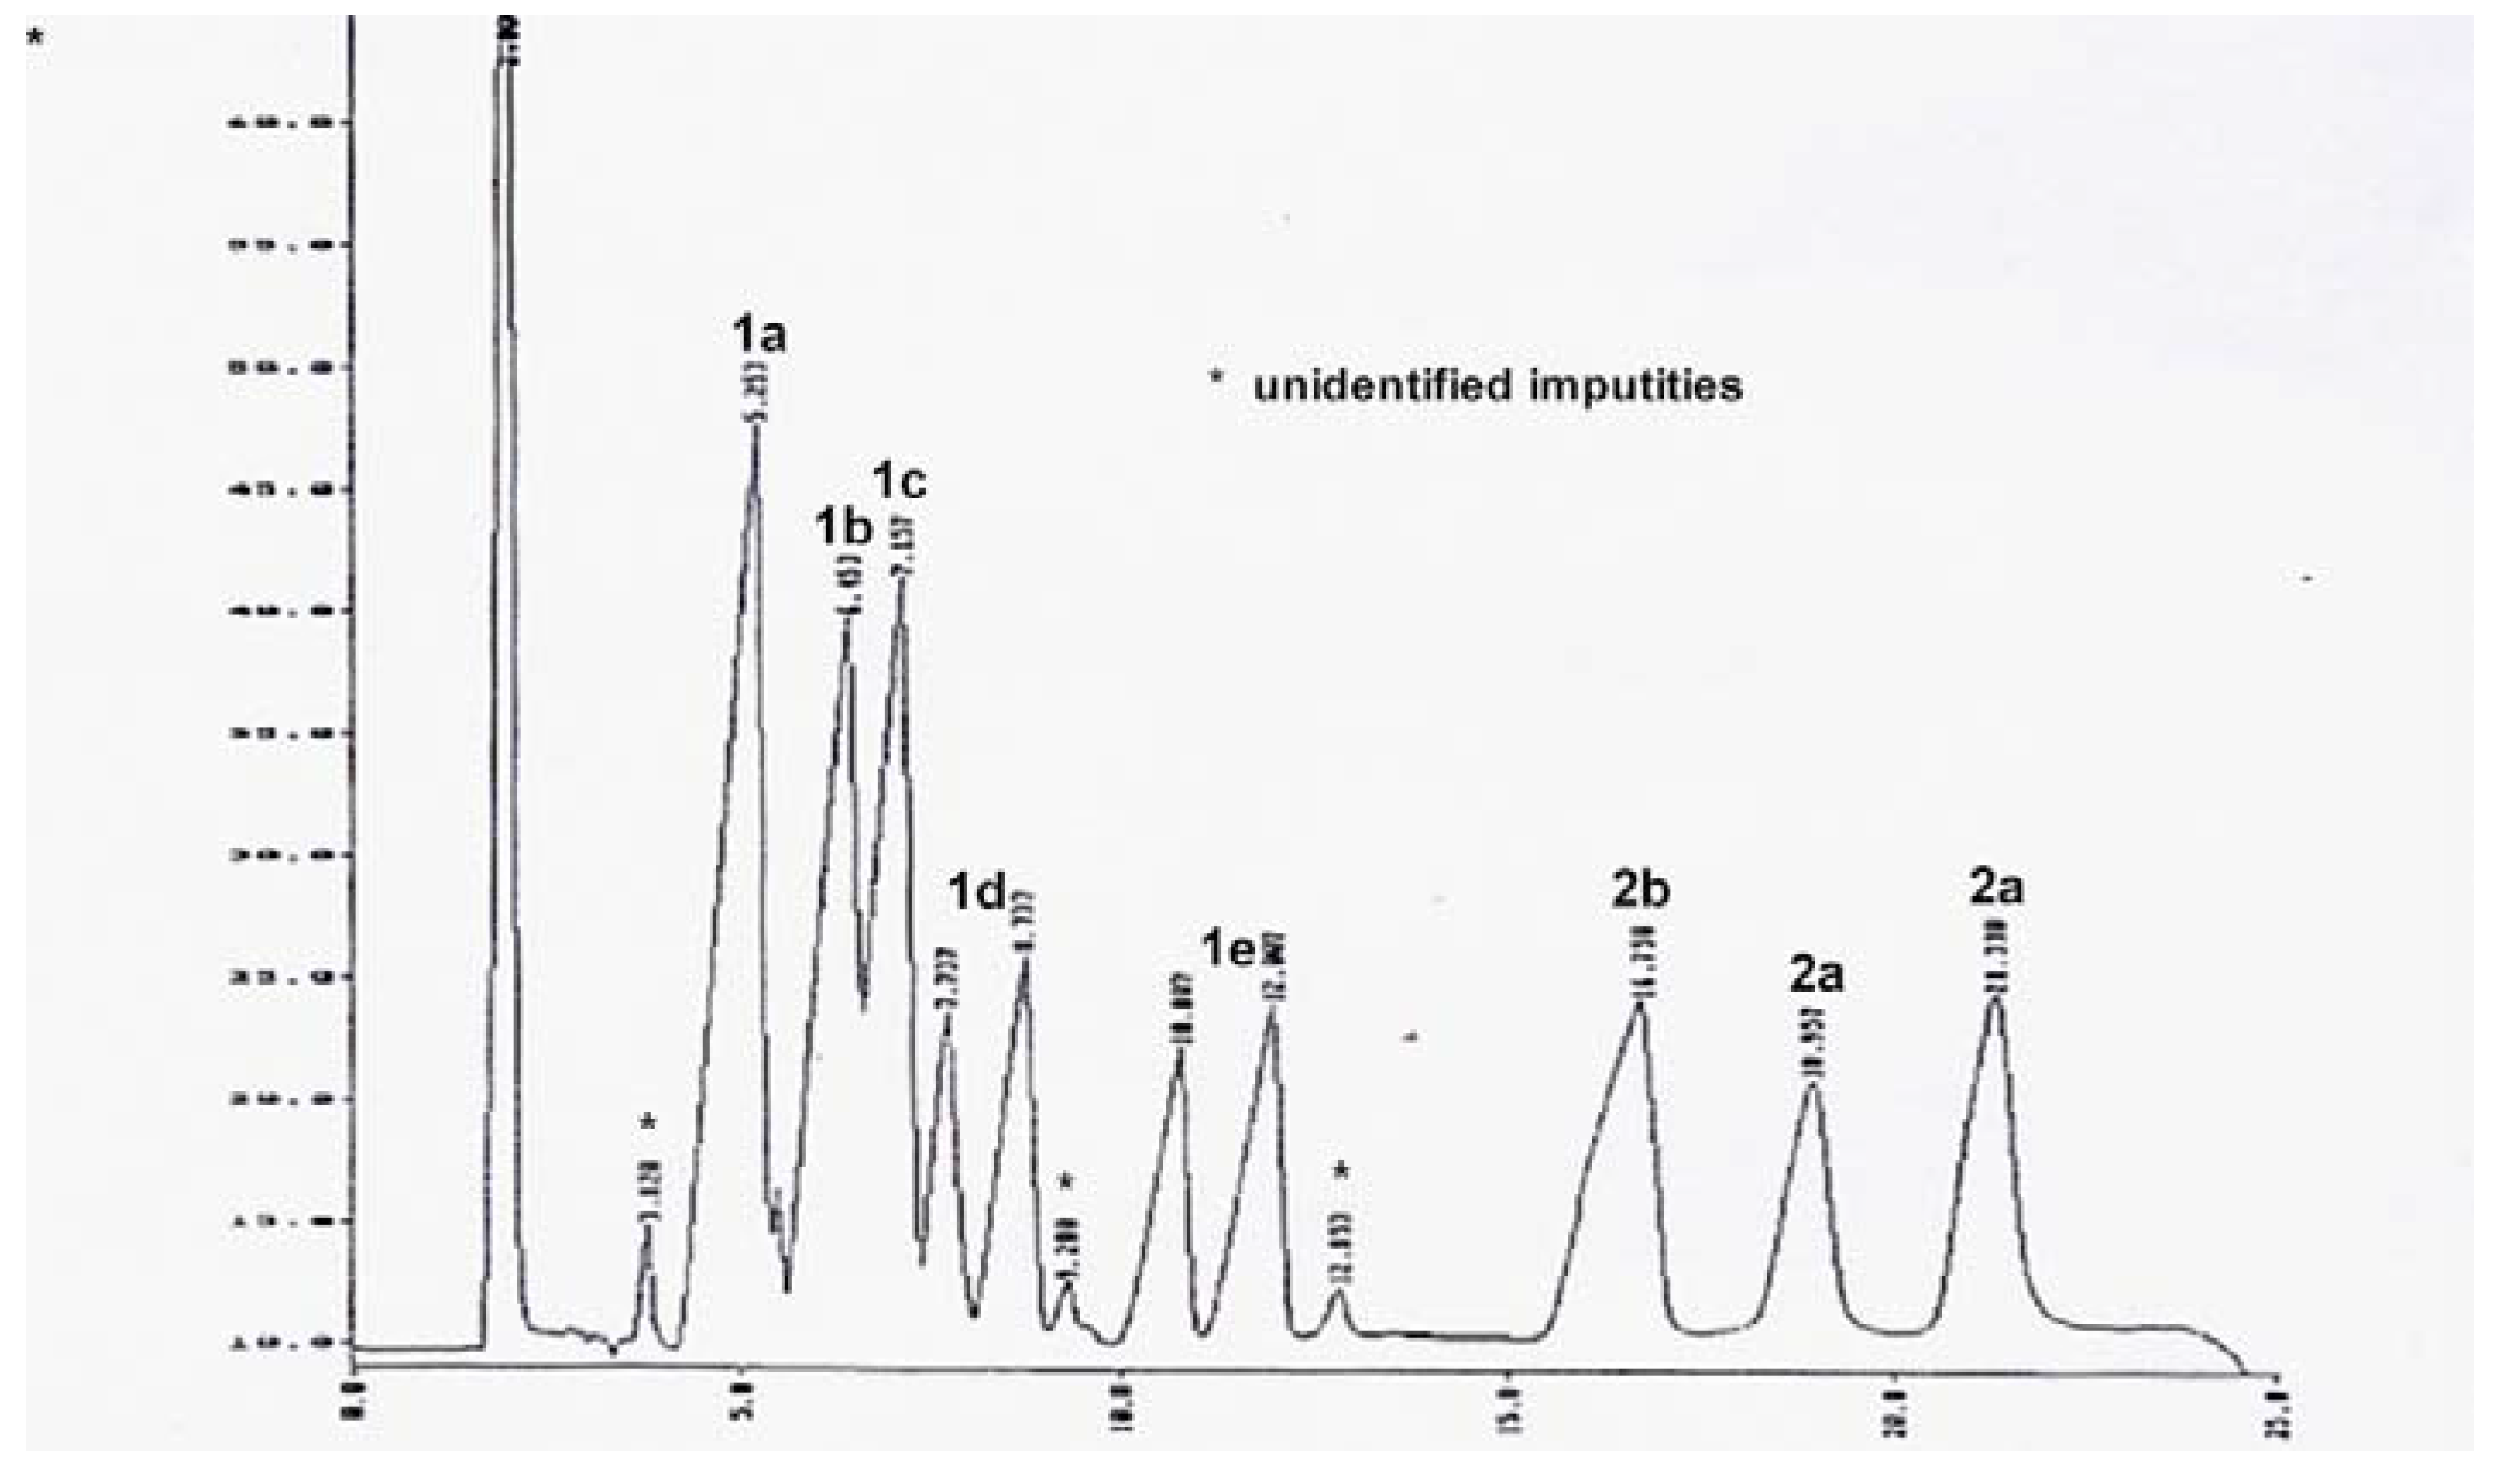
Increasing the amount of acetonitrile in the eluent (from 25 to 40 %) resulted in shorter retention times for all the surfactants. However, for the bis surfactants,
2a–
2b, the retention time decreased more readily, and therefore also the
k' values. When the acetonitrile concentration approached 25 %, the retention times exceeded 1 hour, resulting in peak broadening. This effect can be rationalized by the higher lipophilicity of bis surfactant ion-pair complexes. Thus, the two tails influenced the hydrophile- lipophile balance, HLB, more than the presence of the two ionic head groups. Mixtures of surfactants
1a–
e and
2a–
b were readily separated into the corresponding components,
Figure 5.
Changing concentrations of MPI,
3, in the range 0.10 - 0.30 mM appeared to have no significant influence on the retention times. The start of the system peak is observed in the chromatogram in
Figure 5, starting at approximately 24 min.
Table 1 shows the results and the assignment of the peaks, which was also confirmed by analysis of the authentic compounds. We note that compounds
1b,
1d,
1e and
2a each gave rise to two peaks. These compounds all contain two stereogenic carbon atoms, giving rise to two sets of diastereomers, each of which gave separated peaks in the chromatogram.
Table 1.
Retention times for surfactants 1a–e and 2a–b, using a 30:70 water-acetonitrile mixture as eluent and MPI, 3, as the ion-pair auxiliary. Detection at λ = 258 nm.
Table 1.
Retention times for surfactants 1a–e and 2a–b, using a 30:70 water-acetonitrile mixture as eluent and MPI, 3, as the ion-pair auxiliary. Detection at λ = 258 nm.
| Surfactant | Retention times [minutes] |
|---|
| 1a | 5.2 |
| 1b | 6.4 |
| 1c | 7.1 |
| 1d | 7.3 / 8.7 * |
| 1e | 10.8 / 12.0 * |
| 2a | 18.9 / 21.3 * |
| 2b | 16.7 |
Increased lipophilicity of a compound with a reversed-phase stationary phase usually increased the retention time. Results from the
1a–
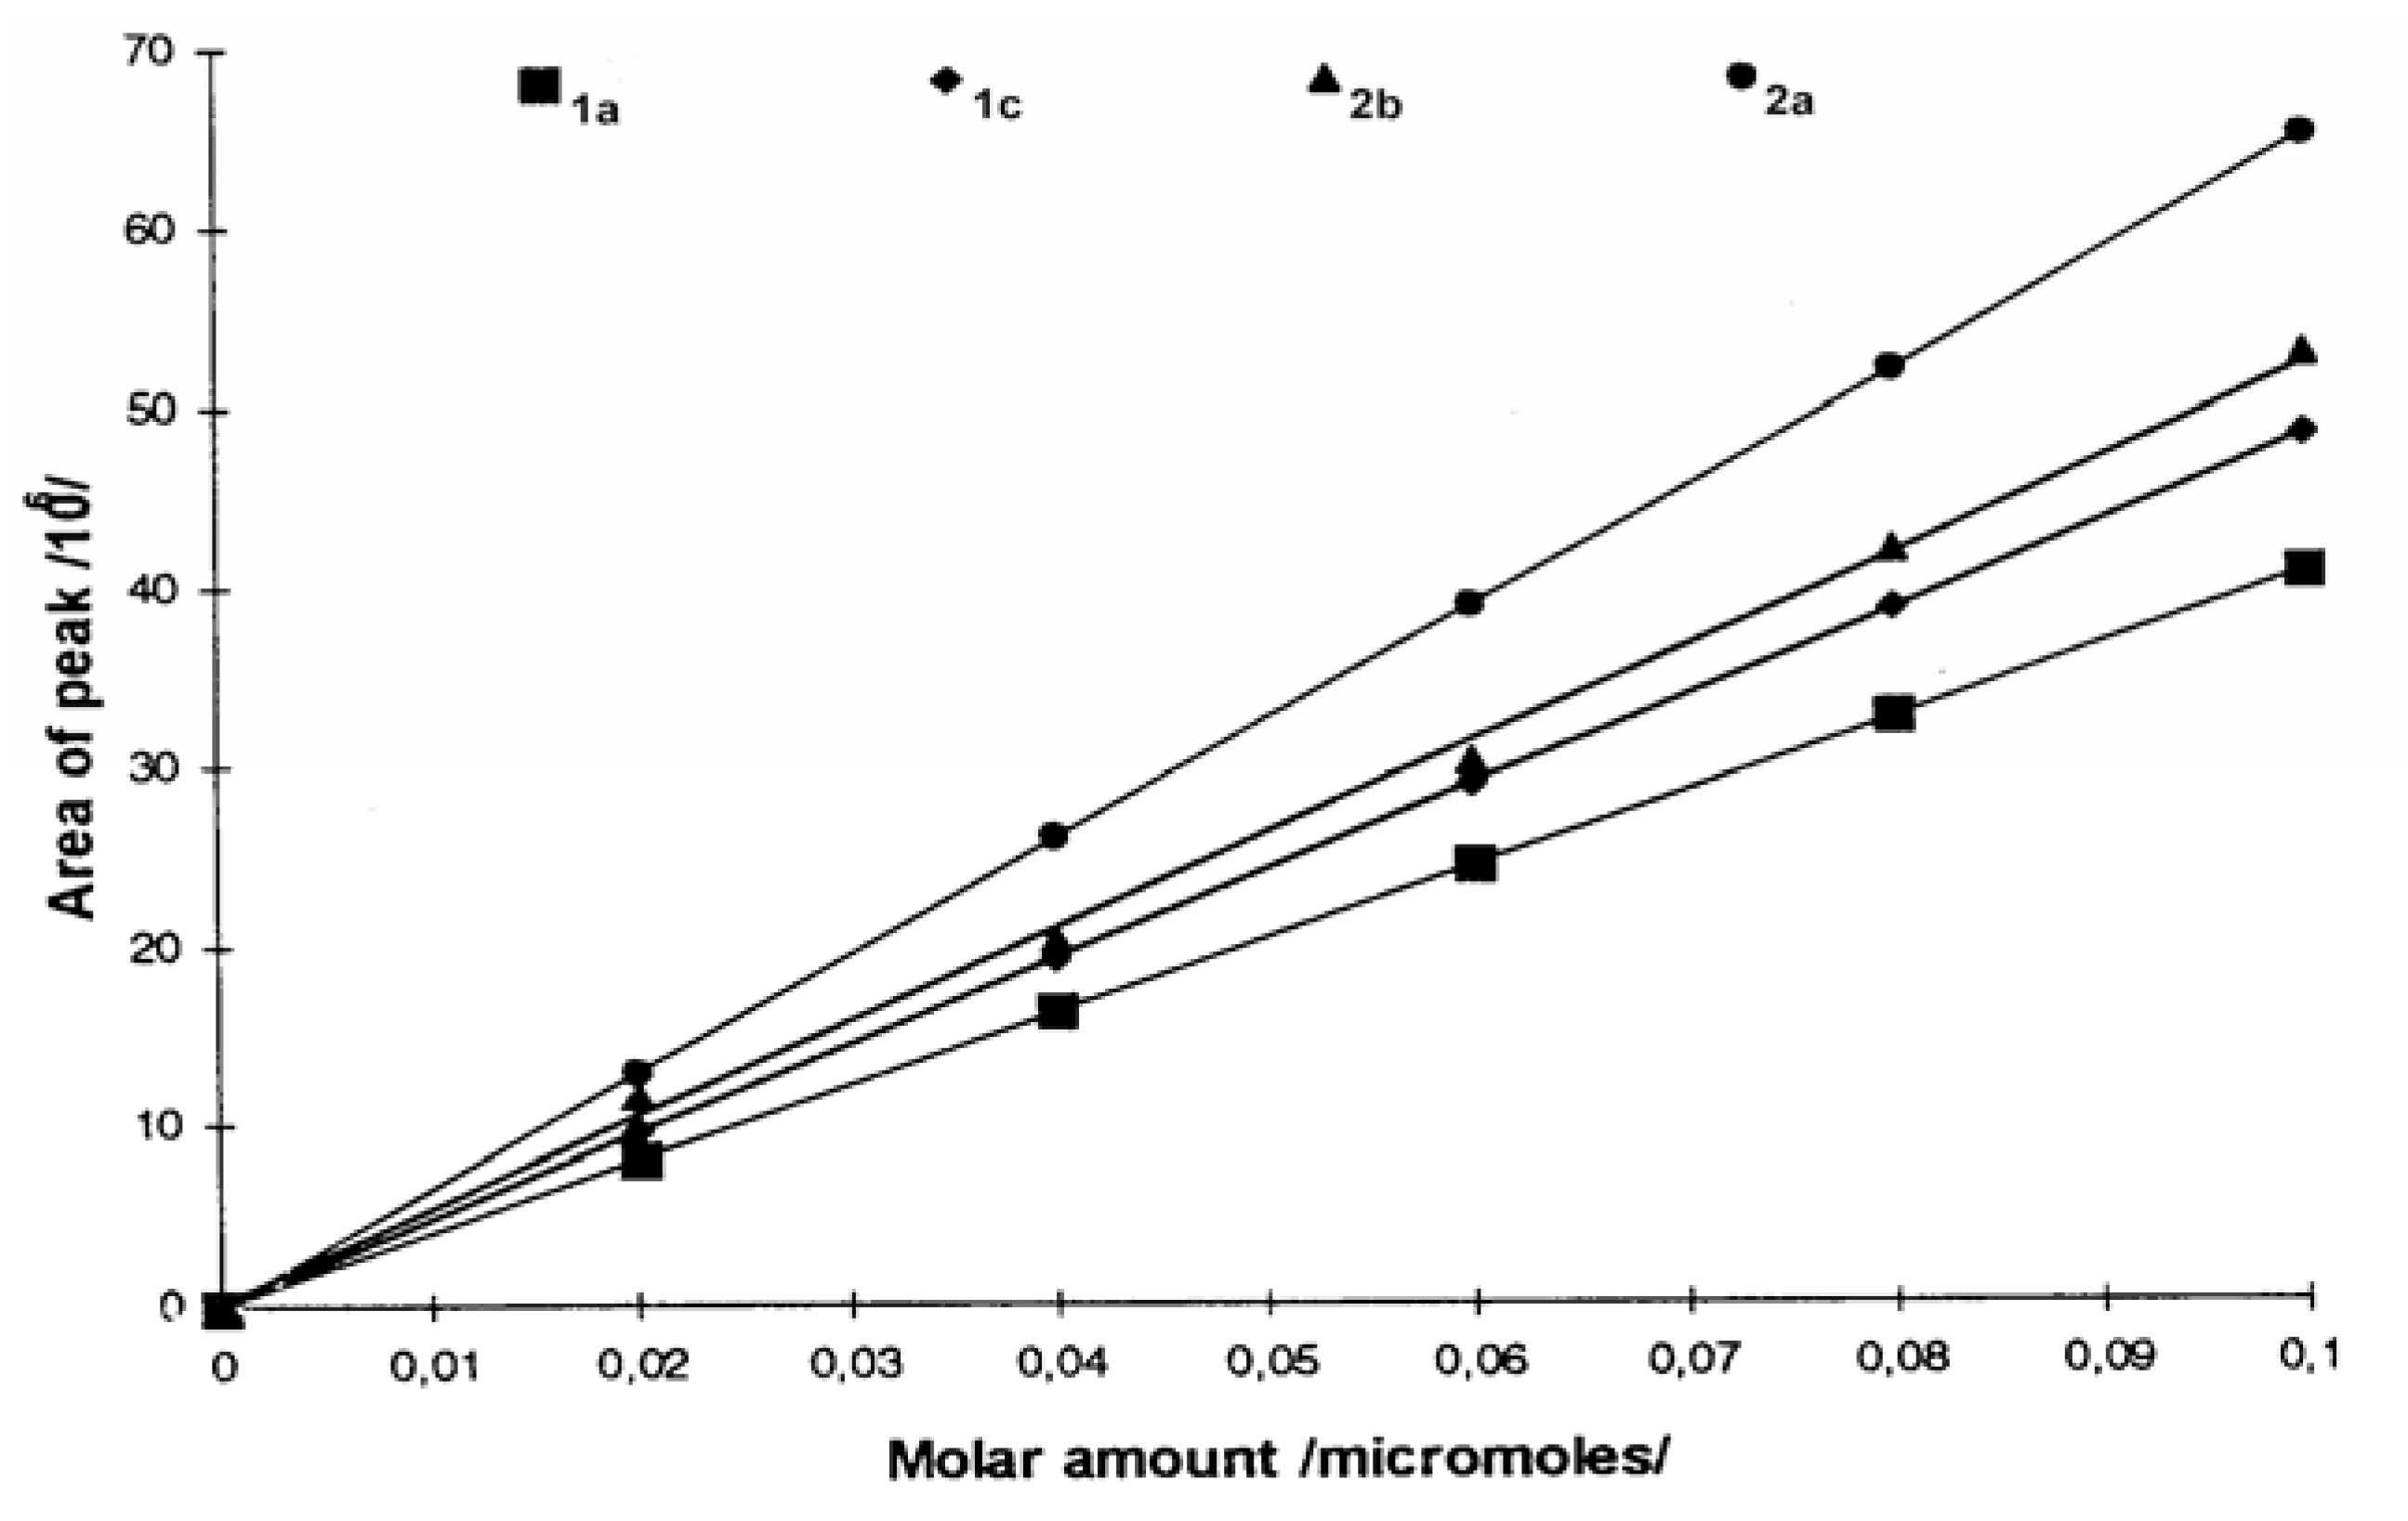
e series of surfactants showed that introduction of a PO-unit influenced the retention time more than the introduction of an EO-unit. Contributing to this, is the fact that branching of the tail usually give a more lipophilic compound compared to the unbranched compound with the same number of carbon atoms. The semi-polar side-chain in addition contained an extra methyl group. Important for quantitative measurements, the detector response was found to be linear with respect to the amount of compound injected, over a range covering approximately one order of magnitude. This is illustrated in
Figure 6 for surfactants
1a,
1c,
2a,
2b.
The eluent consisted here of a 35:65 mixture of acetonitrile-water. Quantitative analysis using vanillin as an internal standard (retention times 4.52 minutes) with different molar ratios of the surfactants and vanillin keeping a constant concentration of vanillin also gave a linear relationship between the responses and the molar ratio. This confirms the methods application for quantitative analysis.
N-Methyl-2,2'-bipyridinium iodide (MDPI, 4).
Similar studies were done with MDPI, 4, using a 30:70 water-acetonitrile solvent system. Retention times were slightly longer, but the system peak came earlier (after 20 min). The variations were ascribed to differences in the structures of the ion-pairs and equilibrium constants. For this system, the system peak coincided with the signals for surfactants, 2a and 2b.
Table 2.
Retention times of the different surfactants using MDPI, 4.
Table 2.
Retention times of the different surfactants using MDPI, 4.
| Surfactant | Retention times [min] |
|---|
| 1a | 7.1 |
| 1b | 8.9 |
| 1c | 10.2 |
| 1d | 11.2 / 12.7 * |
| 1e | 15.6 / 17.1 * |
| 2a | ** |
| 2b | ** |
This illustrates one of the characteristic problems often encountered when using the IPD-method. For this reason, with this IPM-system, we could not analyze for compounds
2. However, at the same time it illustrates that changing the properties of the visualization reagents represented an additional parameter in creating methods suitable for specific purposes.
Table 2 shows the observed data for this system. The MDPI system also exhibited strict linearity of detector response versus the amounts of surfactant injected on the column.
The response curves,
e.g., as in
Figure 6, exhibited different slopes for the different surfactants. For the same surfactant, but with different ion-pair salts, slopes were also different. Thus, surfactant
2b with MPI showed a larger response than did
2a, while the opposite was the case when using MDPI as the ion-pair salt. These effects can be ascribed to the differences in stability of the surfactant- pyridinium complexes:
i.e., the equilibrium for the complex formation is sensitive to structural factors. Thus, it appears that the equilibrium lies further to the right for
2b than for
2a with MPI as the ion-pair salt, while the opposite is the case using MDPI.
N,N'-Dimethyl-2,2-bipyridinium diiodide (DMDPI, 5).
Similar experiments were carried out with the surfactants but using DMDPI, 5. This reagent exhibited higher background absorption. This was compensated for, by changing the detector wavelength from 258 nm to 290 nm, and the concentration of the visualization reagent was reduced to 0.15 mM. The ion-pair complexes appeared to be rather lipophilic. Without changing the mobile phase, retention-times therefore became very long, resulting in broader peaks. Increasing the amount of acetonitrile to a 50:50 acetonitrile-water solution compensated for this. Otherwise, the detection and response of the surfactants was as for the previous examples. However, since DMDPI, 5, did not display any significant advantages over the MPI-system, further work on this system will not be described.
Structure of the surfactant-ion pair complexes.
Because different types of ion-pair complexes appeared to have different HPLC-characteristics, and therefore depended on the pyridinium salt employed, we studied the effect of the charge ratios in the ion-pair complexes. The mono-sulfonate surfactants 1 with a mono-cationic salt, for example MPI, 3, presumably formed what was basically a 1:1 ion-pair complex. The disulfonates 2, on the other hand, may form either a 1:1 complex with one negative charge, or a 1:2 complex with MPI, 3,. The latter may not be so readily formed, due to kinetic, entropy or steric effects. If the visualization reagent was doubly positive charges, for example DMDPI, 5, neutral 1:1 complexes with 2 can be envisioned.
The nature of the ion-pair complexes was studied in parallel experiments with the single-chain surfactant,
1a, and the bis surfactant,
2b. Thus, equal amounts (10.0 μL of solutions being 0.0232 mM in
1a and
2b) were injected on the column, both in separate experiments and as mixtures. As mobile phase was used a 40:60 acetonitrile-water solution being 0.15 mM in MPI,
3, and the detector set at 258 nm. Virtually equal responses were obtained for the two surfactants,
Table 3. Assuming that the single-chained surfactant
1a with MPI formed a 1:1 ion-pair, the bis surfactant
2b, must similarly form a 1:1 ion-pair.
For the subsequent experiments with DMDPI, 5, the detector wavelengths were adjusted so that, at the concentrations chosen for the pyridinium salts 3 and 5 (0.15 mM), similar absorbance values were obtained for the two mobile phases (it happened to be A = 1.40). Thus, the detector wavelength was chosen as 258 and 280 nm, respectively. The signals of similar molar ion-pair composition for the MPI and DMDPI systems, respectively, should result in equal detector responses. Thus, with the molar concentrations of the surfactants being the same (for both was applied 10.0 μL of 0.0232 mM stock solutions), any 1:1-complex should always give the same integrated peak area, independent on the actual identity components in the complexes. E.g., the peak area measured for a 1:1 1a-MPI complex should be equal to that of a 1:1 ratio in the 2b-DMDPI complex.
Table 3.
Comparison of peak areas of single- and double-chain surfactants.
Table 3.
Comparison of peak areas of single- and double-chain surfactants.
| Surfactant | Measured Relative Peak Area Values |
|---|
MPI-system, 3.
(258 nm) | DMDPI-system, 5.
(280 nm) |
|---|
Single-chain, 1a
Double-chain, 2b | 10.20
10.00 | 5.58
5.50 |
The results for DMDPI,
5, showed that the peak areas were similar for the single- and double-chain surfactants, indicating similar compositions of the ion-pairs. However, with the DMDPI salt, the peak area of both surfactant
1a and
2b was essentially half of that observed in the corresponding MPI experiments, even though all concentrations were equal,
Table 3. This indicates a 2:1 relationship, with two surfactant molecules associated with one molecule of DMDPI,
5. These results indicate the ion- pair compositions illustrated in
Figure 7.


