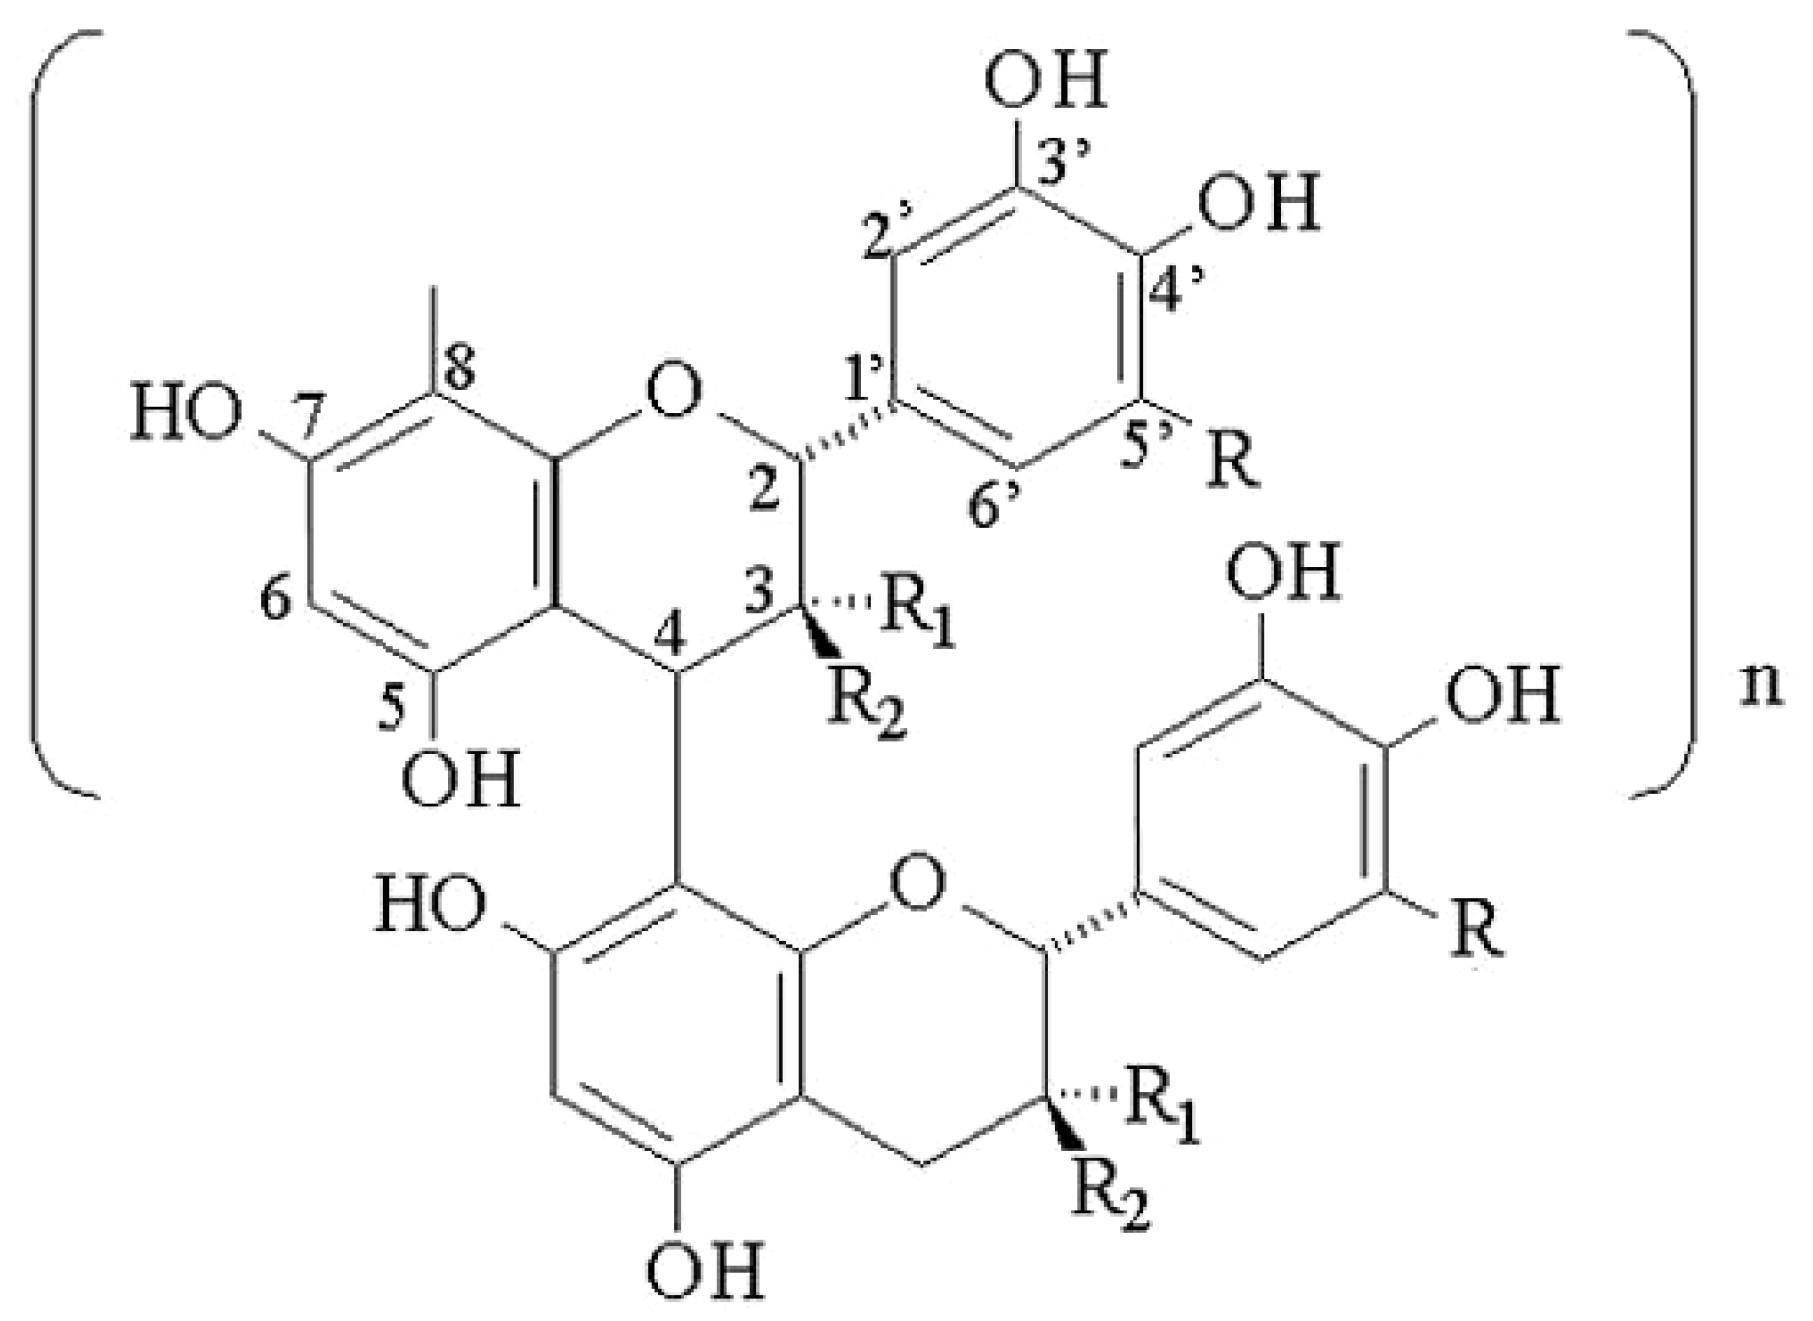
Characterization of Primary Standards for Use in the HPLC Analysis of the Procyanidin Content of Cocoa and Chocolate Containing Products

Abstract
:Introduction
Results
Discussion
Experimental
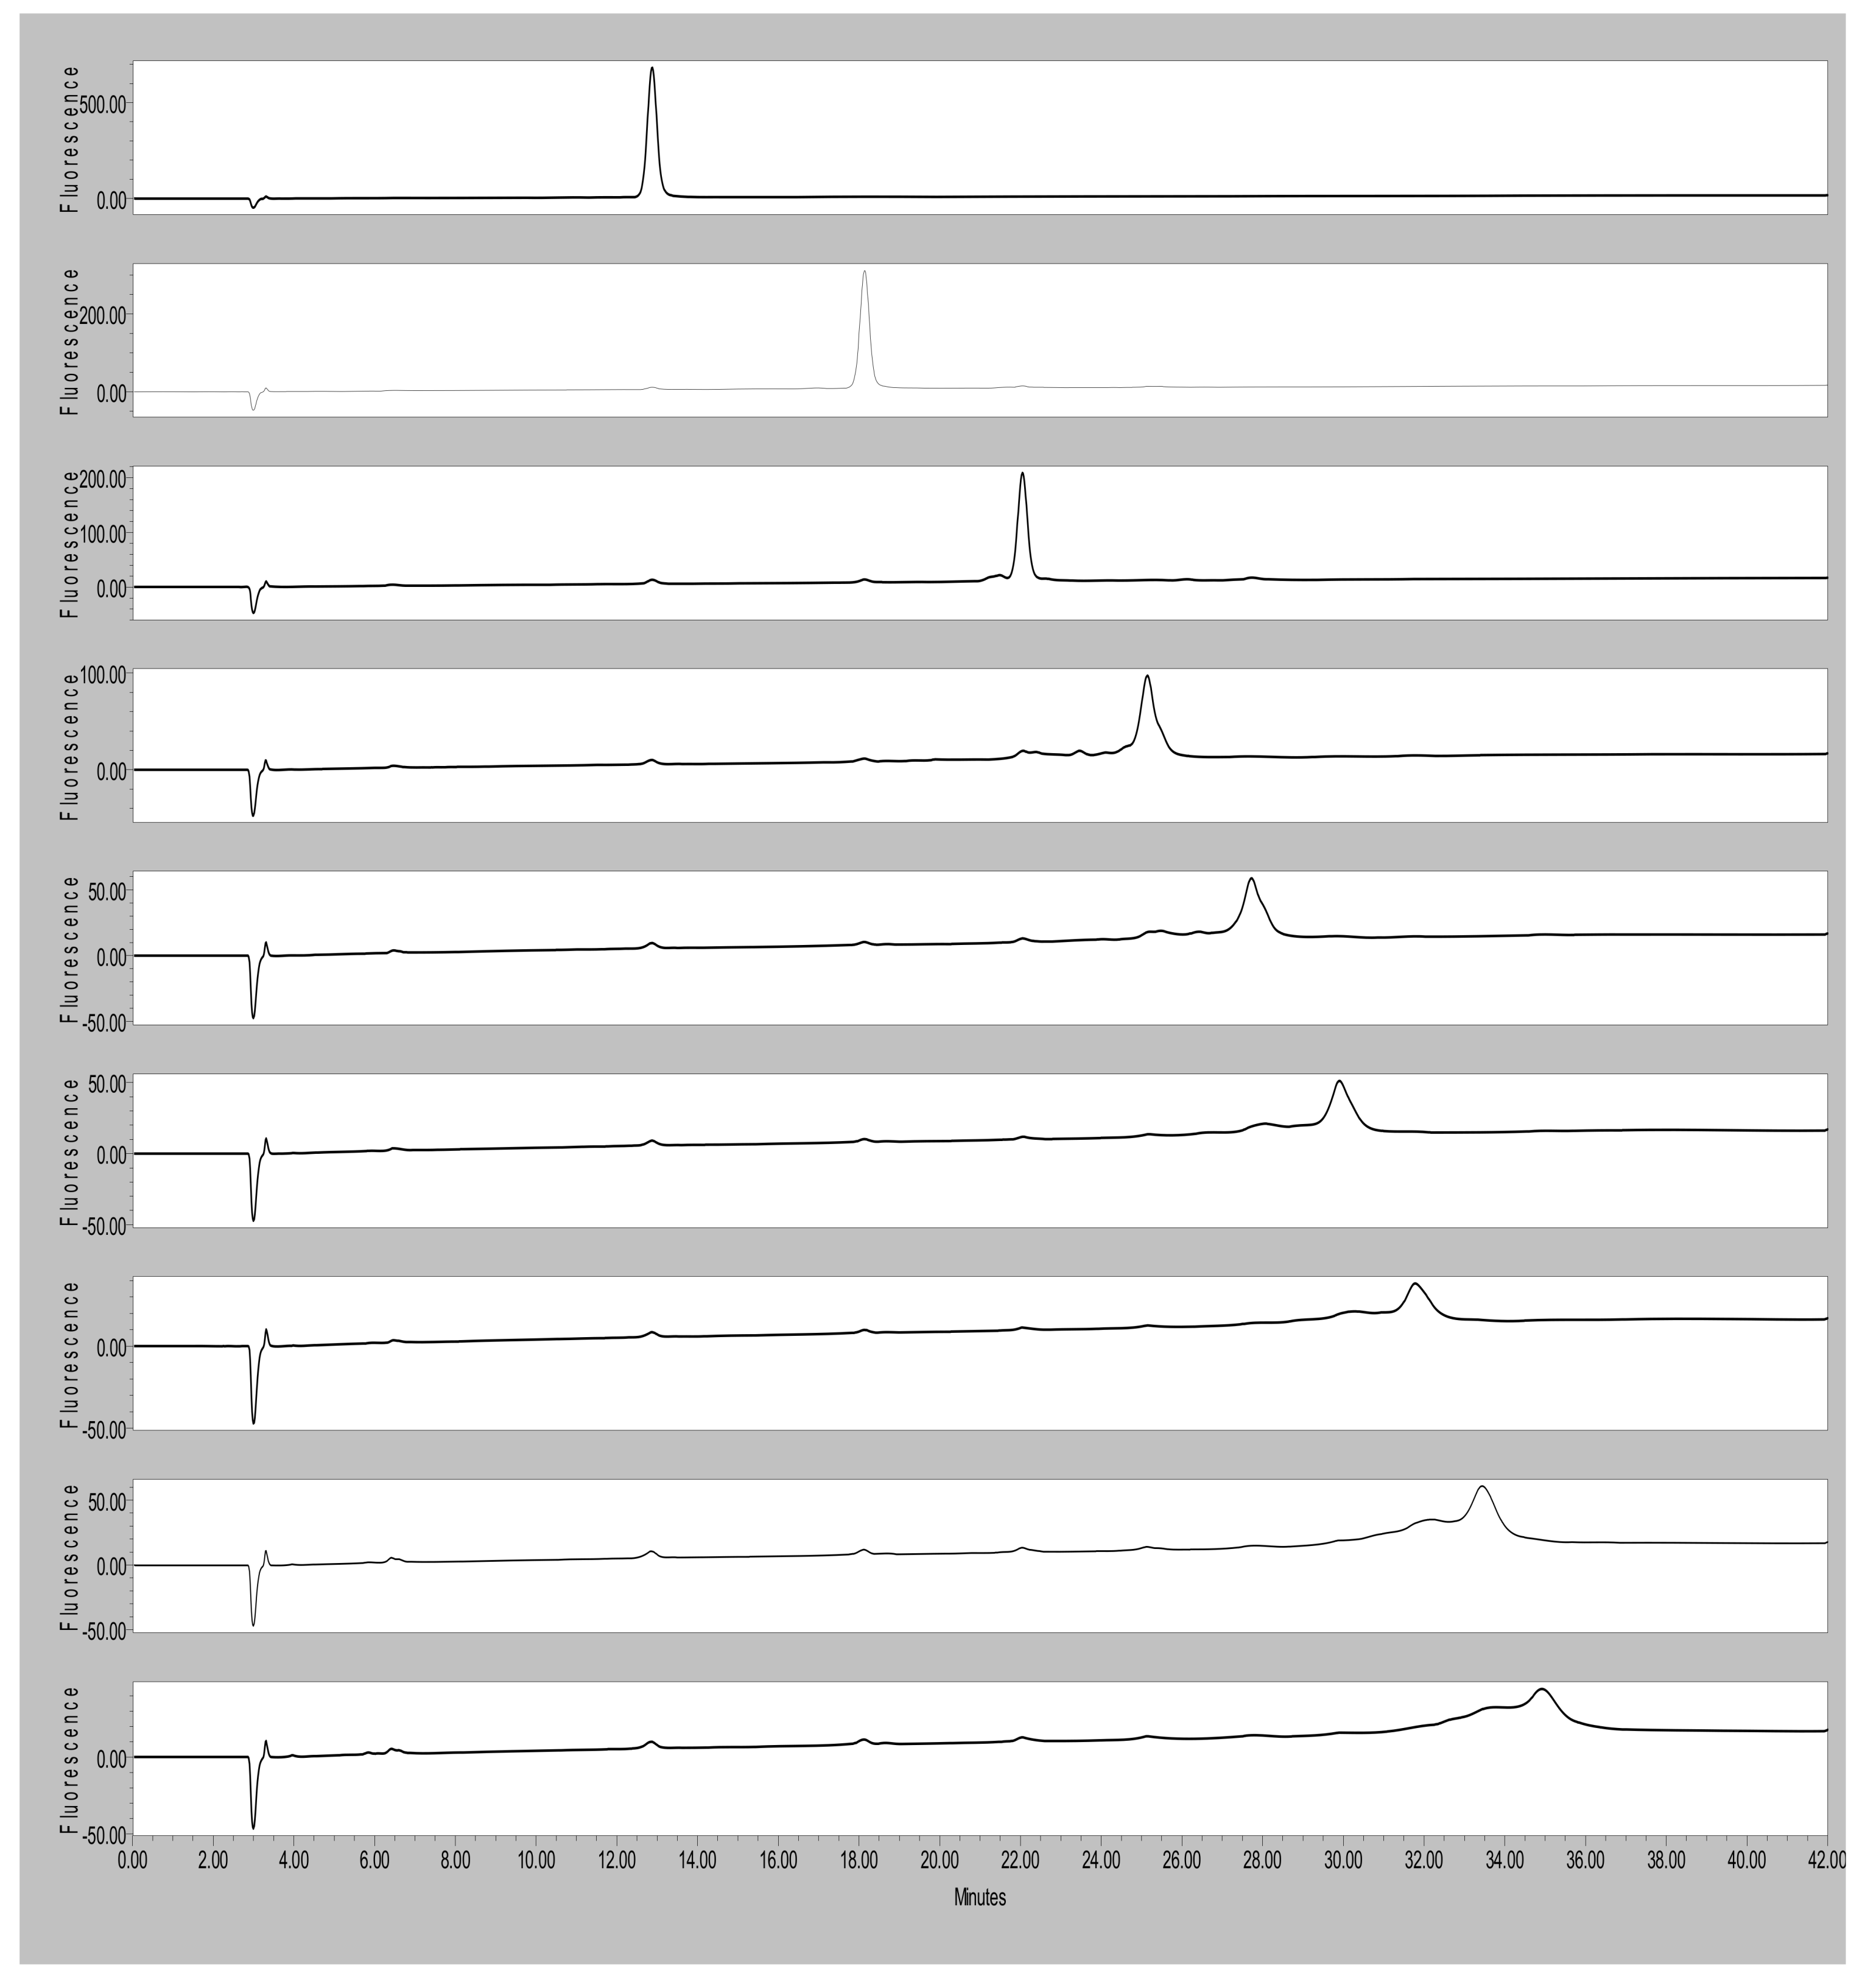
HPLC
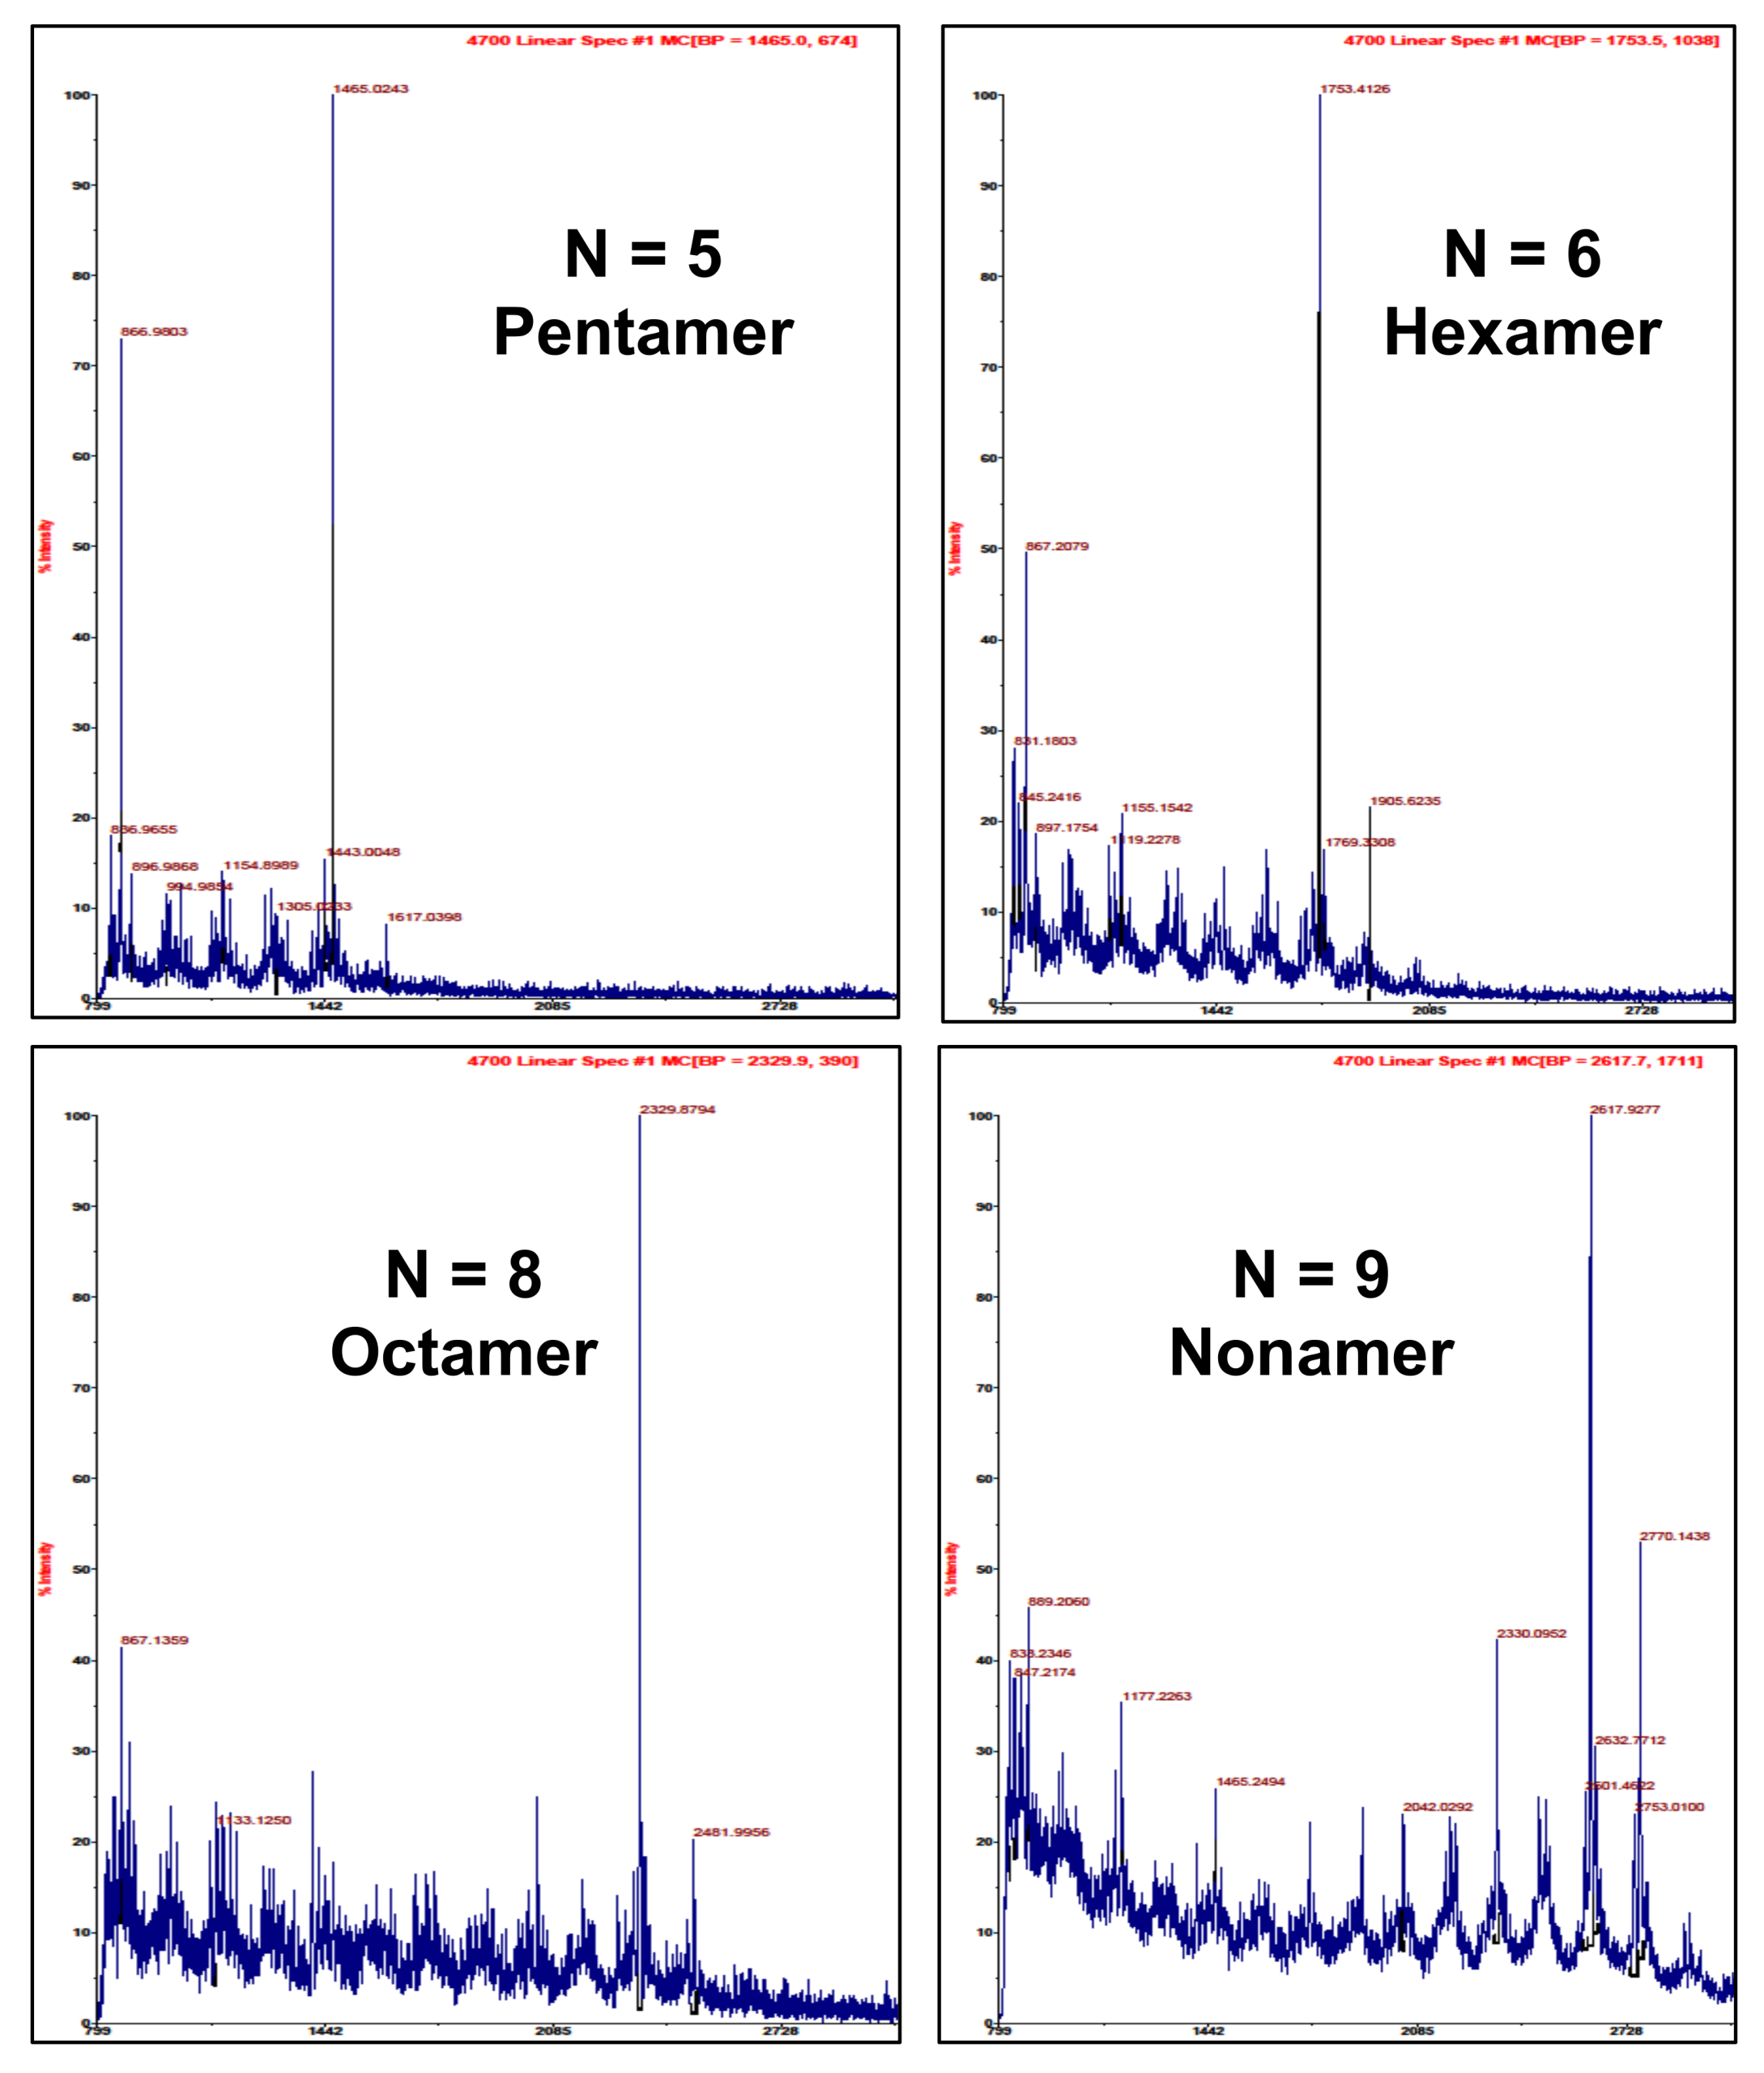
MALDI-TOF mass spectrometry
Sample Chocolate
Conclusions
References
- Haslam, E. The Flavanoids: Advances in Research; Harbourne, J., Mabry, R., Eds.; Chapman and Hall: London, UK, 1982; pp. 417–447. [Google Scholar]
- Whiting, D. Natural Phenolic Compounds 1900-2000: A Bird’s Eye View of a Century’s Chemistry. Nat. Prod. Res. 2001, 18, 583–606. [Google Scholar] [CrossRef]
- Porter, L.; Ma, Z.; Chan, G. Cacao Procyandins: Major Flavanoids and Identification of Some Minor Metabolites. Phytochemistry 1991, 30, 1657–1663. [Google Scholar] [CrossRef]
- Harbourne, J. (Ed.) Phytochemical Methods; Chapman and Hall: Dehli, India, 1998; pp. 40–96. [Google Scholar]
- Prior, R.; Gu, L. Occurrence and Biological Significance on Proanthocyanidins in the American Diet. Phytochemistry 2005, 66, 2264–2280. [Google Scholar] [CrossRef] [PubMed]
- Hummer, W.; Schreier, P. Analysis of Proanthocyanidins. Mol. Nutr. Food Res. 2008, 52, 1361–1398. [Google Scholar] [CrossRef] [PubMed]
- Prasien, J.; Wang, C.; Barnes, S. Mass Spectrometric Methods in the Determination of Flavanoids in Biological Samples. Free Radic. Biol. Med. 2004, 37, 1324–1350. [Google Scholar] [CrossRef] [PubMed]
- Hammerstone, J.; Lazarus, S.; Mitchell, A.; Rucker, R.; Schmitz, H. Identification of Procyandins in Cocoa (Theobroma cacao) and Chocolate using High Performance Liquid Chromatography/Mass Spectrometry. J. Agric. Food Chem. 1999, 47, 490–496. [Google Scholar] [CrossRef] [PubMed]
- Clapperton, J.; Hammerstone, J.; Romanczyk, L.; Yow, S.; Lim, D.; Lockwood, R. Polyphenols and Cocoa Flavour Proceedings. 16th International Conference of Groupe Polyphenols, Lisbon, Portugal, July 13–16, 1992; pp. 112–115.
- Adamson, G.; Lazarus, S.; Mitchell, A.; Prior, R.; Cao, G.; Jacobs, P.; Kremers, B.; Hammerstone, J.; Rucker, R.; Ritter, K.; Schmitz, H. HPLC Method for the Quantification of Proanthocyandins in Chocolate and Cocoa samples and Correlation to Total Antioxidant Capacity. J. Agric. Food Chem. 1999, 47, 4184–4188. [Google Scholar] [CrossRef] [PubMed]
- Schofield, P.; Mbugua, D.; Pell, A. Analysis of Condensed Tannins: A Review. Animal Food Sci. Technol. 2001, 55, 21–40. [Google Scholar] [CrossRef]
- Riguad, L.; Escrabano-Bailon, M.; Prieur, C.; Souqet, J.; Cheynier, V. Normal Phase High Performance Liquid Chromatographic Separation of Procyanidins from Cocoa beans and Grape Seeds. J. Chromatogr. A 1993, 654, 255–260. [Google Scholar] [CrossRef]
- Kelm, M.; Johnson, C.; Robbins, R.; Hammerstone, J.; Schmitz, H. High-Performance Liquid Chromatography Separation and Purification of Cacao (Theobroma cacao L.) Procyanidins According to Degree of Polymerization Using a Diol Stationary Phase. J. Agric. Food Chem. 2006, 54, 1571–1576. [Google Scholar] [CrossRef] [PubMed]
- Cho, D.; Mattice, W.; Porter, L.; Hemingway, R. Use of Fluorescence Quantum Yield for the Determination of Number Average Molecular Weight of Polymers of Epicatechin with 4β-8 Interflavan Bond. Polymer 1998, 30, 1955–1958. [Google Scholar] [CrossRef]
- Reed, J.; Krueger, C.; Vestling, M. MALDI-TOF Mass Spectrometry of Oligomeric Food Polyphenols. Phytochemistry 2005, 66, 2248–2263. [Google Scholar] [CrossRef] [PubMed]
- Flamini, R. Mass Spectrometry in Grape and Wine Chemistry. Part I: Polyphenols. Mass Spectrom. Rev. 2003, 22, 218–250. [Google Scholar] [CrossRef] [PubMed]
Sample Availability: The compounds are available from Planta Analytica. |


| Cocoa Procyanidin Oligomers | m/z a |
|---|---|
| Dimer; DP = 2 | 601 |
| Trimer; DP = 3 | 889 |
| Tetramer; DP = 4 | 1,177 |
| Pentamer; DP = 5 | 1,465 |
| Hexamer; DP = 6 | 1,753 |
| Heptamer; DP = 7 | 2,041 |
| Octamer; DP = 8 | 2,329 |
| Nonamer; DP = 9 | 2,617 |
| Decamer; DP = 10 | 2,907 |
| Cocoa Procyanidin Oligomers | Estimated Purity (%) |
|---|---|
| Dimer; DP = 2 | 96 |
| Trimer; DP = 3 | 88 |
| Tetramer; DP = 4 | 85 |
| Pentamer; DP = 5 | 70 |
| Hexamer; DP = 6 | 70 |
| Heptamer; DP = 7 | 70 |
| Octamer; DP = 8 | 65 |
| Nonamer; DP = 9 | 60 |
| Decamer; DP = 10 | 50 |
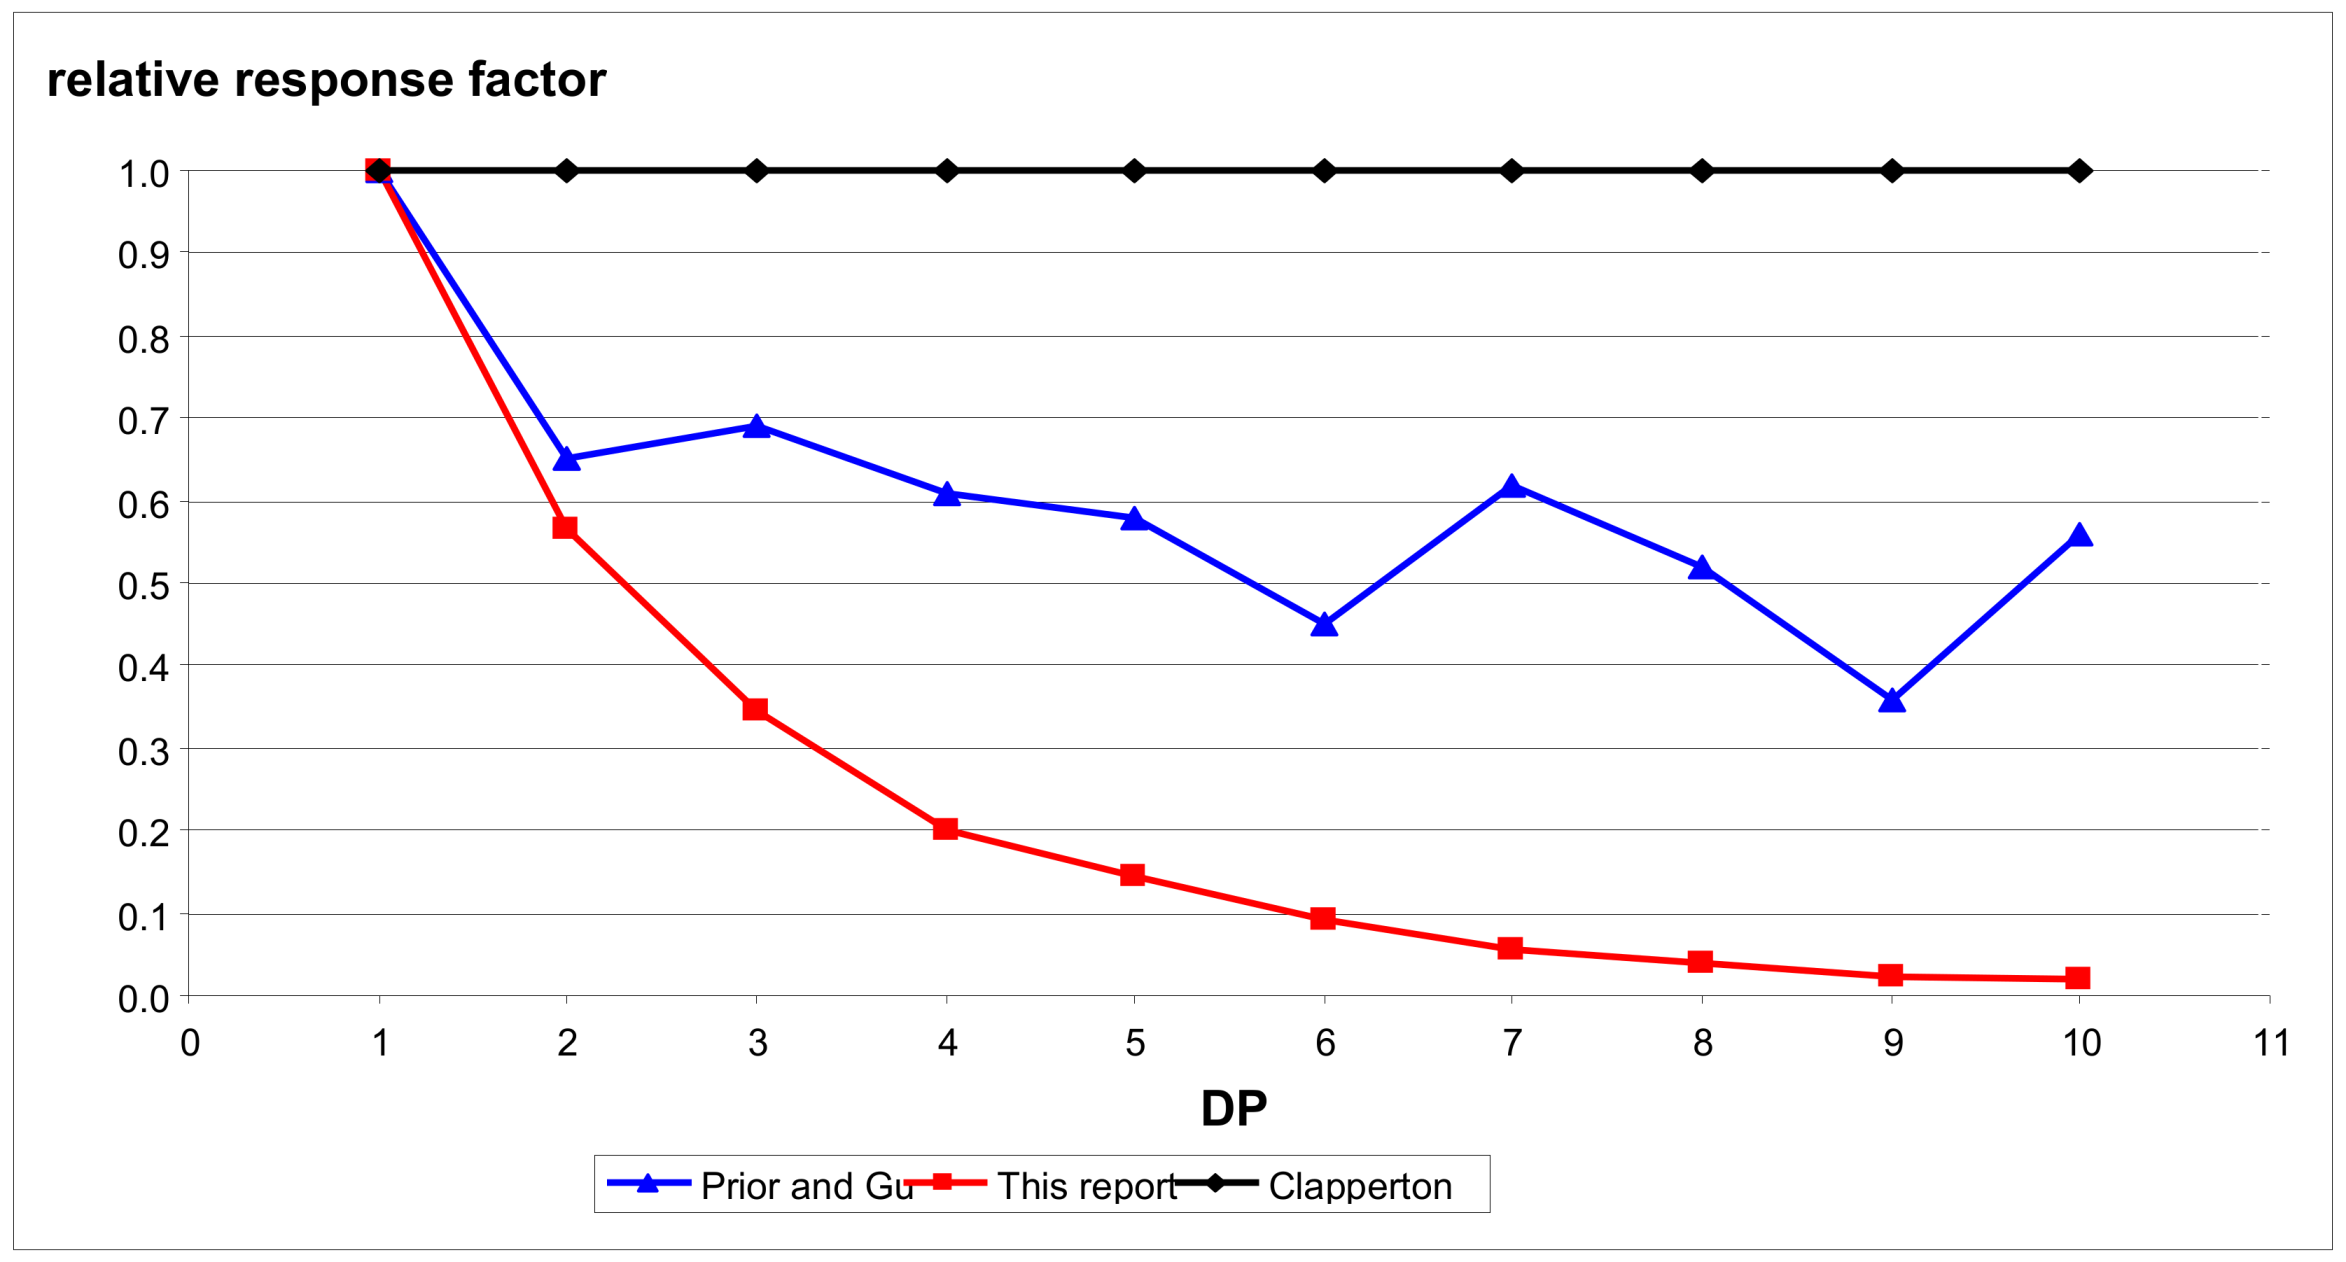
| Cocoa Oligomer | Standard described in this manuscript | Prior and Gu [5] | Clapperton et al. [9] |
|---|---|---|---|
| Monomer; DP = 1 | 1.00 | 1.00 | 1.00 |
| Dimer; DP = 2 | 0.57 | 0.65 | 1.00 |
| Trimer; DP = 3 | 0.35 | 0.69 | 1.00 |
| Tetramer; DP = 4 | 0.20 | 0.61 | 1.00 |
| Pentamer; DP = 5 | 0.15 | 0.58 | 1.00 |
| Hexamer; DP = 6 | 0.09 | 0.45 | 1.00 |
| Heptamer; DP = 7 | 0.06 | 0.62 | 1.00 |
| Octamer; DP = 8 | 0.04 | 0.52 | 1.00 |
| Nonamer; DP = 9 | 0.03 | 0.36 | 1.00 |
| Decamer; DP = 10 | 0.02 | 0.56 | 1.00 |
| Cocoa Oligomer | RF of this Manuscript | RF of Prior and Gu [5] | RF of Clapperton et al. [9] |
|---|---|---|---|
| Monomer | 0.50 ± 0.029 | 0.50 | 0.50 |
| DP = 2 | 0.27 ± 0.022 | 0.20 | 0.133 |
| DP = 3 | 0.18 ± 0.015 | 0.084 | 0.056 |
| DP = 4 | 0.26 ± 0.035 | 0.063 | 0.042 |
| DP = 5 | 0.18 ± 0.037 | 0.049 | 0.028 |
| DP = 6 | 0.19 ± 0.074 | 0.042 | 0.021 |
| DP = 7 | 0.13 ± 0.017 | 0.007 | 0.0063 |
| DP = 8 | 0.09 ± 0.015 | 0.0035 | 0.0021 |
| DP = 9 | 0.07 ± 0.018 | 0.0035 | 0.0014 |
| DP = 10 | 0.07 ± 0.029 | 0.0021 | 0.0007 |
| TOTAL | 1.66 | 0.954 | 0.788 |
| Time, min | flow | %A | %B | Curve | |
|---|---|---|---|---|---|
| 1 | 1.00 | 100.0 | 0.0 | ||
| 2 | 35.00 | 1.00 | 60.0 | 40.0 | 6 |
| 3 | 39.00 | 1.00 | 60.0 | 40.0 | 6 |
| 4 | 41.00 | 1.00 | 0.0 | 100.0 | 6 |
| 5 | 47.00 | 1.00 | 0.0 | 100.0 | 6 |
| 6 | 51.00 | 1.00 | 100.0 | 0.0 | 6 |
© 2009 by the authors; licensee Molecular Diversity Preservation International, Basel, Switzerland. This article is an open-access article distributed under the terms and conditions of the Creative Commons Attribution license (http://creativecommons.org/licenses/by/3.0/).
Share and Cite
Hurst, W.J.; Stanley, B.; Glinski, J.A.; Davey, M.; Payne, M.J.; Stuart, D.A. Characterization of Primary Standards for Use in the HPLC Analysis of the Procyanidin Content of Cocoa and Chocolate Containing Products. Molecules 2009, 14, 4136-4146. https://doi.org/10.3390/molecules14104136
Hurst WJ, Stanley B, Glinski JA, Davey M, Payne MJ, Stuart DA. Characterization of Primary Standards for Use in the HPLC Analysis of the Procyanidin Content of Cocoa and Chocolate Containing Products. Molecules. 2009; 14(10):4136-4146. https://doi.org/10.3390/molecules14104136
Chicago/Turabian StyleHurst, William J., Bruce Stanley, Jan A. Glinski, Matthew Davey, Mark J. Payne, and David A. Stuart. 2009. "Characterization of Primary Standards for Use in the HPLC Analysis of the Procyanidin Content of Cocoa and Chocolate Containing Products" Molecules 14, no. 10: 4136-4146. https://doi.org/10.3390/molecules14104136