Simple Sequence Repeat Polymorphisms (SSRPs) for Evaluation of Molecular Diversity and Germplasm Classification of Minor Crops

Abstract
:Introduction
Molecular Genetic Markers in Plants

| Isozyme | RFLP | RAPD | AFLP | SSR | SNP | |
|---|---|---|---|---|---|---|
| Abundance | Low | Medium | Very high | Very high | High | Very high |
| Types of polymorphism | Amino acid change in polypeptide | Single base change, insertion, deletion, inversion | Single base change, insertion, deletion, inversion | Single base change, insertion, deletion, inversion | Repeat length variation | Single base change |
| DNA quality | - | High | Medium | High | Medium | Medium |
| DNA sequence information | - | Not required | Not required | Not required | Required | Required |
| Level of polymorphism | Low | Medium | High | High | High | High |
| Inheritance | Co-dominance | Co-dominance | Dominance | Dominance | Co-dominance | Co-dominance |
| Reproducibility | Medium | High | Low | Medium | High | High |
| Technical complexity | Medium | High | Low | Medium | Low | Medium |
| Developmental cost | Medium | High | Low | Low | High in start | High |
| Species Transferribility | High | Medium | High | High | Medium | Low |
| Automation | Low | Low | Medium | Medium | High | High |
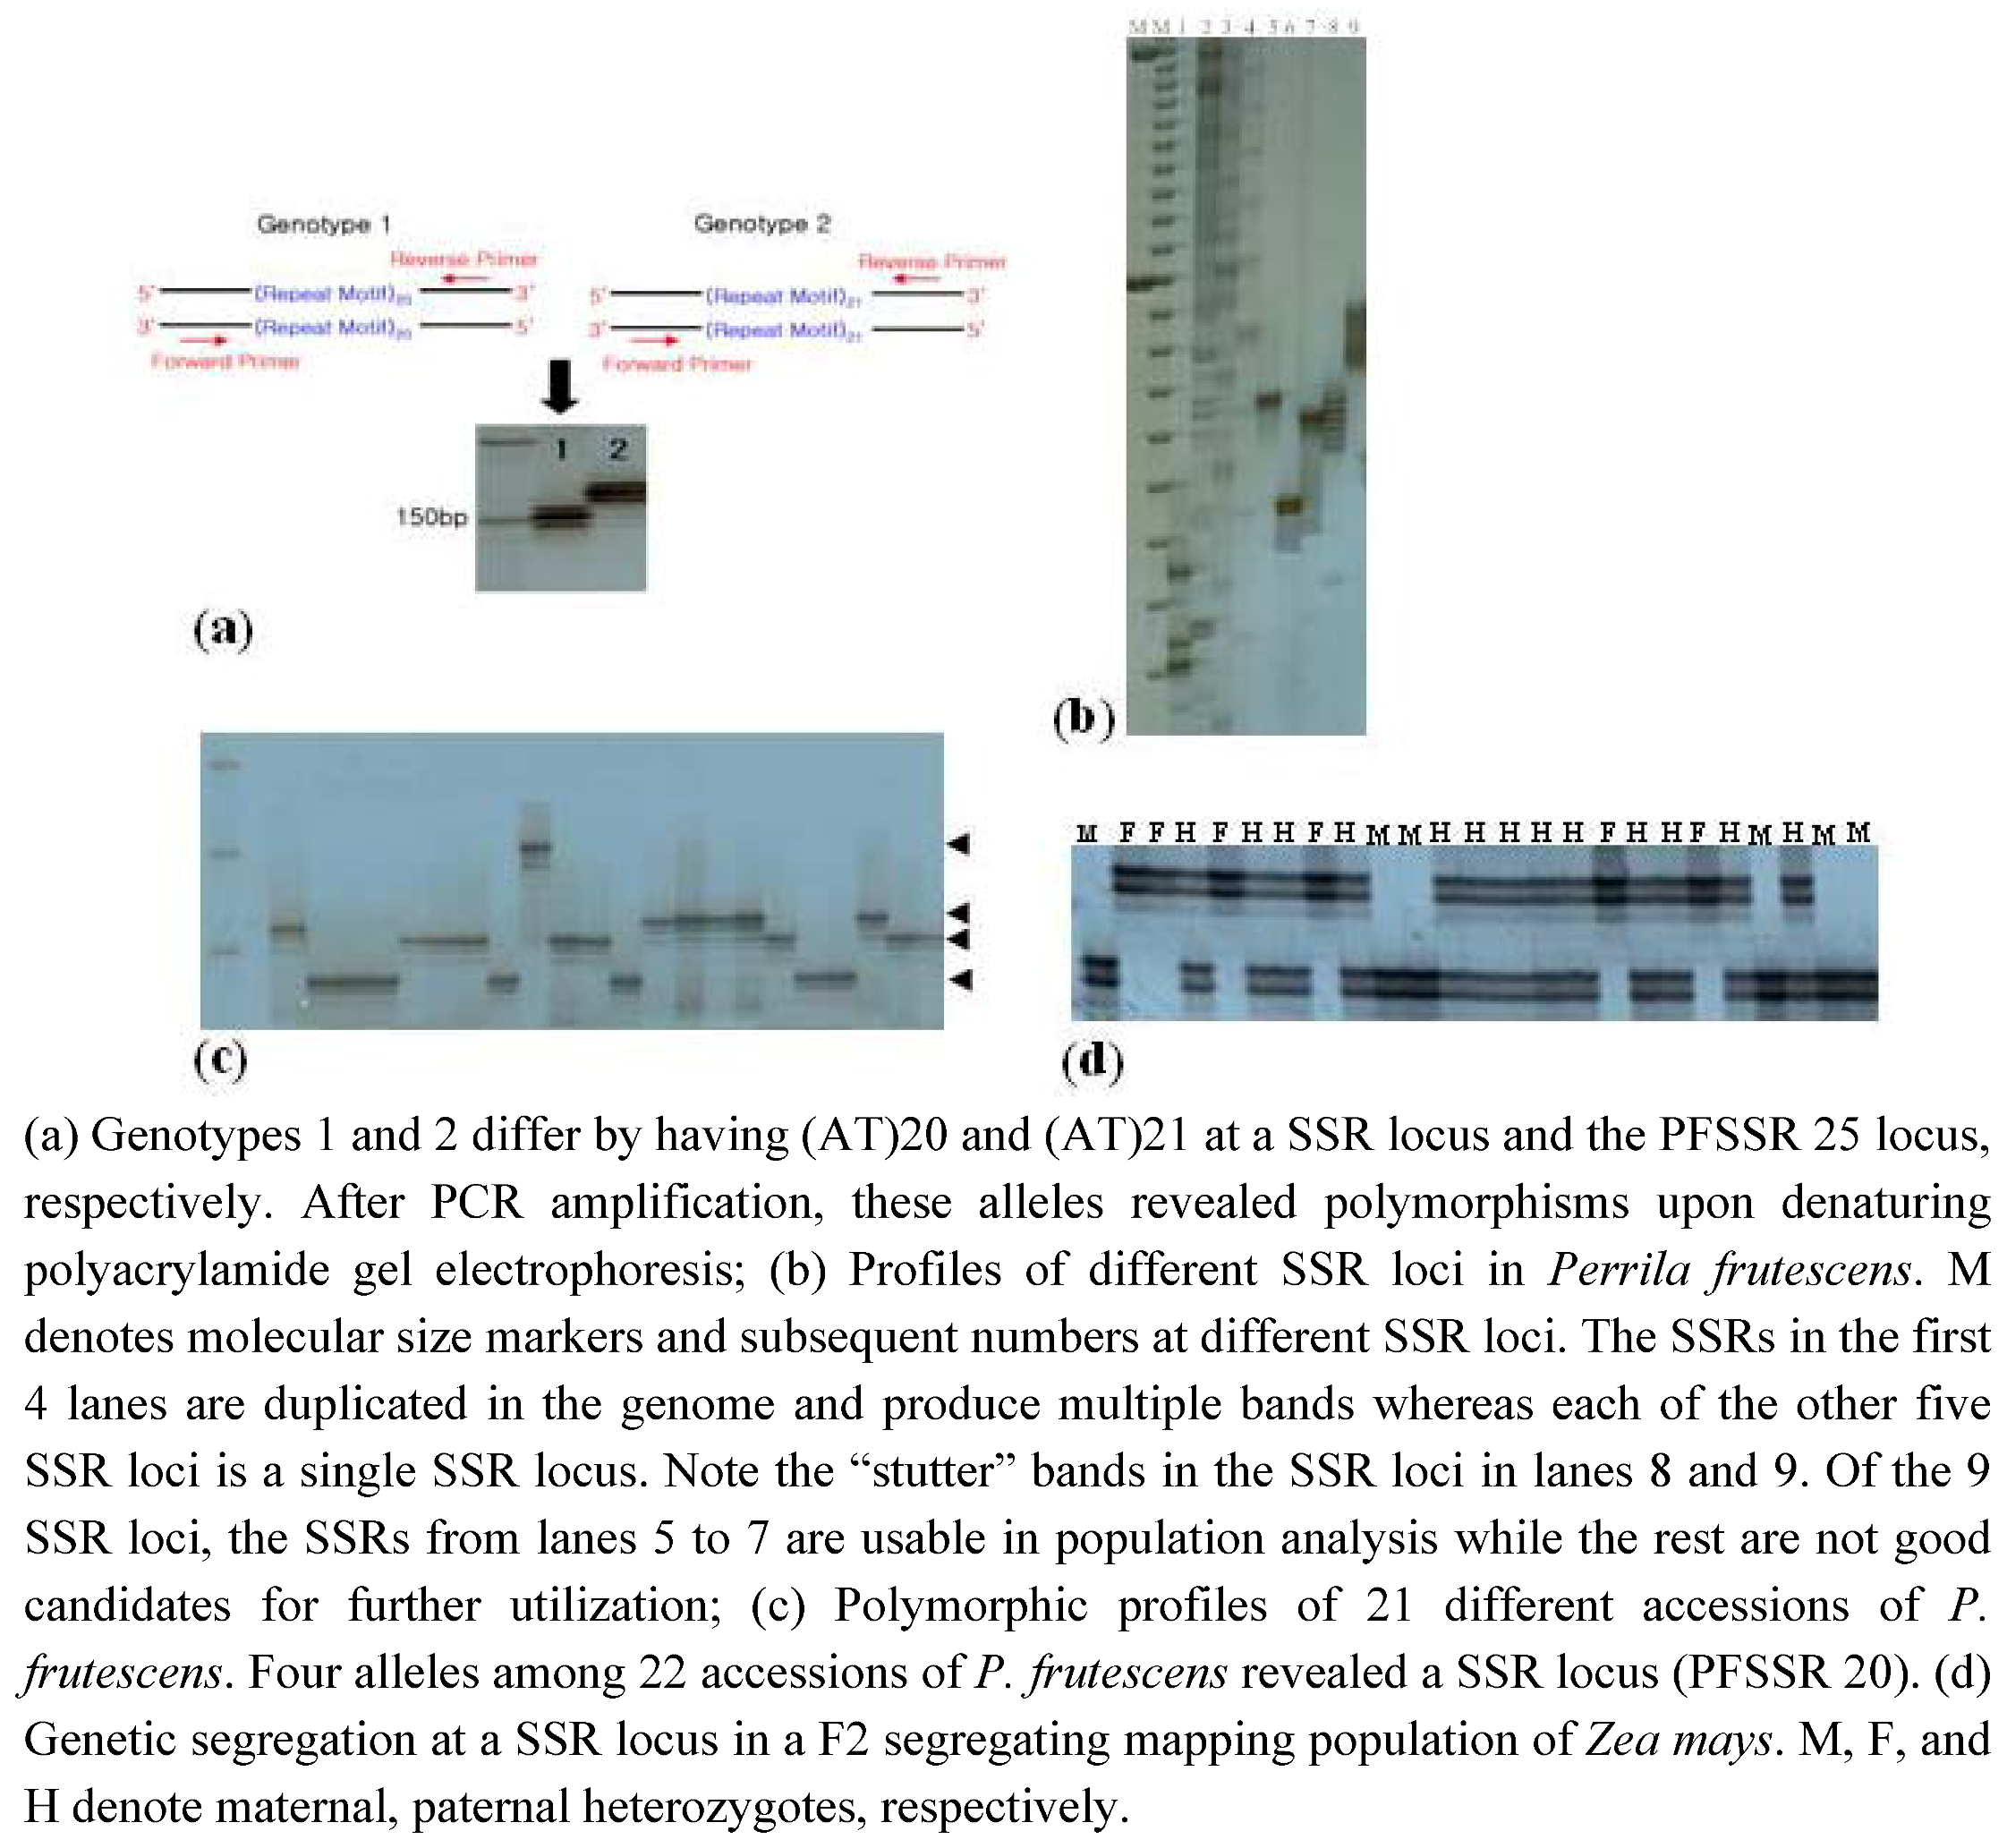
What Are SSRs?

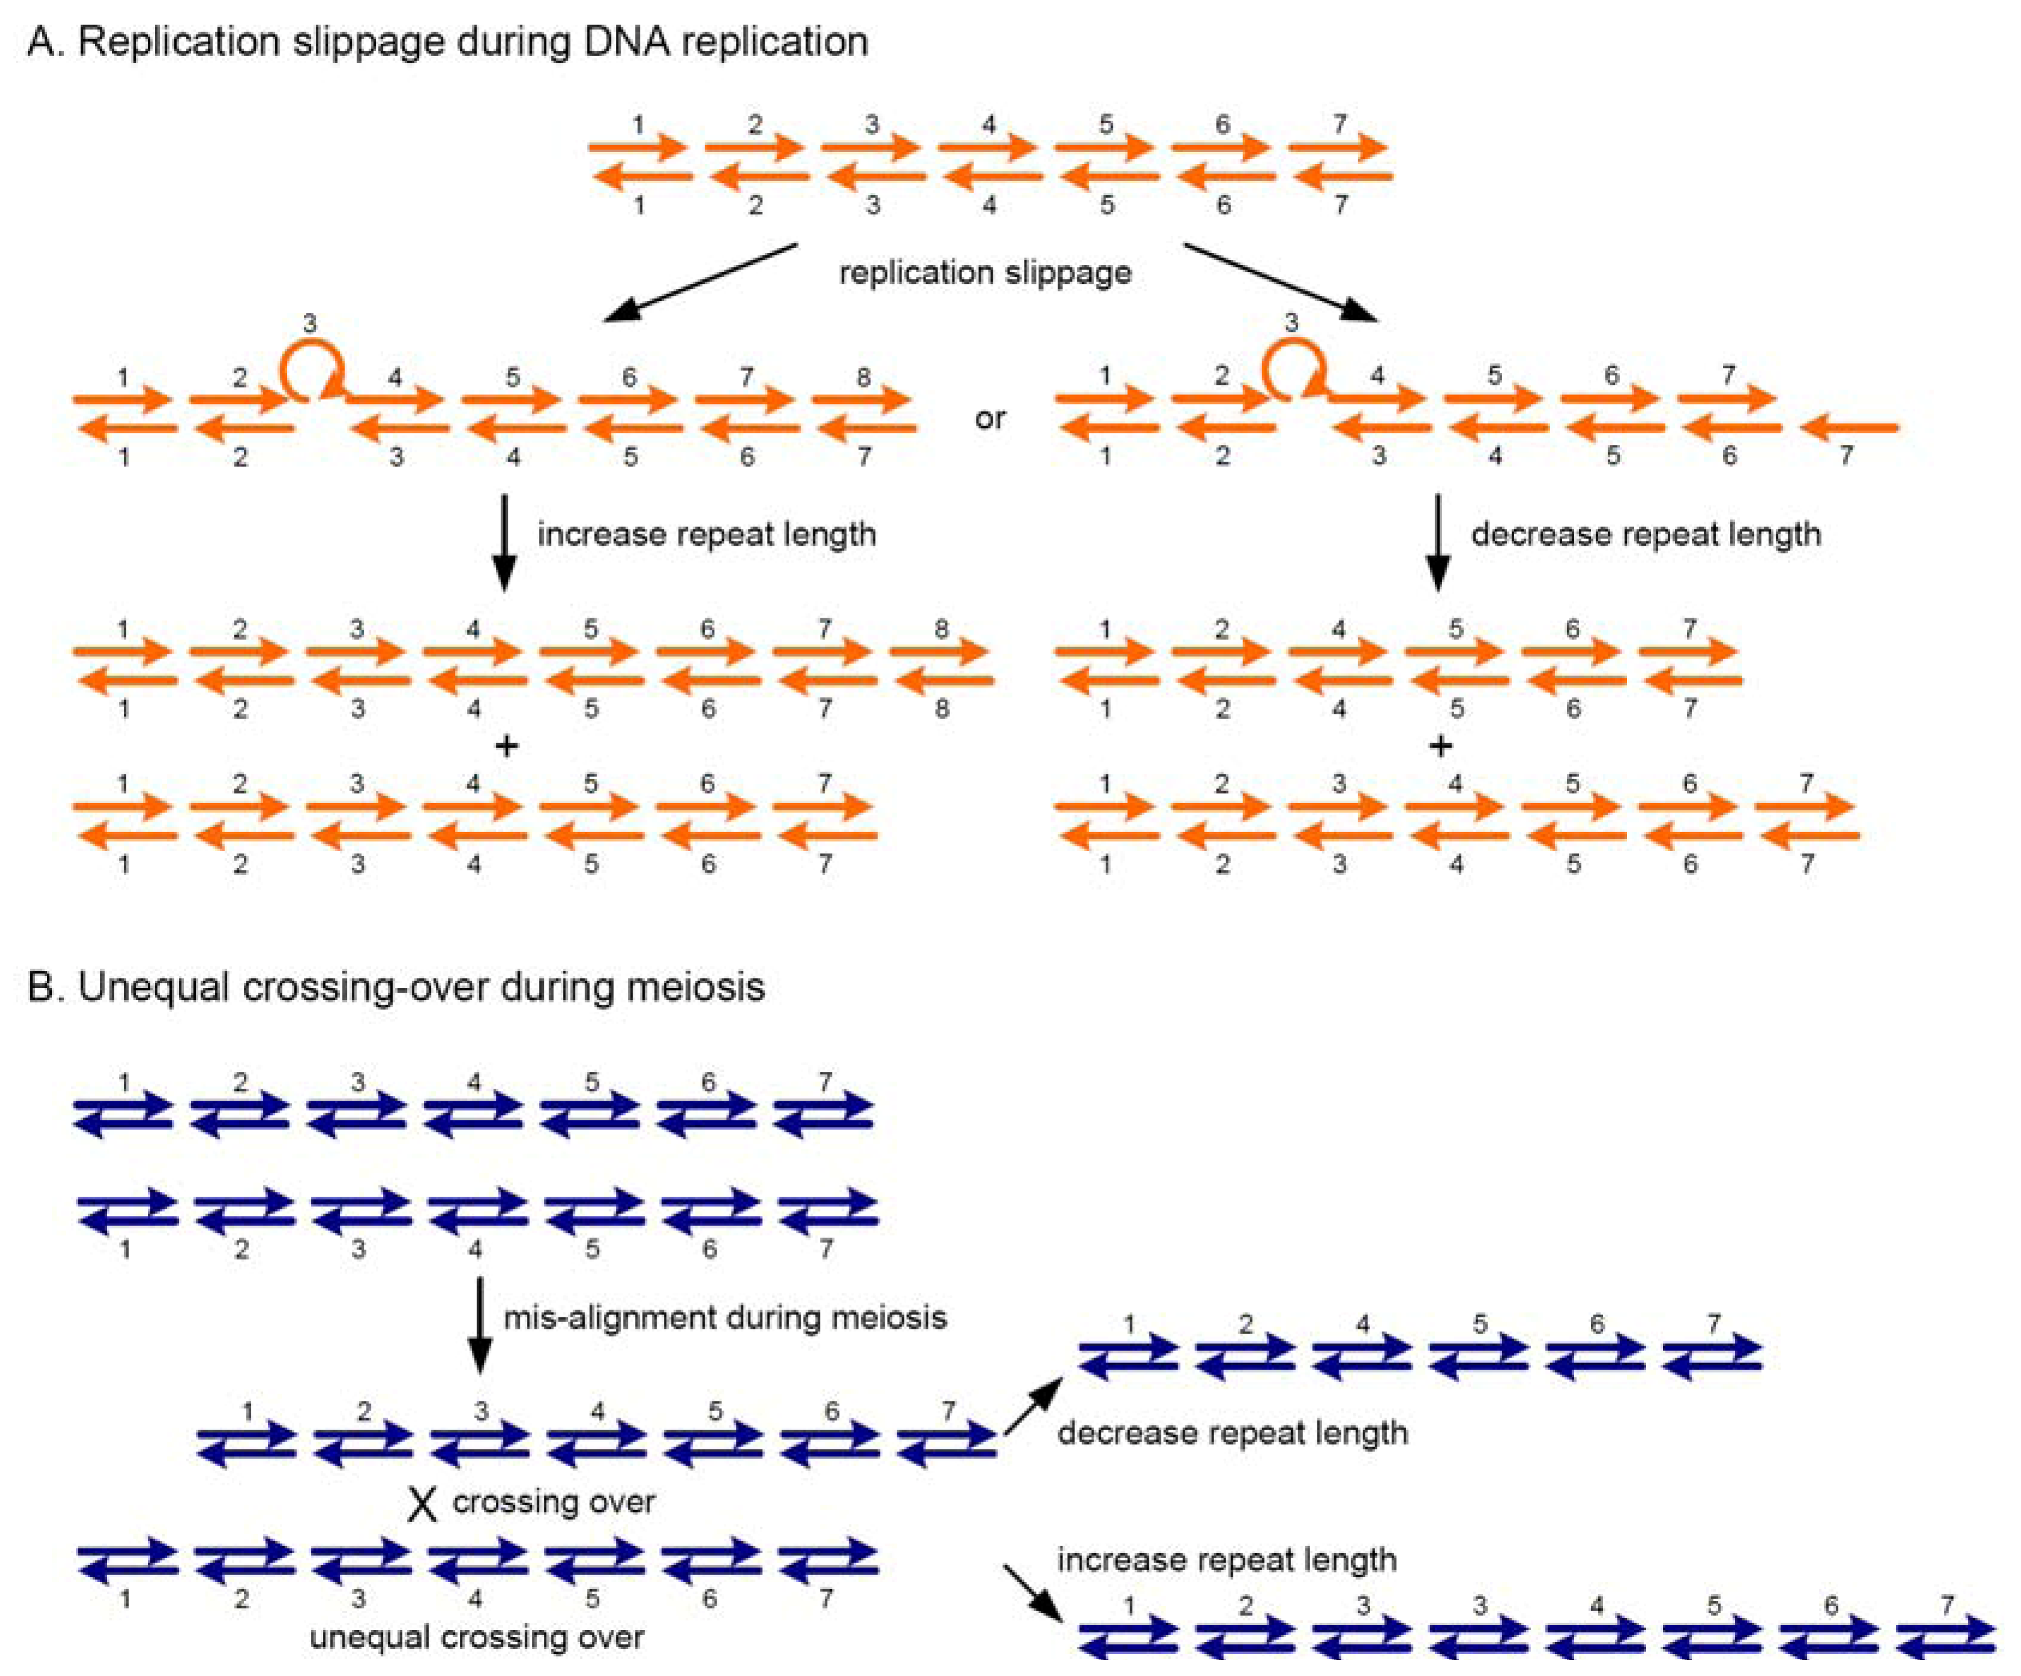
How Did SSRPs Arise?

How Do We Develop SSRs?


Advantages of SSR Analysis
Problems with SSRPs
| Sub-species | Electromorph (size in bp) | Core sequence |
|---|---|---|
| Apis mellifera | 214 | (TC)2C(TC)2TT(TC)4TT(TC)2TT(TC)9GTTTCG(TC)2 |
| Apis ligustica | 214 | (TC)2C(TC)2TT(TC)4TT(TC)2TT(TC)9GTTTCG(TC)2 |
| Apis scutellata | 214 | (TC)2C(CT)2TT(TC)5TT(TC)11GTTTCG(TC)2 |
| Apis capensis | 214 | (TC)2C(CT)2TT(TC)5TT(TC)11GTTTCG(TC)2 |
Cross-Species Applications
Biological Functions of SSRs
Germplasm Collections and Development of SSRs in Minor Crops
Concluding Remarks
Acknowledgements
- Sample availability: Not available.
References
- Frankel, O.H. Genetic Perspectives of Germplasm Conservation. In Genetic Manipulation: Impact On Man And Society; Arber, W.K., Llimensee, K., Peacock, W.J., Starlinger, P., Eds.; Cambridge University Press: Cambridge, UK, 1984; pp. 161–170. [Google Scholar]
- Yonezawa, K. A definition of the optimal allocation of effort in conservation of plant genetic resources-with application to sample size determination for field collection. Euphytica 1985, 34, 345–354. [Google Scholar] [CrossRef]
- Brown, A.H.D. Core collections: A practical approach to genetic resources management. Genome 1989, 31, 818–824. [Google Scholar] [CrossRef]
- Hedrick, P.W. Genetics of Population, 3rd ed; Jones and Bartlett Pub. Co: Sudbury, MA, USA, 2005. [Google Scholar]
- Ouborg, N.J.; Vergeer, P.; Mix, C. The rough edges of the conservation genetics paradigm for plants. Ecology 2006, 94, 1233–1248. [Google Scholar] [CrossRef]
- Thomas, R.G. Pleiotropism and the developmental changes correlated with flowering. Genetica 1960, 31, 329–339. [Google Scholar] [CrossRef]
- Brown, A.H.D. Isozymes, plant population genetic structure and genetic conservation. Theor. Appl. Genet. 1978, 52, 145–157. [Google Scholar]
- Bretting, P.K.; Widrlechner, M.P. Genetic markers and plant genetic resource management. Plant Breed. Rev. 1995, 13, 11–86. [Google Scholar]
- Karp, A.; Edwards, K.J. DNA markers: A Global Overview. In DNA Markers: Protocols, Applications, And Overviews; Caetano-Anolles, G., Greshoff, P.M., Eds.; Wiley-VCH Inc.: New York, NY, USA, 1997; pp. 1–13. [Google Scholar]
- Sturtevant, A.H. The linear arrangement of six sex-linked factors in Drosophila, as shown by their mode of association. J. Exp. Zool. Part B 1913, 14, 43–59. [Google Scholar] [CrossRef]
- Sax, K. The association of size differences with seed-coat pattern and pigmentation in Phaseolus vulgaris. Genetics 1923, 8, 552–560. [Google Scholar]
- Scandalios, J.G. Genetic control of multiple molecular forms of enzymes in plants: A review. Biochem. Genet. 1969, 3, 37–79. [Google Scholar] [CrossRef]
- Hamrick, J.L.; Linhart, Y.B.; Mitton, J.B. Relationships between life history characteristics and electrophoretically detectable genetic variation in plants. Annu. Rev. Ecol. Syst. 1979, 10, 173–200. [Google Scholar]
- Botstein, D.; White, R.L.; Skolnick, M.; Davis, R.W. Construction of a genetic linkage map in man using restriction fragment length polymorphisms. Am. J. Hum. Genet. 1980, 32, 314–331. [Google Scholar]
- Helentjaris, T.; King, G.; Slocum, M.; Siedenstrang, C.; Wegman, S. Restriction fragment polymorphisms as probes for plant diversity and their development as tools for applied plant breeding. Plant Mol. Biol. 1985, 5, 109–118. [Google Scholar] [CrossRef]
- Chang, C.; Bowman, J.L.; DeJohn, A.W.; Lander, E.S.; Meyerowitz, E.M. Restriction fragment length polymorphism linkage map for Arabidopsis thaliana. Proc. Natl. Acad. Sci. USA 1988, 85, 6856–6860. [Google Scholar]
- Tanksley, S.D.; Young, N.D.; Paterson, A.H.; Bonierbale, M.W. RFLP mapping in plant breeding: New tools for an old science. Nat. Biotechnol. 1989, 7, 257–264. [Google Scholar]
- Jeffreys, A.J.; Wilson, V.; Thein, S.L. Individual-specific‘fingerprints’ of human DNA. Nature 1985, 316, 76–79. [Google Scholar] [CrossRef]
- Jeffreys, A.J.; Wilson, V.; Neumann, R.; Keyte, J. Amplification of human minisatellites by the polymerase chain reaction: Towards DNA fingerprinting of single cells. Nucleic Acids Res. 1988, 16, 10953–10971. [Google Scholar] [CrossRef]
- Weising, K.; Nybom, H.; Wolff, K. DNA Fingerprinting in Plants: Principles, Methods, and Applications. CRC Press: London, UK, 2005. [Google Scholar]
- Nybom, H.; Hall, H.K. Minisatellite DNA ‘fingerprints’ can distinguish Rubus cultivars and estimate their degree of relatedness. Euphytica 1991, 53, 107–114. [Google Scholar] [CrossRef]
- Ouborg, N.J.; Piquot, Y.; Van Groenendael, J.M. Population genetics, molecular markers and the study of dispersal in plants. J. Ecol. 1999, 551–568. [Google Scholar]
- Kim, N.S.; Park, N.I.; Kim, S.H.; Kim, S.T.; Han, S.S.; Kang, K.Y. Isolation of TC/AG repeat microsatellite sequences for fingerprinting rice blast fungus and their possible horizontal transfer to plant species. Mol. Cells 2000, 10, 127–134. [Google Scholar] [CrossRef]
- Dallas, J.F. Detection of DNA``Fingerprints''of cultivated rice by hybridization with a human minisatellite DNA Probe. Proc. Natl. Acad. Sci. USA 1988, 85, 6831–6835. [Google Scholar] [CrossRef]
- Mullis, K.; Faloona, F.; Scharf, S.; Saiki, R.; Horn, G.; Erlich, H. Specific enzymatic amplification Of Dna in vitro: The polymerase chain reaction. Cold Spring Harb. Symp. Quant. Biol. 1986, 51, 263–273. [Google Scholar] [CrossRef]
- Williams, J.G.; Kubelik, A.R.; Livak, K.J.; Rafalski, J.A.; Tingey, S.V. DNA polymorphisms amplified by arbitrary primers are useful as genetic markers. Nucleic Acids Res. 1990, 18, 6531–6535. [Google Scholar] [CrossRef]
- Welsh, J.; McClelland, M. Fingerprinting genomes using PCR with arbitrary primers. Nucleic Acids Res. 1990, 18, 7213–7218. [Google Scholar] [CrossRef]
- Lynch, M.; Milligan, B.G. Analysis of population genetic structure with RAPD markers. Mol. Ecol. 1994, 3, 91–99. [Google Scholar] [CrossRef]
- Jones, C.J.; Edwards, K.J.; Castaglione, S.; Winfield, M.O.; Sala, F.; Van de Wiel, C.; Bredemeijer, G.; Vosman, B.; Matthes, M.; Daly, A. Reproducibility testing of RAPD, AFLP and SSR markers in plants by a network of European laboratories. Mol. Breed. 1997, 3, 381–390. [Google Scholar] [CrossRef]
- Monna, L.; Miyao, A.; Inoue, T.; Fukuoka, S.; Yamazaki, M.; Zhong, H. S.; Sasaki, T.; Minobe, Y. Determination of RAPD markers in rice and their conversion into sequence tagged sites (STSs) and STS-specific primers. DNA Res. 1994, 1, 139–148. [Google Scholar] [CrossRef]
- Brady, J.L.; Scott, N.S.; Thomas, M.R. DNA typing of hops (Humulus lupulus) through application of RAPD and microsatellite marker sequences converted to sequence tagged sites (STS). Euphytica 1996, 91, 277–284. [Google Scholar] [CrossRef]
- Komatsuda, T.; Nakamura, I.; Takaiwa, F.; Oka, S. Development of STS markers closely linked to the vrs1 locus in barley, Hordeum vulgare. Genome 1998, 41, 680–685. [Google Scholar]
- Godwin, I.D.; Aitken, E.A.B.; Smith, L.W. Application of inter simple sequence repeat (ISSR) markers to plant genetics. Electrophoresis 1997, 18, 1524–1528. [Google Scholar] [CrossRef]
- Nagaraju, J.; Kathirvel, M.; Kumar, R.R.; Siddiq, E.A.; Hasnain, S.E. Genetic analysis of traditional and evolved Basmati and non-Basmati rice varieties by using fluorescence-based ISSR-PCR and SSR markers. Proc. Natl. Acad. Sci. USA 2002, 99, 5836–5841. [Google Scholar] [CrossRef]
- Vos, P.; Hogers, R.; Bleeker, M.; Reijans, M.; Van De Lee, T.; Hornes, M.; Frijters, A.; Pot, J.; Peleman, J.; Kuiper, M. AFLP: A new technique for DNA fingerprinting. Nucleic Acids Res. 1995, 23, 4407–4414. [Google Scholar] [CrossRef]
- Donini, P.; Koebner, R.M.D.; Elias, M.L.; Bougourd, S.M. AFLP fingerprinting reveals pattern differences between template DNA extracted from different plant organs. Genome 1997, 40, 521–526. [Google Scholar] [CrossRef]
- Dowling, T.E.; Moritz, C.; Palmer, J.D.; Rieseberg, L.H. Nucleic acids III: Analysis of fragments and restriction sites. In Molecular Systematics; Hillis, D.M., Moritz, C., Richardson, L., Eds.; Sunauer: Sundrland, MA, USA, 1996; pp. 249–321. [Google Scholar]
- Mueller, U.G.; Wolfenbarger, L.L.R. AFLP genotyping and fingerprinting. Trends Ecol. Evol. 1999, 14, 389–394. [Google Scholar] [CrossRef]
- Kruglyak, L.; Nickerson, D.A. Variation is the spice of life. Nat. Genet. 2001, 27, 234–236. [Google Scholar] [CrossRef]
- Nasu, S.; Suzuki, J.; Ohta, R.; Hasegawa, K.; Yui, R.; Kitazawa, N.; Monna, L.; Minobe, Y. Search for and analysis of single nucleotide polymorphisms (SNPs) in rice (Oryza sativa, Oryza rufipogon) and establishment of SNP markers. DNA Res. 2002, 9, 163–171. [Google Scholar] [CrossRef]
- Choi, I.Y.; Hyten, D.L.; Matukumalli, L.K.; Song, Q.; Chaky, J.M.; Quigley, C.V.; Chase, K.; Lark, K.G.; Reiter, R.S.; Yoon, M.S. A soybean transcript map: Gene distribution, haplotype and single-nucleotide polymorphism analysis. Genetics 2007, 176, 685–696. [Google Scholar] [CrossRef]
- Lindroos, K.; Sigurdsson, S.; Johansson, K.; Ronnblom, L.; Syvanen, A.C. Multiplex SNP genotyping in pooled DNA samples by a four-colour microarray system. Nucleic Acids Res. 2002, 30, e70. [Google Scholar] [CrossRef]
- Hashimoto, K.; Hashimoto, M.; Mishiro, S.; Oota, Y. Method of detecting nucleic acid relating to disease. EU Patent App. 1375672 2004.
- Sybänen, A.C. From gels to chips: “Minisequencing” primer extension for analysis of point mutations and single nucleotide polymorphisms. Hum. Mutat. 1999, 13, 1–10. [Google Scholar] [CrossRef]
- Iannone, M.A.; Taylor, J.D.; Chen, J.; Li, M.S.; Rivers, P.; Slentz-Kesler, K.A.; Weiner, M.P. Multiplexed single nucleotide polymorphism genotyping by oligonucleotide ligation and flow cytometry. Cytometry 2000, 39, 131–140. [Google Scholar] [CrossRef]
- Lyamichev, V.; Mast, A.L.; Hall, J.G.; Prudent, J.R.; Kaiser, M.W.; Takova, T.; Kwiatkowski, R.W.; Sander, T.J.; de Arruda, M.; Arco, D.A. Polymorphism identification and quantitative detection of genomic DNA by invasive cleavage of oligonucleotide probes. Nat. Biotechnol. 1999, 17, 292–296. [Google Scholar]
- Sobrino, B.; Bri n, M.; Carracedo, A. SNPs in forensic genetics: A review on SNP typing methodologies. Forensic Sci.Int. 2005, 154, 181–194. [Google Scholar] [CrossRef]
- Semagn, K.; Bjørnstad; Ndjiondjop, M.N. An overview of molecular marker methods for plants. Afr. J. Biotechnol. 2006, 5, 2540–2568. [Google Scholar]
- Yu, J.; Hu, S.; Wang, J.; Wong, G.K.S.; Li, S.; Liu, B.; Deng, Y.; Dai, L.; Zhou, Y.; Zhang, X. A draft sequence of the rice genome (Oryza sativa L. ssp. indica). Science 2002, 296, 79–92. [Google Scholar] [CrossRef]
- Rostoks, N.; Mudie, S.; Cardle, L.; Russell, J.; Ramsay, L.; Booth, A.; Svensson, J.T.; Wanamaker, S.I.; Walia, H.; Rodriguez, E. M. Genome-wide SNP discovery and linkage analysis in barley based on genes responsive to abiotic stress. Mol. Genet. Genomics 2005, 274, 515–527. [Google Scholar] [CrossRef]
- Ching, A.; Caldwell, K.S.; Jung, M.; Dolan, M.; Smith, O.S.H.; Tingey, S.; Morgante, M.; Rafalski, A.J. SNP frequency, haplotype structure and linkage disequilibrium in elite maize inbred lines. BMC Genet. 2002, 3, 19. [Google Scholar] [CrossRef] [Green Version]
- Gupta, P.K.; Roy, J.K.; Prasad, M. Single nucleotide polymorphisms: A new paradigm for molecular marker technology and DNA polymorphism detection with emphasis on their use in plants. Curr. Sci. 2001, 80, 524–535. [Google Scholar]
- Rafalski, A. Applications of single nucleotide polymorphisms in crop genetics. Curr. Opin. Plant Biol. 2002, 5, 94–100. [Google Scholar] [CrossRef]
- Moustacchi, E.; Williamson, D.H. Physiological variations in satellite components of yeast DNA detected by density gradient centrifugation. Biochem. Biophys. Res. Commun. 1966, 23, 56–61. [Google Scholar] [CrossRef]
- Pardue, M.L.; Gall, J.G. Chromosomal localization of mouse satellite DNA. Science 1970, 168, 1356–1358. [Google Scholar]
- Hamada, H.; Petrino, M.G.; Kakunaga, T. A novel repeated element with Z-DNA-forming potential is widely found in evolutionarily diverse eukaryotic genomes. Proc. Natl. Acad. Sci. USA 1982, 79, 6465–6469. [Google Scholar] [CrossRef]
- Tautz, D.; Renz, M. Simple sequences are ubiquitous repetitive components of eukaryotic genomes. Nucleic Acids Res. 1984, 12, 4127–4138. [Google Scholar] [CrossRef]
- Weber, J.L.; May, P.E. Abundant class of human DNA polymorphisms which can be typed using the polymerase chain reaction. Am. J. Hum. Genet. 1989, 44, 388–396. [Google Scholar]
- Weissenbach, J.; Gyapay, G.; Dib, C.; Vignal, A.; Morissette, J.; Millasseau, P.; Vaysseix, G.; Lathrop, M. A second-generation linkage map of the human genome. Nature 1992, 359, 794–801. [Google Scholar] [CrossRef]
- McAleer, M.A.; Aitman, T.J.; Cornall, R.J.; Ghosh, S.; Hall, J.R.S.; Hearne, C.M.; Love, J.M.; Prins, J.B.; Ramachandran, S.; Rodrigues, N. Linkage analysis of 84 microsatellite markers in intra-and interspecific backcrosses. Mamm. Genome 1992, 3, 457–460. [Google Scholar] [CrossRef]
- Serikawa, T.; Kuramoto, T.; Hilbert, P.; Mori, M.; Yamada, J.; Dubay, C.J.; Lindpainter, K.; Ganten, D.; Guenet, J.L.; Lathrop, G.M. Rat gene mapping using PCR-analyzed microsatellites. Genetics 1992, 131, 701–721. [Google Scholar]
- Condit, R.; Hubbell, S.P. Abundance and DNA sequence of two-base repeat regions in tropical tree genomes. Genome 1991, 34, 66–71. [Google Scholar] [CrossRef]
- Akkaya, M.S.; Bhagwat, A.A.; Cregan, P.B. Length polymorphisms of simple sequence repeat DNA in soybean. Genetics 1992, 132, 1131–1139. [Google Scholar]
- Morgante, M.; Olivieri, A.M. PCR-amplified microsatellites as markers in plant genetics. Plant J. 1993, 3, 175–182. [Google Scholar] [CrossRef]
- Wang, Z.; Weber, J.L.; Zhong, G.; Tanksley, S.D. Survey of plant short tandem DNA repeats. Theor. Appl. Genet. 1994, 88, 1–6. [Google Scholar]
- Kresovich, S.; Szewc-McFadden, A. K.; Bliek, S.M.; McFerson, J.R. Abundance and characterization of simple-sequence repeats (SSRs) isolated from a size-fractionated genomic library of Brassica napus L.(rapeseed). Theor. Appl. Genet. 1995, 91, 206–211. [Google Scholar]
- Temnykh, S.; DeClerck, G.; Lukashova, A.; Lipovich, L.; Cartinhour, S.; McCouch, S. Computational and experimental analysis of microsatellites in rice (Oryza sativa L.): Frequency, length variation, transposon associations, and genetic marker potential. Genome Res. 2001, 11, 1441–1452. [Google Scholar] [CrossRef]
- Varshney, R.K.; Graner, A.; Sorrells, M.E. Genic microsatellite markers in plants: Features and applications. Trends Biotechnol. 2005, 23, 48–55. [Google Scholar]
- Simko, I. Development of EST-SSR Markers for the study of population structure in Lettuce (Lactuca sativa L.). J. Hered. 2009, 100, 256–262. [Google Scholar] [CrossRef]
- Jeffreys, A.J.; Murray, J.; Neumann, R. High-resolution mapping of crossovers in human sperm defines a minisatellite-associated recombination hotspot. Mol. Cell 1998, 2, 267–273. [Google Scholar] [CrossRef]
- Strand, M.; Prolla, T.A.; Liskay, R.M.; Petes, T.D. Destabilization of tracts of simple repetitive DNA in yeast by mutations affecting DNA mismatch repair. Nature 1993, 365, 274–276. [Google Scholar] [CrossRef]
- Richard, G.F.; Kerrest, A.; Dujon, B. Comparative genomics and molecular dynamics of DNA repeats in eukaryotes. Microbiol. Mol. Biol. Rev. 2008, 72, 686–727. [Google Scholar] [CrossRef]
- Ellegren, H. Microsatellites: Simple sequences with complex evolution. Nat. Rev. Genet. 2004, 5, 435–445. [Google Scholar] [CrossRef]
- Zane, L.; Bargelloni, L.; Patarnello, T. Strategies for microsatellite isolation: A review. Mol. Ecol. 2002, 11, 1–16. [Google Scholar] [CrossRef]
- Squirrell, J.; Hollingsworth, P.M.; Woodhead, M.; Russell, J.; Lowe, A.J.; Gibby, M.; Powell, W. How much effort is required to isolate nuclear microsatellites from plants? Mol. Ecol. 2003, 12, 1339–1348. [Google Scholar] [CrossRef]
- Kelly, A.J.; Willis, J.H. Polymorphic microsatellite loci in Mimulus guttatus and related species. Mol. Ecol. 1998, 7, 769–774. [Google Scholar] [CrossRef]
- Dick, C.W.; Hamilton, M.B. Microsatellites from the Amazonian tree Dinizia excelsa (Fabaceae). Mol. Ecol. 1999, 8, 1765–1766. [Google Scholar] [CrossRef]
- Green, J.M.; Edwards, K.J.; Usher, S.L.; Barker, J.H.A.; Marshall, E.J.P.; Froud-Williams, R.J.; Karp, A. Microsatellites for Barren Brome (Anisantha sterilis). Mol. Ecol. 2000, 9, 2195–2197. [Google Scholar] [CrossRef]
- Hughes, M.; Hollingsworth, P.M.; Squirrell, J. Isolation of polymorphic microsatellite markers for Begonia sutherlandii Hook. f. Mol. Ecol. Notes 2002, 2, 185–186. [Google Scholar] [CrossRef]
- De La Rosa, R.; James, C.M.; Tobutt, K.R. Isolation and characterization of polymorphic microsatellites in olive (Olea europaea L.) and their transferability to other genera in the Oleaceae. Mol. Ecol. Notes 2002, 2, 265–267. [Google Scholar] [CrossRef]
- Kwon, S.J.; Lee, J.K.; Kim, N.S.; Yu, J.W.; Dixit, A.; Cho, E.G.; Park, Y.J. Isolation and characterization of microsatellite markers in Perilla frutescens Brit. Mol. Ecol. Notes 2005, 5, 455–457. [Google Scholar] [CrossRef]
- Lee, J.R.; Hong, G.Y.; Dixit, A.; Chung, J.W.; Ma, K.H.; Lee, J.H.; Kang, H.K.; Cho, Y.H.; Gwag, J.G.; Park, Y.J. Characterization of microsatellite loci developed for Amaranthus hypochondriacus and their cross-amplifications in wild species. Conserv. Genet. 2008, 9, 243–246. [Google Scholar] [CrossRef]
- Iwata, H.; Konuma, A.; Tsumura, Y. Development of microsatellite markers in the tropical tree Neobalanocarpus heimii (Dipterocarpaceae). Mol. Ecol. 2000, 9, 1684–1685. [Google Scholar] [CrossRef]
- Lian, C.; Miwa, M.; Hogetsu, T. Isolation and characterization of microsatellite loci from the Japanese red pine, Pinus densiflora. Mol. Ecol. 2000, 9, 1186–1187. [Google Scholar] [CrossRef]
- Gaiotto, F.A.; Brondani, R.P.V.; Grattapaglia, D. Microsatellite markers for heart of palm- Euterpe edulis and E. oleracea Mart.(Arecaceae). Mol. Ecol. Notes 2001, 1, 86–88. [Google Scholar] [CrossRef]
- Morgante, M.; Hanafey, M.; Powell, W. Microsatellites are preferentially associated with nonrepetitive DNA in plant genomes. Nature Genet. 2002, 30, 194–200. [Google Scholar] [CrossRef]
- Manen, J.F.; Bouby, L.; Dalnoki, O.; Marinval, P.; Turgay, M.; Schlumbaum, A. Microsatellites from archaeological Vitis vinifera seeds allow a tentative assignment of the geographical origin of ancient cultivars. J. Archaeol. Sci. 2003, 30, 721–729. [Google Scholar] [CrossRef]
- Boder, P.; Deak, T.; Bacso, R.; Velich, I.; Bisztray, G.D.; Fascar, G.; Gyulai, P. Morphological and genetic investigation of medieval grape seeds. Acta Horticulture (ISHS) 2006, 713–718. [Google Scholar]
- Powell, W.; Morgante, M.; Andre, C.; Hanafey, M.; Vogel, J.; Tingey, S.; Rafalski, A. The comparison of RFLP, RAPD, AFLP and SSR (microsatellite) markers for germplasm analysis. Mol. Breed. 1996, 2, 225–238. [Google Scholar] [CrossRef]
- Morgante, M.; Rafalski, A.; Biddle, P.; Tingey, S.; Olivieri, A.M. Genetic mapping and variability of seven soybean simple sequence repeat loci. Genome 1994, 37, 763–769. [Google Scholar] [CrossRef]
- Scott, K.D.; Eggler, P.; Seaton, G.; Rossetto, M.; Ablett, E. M.; Lee, L.S.; Henry, R.J. Analysis of SSRs derived from grape ESTs. Theor. Appl. Genet. 2000, 100, 723–726. [Google Scholar] [CrossRef]
- Slavov, G.T.; Howe, G.T.; Gyaourova, A.V.; Birkes, D.S.; Adams, W.T. Estimating pollen flow using SSR markers and paternity exclusion: Accounting for mistyping. Mol. Ecol. 2005, 14, 3109–3121. [Google Scholar] [CrossRef]
- Tóth, G.; Gáspári, Z.; Jurka, J. Microsatellites in different eukaryotic genomes: Survey and analysis. Genome Res. 2000, 10, 967–981. [Google Scholar] [CrossRef]
- Vuylsteke, M.; Mank, R.; Antonise, R.; Bastiaans, E.; Senior, M.L.; Stuber, C.W.; Melchinger, A.E.; Lbberstedt, T.; Xia, X. C.; Stam, P. Two high-density AFLP® linkage maps of Zea mays L.: Analysis of distribution of AFLP markers. Theor. Appl. Genet. 1999, 99, 921–935. [Google Scholar] [CrossRef]
- Kwon, S.; Hong, S.; Son, J.; Lee, J.K.; Cha, Y.; Eun, M.; Kim, N. CACTA and MITE transposon distributions on a genetic map of rice using F15 RILs derived from Milyang 23 and Gihobyeo hybrids. Mol. Cells 2006, 21, 360–366. [Google Scholar]
- Andersen, J.R.; Liberstedt, T. Functional markers in plants. Trends Plant Sci. 2003, 8, 554–560. [Google Scholar] [CrossRef]
- Ronning, C.M.; Stegalkina, S.S.; Ascenzi, R.A.; Bougri, O.; Hart, A.L.; Utterbach, T.R.; Vanaken, S.E.; Riedmuller, S.B.; White, J.A.; Cho, J. Comparative analyses of potato expressed sequence tag libraries. Plant Physiol. 2003, 131, 419–429. [Google Scholar] [CrossRef]
- Szalma, S.J.; Buckler, E.S.; Snook, M.E.; McMullen, M.D. Association analysis of candidate genes for maysin and chlorogenic acid accumulation in maize silks. Theor. Appl. Genet. 2005, 110, 1324–1333. [Google Scholar] [CrossRef]
- Shin, J.H.; Kwon, S.J.; Lee, J.K.; Min, H.K.; Kim, N.S. Genetic diversity of maize kernel starch-synthesis genes with SNAPs. Genome 2006, 49, 1287–1296. [Google Scholar] [CrossRef]
- Crossa, J.; Burgueno, J.; Dreisigacker, S.; Vargas, M.; Herrera-Foessel, S.A.; Lillemo, M.; Singh, R.P.; Trethowan, R.; Warburton, M.; Franco, J. Association analysis of historical bread wheat germplasm using additive genetic covariance of relatives and population structure. Genetics 2007, 177, 1889–1913. [Google Scholar] [CrossRef]
- Buerstmayr, H.; Lemmens, M.; Hartl, L.; Doldi, L.; Steiner, B.; Stierschneider, M.; Ruckenbauer, P. Molecular mapping of QTLs for Fusarium head blight resistance in spring wheat. I. Resistance to fungal spread (Type II resistance). Theor. Appl. Genet. 2002, 104, 84–91. [Google Scholar] [CrossRef]
- Breseghello, F.; Sorrells, M.E. Association analysis as a strategy for improvement of quantitative traits in plants. Crop Sci. 2006, 46, 1323–1330. [Google Scholar] [CrossRef]
- Zeng, Y.; Yang, S.; Cui, H.; Yang, X.; Xu, L.; Du, J.; Pu, X.; Li, Z.; Cheng, Z.; Huang, X. QTLs of cold-related traits at the booting stage for NIL-RILs in rice revealed by SSR. Genes Genom. 2009, 31, 143–145. [Google Scholar] [CrossRef]
- Hauge, X. Y.; Litt, M. A study of the origin of 'shadow bands' seen when typing dinucleotide repeat polymorphisms by the PCR. Hum. Mol. Genet. 1993, 2, 411–415. [Google Scholar] [CrossRef]
- Murray, V.; Monchawin, C.; England, P.R. The determination of the sequences present in the shadow bands of a dinucleotide repeat PCR. Nucleic Acids Res. 1993, 21, 2395–2398. [Google Scholar] [CrossRef]
- Smulders, M.J.M.; Bredemeijer, G.; Rus-Kortekaas, W.; Arens, P.; Vosman, B. Use of short microsatellites from database sequences to generate polymorphisms among Lycopersicon esculentum cultivars and accessions of other Lycopersicon species. Theor. Appl. Genet. 1997, 94, 264–272. [Google Scholar] [CrossRef]
- Shinde, D.; Lai, Y.; Sun, F.; Arnheim, N. Taq DNA polymerase slippage mutation rates measured by PCR and quasi-likelihood analysis: (CA/GT) n and (A/T) n microsatellites. Nucleic Acids Res. 2003, 31, 974–980. [Google Scholar] [CrossRef]
- Ramsay, L.; Macaulay, M.; Degli Ivanissevich, S.; MacLean, K.; Cardle, L.; Fuller, J.; Edwards, K.J.; Tuvesson, S.; Morgante, M.; Massari, A. A simple sequence repeat-based linkage map of barley. Genetics 2000, 156, 1997–2005. [Google Scholar]
- Estoup, A.; Jarne, P.; Cornuet, J.M. Homoplasy and mutation model at microsatellite loci and their consequences for population genetics analysis. Mol. Ecol. 2002, 11, 1591–1604. [Google Scholar] [CrossRef]
- Estoup, A.; Tailliez, C.; Cornuet, J. M.; Solignac, M. Size homoplasy and mutational processes of interrupted microsatellites in two bee species, Apis mellifera and Bombus terrestris (Apidae). Mol. Biol. Evol. 1995, 12, 1074–1084. [Google Scholar]
- Angers, B.; Estoup, A.; Jarne, P. Microsatellite size homoplasy, SSCP, and population structure: A case study in the freshwater snail Bulinus truncatus. Mol. Biol. Evol. 2000, 17, 1926–1932. [Google Scholar] [CrossRef]
- Jarne, P.; Lagoda, P. J. L. Microsatellites, from molecules to populations and back. Trends Ecol. Evol. 1996, 11, 424–429. [Google Scholar] [CrossRef]
- Curtu, A. L.; Finkeldey, R.; Gailing, O. Comparative sequencing of a microsatellite locus reveals size homoplasy within and between European oak species (Quercus spp.). Plant Mol. Biol. Rep. 2004, 22, 339–346. [Google Scholar] [CrossRef]
- Goldstein, D.B.; Linares, A.R.; Cavalli-Sforza, L.L.; Feldman, M.W. An evaluation of genetic distances for use with microsatellite loci. Genetics 1995, 139, 463–471. [Google Scholar]
- Selkoe, K.A.; Toonen, R.J. Microsatellites for ecologists: A practical guide to using and evaluating microsatellite markers. Ecol. Lett. 2006, 9, 615–629. [Google Scholar] [CrossRef]
- Thiel, T.; Michalek, W.; Varshney, R.; Graner, A. Exploiting EST databases for the development and characterization of gene-derived SSR-markers in barley (Hordeum vulgare L.). Theor. Appl. Genet. 2003, 106, 411–422. [Google Scholar]
- Kota, R.; Varshney, R.K.; Thiel, T.; Dehmer, K.J.; Graner, A. Generation and comparison of EST-derived SSRs and SNPs in barley (Hordeum vulgare L.). Hereditas 2001, 135, 145–151. [Google Scholar]
- Saha, M.C.; Mian, M.A.R.; Eujayl, I.; Zwonitzer, J.C.; Wang, L.; May, G.D. Tall fescue EST-SSR markers with transferability across several grass species. Theor. Appl. Genet. 2004, 109, 783–791. [Google Scholar] [CrossRef]
- Gupta, P.K.; Rustgi, S.; Sharma, S.; Singh, R.; Kumar, N.; Balyan, H.S. Transferable EST-SSR markers for the study of polymorphism and genetic diversity in bread wheat. Mol. Genet. Genomics 2003, 270, 315–323. [Google Scholar] [CrossRef]
- Dakin, E.E.; Avise, J.C. Microsatellite null alleles in parentage analysis. Heredity 2004, 93, 504–509. [Google Scholar] [CrossRef]
- Fraser, L.G.; Harvey, C.F.; Crowhurst, R.N.; Silva, H.N.D. EST-derived microsatellites from Actinidia species and their potential for mapping. Theor. Appl. Genet. 2004, 108, 1010–1016. [Google Scholar] [CrossRef]
- Rungis, D.; Berube, Y.; Zhang, J.; Ralph, S.; Ritland, C.E.; Ellis, B.E.; Douglas, C.; Bohlmann, J.; Ritland, K. Robust simple sequence repeat markers for spruce (Picea spp.) from expressed sequence tags. Theor. Appl. Genet. 2004, 109, 1283–1294. [Google Scholar] [CrossRef]
- Rico, C.; Rico, I.; Hewitt, G. 470 million years of conservation of microsatellite loci among fish species. Proc. R. Soc. Lond., B, Biol. Sci. 1996, 549–557. [Google Scholar]
- FitzSimmons, N.N.; Moritz, C.; Moore, S.S. Conservation and dynamics of microsatellite loci over 300 million years of marine turtle evolution. Mol. Biol. Evol. 1995, 12, 432–440. [Google Scholar]
- Peakall, R.; Gilmore, S.; Keys, W.; Morgante, M.; Rafalski, A. Cross-species amplification of soybean (Glycine max) simple sequence repeats (SSRs) within the genus and other legume genera: Implications for the transferability of SSRs in plants. Mol. Biol. Evol. 1998, 15, 1275–1287. [Google Scholar] [CrossRef]
- Chen, X.; Cho, Y.; McCouch, S. Sequence divergence of rice microsatellites in Oryza and other plant species. Mol. Genet. Genomics 2002, 268, 331–343. [Google Scholar] [CrossRef]
- White, G.; Powell, W. Cross-species amplification of SSR loci in the Meliaceae family. Mol. Ecol. 1997, 6, 1195–1197. [Google Scholar]
- Ma, K.H.; Kim, N.S.; Lee, G.A.; Lee, S.Y.; Lee, J.K.; Yi, J.Y.; Park, Y.J.; Kim, T.S.; Gwag, J.G.; Kwon, S.J. Development of SSR markers for studies of diversity in common buckwheat. Theor. Appl. Genet. 2009, 119, 1247–1254. [Google Scholar] [CrossRef]
- Kostia, S.; Varvio, S.L.; Vakkari, P.; Pulkkinen, P. Microsatellite sequences in a conifer, Pinus sylvestris. Genome 1995, 38, 1244–1248. [Google Scholar] [CrossRef]
- Marcotte, E.M.; Pellegrini, M.; Yeates, T.O.; Eisenberg, D. A census of protein repeats. J. Mol. Biol. 1999, 293, 151–160. [Google Scholar] [CrossRef]
- Wren, J.D.; Forgacs, E.; Fondon, J.W.; Pertsemlidis, A.; Cheng, S.Y.; Gallardo, T.; Williams, R.S.; Shohet, R.V.; Minna, J.D.; Garner, H.R. Repeat polymorphisms within gene regions: Phenotypic and evolutionary implications. Am. J. Hum. Genet. 2000, 67, 345–356. [Google Scholar] [CrossRef]
- Li, Y.C.; Korol, A.B.; Fahima, T.; Beiles, A.; Nevo, E. Microsatellites: Genomic distribution, putative functions and mutational mechanisms: A review. Mol. Ecol. 2002, 11, 2453–2465. [Google Scholar] [CrossRef]
- Li, Y.C.; Korol, A.B.; Fahima, T.; Nevo, E. Microsatellites within genes: Structure, function, and evolution. Mol. Biol. Evol. 2004, 21, 991–1007. [Google Scholar] [CrossRef]
- Cummings, C.J.; Zoghbi, H.Y. Fourteen and counting: Unraveling trinucleotide repeat diseases. Hum. Mol. Genet. 2000, 9, 909–916. [Google Scholar] [CrossRef]
- Streelman, J.T.; Kocher, T.D. Microsatellite variation associated with prolactin expression and growth of salt-challenged tilapia. Physiol. Genomics 2002, 9, 1–4. [Google Scholar]
- Liquori, C.L.; Ricker, K.; Moseley, M.L.; Jacobsen, J.F.; Kress, W.; Naylor, S.L.; Day, J.W.; Ranum, L.P.W. Myotonic dystrophy type 2 caused by a CCTG expansion in intron 1 of ZNF9. Science 2001, 293, 864–867. [Google Scholar]
- Li, W.H.; Graur, D. Fundamentals of Molecular Evolution; Sinauer Pub.: Sunderland, MA, USA, 1991. [Google Scholar]
- Ennos, R.A. Utilising Genetic Information in Plant Conservation Programmes. In Aspects of the Genesis and Maintenance of Biological Diversity; Hochberg, M.E., Clbert, J., Barbault, R., Eds.; Oxford University Press: Oxford, UK, 1996; pp. 278–291. [Google Scholar]
- Bekessy, S.A.; Ennos, R.A.; Burgman, M.A.; Newton, A.C.; Ades, P.K. Neutral DNA markers fail to detect genetic divergence in an ecologically important trait. Biol. Conserv. 2003, 110, 267–275. [Google Scholar] [CrossRef]
- Van Tienderen, P.H.; De Haan, A.A.; Van der Linden, C.G.; Vosman, B. Biodiversity assessment using markers for ecologically important traits. Trends Ecol. Evol. 2002, 17, 577–582. [Google Scholar] [CrossRef]
- Holderegger, R.; Kamm, U.; Gugerli, F. Adaptive vs. neutral genetic diversity: Implications for landscape genetics. Landsc. Ecol. 2006, 21, 797–807. [Google Scholar] [CrossRef]
- Hammer, K.; Heller, J. Promoting the conservation and use of underutilized and neglected crops. Schriften Genet. Resour. 1997, 8, 223–227. [Google Scholar]
- Padulosi, S.; Eyzaquirre, P.; Hodgkin, T. Challenges and Strategies in Promoting Conservation and Use of Neglected and Underutilized Crop Species. In Perspectives on New Crops and New Uses; Janick, J., Ed.; ASHS Press: Alexandria, VA, USA, 1999; pp. 140–145. [Google Scholar]
- Ellwood, S.R.; D’Souza, N.K.; Kamphuis, L.G.; Burgess, T.I.; Nair, R.M.; Oliver, R.P. SSR analysis of the Medicago truncatula SARDI core collection reveals substantial diversity and unusual genotype dispersal throughout the Mediterranean basin. Theor. Appl. Genet. 2006, 112, 977–983. [Google Scholar] [CrossRef]
- Zhao, W.G.; Chung, J.W.; Lee, G.A.; Ma, K.H.; Kim, H.H.; Chung, I.M.; Kang, H.K.; Kim, T.S.; Lee, J.K.; Kim, N.S.; Park, Y.J. Molecular genetic diversity and population structure of a selected core set in garlic (Allium sativum L.) using novel SSR markers. BMC Plant Biol. 2009. Submitted. [Google Scholar]
- Kim, K.W.; Chung, H.K.; Cho, G.T.; Ma, K.H.; Chandrabalan, D.; Gwag, J.G.; Kim, T.S.; Cho, E.G.; Park, Y.J. PowerCore: A program applying the advanced M strategy with a heuristic search for establishing core sets. Bioinformatics 2007, 23, 2155–2162. [Google Scholar] [CrossRef]
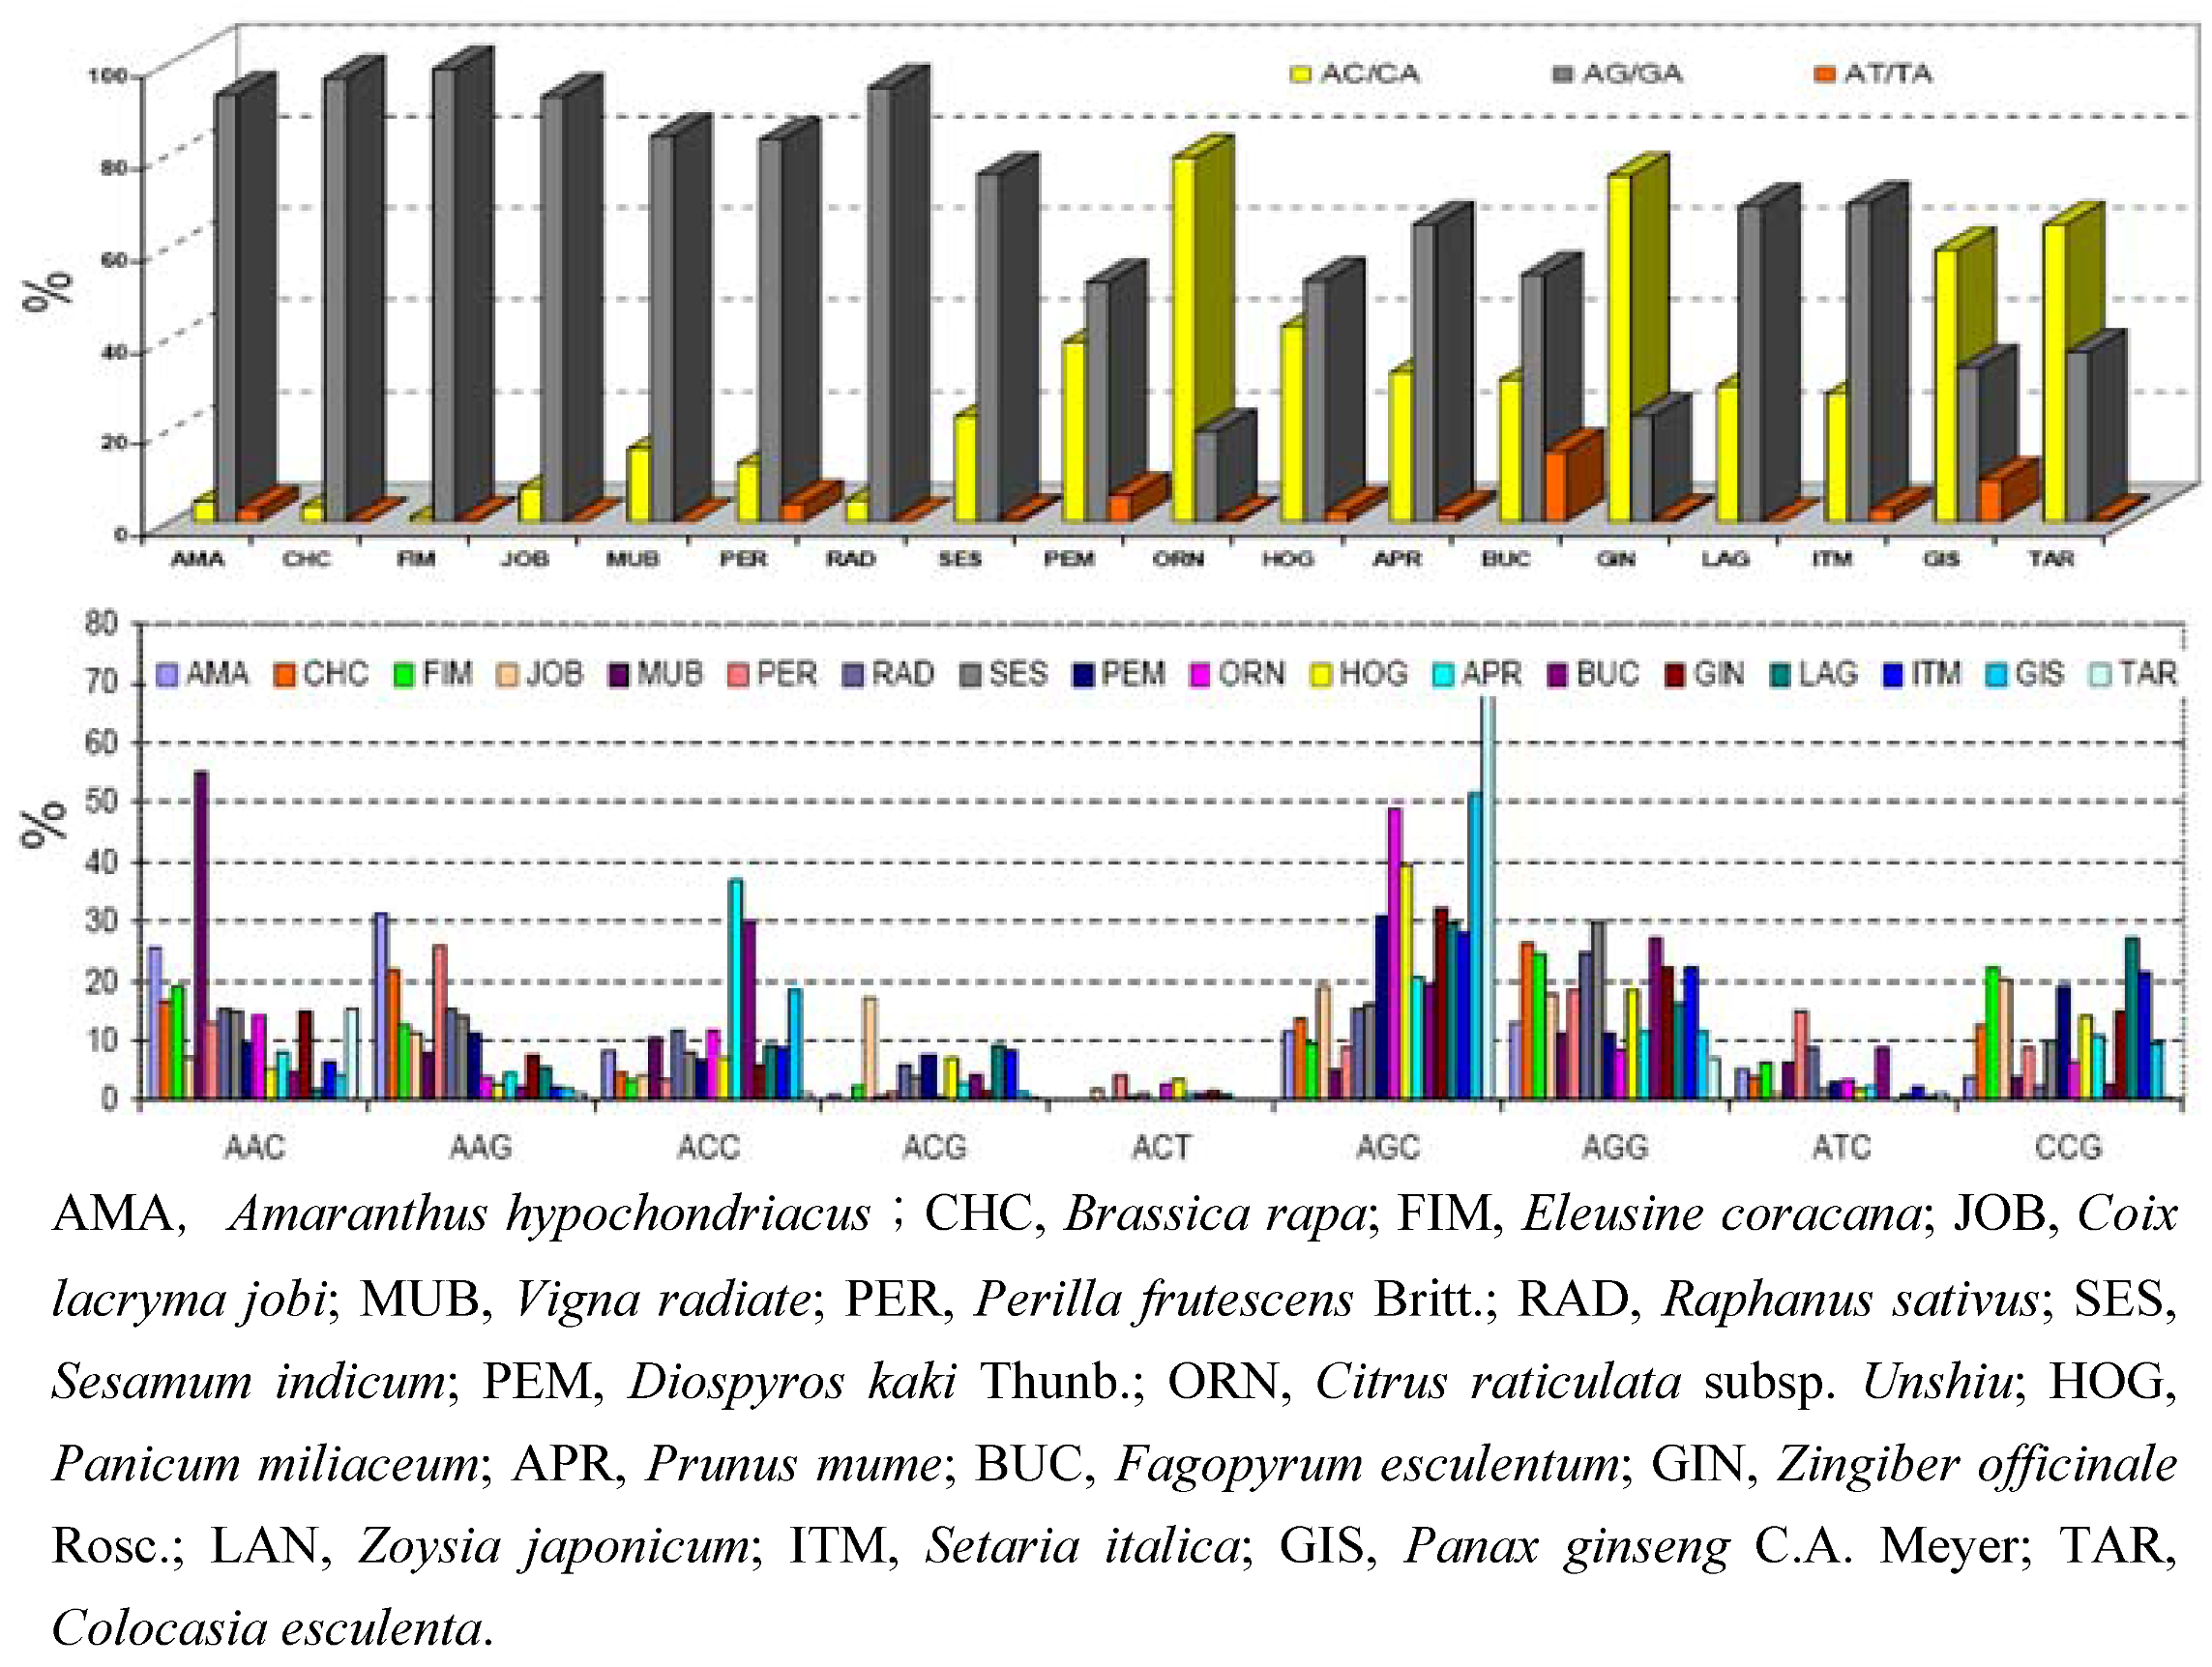
- Yu, J.W.; Dixit, A.; Ma, K.H.; Chung, J.W.; Park, Y.J. A study on relative abundance, composition and length variation of microsatellites in 18 underutilized crop species. Genet. Resour. Crop Evol. 2009, 56, 237–246. [Google Scholar] [CrossRef]
© 2009 by the authors; licensee Molecular Diversity Preservation International, Basel, Switzerland. This article is an open access article distributed under the terms and conditions of the Creative Commons Attribution license ( http://creativecommons.org/licenses/by/3.0/).
Share and Cite
Park, Y.-J.; Lee, J.K.; Kim, N.-S. Simple Sequence Repeat Polymorphisms (SSRPs) for Evaluation of Molecular Diversity and Germplasm Classification of Minor Crops. Molecules 2009, 14, 4546-4569. https://doi.org/10.3390/molecules14114546
Park Y-J, Lee JK, Kim N-S. Simple Sequence Repeat Polymorphisms (SSRPs) for Evaluation of Molecular Diversity and Germplasm Classification of Minor Crops. Molecules. 2009; 14(11):4546-4569. https://doi.org/10.3390/molecules14114546
Chicago/Turabian StylePark, Yong-Jin, Ju Kyong Lee, and Nam-Soo Kim. 2009. "Simple Sequence Repeat Polymorphisms (SSRPs) for Evaluation of Molecular Diversity and Germplasm Classification of Minor Crops" Molecules 14, no. 11: 4546-4569. https://doi.org/10.3390/molecules14114546