Involvement of Carbohydrate, Protein and Phenylanine Ammonia Lyase in Up-Regulation of Secondary Metabolites in Labisia pumila under Various CO2 and N2 Level

Abstract
:Abbreviations
| TP | total phenolics |
| TF | total flavonoid |
| PAL | Phenyll alanine lyase |
| N | nitrogen |
| C/N | Carbon to nitrogen ratio |
| SPS | Sucrose phosphate synthase |
| ROS | Reactive oxygen species |
| CNB | carbon nutrient balance |
| GDB | Growth differentiation balance |
| TNC | Total non structurable carbohydrate |
| CBSM | Carbon based secondary metabolites |
1. Introduction
2. Results and Discussion
2.1. Glucose and Sucrose

| CO2 levels (µmol mol−1) | Glucose (mg g−1 dry weight) | Sucrose (mg g−1 dry weight) |
|---|---|---|
| 400 | 11.89 ± 0.32 b | 36.32 ± 1.00 b |
| 1200 | 15.27 ± 0.66 a | 54.34 ± 0.90 a |
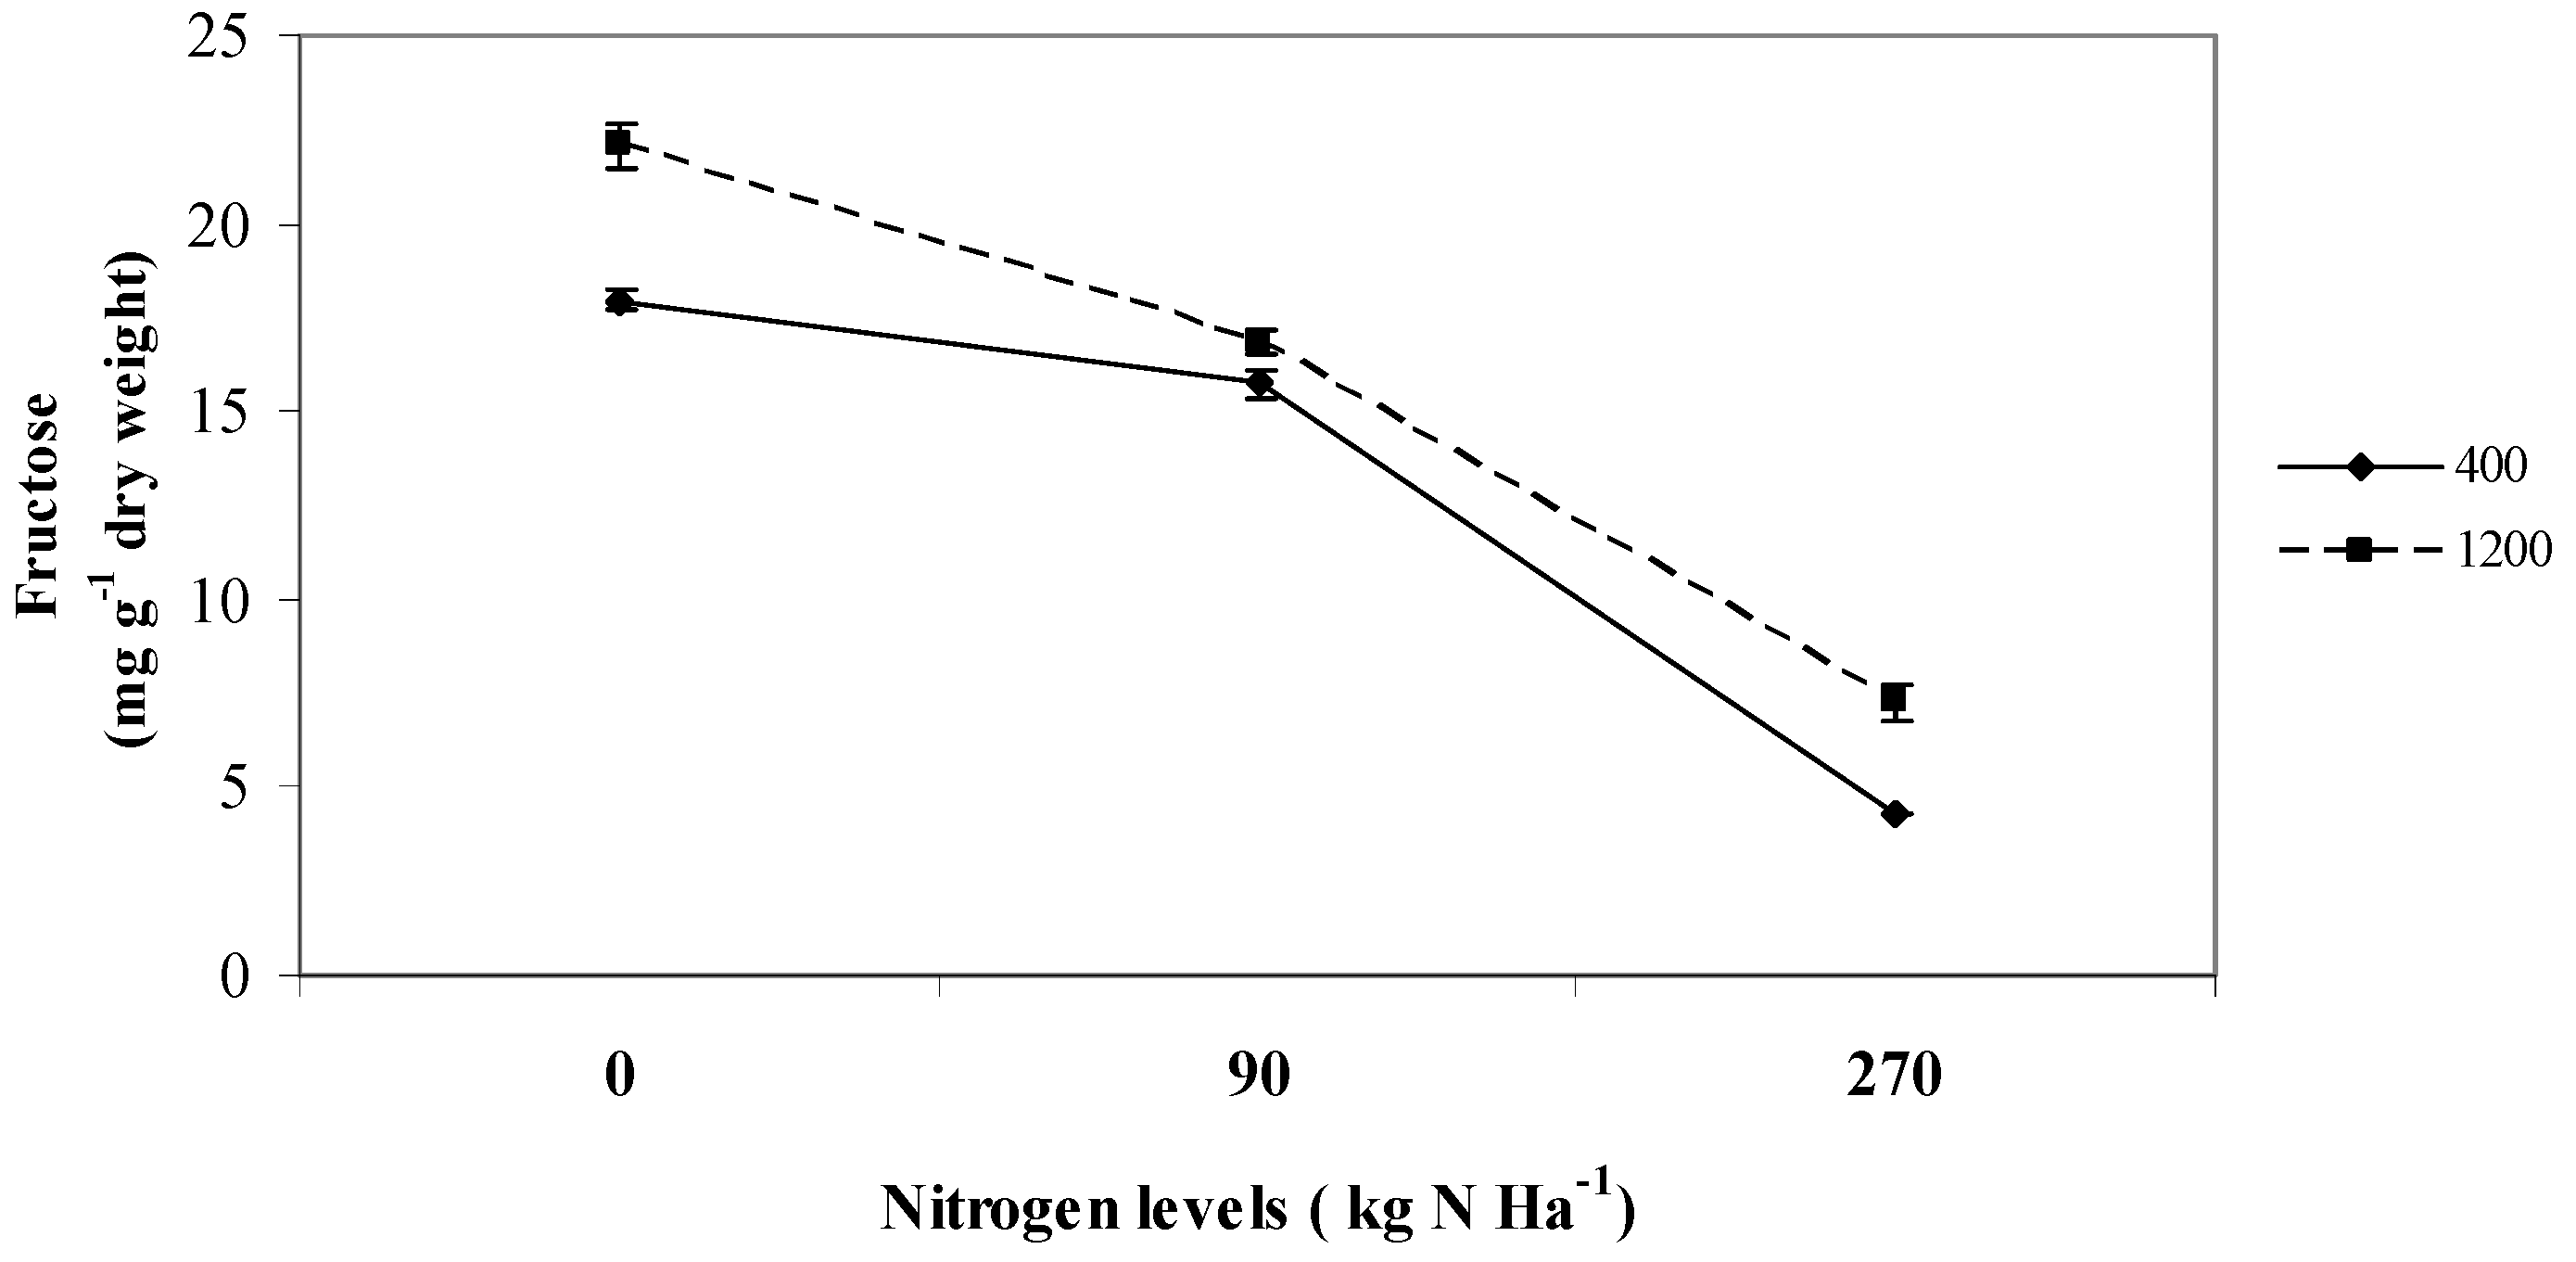
2.2. Fructose

| 1 | 2 | 3 | 4 | 5 | 6 | 7 | 8 | 9 | 10 | 11 | 12 | ||
|---|---|---|---|---|---|---|---|---|---|---|---|---|---|
| 1 | Glucose | 1.000 | |||||||||||
| 2 | Sucrose | 0.316 | 1.000 | ||||||||||
| 3 | Fructose | 0.121 | 0.352 | 1.000 | |||||||||
| 4 | Starch | 0.175 | 0.39 | 0.942 * | 1.000 | ||||||||
| 5 | TNC 1 | 0.305 | 0.602 * | 0.927 * | 0.963 * | 1.000 | |||||||
| 6 | CN 2 | −0.008 | 0.136 | 0.799 * | 0.809 * | 0.730 * | 1.000 | ||||||
| 7 | Phenolics | 0.207 | 0.457 | 0.948 * | 0.929 * | 0.939 * | 0.788 * | 1.000 | |||||
| 8 | Flavonoids | 0.166 | 0.379 | 0.942 * | 0.947 * | 0.926 * | 0.852 * | 0.955 * | 1.000 | ||||
| 9 | PAL 3 | 0.048 | 0.241 | 0.740 * | 0.814 * | 0.751 * | 0.788 * | 0.744 ** | 0.842 * | 1.000 | |||
| 10 | Nitrogen | 0.102 | −0.049 | −0.853 * | −0.832 * | −0.728 * | −0.929 * | −0.785 * | −0.841 * | −0.777 * | 1.000 | ||
| 11 | Protein | −0.023 | −0.139 | −0.798 ** | −0.841 * | −0.754 * | −0.862 * | −0.714 * | −0.812 * | −0.784 * | 0.899 * | 1.000 | |
| 12 | Suc/ starch 4 | 0.128 | 0.442 | −0.629 * | −0.645 * | −0.434 | −0.671 * | −0.519 * | −0.600 * | −0.589 * | 0.780 * | 0.709 * | 1.000 |
2.3. Starch and Total Non Structural Carbohydrates (TNC)
| Nitrogen levels (Kg N ha−1) | Starch (mg g−1 glucose dry weight) | Total non structural carbohydrate (mg g−1 dry weight) |
|---|---|---|
| 0 | 116.29 ± 3.12 a | 192.94 ± 9.12 a |
| 90 | 102.58 ± 3.49 b | 179.27 ± 8.52 b |
| 270 | 76.16 ± 2.73 c | 141.65 ± 7.75 c |

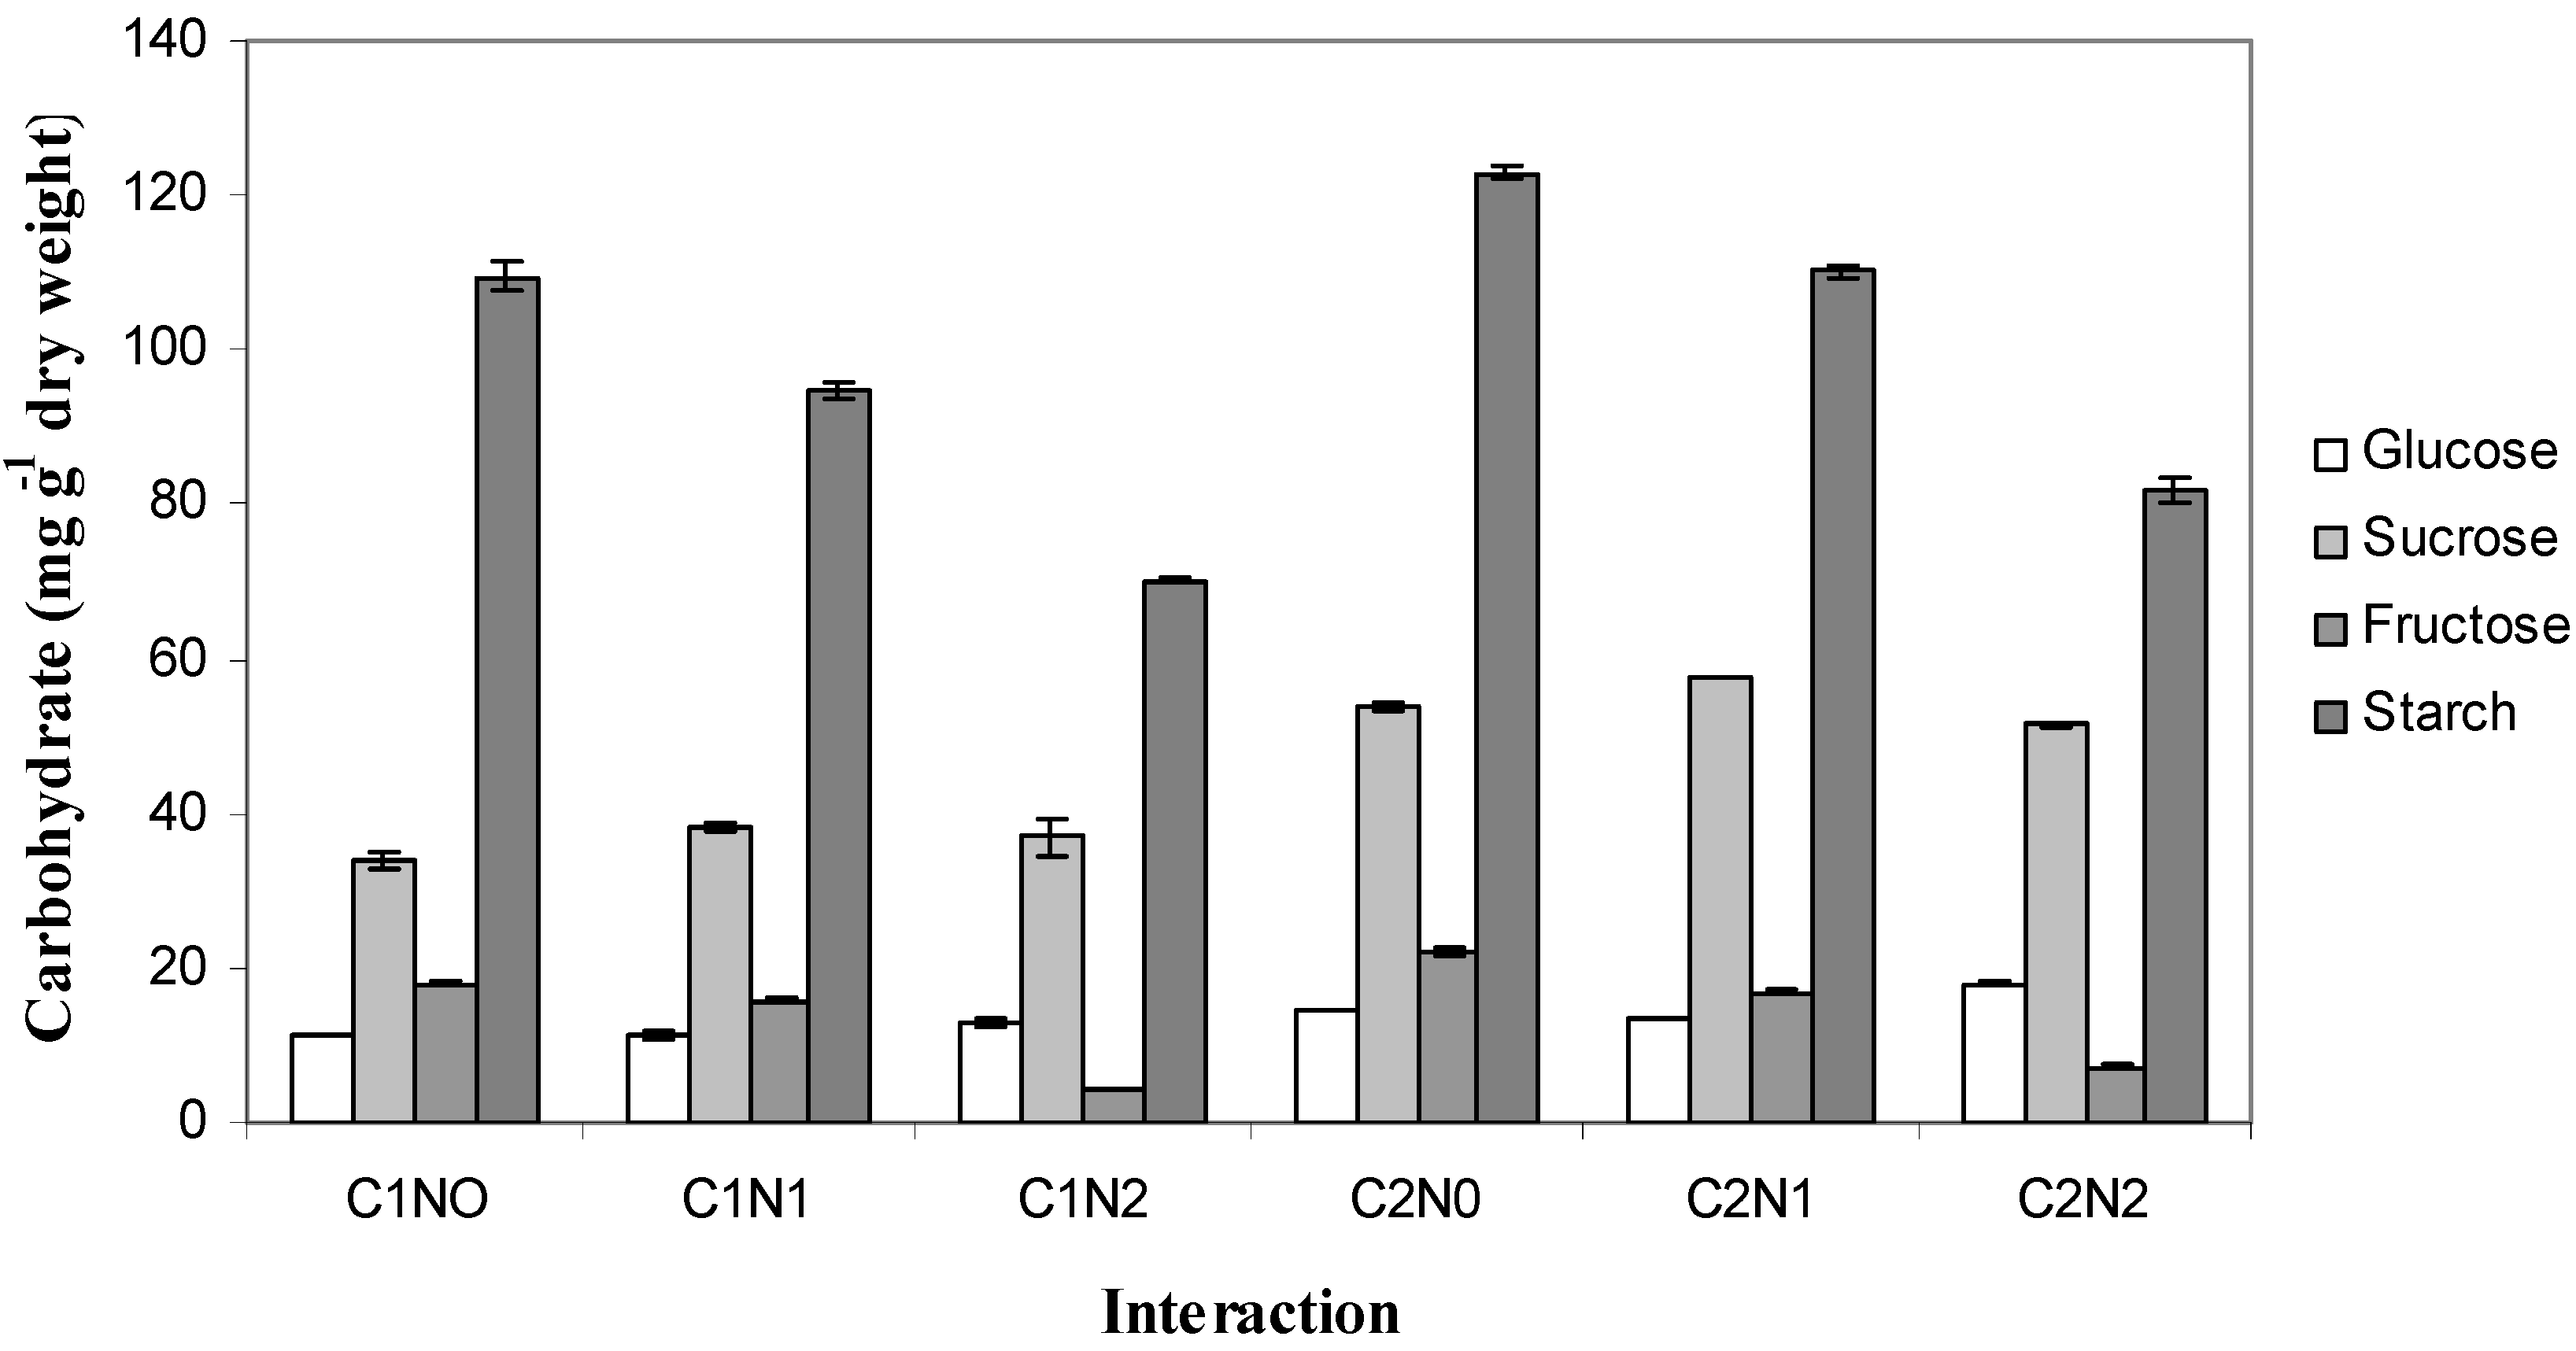
2.4. Carbohydrate Partitioning
2.5. Leaf C to N Ratio and Nitrogen
| Nitrogen levels (Kg N ha−1) | C/N | Leaf nitrogen content (%) |
|---|---|---|
| 0 | 24.39 ± 1.47 a | 1.74 ± 0.08 c |
| 90 | 16.47 ± 0.68 b | 2.61 ± 0.11 b |
| 270 | 9.40 ± 0.27 c | 4.53 ± 0.07 a |
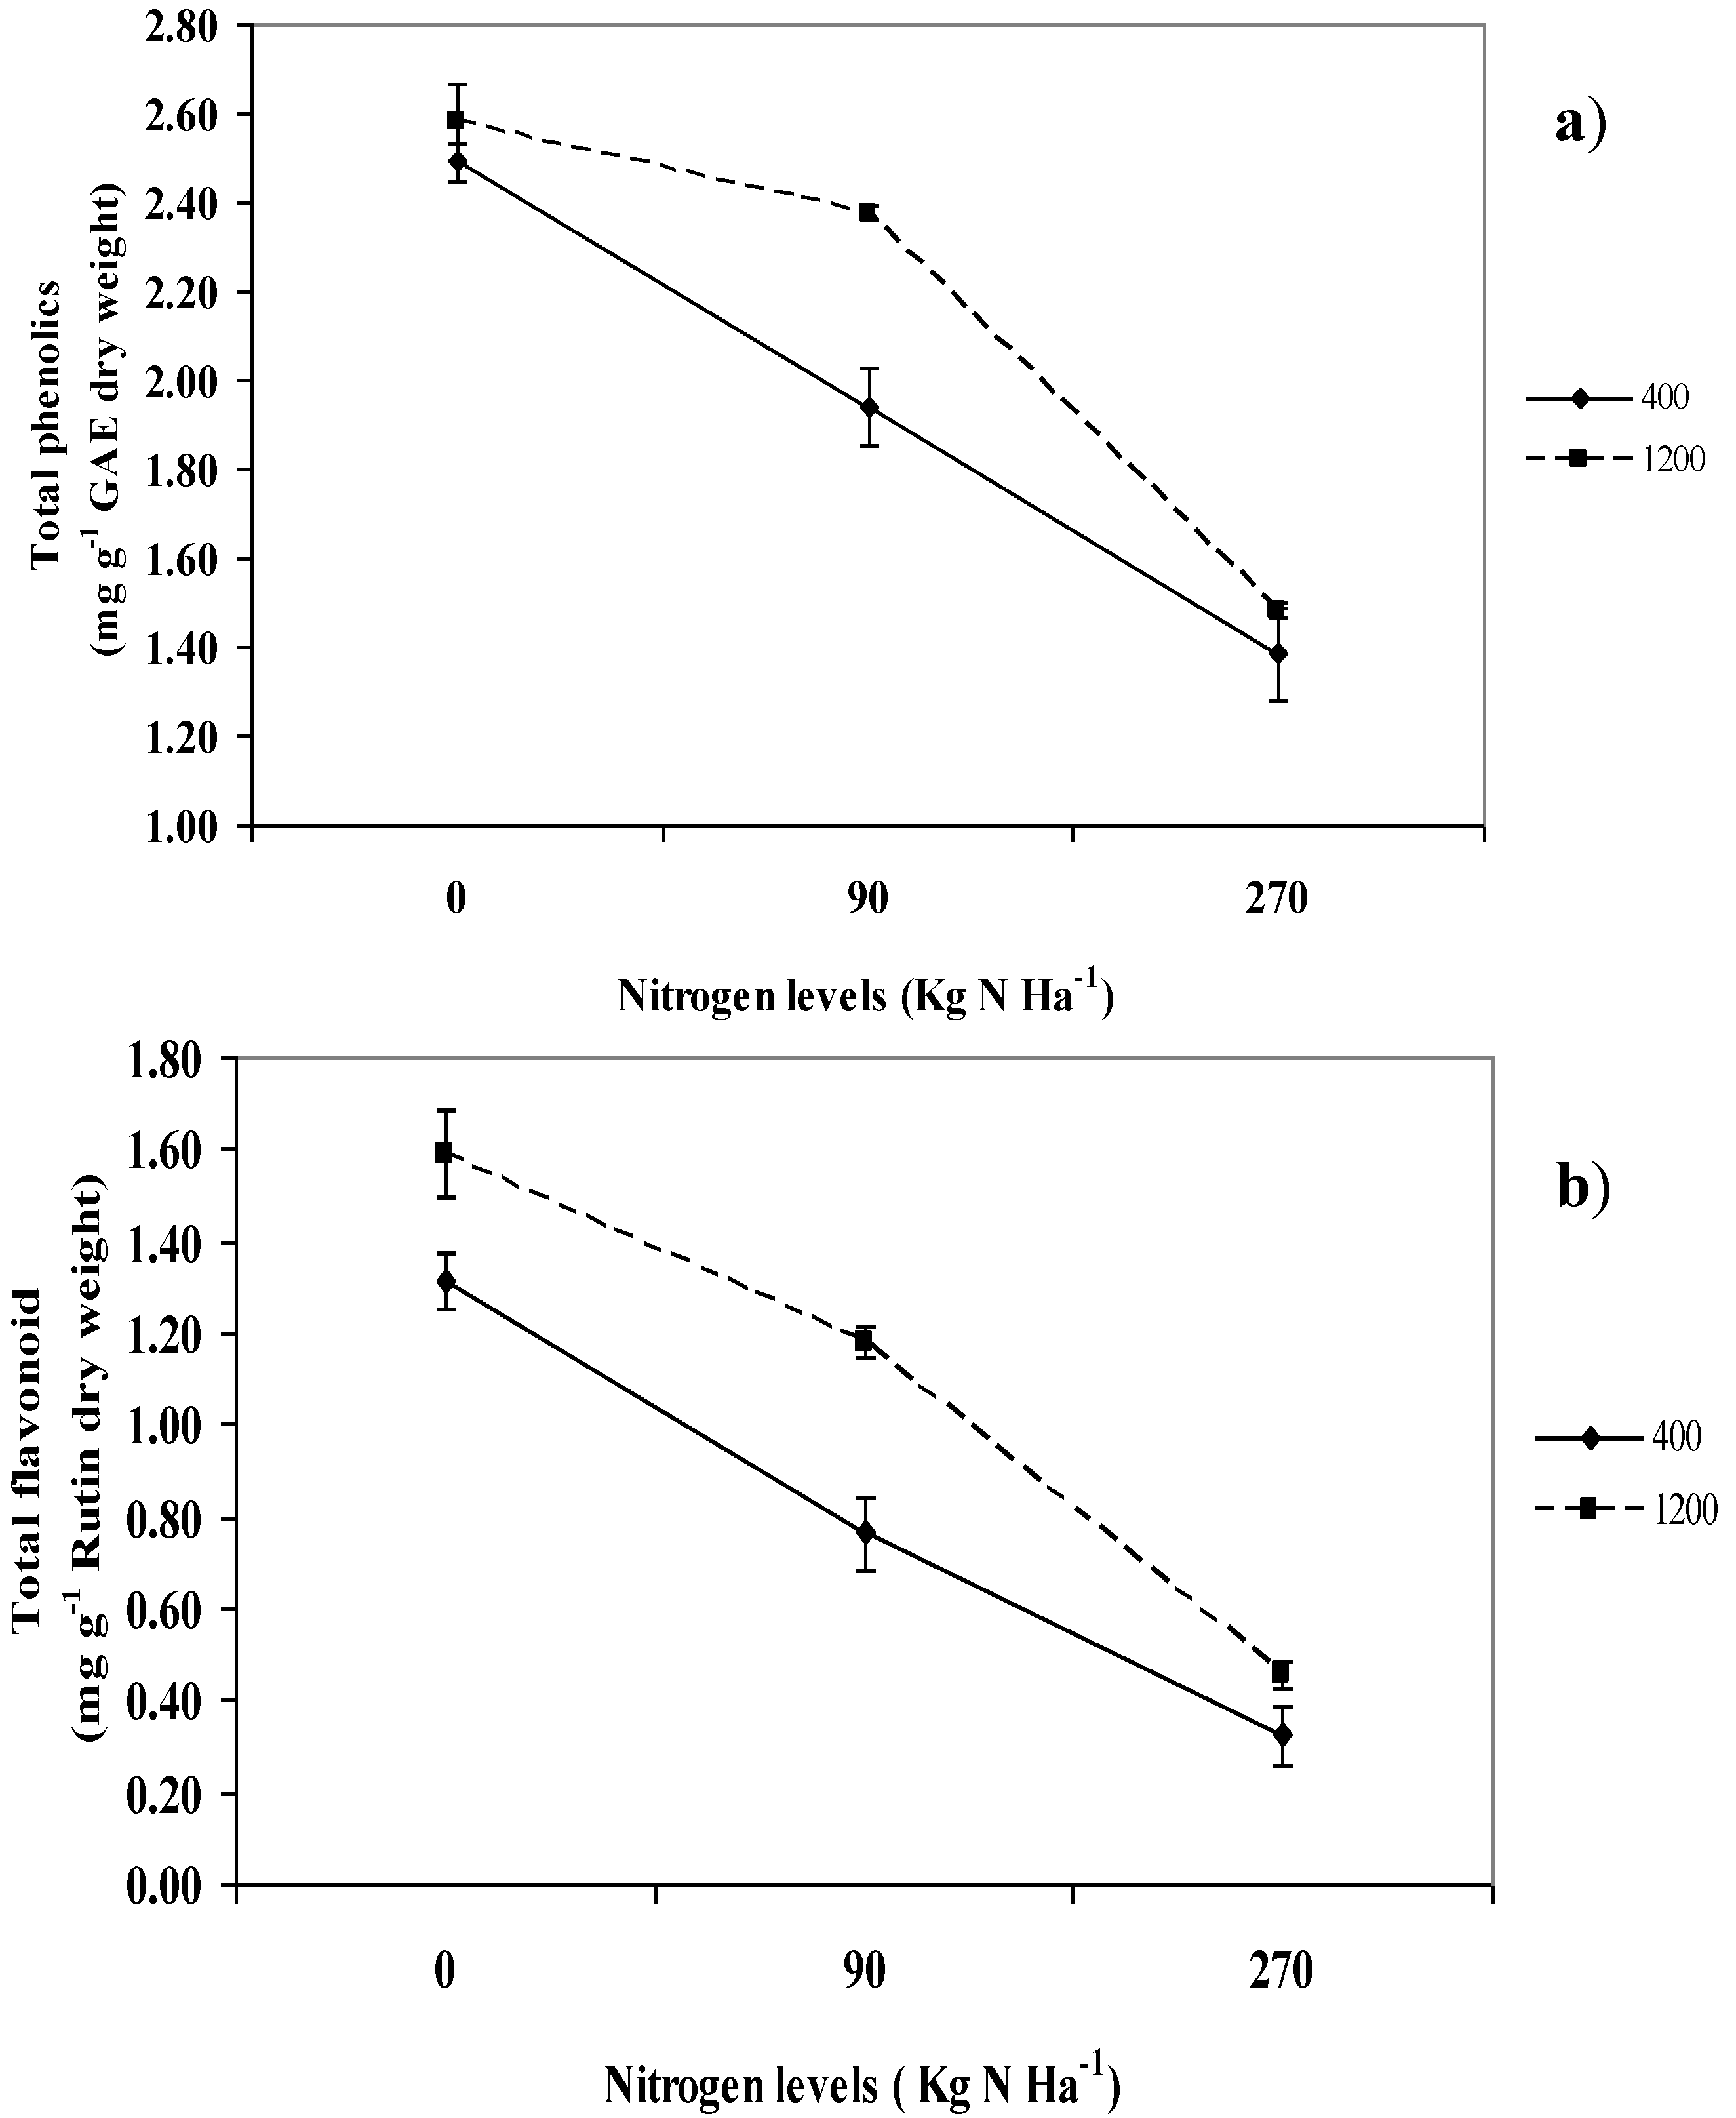
2.6. Total Phenolics and Flavonoids

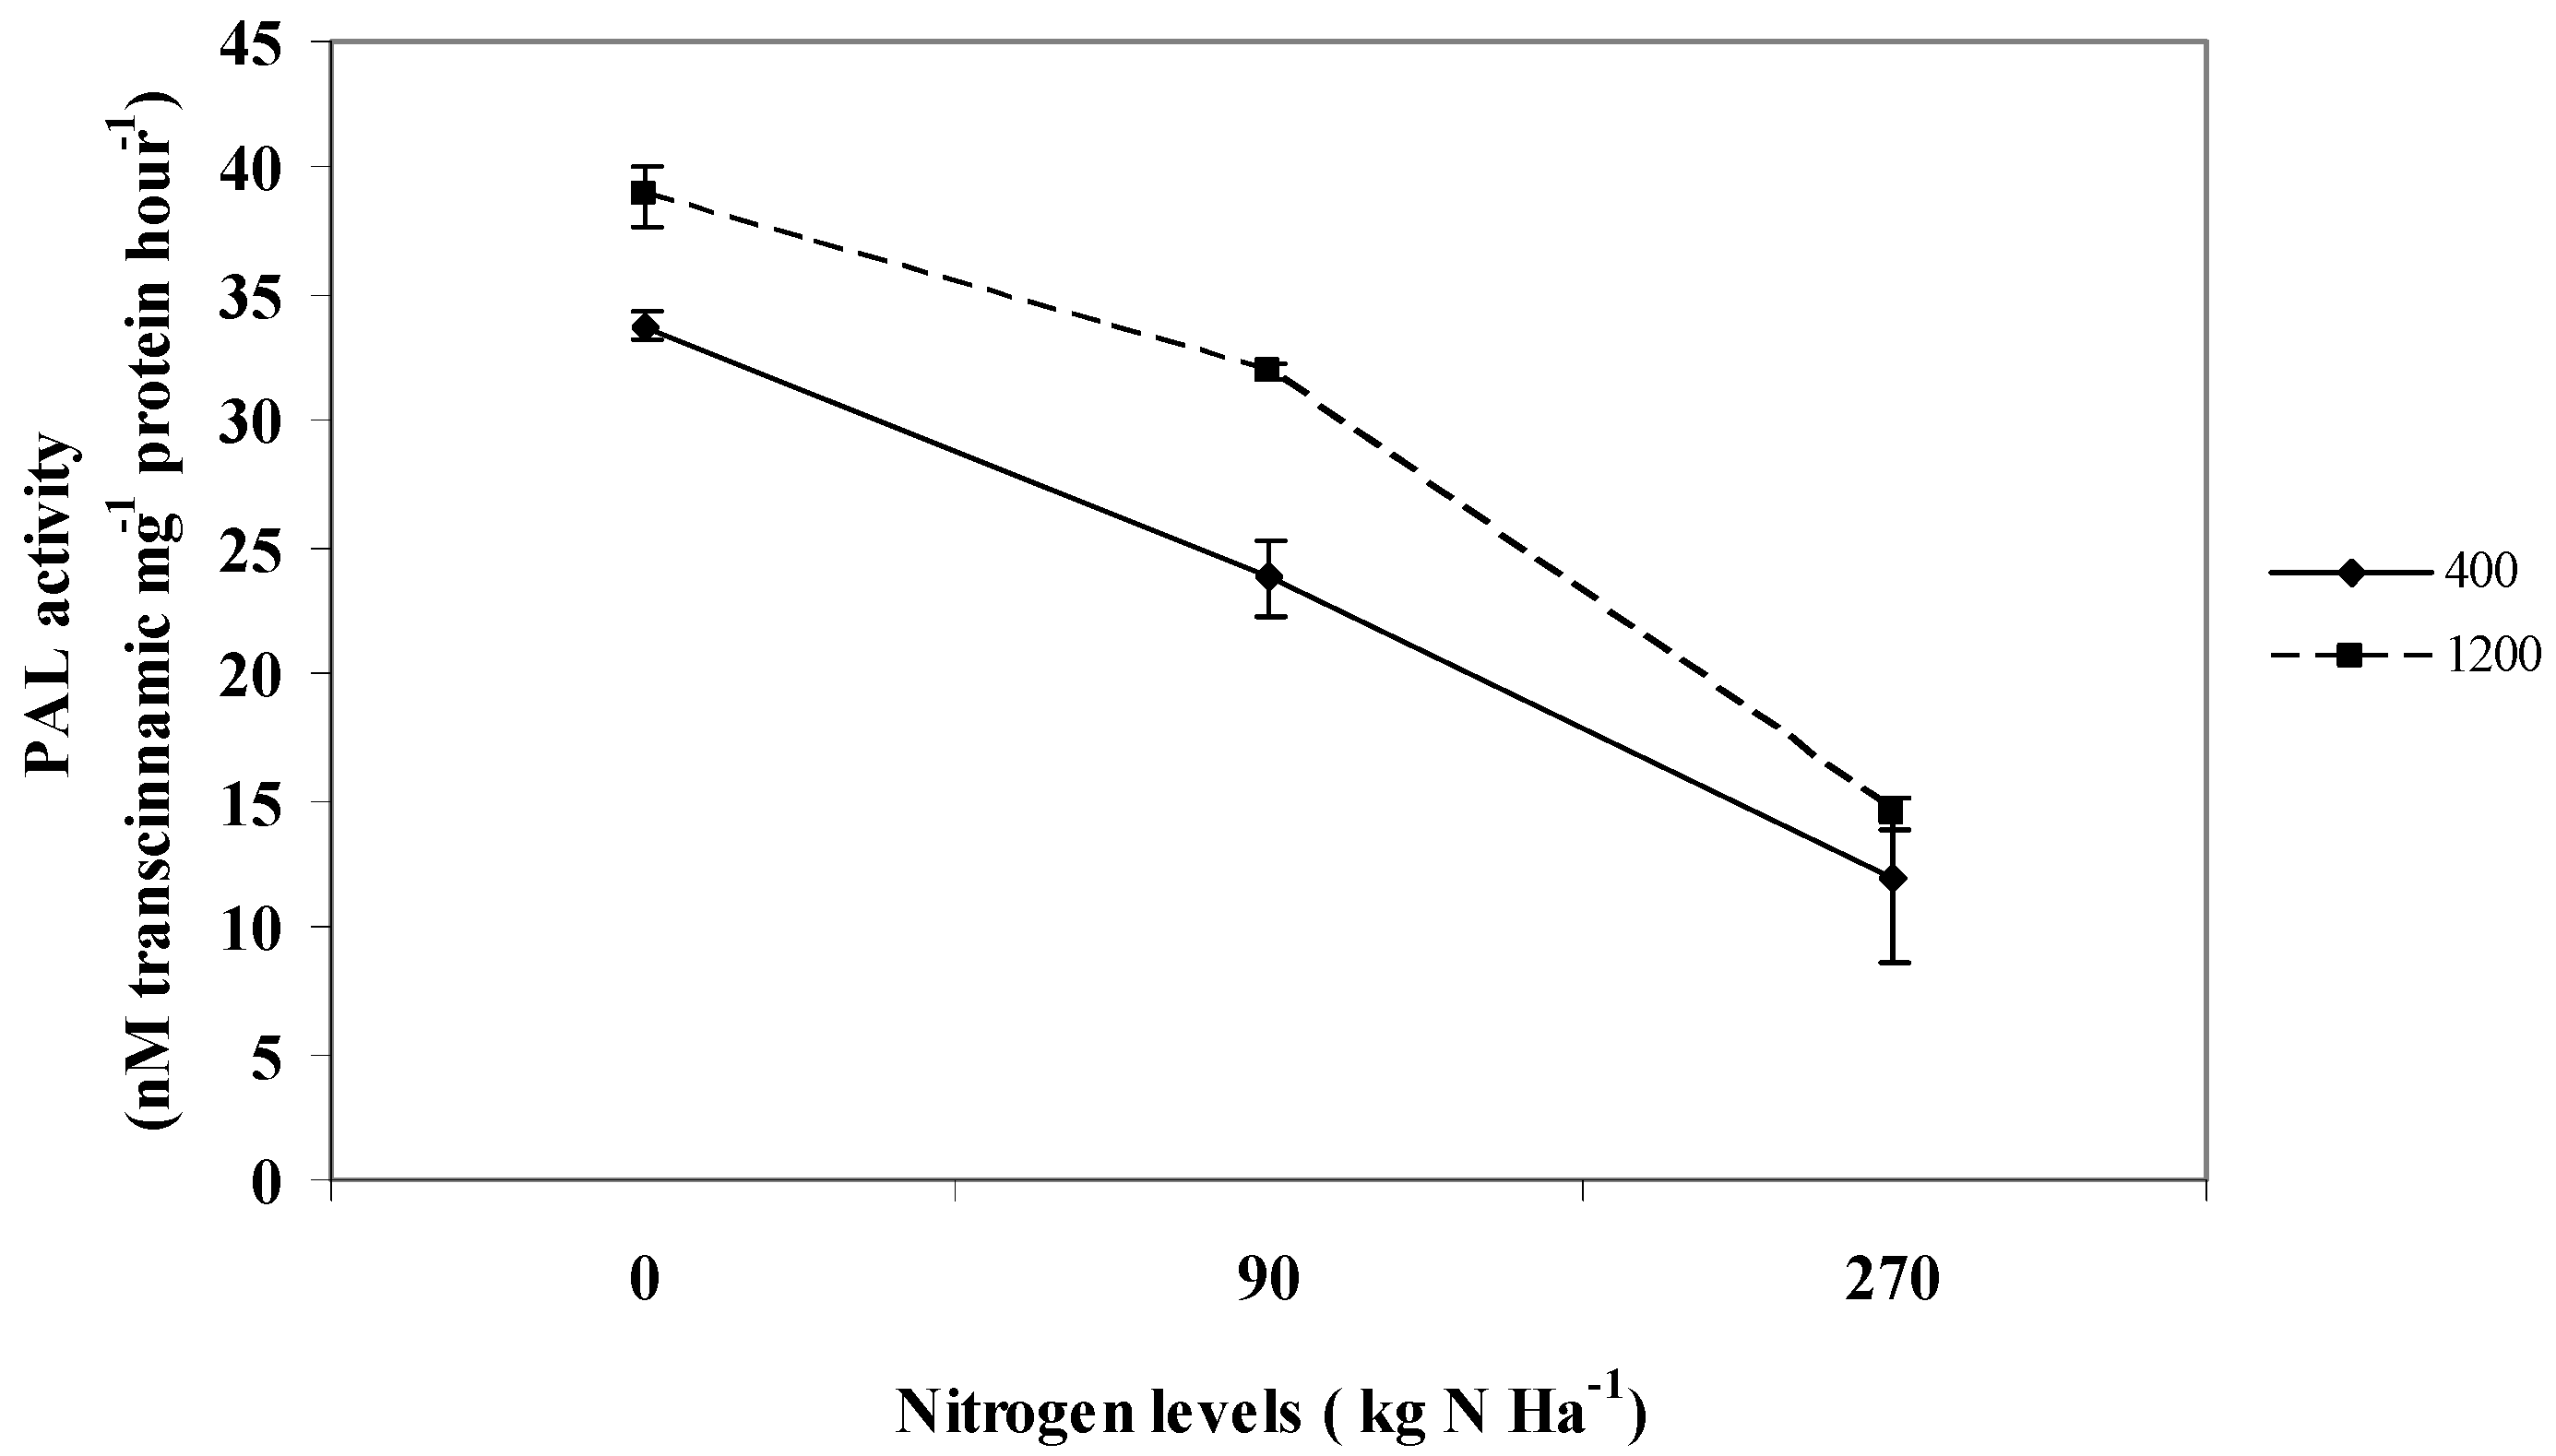
2.7. Phenylalanine-lyase; PAL Activity

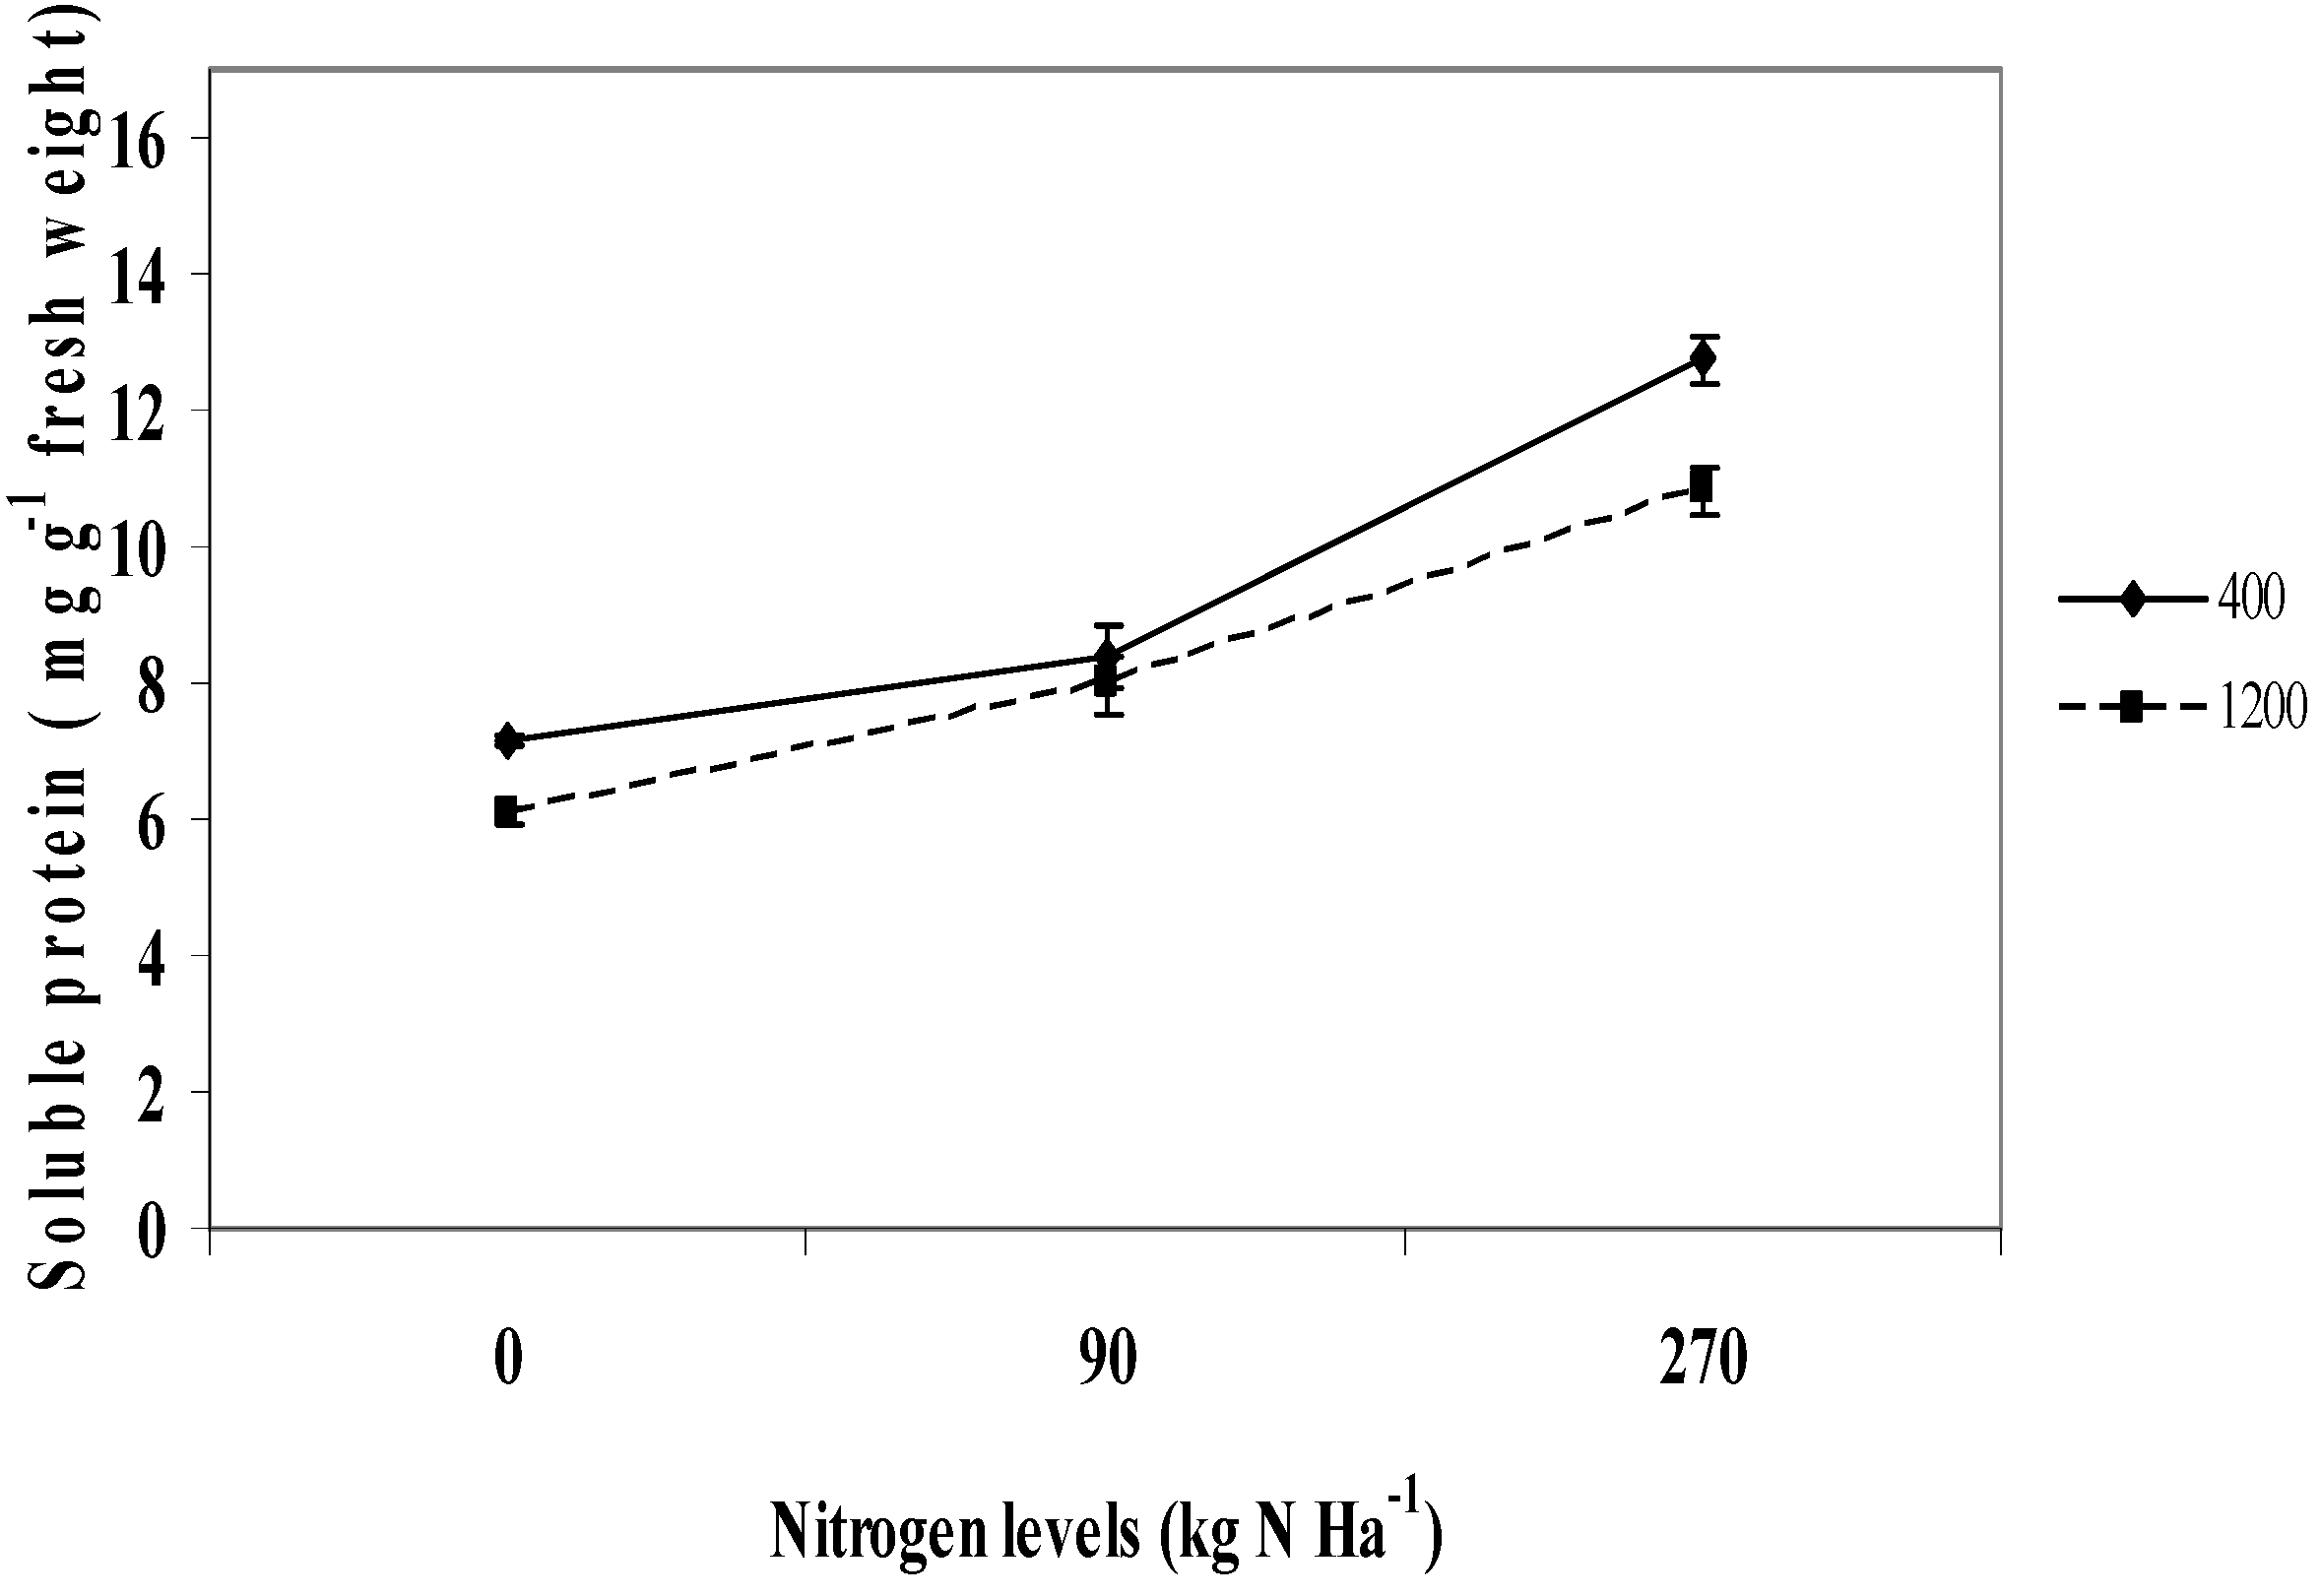
2.8. Soluble Protein

2.9. Sucrose to Starch Ratio

3. Experimental
3.1. Experimental Location, Plant Materials and Treatments
| CO2 levels (µmol mol−1) | Nitrogen (kg N Ha−1) 1,2 | Total nitrogen fertilizer per plant 3 (g) |
|---|---|---|
| 400 | 0 | 0.00 |
| 90 | 0.36 | |
| 270 | 1.08 | |
| 1,200 | 0 | 0.00 |
| 90 | 0.36 | |
| 270 | 1.08 |
3.2. Growth House Microclimate and CO2 Enrichment Treatment
3.3. Total Phenolics and Total Flavonoids Quantification
3.4. Glucose Determination
3.5. Sucrose Determination
3.6. Fructose Determination
3.7. Starch Determination
3.8. Total Soluble Sugar and Total Non Structural Carbohydrate (TNC)
3.9. Total Carbon, Nitrogen and C:N Ratio
3.10. Phenylalanine-ammonia-lyase (PAL)
3.11. Protein Determination
3.12. Statistical Analysis
4. Conclusions
Acknowledgements
References
- Jaafar, H.Z.E.; Mohamed, H.N.B.; Rahmat, A. Accumulation and partitioning of total phenols in two varieties of Labisia pumila Benth. under manipulation of greenhouse irradiance. Acta Hort. 2008, 797, 387–392. [Google Scholar]
- Sulaiman, B.; Mansor, M.; Jaafar, A. Some medicinal plants in mount Bubu Peral. In Proceeding in Medicinal Products From Tropical Rain Forest; Shaari, K., Abdul, K.A., Ali, M., Eds.; Forest Research Institute of Malaysia: Kepong, Malaysia, 1992; pp. 37–43. [Google Scholar]
- Burkill, I.H. A Dictionary of the Economic Products of the Malay Peninsula, 2nd ed; Government of Malaysia and Singapore Publication: Kuala Lumpur, Malaysia, 1935. [Google Scholar]
- Stone, B.C. Notes on the genus Labisia Lindyl (Myrsinaceae). Malayan Nat. J. 1988, 42, 43–51. [Google Scholar]
- Rozihawati, Z.; Aminah, H.; Lokman, N. Preliminary trials on the rooting ability of Labisia pumila cuttings. In Malaysia Science and Technology Congress 2003, Kuala Lumpur, Malaysia, 23–25 September 2003; Agricultural Sciences: Kuala Lumpur, Malaysia, 2003. [Google Scholar]
- Jamia, A.J.; Ibrahim, J.; Khairana, H.; Juriyati, H. Perkembangan Penyelidikan dan Pembangunan Kacip Fatimah; New Dimension in Complementary Health Care: Kuala Lumpur, Malaysia, 2004; pp. 13–19. [Google Scholar]
- Macheix, J.J.; Fleuriet, A. Fruit Phenolics; CRC Press: Boca Raton, FL, USA, 1990. [Google Scholar]
- Namiki, M. Antioxidant/antimutagens in food, critical reviews of food science and nutrition. Food Sci. Nutr. 1990, 29, 273–300. [Google Scholar]
- Norhaiza, M.; Maziah, M.; Hakiman, M. Antioxidative properties of leaf extracts of popular Malaysian herb, Labisia pumila. J. Med. Plant. Res. 2009, 3, 217–223. [Google Scholar]
- Fine, P.V.A.; Miller, Z.J.; Mesones, I.; Irazuzta, S.; Appel, H.M.; Stevens, M.H.H. The growth defense tradeoff and habitat specialization by plants in Amazonian forest. Ecology 2006, 87, 150–162. [Google Scholar]
- Jaafar, H.Z.E.; Ibrahim, M.H.; Por, L.S. Effects of CO2 enrichment on accumulation of total phenols, flavonoid and chlorophyll content in two varieties of Labisia pumila Benth. Exposed to different shade levels. In Proceedings of International Conference on Balanced Nutrient Management for Tropical Agriculture, Kuantan, Pahang, Malaysia, 15-22 February 2010; UPM: Kuala Lumpur, Malaysia, 2010; pp. 112–114. [Google Scholar]
- Ghasemzadeh, A.; Jaafar, H.Z.E.; Asmah, R. Elevated carbon dioxide increases contents of flavonoids and phenolics compound, and antioxidant activities in Malaysian young ginger (Zingiber officinale Roscoe) varieties. Molecules 2010, 15, 7907–7922. [Google Scholar]
- Ibrahim, M.H.; Jaafar, H.Z.E.; Rahmat, A.; Abdul Rahman, Z. The relationship between phenolics and flavonoids production with total non structural carbohydrate and photosynthetic rate in Labisia pumila Benth. under high CO2 and nitrogen fertilization. Molecules 2011, 16, 162–174. [Google Scholar]
- Jones, C.G.; Hartley, S.E. A protein competition model of phenolic allocation. Oikos 1999, 86, 27–44. [Google Scholar] [CrossRef]
- Bryant, J.P.; Chapin, F.S.; Klein, D.R. Carbon nutrient balance of boreal plants in relation to vertebrate herbivory. Oikos 1983, 40, 357–368. [Google Scholar] [CrossRef]
- Herms, D.A.; Matson, W.J. The dilemma of plants: To grow or defend. Quart. Rev. Biol. 1992, 67, 283–335. [Google Scholar]
- Wolfe, D.W.; Gifford, R.M.; Hilbert, D.; Luo, Y. Integration of photosynthetic acclimation to CO2 at the whole plant level. Glob. Change Biol. 1998, 4, 879–893. [Google Scholar] [CrossRef]
- Margna, U. Control at the level of substrate supply - an alternative in the regulation of phenylpropanoid accumulation in plant cells. Phytochemistry 1977, 16, 419–426. [Google Scholar] [CrossRef]
- Baas, W.J. Secondary plant compounds, their ecological significance and consequences for the carbon budget. Introduction of the carbon/nutrient cycle theory. In Causes and Consequences of Variation in Growth Rate and Productivity of Higher Plant; Lambers, H., Cambridge, M., Konings, H., Pons, T.L., Eds.; SPB Academic Publishing: The Hague, The Netherlands, 1989; pp. 313–340. [Google Scholar]
- Lambers, H. Rising CO2, secondary plant metabolism, plant herbivore interactions and litter decomposition. Theoretical considerations. Vegetatio 1993, 104/105, 263–271. [Google Scholar] [CrossRef]
- Hogy, P.; Fangmeier, A. Atmopsheric CO2 enrichment affects potatoes: Tuber quality traits. Eur. J. Agron. 2009, 30, 85–94. [Google Scholar] [CrossRef]
- Djeh, T.K.O.; Dali, N.; Bettaieb, T.; Salah, A.B. Effects of atmospheric CO2 enrichment on tomato crop irrigated by a saline solution. Cahiers Agr. 2006, 15, 441–447. [Google Scholar]
- Yoon, Y.J.; Mobin, M.; Han, E.J.; Paek, K.Y. Impact of in vitro CO2 enrichment and sugar deprivation on acclamatory responses of Phalaenopsis plantlets to ex vitro conditions. Environ. Exp. Bot. 2009, 65, 221–228. [Google Scholar]
- De-souza, A.P.; Gaspar, M.; Da-silva, E.A.; Ulian, E.C.; Waclawovsky, A.J.; Nishiyama, M.Y.; Dos, M.R.V.; Bucjkeridge, M.S. Elevated CO2 increases photosynthesis, biomass and productivity and modifies gene expression in sugarcane. Plant Cell Environ. 2008, 31, 1116. [Google Scholar]
- Paul, M.J.; Foyer, C.H. Sink regulation of photosynthesis. J. Exp. Bot. 2001, 52, 1383–1400. [Google Scholar] [CrossRef]
- Sun, J.; Kelly, J.; Gibson, K.M.; Kiirats, O.; Okita, T.W.; Edwards, G.E. Interactions of nitrate and CO2 enrichment on growth, carbohydrates and rubisco in Arabidopsis starch mutants. Significance of starch and hexose. Plant Physiol. 2002, 130, 1573–1583. [Google Scholar]
- Pilar, P.; Rosa, M.; Isabel, M.D.M.; Rafael, M.C. Diurnal changes of rubisco in response to elevated CO2, temperature and nitrogen in wheat grown under temperature gradient tunnels. Environ. Exp. Bot. 2005, 53, 13–27. [Google Scholar] [CrossRef] [Green Version]
- Rosa, M.; Prado, C.; Podaza, G.; Internadato, R.; Gonzalez, J.A.; Hilal, M.; Prado, F.E. Soluble sugars: Metabolism, sensing and abiotic stress. Plant Sig. Behav. 2009, 4-5, 388–393. [Google Scholar]
- Erbs, M.; Manderscheid, R.; Jansen, G.; Seddig, S.; Pacholski, A.; Weigel, H.J. Effects of free air carbon dioxide enrichment and nitrogen supply on grain quality parameters and elemental composition of wheat and barley grown in crop rotation. Agr. Ecol. Environ. 2010, 136, 59–68. [Google Scholar]
- Porteaus, F.; Hill, J.; Ball, A.S.; Pinter, P.J.; Kimbal, B.A.; Wall, G.W.; Ademsen, F.J.; Morris, C.F. Effects of free air carbon dioxide enrichment (FACE) on the chemical composition and nutritive value of wheat grain straw. Anim. Feed Sci. Technol. 2009, 149, 322–332. [Google Scholar]
- Jifon, J.L.; Wolfe, D.W. Photosynthetic acclimation to elevated CO2 in Phaseolus vulgaris is altered by growth response to nitrogen supply. Glob. Change Biol. 2002, 8, 1018–1027. [Google Scholar] [CrossRef]
- Preiss, J. Biosynthesis of starch and its regulation. In Encyclopedia of Plant Physiology; Loewus, F.A., Tanner, W., Eds.; Springer Verlag- Berlin: Berlin, Germany, 1982; Volume 13, pp. 397–417. [Google Scholar]
- Zhao, H.; Xu, X.; Zhang, Y.; Korpelainen, H.; Li, C. Nitrogen deposition limits photosynthetic response to elevated CO2 differentially in a dioecious species. Oecologica 2010, 165, 1–14. [Google Scholar]
- Aguera, E.; Cabello, P.; Haba, P. Induction of leaf senescence by nitrogen nutrition in sunflower (Heliantus annuus). Physiol. Planta 2010, 138, 112–134. [Google Scholar]
- Coviella, C.E.; Stipanovic, R.D.; Trumble, J.T. Plant allocation to defensive compounds: Interactions between elevated CO2 and nitrogen in transgenic cotton plants. J. Exp. Bot. 2002, 53, 323–331. [Google Scholar] [CrossRef]
- Winger, A.; Purdy, S.; Maclean, A.; Pourtau, N. The role of sugars in integrating environmental signals during the regulation of leaf senescence. New Phytol. 2006, 161, 781–789. [Google Scholar]
- Allen, J.L.; Vu, J.C.V.; Valle, R.R.; Boote, K.J.; Jones, P.H. Non-structural carbohydrates and nitrogen of soybean grown under carbon dioxide enrichment. Crop Sci. 1988, 28, 84–94. [Google Scholar]
- Poorter, H.; Berkel, Y.V.; Hertog, J.D.; Dijkstra, P.; Gifford, R.M.; Griffin, K.L.; Roumet, C.; Wong, S.C. The effects of elevated carbon dioxide on the chemical composition and construction costs of leaves of 27 C3 species. Plant Cell Environ. 1997, 20, 472–482. [Google Scholar]
- Arcelia, M.A.A.; Meribel, L.D.S. Fundamentals of plant physiology. In Plant Physiology; Society of Philipines: Pasig City, Philipines, 1999. [Google Scholar]
- Tognetti, R.; Johnson, J.D. The effect of elevated atmospheric CO2 concentration and nutrient supply on gas exchange, carbohydrates and foliar phenolics concentration in live oak (Quercus virginiana Mill.) seedlings. Ann. For. Sci. 1999, 56, 379–389. [Google Scholar] [CrossRef]
- Amin, A.A.; Rashad, M.; El-Abagy, H.M.H. Physiological effects of indole-3-butyric-acid and salicylic acid on growth, yield and chemical constituents of onion plants. J. Appl. Sci. Res. 2007, 3, 1554–1563. [Google Scholar]
- Hilal, M.; Parrado, M.E.; Rosa, M.; Gallardo, M.; Orce, L.; Massa, E.D. Epidermal lignin deposition in quinoa cotyledons in response to UV-B radiation. Photochem. Photobiol. 2004, 79, 205–210. [Google Scholar] [CrossRef]
- Dennis, D.T.; Blakeley, S.D. Carbohydrate metabolism. In Biochemistry and Molecular Biology of Plants; Buchanan, B.B., Gruisem, W., Jones, R.L., Eds.; American Society of Plant Physiologists: Rockville, MD, USA, 2000; pp. 630–675. [Google Scholar]
- Matros, A.; Amme, S.; Kettig, B.; Buck, S.G.H.; Sonnewald, U.Y.; Mock, H.P. Growth at elevated CO2 concentrations leads to modified profiles of secondary metabolites in tobacco cv. SamsumNN and to increased resistance against infection with potato virus Y. Plant Cell Environ. 2006, 29, 126–137. [Google Scholar] [CrossRef]
- Hartley, S.E.; Jones, C.G.; Couper, G.C.; Jones, T.H. Biosynthesis of plant phenolics compounds in elevated atmospheric CO2. Glob. Change Biol. 2000, 6, 497–506. [Google Scholar] [CrossRef]
- Gleadow, R.M.; Evans, J.R.; McCaffery, S.; Cavagnaro, T.R. Growth and nutritive value of cassava (Maribot esculenta Cranz) are reduced when grown in elevated CO2. Plant Biol. 2009, 11, 76–82. [Google Scholar] [CrossRef]
- Meyer, S.; Cerovic, Z.G.; Goulas, Y.; Montpied, P.; Demotes, S.; Bidel, L.P.R.; Moya, I.; Dreyer, E. Relationship between assessed polyphenols and chlorophyll contents and leaf mass per area ratio in woody plants. Plant Cell Environ. 2006, 29, 1338–1348. [Google Scholar] [CrossRef]
- Margna, U.; Margna, E.; Vainjarv, T. Influence of nitrogen nutrition on the utilization of L-phenylalanine for building flavonoids in buckwheat seedling tissue. J. Plant Physiol. 1989, 134, 697–702. [Google Scholar]
- Erik, H.M.; Catherine, S.; Pascale, C.; Thomas, B.; Christine, H.F.; Nathalie, G. Overexpression of sucrose -phosphate synthase in tomato plants grown with CO2 enrichment leads to decreased foliar carbohydrate accumulation relative to untransformed controls. Plant Physiol. Biochem. 1999, 37, 251–260. [Google Scholar]
- Cruz, C.; Lips, H.; Martins, L.M.A. Nitrogen use efficiency by slow growing species as affected by CO2 levels, root temperature, N source and availability. J. Plant Physiol. 2003, 160, 1421–1431. [Google Scholar] [CrossRef]
- Jaafar, Z.E.J.; Mohd Hafiz, I.; Philip, E. Leaf gas exchange properties of three varieties of Labisia pumila Benth. under greenhouse conditions. J. Trop. Plant Physiol. 2009, 3, 16–24. [Google Scholar]
- Hedge, J.E.; Hofreiter, B.T. Anthrone Determination for carbohydrate. In Carbohydrate Chemistry; Whistley, R.L., Be Miller, J.N., Eds.; Academic Press: New York, NY, USA, 1962. [Google Scholar]
- Edward, J.N. The effects of trinexapac ethyl and three nitrogen sources on creeping bentgrass (Agrostis stolonnifera) grown under three light environments. Master Thesis, Faculty of Horticulture and Crop Science, The Ohio State University, Columbus, OH, USA, 2008. [Google Scholar]
- Ashwel, G. Methods in Enzymology; Colowick, S.J., Kaplan, N.O., Eds.; Academic Press: New York, NY, USA, 1957; pp. 75–77. [Google Scholar]
- Thayumanam, B.; Sidasivam, S. Carbohydrate chemistry. Qual. Plant Foods Hum. Nutr. 1984, 34, 253–254. [Google Scholar] [CrossRef]
- Martinez-Tellez, M.A.; Lafuente, M.T. Effects of high temperature conditioning on ethylene, phenylalanine ammonia lyase, peroxidase and polyphenol oxidase in flavedo of chilled “Fortune” mandarin fruit. J. Plant Physiol. 1997, 150, 674–678. [Google Scholar] [CrossRef]
- Bradford, M. A rapid and sensitive method for the quantification of microgram quantities of protein utilizing the principle of protein dye-binding. Anal. Biochem. 1976, 72, 248–254. [Google Scholar]
- Sample Availability: Samples are not available.
© 2011 by the authors; licensee MDPI, Basel, Switzerland. This article is an open access article distributed under the terms and conditions of the Creative Commons Attribution license ( http://creativecommons.org/licenses/by/3.0/).
Share and Cite
Ibrahim, M.H.; Jaafar, H.Z.E. Involvement of Carbohydrate, Protein and Phenylanine Ammonia Lyase in Up-Regulation of Secondary Metabolites in Labisia pumila under Various CO2 and N2 Level. Molecules 2011, 16, 4172-4190. https://doi.org/10.3390/molecules16054172
Ibrahim MH, Jaafar HZE. Involvement of Carbohydrate, Protein and Phenylanine Ammonia Lyase in Up-Regulation of Secondary Metabolites in Labisia pumila under Various CO2 and N2 Level. Molecules. 2011; 16(5):4172-4190. https://doi.org/10.3390/molecules16054172
Chicago/Turabian StyleIbrahim, Mohd Hafiz, and Hawa Z.E. Jaafar. 2011. "Involvement of Carbohydrate, Protein and Phenylanine Ammonia Lyase in Up-Regulation of Secondary Metabolites in Labisia pumila under Various CO2 and N2 Level" Molecules 16, no. 5: 4172-4190. https://doi.org/10.3390/molecules16054172