Self-Organizing Maps of Molecular Descriptors for Sesquiterpene Lactones and Their Application to the Chemotaxonomy of the Asteraceae Family


Abstract
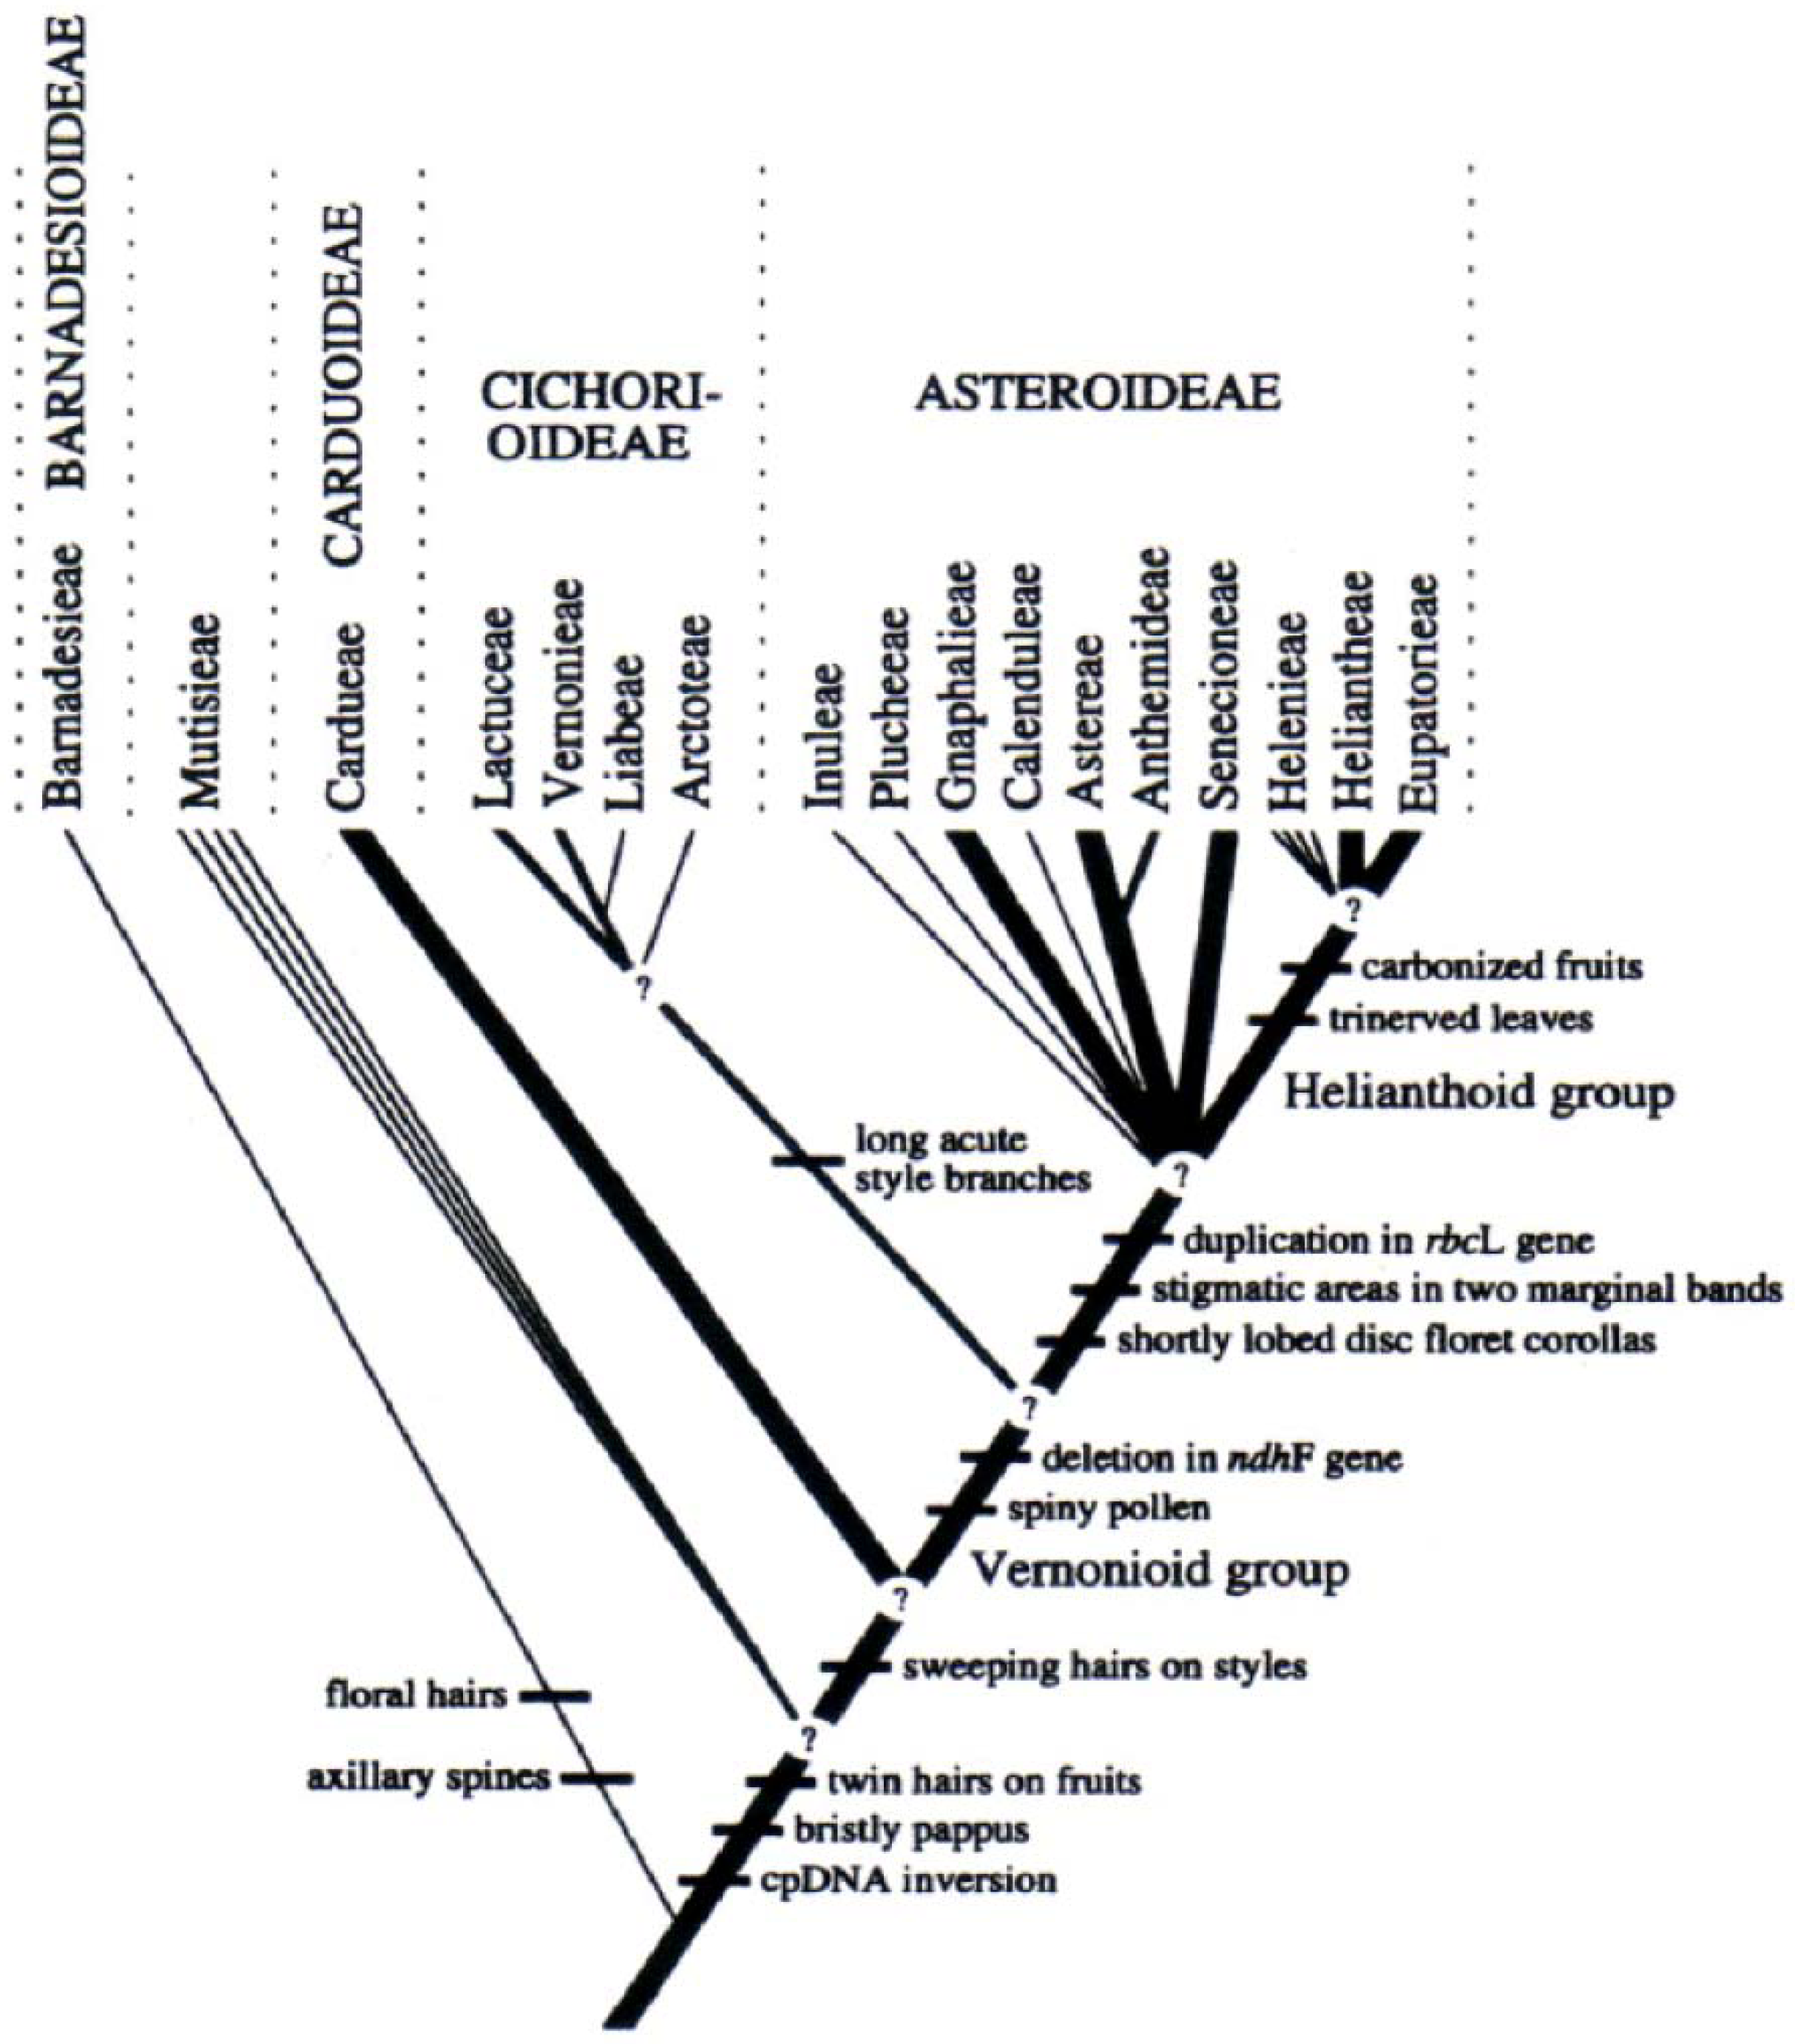
:1. Introduction

2. Results and Discussion
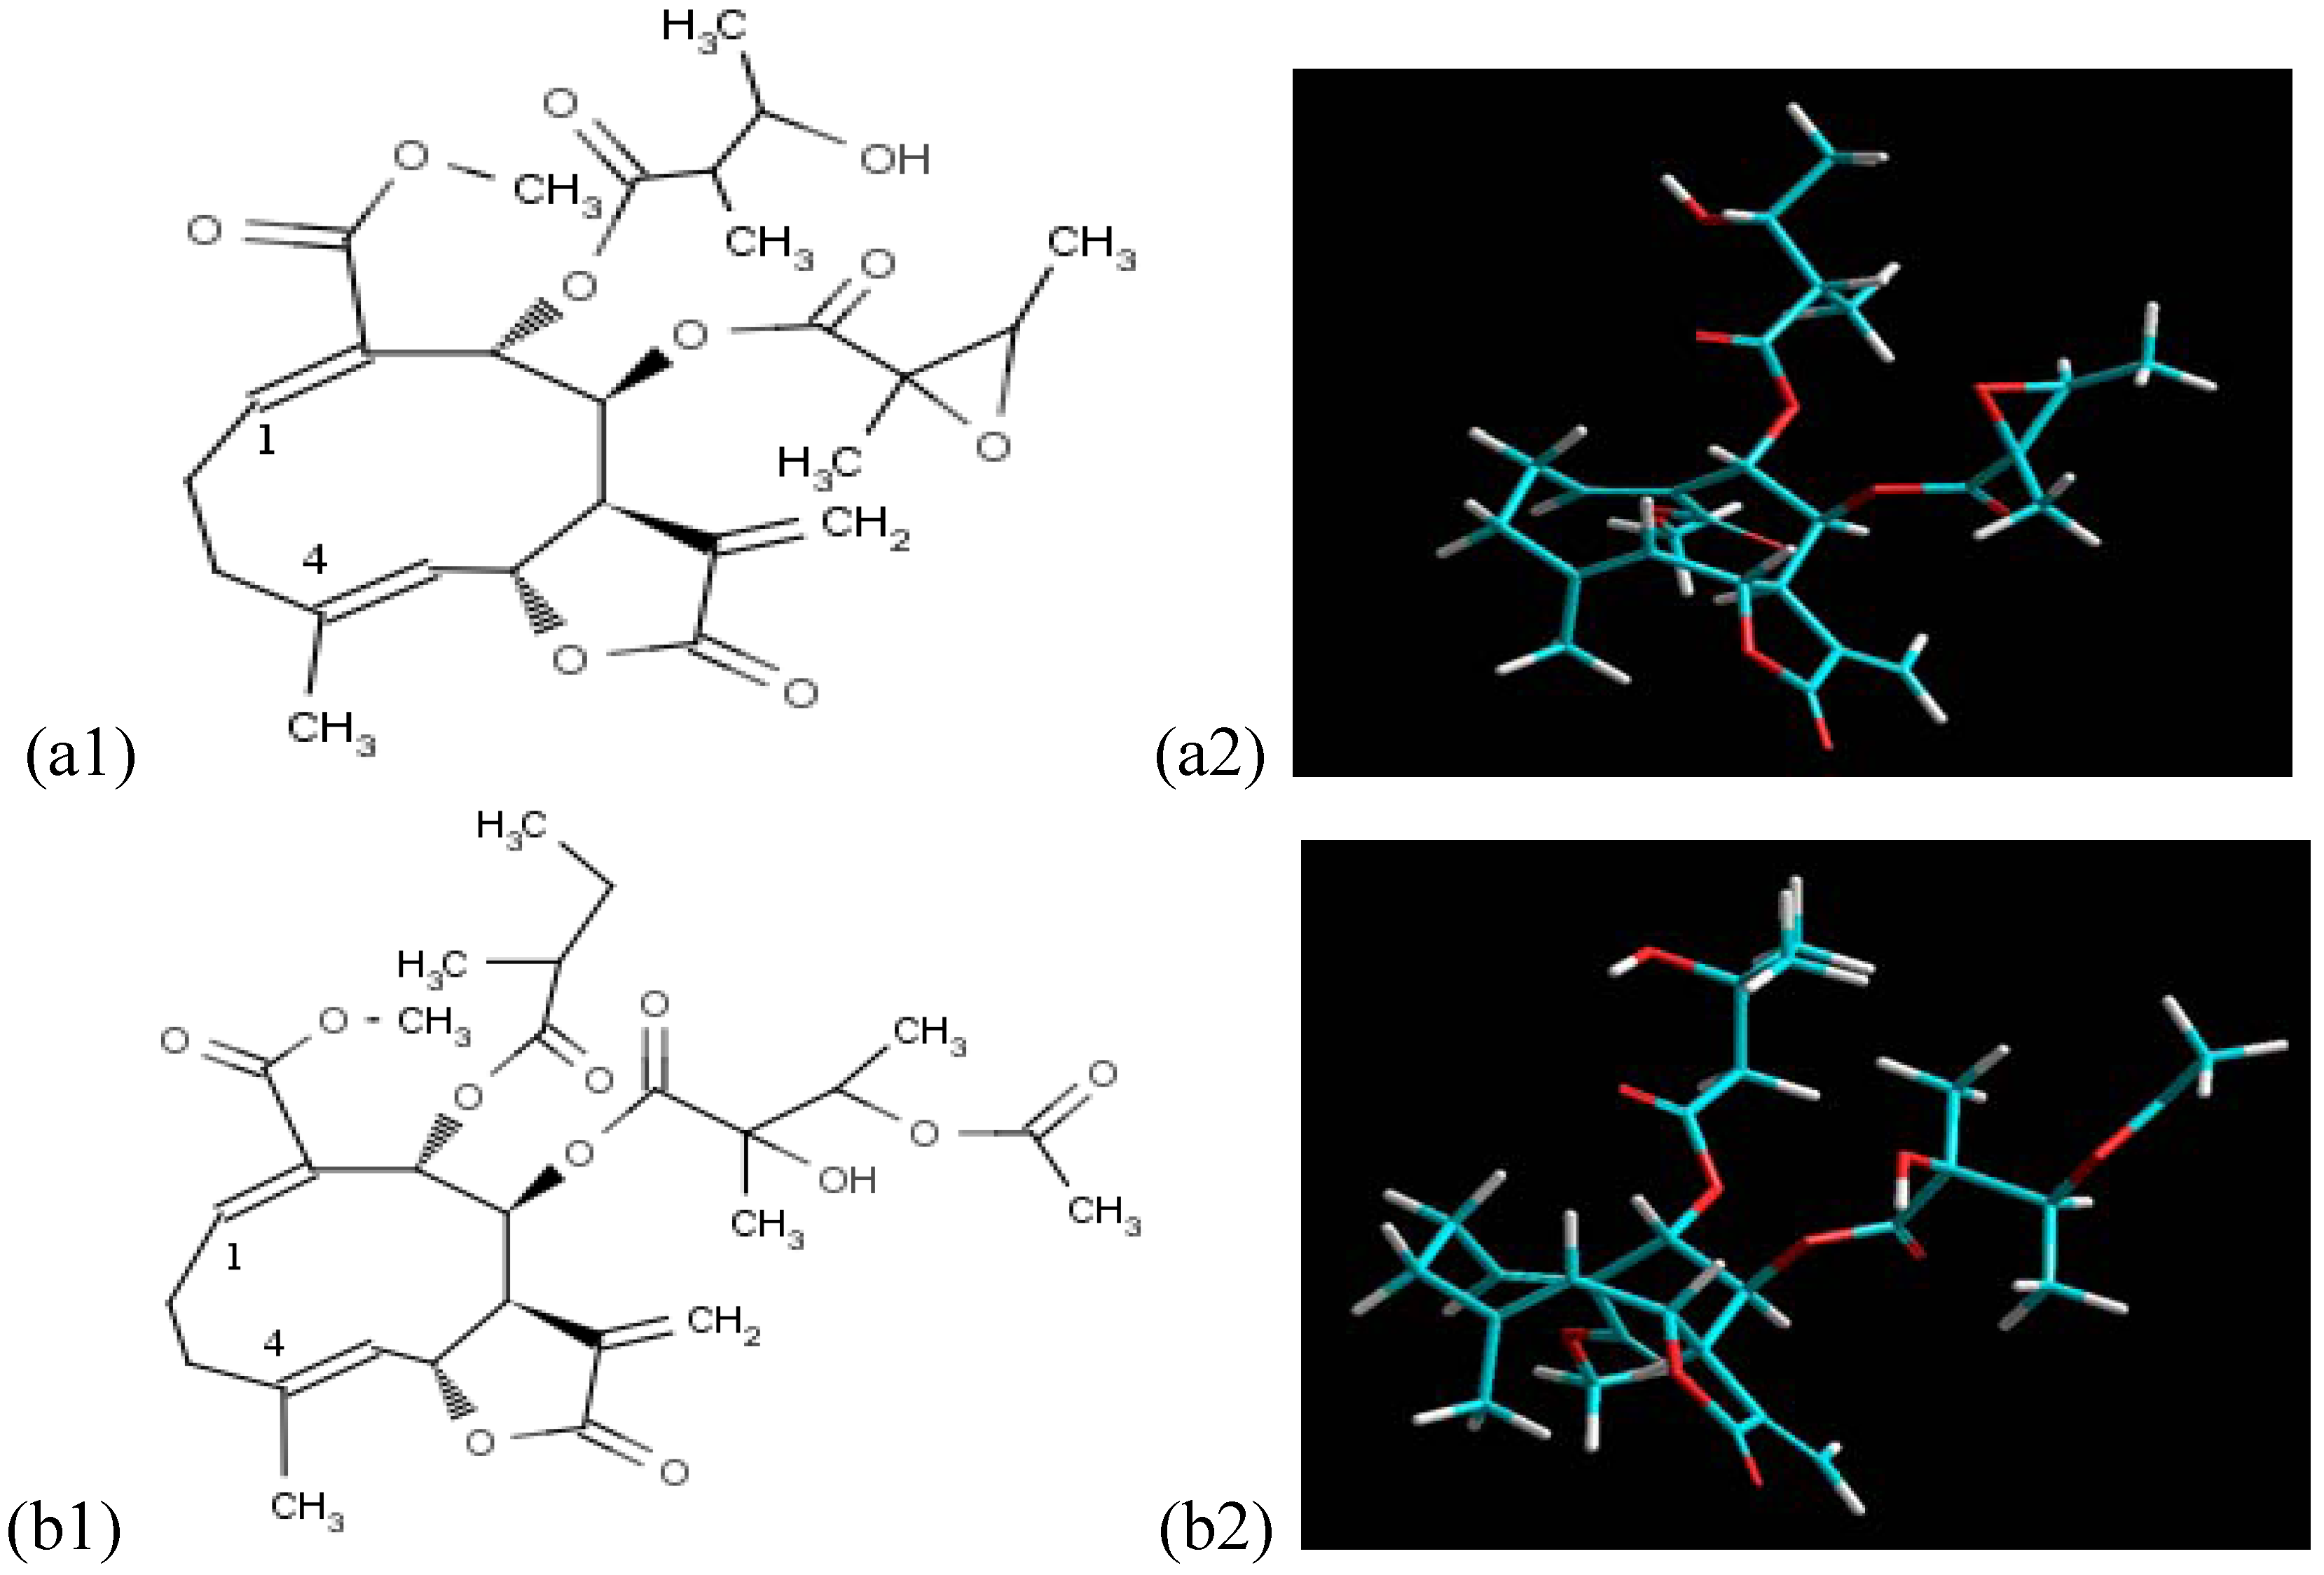
2.1. Data Generated from the Three-Dimensional Structures and Their Respective Chemical Occurrences, Using SISTEMATX

| Tribe | Acronym | Subtribe | Genus | Species | Occurrences | Compounds | Occurrences/compounds |
|---|---|---|---|---|---|---|---|
| Mutisieae | Mut | 2 | 7 | 11 | 27 | 22 | 1.23 |
| Cardueae | Car | 3 | 15 | 55 | 118 | 63 | 1.87 |
| Lactuceae | Lac | 5 | 6 | 13 | 28 | 17 | 1.64 |
| Vernonieae | Ver | 7 | 16 | 85 | 215 | 116 | 1.85 |
| Liabeae | Lia | 1 | 4 | 7 | 15 | 12 | 1.25 |
| Arctoteae | Arc | 3 | 4 | 7 | 14 | 12 | 1.16 |
| Inuleae | Inu | 1 | 5 | 21 | 104 | 69 | 1.51 |
| Plucheeae | Plu | 1 | 1 | 1 | 1 | 1 | 1.00 |
| Gnaphalieae | Gna | 3 | 5 | 5 | 7 | 7 | 1.00 |
| Astereae | Ast | 2 | 2 | 3 | 8 | 8 | 1.00 |
| Anthemideae | Ant | 9 | 15 | 130 | 363 | 154 | 2.16 |
| Senecioneae | Sen | 2 | 9 | 22 | 57 | 37 | 1.54 |
| Helenieae | Hel | 3 | 14 | 73 | 209 | 123 | 1.69 |
| Heliantheae | Hln | 9 | 39 | 163 | 612 | 385 | 1.59 |
| Eupatorieae | Eup | 12 | 19 | 62 | 201 | 165 | 1.22 |
| Total | 63 | 161 | 658 | 1979 | 1111 | 1.78 |
2.2. Molecular Descriptors and Average Degree of Oxidation (NOX/nC)

| Tribe | Observed NOX/nC | Predicted NOX/nC | Residual (Actual - Calculated) |
|---|---|---|---|
| Mutisieae | −0.753 | −0.774 | 0.021 |
| Cardueae | −0.655 | −0.626 | −0.029 |
| Lactuceae | −0.620 | −0.605 | −0.015 |
| Vernonieae | −0.560 | −0.582 | 0.022 |
| Liabeae | −0.807 | −0.772 | −0.035 |
| Arctoteae | −0.819 | −0.817 | −0.002 |
| Inuleae | −0.934 | −0.942 | 0.008 |
| Plucheeae | −0.700 | −0.723 | 0.023 |
| Gnaphalieae | −0.847 | −0.859 | 0.012 |
| Astereae | −0.983 | −0.983 | 0.000 |
| Anthemideae | −0.794 | −0.798 | 0.004 |
| Senecioneae | −0.936 | −0.929 | −0.007 |
| Helenieae | −0.698 | −0.717 | 0.018 |
| Heliantheae | −0.692 | −0.706 | 0.014 |
| Eupatorieae | −0.593 | −0.603 | 0.009 |
2.3. Self-Organising Maps (Kohonen) and Molecular Descriptors in the Chemotaxonomy of the Asteraceae Family Tribes
- Anthemideae: blue,
- Cardueae: brown,
- Eupatorieae: yellow,
- Helenieae: orange,
- Heliantheae: red,
- Inuleae: pink,
- Lactuceae: grey,
- Senecioneae: light blue,
- Vernonieae: green.
| Constitutionals – 40 × 30 a | Functional groups - 35 × 35 a | Atom-Centred - 40 × 30 a | 2D Autocorrelation-40 × 30 a | ||||||||
|---|---|---|---|---|---|---|---|---|---|---|---|
| Tribe | Occurrences | Nº of hits | % of hits | Nº of hits | % of hits | Nº of hits | % of hits | Nº of hits | % of hits | ||
| Cardueae | 118 | 81 | 68.6 | 103 | 87.3 | 101 | 85.6 | 95 | 80.5 | ||
| Lactuceae | 28 | 18 | 64.3 | 20 | 71.4 | 21 | 75.0 | 14 | 50.0 | ||
| Vernonieae | 215 | 147 | 68.4 | 174 | 80.9 | 175 | 81.4 | 178 | 82.8 | ||
| Inuleae | 104 | 29 | 27.9 | 32 | 30.8 | 46 | 44.2 | 61 | 58.7 | ||
| Anthemideae | 363 | 268 | 73.8 | 334 | 92.0 | 338 | 93.1 | 336 | 92.6 | ||
| Senecioeae | 57 | 38 | 66.7 | 50 | 87.7 | 53 | 93.0 | 47 | 82.5 | ||
| Helenieae | 209 | 110 | 52.6 | 159 | 76.1 | 171 | 81.8 | 176 | 84.2 | ||
| Heliantheae | 612 | 451 | 73.7 | 517 | 84.5 | 511 | 83.5 | 522 | 85.3 | ||
| Eupatorieae | 201 | 130 | 64.7 | 148 | 73.6 | 157 | 78.1 | 151 | 75.1 | ||
| Total | 1907 | 1272 | 66.7 | 1537 | 80.6 | 1573 | 82.5 | 1580 | 82.9 | ||
| BCUT - 40 × 30 a | Topological - 40 × 30 a | Geometrical - 40 × 30 a | RDF - 40 × 30 a | ||||||||
| Tribe | Occurrences | Nº of hits | % of hits | Nº of hits | % of hits | Nº of hits | % of hits | Nº of hits | % of hits | ||
| Cardueae | 118 | 105 | 89.0 | 99 | 83.9 | 96 | 81.4 | 97 | 82.2 | ||
| Lactuceae | 28 | 19 | 67.9 | 22 | 78.6 | 20 | 71.4 | 17 | 60.7 | ||
| Vernonieae | 215 | 165 | 76.7 | 168 | 78.1 | 164 | 76.3 | 167 | 77.7 | ||
| Inuleae | 104 | 59 | 56.7 | 57 | 54.8 | 49 | 47.1 | 54 | 51.9 | ||
| Anthemideae | 363 | 342 | 94.2 | 324 | 89.3 | 339 | 93.4 | 341 | 93.9 | ||
| Senecioeae | 57 | 52 | 91.2 | 46 | 80.7 | 44 | 77.2 | 48 | 84.2 | ||
| Helenieae | 209 | 183 | 87.6 | 175 | 83.7 | 180 | 86.1 | 180 | 86.1 | ||
| Heliantheae | 612 | 513 | 83.8 | 497 | 81.2 | 487 | 79.6 | 529 | 86.4 | ||
| Eupatorieae | 201 | 154 | 76.6 | 160 | 79.6 | 156 | 77.6 | 161 | 80.1 | ||
| Total | 1907 | 1592 | 83.5 | 1548 | 81.2 | 1535 | 80.5 | 1594 | 83.6 | ||
| 3D-MoRSE-40 × 30 a | GETAWAY- 40 × 35 a | WHIM – 40 × 30 a | |||||||||
| Tribe | Occurrences | Nº of hits | % of hits | Nº of hits | % of hits | Nº of hits | % of hits | ||||
| Cardueae | 118 | 83 | 70.3 | 104 | 88.1 | 106 | 89.8 | ||||
| Lactuceae | 28 | 17 | 60.7 | 17 | 60.7 | 19 | 67.9 | ||||
| Vernonieae | 215 | 143 | 66.5 | 164 | 76.3 | 166 | 77.2 | ||||
| Inuleae | 104 | 43 | 41.3 | 50 | 48.1 | 57 | 54.8 | ||||
| Anthemideae | 363 | 290 | 79.9 | 341 | 93.9 | 339 | 93.4 | ||||
| Senecioeae | 57 | 33 | 57.9 | 46 | 80.7 | 44 | 77.2 | ||||
| Helenieae | 209 | 121 | 57.9 | 173 | 82.8 | 158 | 75.6 | ||||
| Heliantheae | 612 | 430 | 70.3 | 498 | 81.4 | 517 | 84.5 | ||||
| Eupatorieae | 201 | 128 | 63.7 | 168 | 83.6 | 149 | 74.1 | ||||
| Total | 1907 | 1288 | 67.5 | 1561 | 81.9 | 1555 | 81.5 | ||||

| Tribe | Train set 1 | Train set 2 | Train set 3 | Train set 4 | Train set 5 | Train set 6 | Train set 7 | Train set 8 | Train set 9 | Average |
|---|---|---|---|---|---|---|---|---|---|---|
| Cardueae | 89.1 | 79.4 | 86.9 | 86.1 | 84.6 | 88.9 | 85.2 | 90.7 | 91.7 | 87.0 |
| Lactuceae | 68.0 | 74.1 | 82.6 | 65.2 | 76.2 | 69.2 | 73.1 | 70.8 | 69.6 | 72.1 |
| Vernonieae | 79.1 | 82.4 | 78.9 | 75.1 | 78.3 | 78.6 | 82.4 | 80.0 | 80.2 | 79.4 |
| Inuleae | 47.8 | 52.7 | 47.3 | 51.6 | 50.0 | 40.9 | 54.8 | 37.5 | 62.5 | 49.5 |
| Anthemideae | 88.9 | 92.4 | 91.8 | 93.4 | 92.7 | 93.1 | 90.5 | 90.8 | 91.7 | 91.7 |
| Senecioeae | 87.0 | 82.4 | 82.1 | 85.4 | 87.0 | 88.2 | 82.4 | 86.0 | 84.8 | 85.0 |
| Helenieae | 75.3 | 74.6 | 72.8 | 76.7 | 70.1 | 71.4 | 78.8 | 77.0 | 75.4 | 74.7 |
| Heliantheae | 83.7 | 82.6 | 81.8 | 81.4 | 83.4 | 83.5 | 82.2 | 82.5 | 82.1 | 82.6 |
| Eupatorieae | 79.2 | 82.5 | 81.6 | 77.0 | 80.6 | 77.0 | 79.2 | 76.0 | 77.7 | 79.0 |
| Total | 81.0 | 80.7 | 80.9 | 80.6 | 81.1 | 80.6 | 81.7 | 80.5 | 81.9 | 81.0 |
| Tribe | Test set 1 | Test set 2 | Test set 3 | Test set 4 | Test set 5 | Test set 6 | Test set 7 | Test set 8 | Test set 9 | Average |
| Cardueae | 62.5 | 68.8 | 81.8 | 76.4 | 42.9 | 30.0 | 80.0 | 63.6 | 100.0 | 67.3 |
| Lactuceae | 50.0 | - | 50.0 | 50.0 | 66.7 | 100.0 | 100.0 | 100.0 | 50.0 | 70.8 |
| Vernonieae | 63.2 | 59.1 | 68.0 | 66.7 | 52.9 | 85.7 | 72.7 | 75.0 | 85.7 | 69.9 |
| Inuleae | 9.1 | 30.0 | 33.3 | 20.0 | 27.3 | 20.0 | 20.0 | 14.3 | 42.9 | 24.1 |
| Anthemideae | 79.2 | 90.9 | 87.9 | 80.0 | 80.0 | 65.9 | 73.0 | 80.0 | 83.3 | 80.0 |
| Senecioeae | 33.3 | 66.7 | 0 | 66.7 | 66.7 | 83.3 | 83.3 | 71.4 | 80.0 | 61.3 |
| Helenieae | 57.9 | 75.0 | 62.1 | 45.0 | 44.0 | 54.2 | 67.9 | 59.1 | 91.7 | 61.9 |
| Heliantheae | 64.5 | 66.7 | 58.5 | 60.9 | 70.4 | 70.7 | 65.0 | 62.3 | 83.9 | 67.0 |
| Eupatorieae | 72.2 | 27.8 | 54.5 | 55.6 | 80.0 | 56.5 | 39.3 | 55.6 | 66.7 | 56.5 |
| Total | 64.2 | 64.2 | 64.2 | 61.6 | 63.7 | 62.6 | 63.7 | 64.2 | 82.1 | 65.6 |
| Tribe | Train set 1 | Train set 2 | Train set 3 | Train set 4 | Train set 5 | Train set 6 | Train set 7 | Train set 8 | Train set 9 | Average |
|---|---|---|---|---|---|---|---|---|---|---|
| Cardueae | 82.7 | 82.4 | 87.2 | 87.3 | 82.5 | 88.2 | 86.5 | 79.8 | 83.7 | 84.5 |
| Lactuceae | 50.0 | 33.3 | 46.2 | 42.3 | 42.3 | 44.0 | 50.0 | 41.7 | 45.8 | 44.0 |
| Vernonieae | 78.8 | 76.8 | 75.9 | 73.5 | 74.9 | 78.8 | 78.6 | 78.5 | 77.8 | 77.1 |
| Inuleae | 62.2 | 52.8 | 53.3 | 59.8 | 61.5 | 67.4 | 45.2 | 56.8 | 50.0 | 56.6 |
| Anthemideae | 93.3 | 95.7 | 93.8 | 93.7 | 93.4 | 89.2 | 89.5 | 91.0 | 92.5 | 92.5 |
| Senecioeae | 71.2 | 77.4 | 77.4 | 81.1 | 82.4 | 89.6 | 75.5 | 83.3 | 76.6 | 79.4 |
| Helenieae | 76.5 | 71.4 | 79.9 | 72.8 | 75.0 | 77.7 | 80.1 | 75.0 | 72.9 | 75.7 |
| Heliantheae | 84.9 | 81.3 | 82.9 | 82.0 | 81.2 | 84.9 | 81.9 | 83.8 | 84.7 | 83.1 |
| Eupatorieae | 77.6 | 77.7 | 73.3 | 78.1 | 82.4 | 66.8 | 72.5 | 74.9 | 73.9 | 75.2 |
| Total | 81.7 | 79.9 | 80.7 | 80.3 | 80.6 | 81.1 | 79.5 | 80.3 | 80.4 | 80.5 |
| Tribe | Test set 1 | Test set 2 | Test set 3 | Test set 4 | Test set 5 | Test set 6 | Test set 7 | Test set 8 | Test set 9 | Average |
| Cardueae | 87.5 | 70.0 | 77.8 | 62.5 | 73.3 | 50.0 | 42.9 | 71.4 | 57.1 | 65.8 |
| Lactuceae | 0 | 50.0 | 50.0 | 50.0 | 0 | 66.7 | 50.0 | 25.0 | 25.0 | 35.2 |
| Vernonieae | 63.6 | 58.8 | 56.3 | 42.3 | 80.0 | 61.5 | 56.5 | 50.0 | 52.4 | 57.9 |
| Inuleae | 33.3 | 40.0 | 33.3 | 28.6 | 62.5 | 44.4 | 45.5 | 44.4 | 37.5 | 41.1 |
| Anthemideae | 68.8 | 77.8 | 81.4 | 84.4 | 87.2 | 65.5 | 76.7 | 66.7 | 73.3 | 75.8 |
| Senecioeae | 80.0 | 25.0 | 50.0 | 50.0 | 66.7 | 77.8 | 75.0 | 66.7 | 40.0 | 59.0 |
| Helenieae | 54.8 | 54.2 | 65.0 | 44.4 | 61.9 | 47.6 | 52.2 | 44.0 | 64.3 | 54.3 |
| Heliantheae | 59.1 | 63.6 | 71.0 | 61.6 | 50.0 | 60.3 | 61.5 | 48.0 | 71.4 | 60.7 |
| Eupatorieae | 44.4 | 35.3 | 60.0 | 70.0 | 35.7 | 29.4 | 63.2 | 36.4 | 23.8 | 44.2 |
| Total | 59.6 | 59.6 | 67.4 | 60.6 | 64.8 | 56.5 | 60.1 | 51.8 | 56.0 | 59.6 |
3. Experimental
3.1. Acquisition and Registering of Structures of Sesquiterpene Lactones and Their Respective Botanical Occurrences
3.2. Acquisition of Three-Dimensional Structures of Sesquiterpene Lactones and Exportation of Botanical Data
3.3. Molecular Modelling
3.4. Molecular Descriptors
3.5. Calculation of Multiple Linear Regression
3.6. Self-Organising Maps
4. Conclusions
Acknowledgements
References and Notes
- Seaman, F.C. Sesquiterpene lactones as taxonomic characters in the Asteraceae. Bot. Rev. 1982, 48, 123–551. [Google Scholar]
- Zdero, C.; Bohlmann, F. Systematics and evolution within the Compositae, seen with the eyes of a chemist. Plant. Syst. Evol. 1990, 171, 1–14. [Google Scholar]
- Harborne, J.B.; Mabry, T.J.; Mabry, H. The Flavonoids; Champman & Hall: London, UK, 1975. [Google Scholar]
- Bohm, B.A.; Stuessy, T.F. Flavonoids of the Sunflower Family; Springer-Wien: New York, NY, USA, 2001. [Google Scholar]
- Proksch, P.; Rodriguez, E. Chromenes and benzofuranes of the Asteraceae, their chemistry and biological significance. Phytochemistry 1983, 22, 2335–2348. [Google Scholar]
- Murrray, R.D.H. The Natural Coumarins. Occurrence,Chemistry and Biochemistry; John Wiley & Sons: New York, NY, USA, 1982. [Google Scholar]
- Seaman, F.; Bohlmann, F.; Zdero, C.; Mabry, T.J. Diterpenes of Flowering Plants—Compositae (Asteraceae); Springer-Verlag: New York, NY, USA, 1990. [Google Scholar]
- Macari, P.A.T.; Gastmans, J.P.; Rodriguez, G.V.; Emerenciano, V.P. An expert system for structure elucidation of triterpenes. Spectrosc-Int. J. 1994, 12, 139–166. [Google Scholar]
- Heywood, V.H.; Harborne, J.B.; Turner, B.L. The Biology and Chemistry of the Compositae I and II; Academic Press: New York, NY, USA, 1977. [Google Scholar]
- Bremer, K.; Jansen, R.K.; Karis, P.O.; Kallersjo, M.; Keeley, S.C.; Kim, K.J.; Michaels, H.J.; Palmer, J.D.; Wallace, R.S. A review of the phylogeny and classification of Asteraceae. Nord. J. Bot. 1992, 12, 141–148. [Google Scholar]
- Hind, D.J.N.; Beentje, H.J. Compositae: Systematics. Proceedings of the International Compositae Conference I and II; Royal Botanic Gardens: Kew, Australia, 1994.
- Cassini, H. Tableau exprimant les affinities des tribus naturelles de famile des Synanthérées. In Dictionnaire des Sciences Naturelles III; Cuvier, G., Ed.; Le Normant: Paris, France, 1816. [Google Scholar]
- Bentham, G. Notes on the classification, history, and geographical distribution of the Compositae. J. Linn. Soc. Bot. 1873, 13, 335–557. [Google Scholar] [CrossRef]
- Hoffman, O. Compositae. In Die Natiirlichen Pflanzenfamilien; Engler, A., Prantl, K., Eds.; Engelmann: Leipzig, Germany, 1890. [Google Scholar]
- Carlquist, S. Tribal interrelationships and phylogeny of the Asteraceae. Aliso 1976, 8, 465–492. [Google Scholar]
- Wagenitz, G. Systematics and phylogeny of the Compositae (Asteraceae). Plant. Syst. Evol. 1976, 125, 29–46. [Google Scholar]
- Bremer, K. Tribal interrelationships of the Asteraceae. Cladistics 1987, 3, 210–253. [Google Scholar]
- Bremer, K. Major clades and grades of the Asteraceae. In Compositae: Systematics; Royal Botanic Garden: Kew, Australia, 1996. [Google Scholar]
- Funk, V.; Bayer, R.J.; Keeley, S.; Chan, R.; Watson, L.; Gemeinholzer, B.; Schilling, E.; Panero, J.L.; Baldwin, B.G.; Garcia-Jacas, N.; Susanna, A.; Jansen, R.K. Everywhere but Antarctica: Using a supertree to understand the diversity and distribution of the Compositae. Biol. Skr. 2005, 55, 343–374. [Google Scholar]
- Geissman, T.A.; Crout, D.H.G. Organic Chemistry of Secondary Plant Metabolism; Freeman Cooper & Company: San Francisco, CA, USA, 1969. [Google Scholar]
- Harborne, J.B. Ecological Biochemistry; Academic Press: London, UK, 1988. [Google Scholar]
- Emerenciano, V.P.; Ferreira, M.J.P.; Branco, M.D.; Dubois, J.E. The applications of Bayes theorem in natural products as a guide for skeletons identifications. Chemometr. Intell. Lab. 1998, 40, 83–92. [Google Scholar]
- Emerenciano, V.P.; Rodrigues, G.V.; Alvarenga, S.A.V.; Macari, P.A.T.; Kaplan, M.A.C. A new methods for grouping chemotaxonomic parameters. Quím. Nova. 1998, 21, 125–129. [Google Scholar]
- Calabria, L.M.; Emerenciano, V.P.; Ferreira, M.J.P.; Scotti, M.T.; Mabry, T.J. A phylogenetic analysis of tribes of the Asteraceae based on phytochemical data. Nat. Prod. Commun. 2007, 2, 277–285. [Google Scholar]
- Emerenciano, V.P.; Cabrol-Bass, D.; Ferreira, M.J.P.; Alvarenga, S.A.; Brant, A.J.C.; Scotti, M.T.; Barbosa, K.O. Chemical evolution in the Asteraceae. The Oxidation-Reduction mechanism and production of secondary metabolites. Nat. Prod. Commun. 2006, 1, 495–507. [Google Scholar]
- Talete, S.R.L. DRAGON for Windows (Software for Molecular Descriptor Calculations).Version 6.0, 2011. Available online: http://www.talete.mi.it (accessed on 30 May 2011).
- Zupan, J.; Gasteiger, J. Neural Networks in Chemistry and Drug Design, 2nd ed; Wiley-VCH: Weinheim, Germany, 1999. [Google Scholar]
- Kohonen, T. Self-Organizing Maps, 1st ed; Springer: Berlin, Germany, 2001. [Google Scholar]
- Da Costa, F.B.; Terfloth, L.; Gasteiger, J. Sesquiterpene lactone-based classification of three Asteraceae tribes: A study based on self-organizing neural networks applied to chemo systematics. Phytochemistry 2005, 66, 345–353. [Google Scholar]
- Hristozov, D.; Da Costa, F.B.; Gasteiger, J. Sesquiterpene lactones-based classification of the family Asteraceae using neural networks and k-nearest neighbors. J. Chem. Inf. Model. 2007, 47, 9–19. [Google Scholar]
- Todeschini, R.; Consonni, V. Molecular Descriptors for Chemoinformatics; Wiley-VCH: Weinheim, Germany, 2009. [Google Scholar]
- Lindenmeyer, M.T.; Hrenn, A.; Kern, C.; Castro, V.; Murillo, R.; Muller, S.; Schulte-Mönting, J.; Siedle, B.; Merfort, I. Sesquiterpene lactones as inhibitors of IL-8 expression in HeLa cells. Bioorgan. Med. Chem. 2006, 14, 2487–2497. [Google Scholar]
- Wagner, S.; Hofmann, A.; Siedle, B.; Terfloth, L.; Merfort, I.; Gasteiger, J. Development of a structural model for NF-kappa B inhibition of sesquiterpene lactones using self-organizing neural networks. J. Med. Chem. 2006, 49, 2241–2252. [Google Scholar]
- Scotti, L.; Scotti, M.T.; Ishiki, H.M.; Ferreira, M.J.P.; Emerenciano, V.P.; Menezes, C.M.D.; Ferreira, E.I. Quantitative elucidation of the structure-bitterness relationship of cynaropicrin and grosheimin derivatives. Food Chem. 2007, 105, 77–83. [Google Scholar]
- Scotti, M.T.; Fernandes, M.B.; Ferreira, M.J.P.; Emerenciano, V.P. Quantitative structure-activity relationship of sesquiterpene lactones with cytotoxic activity. Bioorg. Med. Chem. 2007, 15, 2927–2934. [Google Scholar] [CrossRef]
- Fernandes, M.B.; Scotti, M.T.; Ferreira, M.J.P.; Emerenciano, V.P. Use of self-organizing maps and molecular descriptors to predict the cytotoxic activity of sesquiterpene lactones. Eur. J. Med. Chem. 2008, 43, 2197–2205. [Google Scholar]
- Schmidt, T.J.; Nour, A.M.M.; Khalid, S.A.; Kaiser, M.; Brun, R. Quantitative Structure - Antiprotozoal Activity Relationships of Sesquiterpene Lactones. Molecules 2009, 14, 2062–2076. [Google Scholar]
- Paukku, Y.; Rasulev, B.; Syrov, V.; Khushbaktova, Z.; Leszczynski, J. Structure-Hepatoprotective Activity Relationship Study of Sesquiterpene Lactones: A QSAR Analysis. Int. J. Quantum. Chem. 2009, 109, 17–27. [Google Scholar]
- Fernandes, M.B.; Rossini, M.; Stefani, R.; Tavares, L.; Emerenciano, V.D.; Scotti, L.; Scotti, M.T. Volsurf Descriptors to Analyse Anti-HCV and Cytotoxic Activities of Sesquiterpene Lactones from Asteraceae Family. Lett. Drug Des Discov. 2011, 8, 44–58. [Google Scholar]
- Larsson, J.; Gottfries, J.; Bohlin, L.; Backlund, A. Expanding the ChemGPS Chemical Space with Natural Products. J. Nat. Prod. 2005, 68, 985–991. [Google Scholar]
- Gastmans, J.P.; Furlan, M.; Lopes, M.N.; Borges, J.H.G.; Emerenciano, V.P. A inteligência artificial aplicada à química de produtos naturais. O programa Sistemat. Parte I - Bases Teóricas. Quím. Nova 1990, 13, 10–15. [Google Scholar]
- Gasteiger, J.; Sadowski, J.; Schuur, J.; Selzer, P.; Steinhauer, L.; Steinhauer, V. Chemical information in 3D space. J. Chem. Inf. Comput. Sci. 1996, 36, 1030–1037. [Google Scholar]
- Hyperchem Program Release 8.0 for Windows, Hybercube, Inc.: Gainesville, FL, USA, 2009.
- Dewar, M.J.S.E.; Zoebisch, G.; Healy, E.F.; Stewart, J.J.P. AM1: A new general purpose quantum mechanical molecular model. J. Am. Chem. Soc. 1985, 107, 3902–3909. [Google Scholar]
- Leach, A.R. Molecular Modelling: Principles and Applications; Prentice Hall: London, UK, 2001. [Google Scholar]
- Moran, P.A.P. Notes on Continuous Stochastic Phenomena. Biometrika 1950, 37, 17–23. [Google Scholar]
- Moreau, G.; Broto, P. The auto-correlation of a topological-structure—A new molecular descriptor. New. J. Chem. 1980, 4, 359–360. [Google Scholar]
- Diudea, M.V.; Horvath, D.; Graovac, A. Molecular Topology. 15. 3D Distance Matrices and Related Topological Indexes. J. Chem. Inf. Comput. Sci. 1995, 35, 129–135. [Google Scholar] [CrossRef]
- Balaban, A.T. From chemical topology to 3D geometry. J. Chem. Inf. Comput. Sci. 1997, 37, 645–650. [Google Scholar]
- Todeschini, R.; Gramatica, P. 3D-modelling and prediction by WHIM descriptors. 5. Theory development and chemical meaning of WHIM descriptors. Quant. Struct-act. Rel. 1997, 16, 113–119. [Google Scholar] [CrossRef]
- Todeschini, R.; Gramatica, P. 3D-modelling and prediction by WHIM descriptors. 6. Application of WHIM descriptors in QSAR studies P. Quant. Struct-act. Rel. 1997, 16, 120–125. [Google Scholar] [CrossRef]
- Talete, S.R.L. Mobydigs Academic version - Version 1.1. 2010. Available online: http://www.talete.mi.it (accessed on 30 May 2011).
- Todeschini, R.; Mauri, A.; Pavan, M. MobyDigs: Sofwtare for Regression and Classification Models by Genetic Algorithms. In Nature-Inspired Methods in Chemometrics: Genetic Algorithms and Artificial Neural Networks; Leardi, R., Ed.; Elsevier: Genova, Italy, 2004. [Google Scholar]
- Mathworks Inc. 2004. Available online: http://www.mathworks.com (accessed on 30 May 2011).
- Vesanto, J.; Himberg, J.; Alhoniemi, E.; Parhankangas, J. SOM Toolbox for Matlab 5. 2005. Available online: http://www.cis.hut.fi/projects/somtoolbox (accessed on 30 May 2011).
- Vesanto, J.; Alhoniemi, E.; Himberg, J.; Kiviluoto, K.; Parviainen, J. Self-Organizing Map for Data Mining in MATLAB: the SOM Toolbox. Simulation News Europe 1999, 25, 54. [Google Scholar]
- Sample Availability: Contact the authors.
© 2012 by the authors; licensee MDPI, Basel, Switzerland. This article is an open-access article distributed under the terms and conditions of the Creative Commons Attribution license (http://creativecommons.org/licenses/by/3.0/).
Share and Cite
Scotti, M.T.; Emerenciano, V.; Ferreira, M.J.P.; Scotti, L.; Stefani, R.; Da Silva, M.S.; Junior, F.J.B.M. Self-Organizing Maps of Molecular Descriptors for Sesquiterpene Lactones and Their Application to the Chemotaxonomy of the Asteraceae Family. Molecules 2012, 17, 4684-4702. https://doi.org/10.3390/molecules17044684
Scotti MT, Emerenciano V, Ferreira MJP, Scotti L, Stefani R, Da Silva MS, Junior FJBM. Self-Organizing Maps of Molecular Descriptors for Sesquiterpene Lactones and Their Application to the Chemotaxonomy of the Asteraceae Family. Molecules. 2012; 17(4):4684-4702. https://doi.org/10.3390/molecules17044684
Chicago/Turabian StyleScotti, Marcus T., Vicente Emerenciano, Marcelo J. P. Ferreira, Luciana Scotti, Ricardo Stefani, Marcelo S. Da Silva, and Francisco Jaime B. Mendonça Junior. 2012. "Self-Organizing Maps of Molecular Descriptors for Sesquiterpene Lactones and Their Application to the Chemotaxonomy of the Asteraceae Family" Molecules 17, no. 4: 4684-4702. https://doi.org/10.3390/molecules17044684