Article

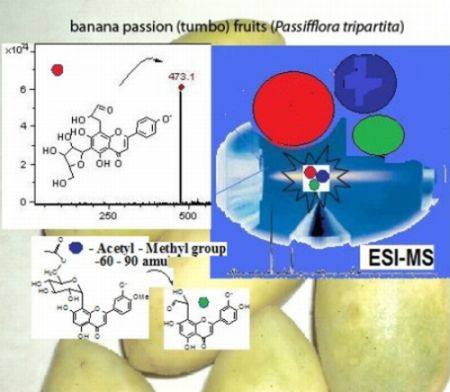
The Passiflora tripartita (Banana Passion) Fruit: A Source of Bioactive Flavonoid C-Glycosides Isolated by HSCCC and Characterized by HPLC–DAD–ESI/MS/MS

by
Mario J. Simirgiotis
1,*,
Guillermo Schmeda-Hirschmann
2,
Jorge Bórquez
1 and
Edward J. Kennelly
3
1
Laboratorio de Productos Naturales, Departamento de Química, Universidad de Antofagasta, Casilla 170, Antofagasta, Chile
2
Laboratorio de Química de Productos Naturales, Instituto de Química de Recursos Naturales, Universidad de Talca, Casilla 747, Talca, Chile
3
Department of Biological Sciences, Lehman College and The Graduate Center, the City University of New York, 250 Bedford Park Boulevard West, Bronx, NY 10468, USA
*
Author to whom correspondence should be addressed.
Molecules 2013, 18(2), 1672-1692; https://doi.org/10.3390/molecules18021672
Submission received: 12 November 2012 / Revised: 6 January 2013 / Accepted: 10 January 2013 / Published: 28 January 2013
(This article belongs to the Section Natural Products Chemistry)

Abstract

:
The banana passion fruit (Passiflora tripartita Breiter, Passifloraceae) known as “tumbo” is very appreciated in tropical and subtropical countries of South America. Methanolic extracts from peel and the fruit juice of P. tripartita growing in Chile were analyzed for antioxidant capacity as well as for flavonoid and phenolic content. A chromatographic method was developed for the rapid identification of the main phenolics in the samples by HPLC-DAD and HPLC-MS. The fast fingerprint analysis allowed the detection of eighteen flavonoid C-glycosides and four flavonoid O-glycoside derivatives which were characterized by UV spectra and ESI-MS-MS analysis. Several of the C-glycosides detected are structurally related to the orientin derivative 4′-methoxy-luteolin-8-C-(6″acetyl)-β-D-glucopyranoside (31), fully elucidated by spectroscopic methods. The antioxidant derivative 31 along with schaftoside, vicenin II, orientin and vitexin were isolated from the fruit extract by high-speed countercurrent chromatography (HSCCC). A suitable method for the preparative isolation of flavonol C-glycosides from “tumbo” extracts by HSCCC is reported. The pulp of the fruits showed good antioxidant capacity (12.89 ± 0.02 μg/mL in the DPPH assay). The peel presented the highest content of flavonoids (56.03 ± 4.34 mg quercetin/100 g dry weight) which is related to the highest antioxidant power (10.41 ± 0.01 μg/mL in the DPPH assay).

Graphical Abstract

1. Introduction

The genus Passiflora from the Passifloraceae plant family comprises around 450 species originated from temperate and tropical South America. The best known edible Passiflora fruits are Passiflora edulis f. edulis and P. edulis f. flavicarpa, the purple and yellow passion fruits. The passion flower genus or passion vine is also known to produce cyanogenic glycosides [1]. The leaves of several Passifloraceae are used worldwide in traditional medicine or in phytotherapy as anti-inflammatory [2] anxiolitic and sedative substances [3]. The biological activity was attributed, at least in part, to their content in C-glycosyl flavonoids [4]. Some worldwide consumed edible fruits such as lemon [5] and lime (Citrus aurantifolia) did not contain detectable amounts of C-glycosides [6] but they occur in medicinal plants used for similar indications than Passiflora, including hawthorn (Crataegus monogyna Jacq. (Lindt.) [7,8] and lemongrass (Cymbopogon citratus) [9].
The banana passion fruit, known in northern Chile as “tumbo” (Passiflora tripartita var. mollissima (Kunth) Holm-Niels. & P. Jørg., Passifloraceae), is a species native from the Andes. It grows from Venezuela to Bolivia at 1,800–3,600 m above the sea level in tropical high forests and has been naturalized in Chile, Mexico, New Zealand, Australia and the United States of America. The aromatic fruits, consumed from prehispanic times, are very appreciated for the pleasant taste and acidic fruit juice.
Previous studies on the fruits revealed the presence of the cyanogenic glycoside prunasin (0.7 mg/Kg) [10], eugenyl β-D-glucoside [11], volatile hydrocarbons including mono and sesquiterpenes, ketones, aldehydes and esters in the fruits [12] which were identified by HRGC and HRGC-MS. Recently, the ascorbic acid content of this fruit was reported, and the fruit was considered a rich source of vitamin C (40 mg per 100 g of edible fruit) [13]. The aerial parts ethanolic extract showed hypoglycaemic activity [14] and antibacterial effect [15]. The pulp of a fruit sample collected in Perú showed higher antioxidant capacity in the DPPH assay (41.18 μmol/g Trolox equivalents (TE) fresh weight) than the noni fruit (Morinda citrifolia, 3.48 μmol/g TE fresh weight) [16]. The fruits of P. tripartita still have a limited production in Chile, being cultivated mainly in the northern part of the country due to climate constraints. The investigation of the bioactive phenolics composition and antioxidant capacity of tumbo fruits will provide potential consumers better information on the nutraceuticals of this South American species and encourage production.
High-speed countercurrent chromatography (HSCCC) is an all-liquid chromatographic technique which does not use a solid support as the stationary phase, allowing the injected sample to be recovered completely, with no oxidation or loss of bioactive compounds due to adsorption in a solid stationary phase. In the present work and following previous studies on this technique [17,18] we report the isolation of five mayor compounds, the antioxidant activity and the qualitative-quantitative phenolic profile of the edible parts and peel of tumbo fruits cultivated in northern Chile. The detection and characterization of eighteen flavonoid C-glycosides and other phenolics from P. tripartita by a combination of NMR, UV and ESI-MS-MS analysis is described. Some of the structures detected are related to a rare orientin derivative isolated from the aerial parts of this plant and previously elucidated by spectroscopic methods (HR 1D and 2D NMR) [19].

2. Results and Discussion

The MeOH extracts of pulp and juice (edible part) as well as peel from P. tripartita var. mollissima (tumbo) were evaluated for antioxidant power by the DPPH scavenging activity and the ferric reducing antioxidant power assay (FRAP). Both peel and edible parts showed high antioxidant power (Table 1). The compounds responsible for the antioxidant activity of the extracts were isolated by centrifugal countercurrent chromatography (HSCCC) and were identified by spectroscopic and spectrometric means. An HPLC DAD-MS analysis of the extracts was undertaken to provide baseline information for further studies on the chemical variability of the species and to serve as a fingerprint (Figure 1) for comparison with other Passiflora species.
Table 1. Antioxidant power as determined by the DPPH bleaching assay, ferric reducing antioxidant power (FRAP), total phenolic content (TPC), total flavonoid content (TFC) and yield of tumbo fruits extracts and isolated compounds.
DPPH aFRAP bTPC cTFC dYield eFruit part
10.41 ± 0.01462.47 ± 0.4956.03 ± 4.34140.17 ± 4.235.24Peel
12.89 ± 0.0285.78 ± 0.1222.57 ± 1.4377.16 ± 8.44.07Pulp and juice
Compound
65.40 ± 0.24393.97 ± 0.31--0.0611
44.86 ± 0.13438.23 ± 0.28--0.0713
24.24 ± 0.11543.72 ± 0.43--0.0416
1.62 ± 0.01637.84 ±0.65--0.1319
3.69 ± 0.04586.48 ± 0.18--0.1431
1.16 ± 0.01729.37 ± 0.48---f Gallic acid
a Expressed as IC50 in µg/mL. b Expressed as mmol Trolox/100 g dry weight. c Expressed as mg gallic acid/100 g dry weight. d Expressed as mg quercetin/100 g dry weight. e Yield expressed as % w/w dry weight. All values are mean ± S.D. (n = 3). f Used as standard antioxidant. All values in the same column are significantly different (p < 0.05).

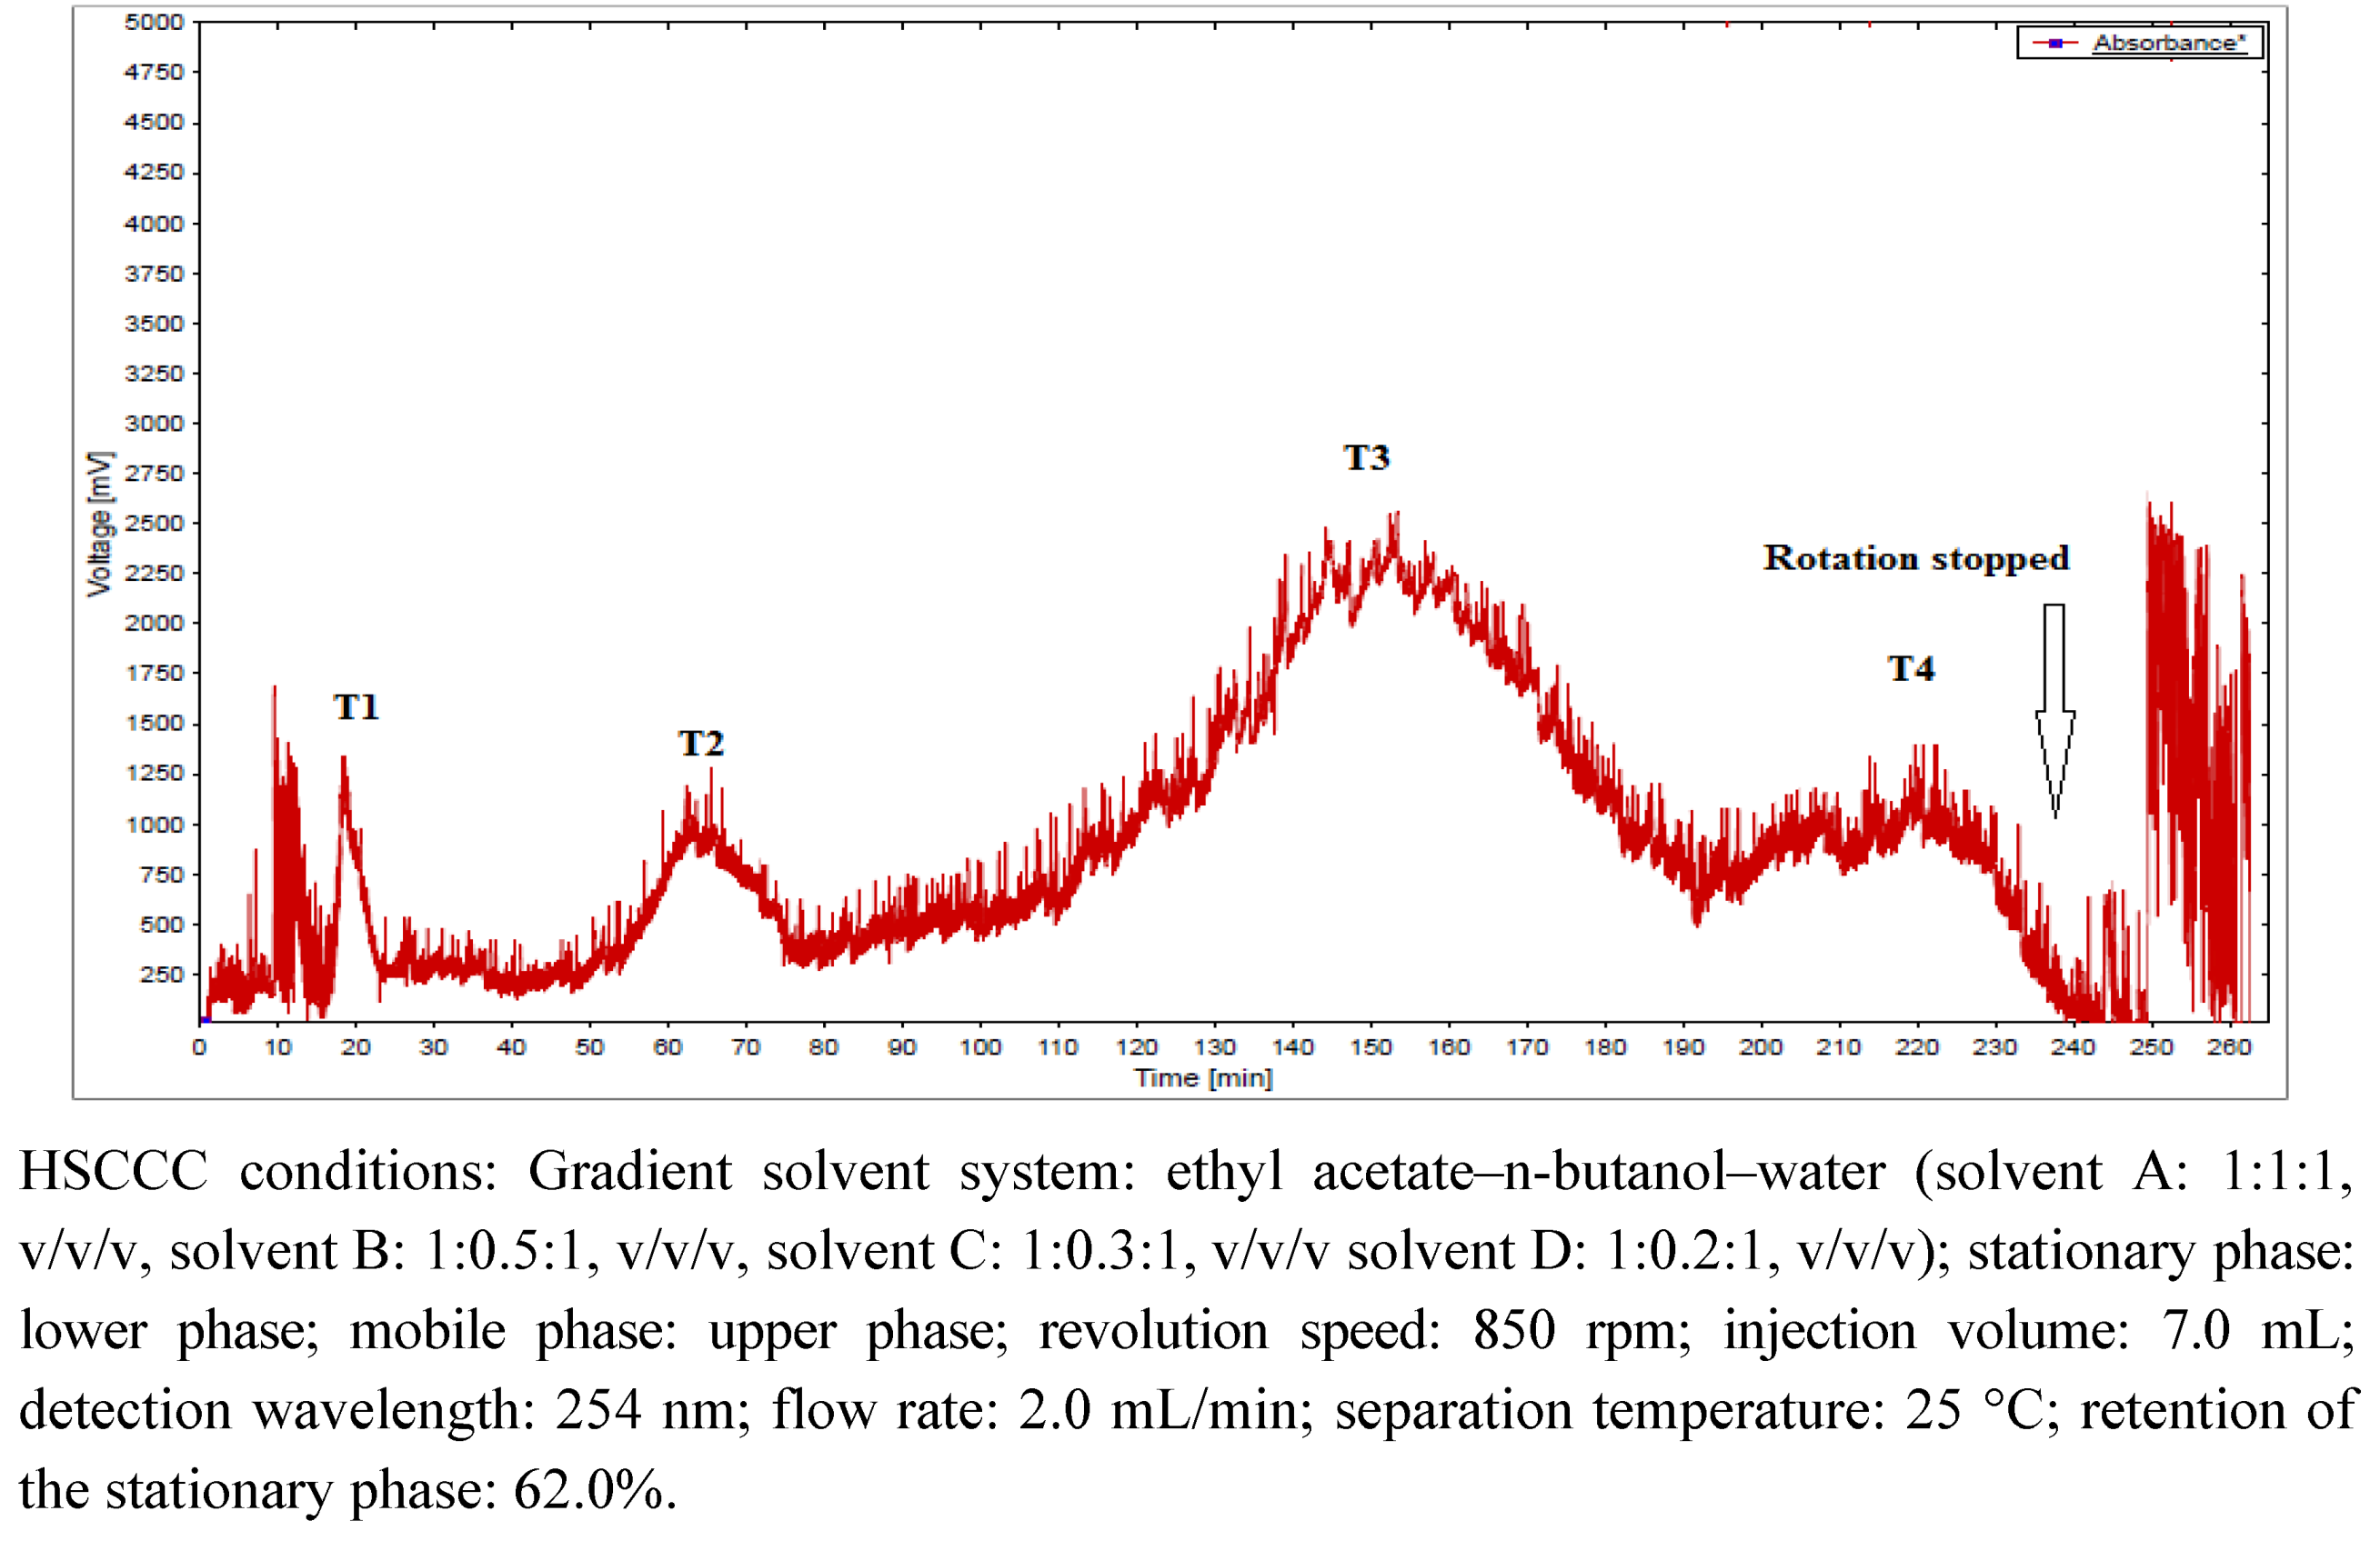
2.1. Isolation of Phenolic Compounds

The HSCCC chromatogram of the tumbo peel extract at 254 nm (Figure 2) shows four peaks (1–4) which were separately collected (see Experimental section) and purified by permeation on Sephadex LH-20 using MeOH as eluent. Five pure flavonoid C-glycosides were isolated (Figure 3) and identified by spectroscopic methods and HPLC–DAD-ESI-MS-MS analysis in comparison with authentic standards.
Figure 1. HPLC DAD chromatograms at 280 nm of Passiflora tripartita (“tumbo”) peel (upper) and juice-pulp (lower).
Molecules 18 01672 g001
Figure 2. HSCCC chromatogram at 254 nm of crude tumbo (Passiflora tripartita) peel extract.
Molecules 18 01672 g002
Figure 3. Proposed structures of luteolin and apigenin derivatives from Passiflora tripartita fruits identified by HPLC-DAD-ESI-MS.
Molecules 18 01672 g003
Compound 11: apigenin (8-C-α-L-arabinosyl) 6-C-β-D-glucopyranoside (schaftoside). The yield was 69.18 mg/kg fresh weight from the peel. Negative ESIMS: m/z 563 [M−H]. The 1H-NMR and 13C-NMR data are consistent with published data [20].
Compound 13: apigenin-6,8-di-C-β-D-glucopyranoside (vicenin II, 14.0 mg, Figure 3). The yield was 80.72 mg/kg fresh weight from the peel. Negative ESIMS: m/z 593 [M−H]. The 1H-NMR (some glucoside signals overlapped) and 13C-NMR data are consistent with published data [21].
The identity of compounds 11 and 13 was confirmed by HPLC spiking experiments with an authentic sample (standard compound).
Compound 16: apigenin-8-C-β-D-glucopyranoside (vitexin, 7.0 mg, Table 1, Figure 3 and Figure 4). The yield was 40.36 mg/kg fresh weight from the peel. Negative ESIMS: m/z 431 [M−H]. The 1H NMR and 13C-NMR data are in agreement with literature [22].
Figure 4. Structures, fragmentation, full ESI-MS and MS-MS spectra of peaks 1, 9, and 16.
Molecules 18 01672 g004
Compound 19: luteolin-8-C-β-D-glucopyranoside (orientin, 24.0 mg, Figure 3). The yield was 138.32 mg/kg fresh weight from the peel. Negative ESIMS: m/z 447 [M−H]. The 1H-NMR and 13C-NMR data agree with published data [23].
Compound 31: 4′-methoxyluteolin-8-C-(6′′acetyl)-β-D-glucopyranoside (acetylmethylorientin, 27.0 mg, Figure 3 and Figure 5). The yield was 155.67 mg/kg fresh weight from the peel. Negative ESIMS: m/z 503 [M−H]. The NMR data of this orientin derivative (1H, Figures S1–S4 and 13C) agree with literature [19,23].
Figure 5. Structures, fragmentation, Full ESI-MS and MS-MS spectra of peaks 31, 21 and 24.
Molecules 18 01672 g005

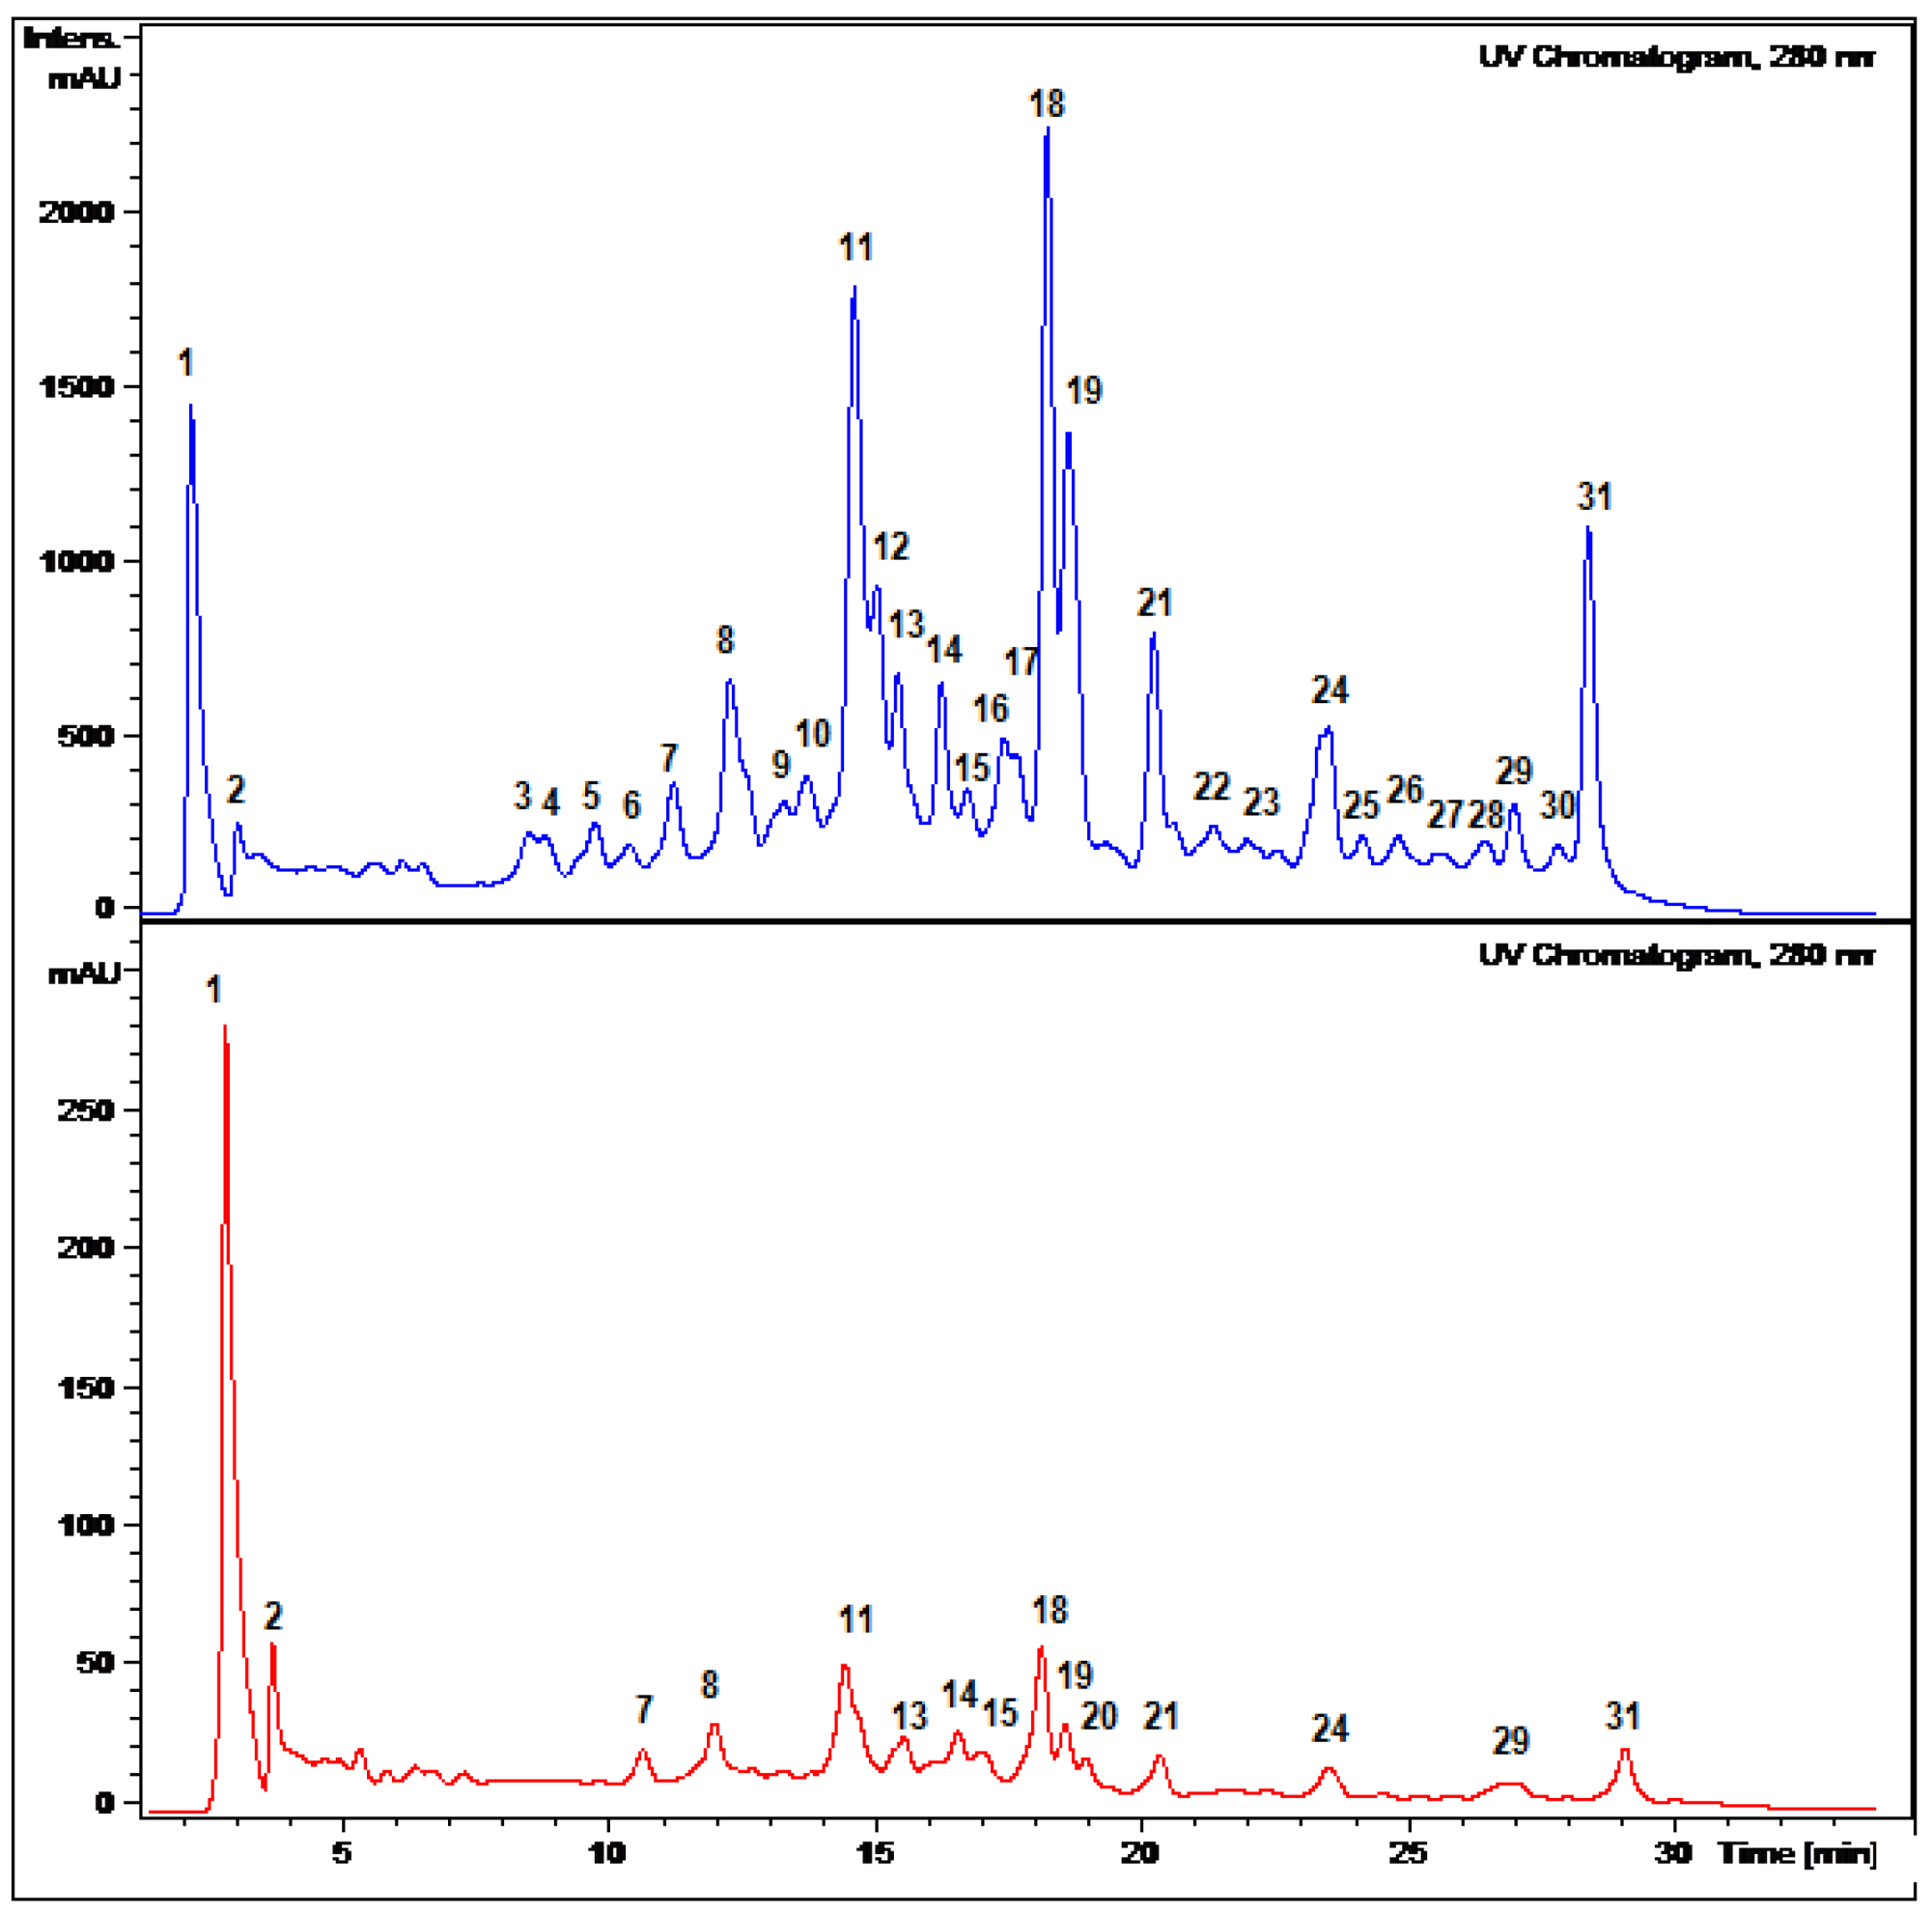
2.2. HPLC-DAD and ESI Identification of Phenolic Compounds in Tumbo Fruits

The phenolic compounds occurring in P. tripartita fruits were investigated by high-performance liquid chromatography coupled with UV diode array detector (HPLC-DAD) and electrospray ionization with mass spectrometry detection (HPLC-ESI/MS). The extracts from fruit peel and pulp were dissolved in MeOH:water 7:3 (1 mg/mL) and 10 μL were injected into the HPLC system to obtain HPLC-DAD chromatograms (Figure 1). Several different gradients were employed but better separation between peaks 1113 and 1819 (Figure 1) could not be achieved under our experimental conditions. For mass spectrometry analysis and identification, all compounds were detected in both ESI positive and negative modes. However, the acidic nature (phenols) of the constituents besides higher percentage of ionization made easier the analysis in negative mode. In addition, the mobile phase employed had to be acidic in order to avoid the broadening of peaks due to the presence of both the neutral and deprotonated forms of the phenolic groups and also improve the retention of those compounds in the reverse phase C-18 column.
In mass spectrometry, C-glycosyl flavones experiment cross-ring cleavages of sugar residues yielding main signals (ions produced by losses of 60, 90 and 120 U) [9,24] that allowed differentiation with O-glycosyl flavones (losses of 162 U for hexose, 146 U for rhamnose and 132 U for pentose moieties, respectively) [25]. In this work we report glycosyl flavones with both characteristic signals, due to the presence of both C- and O- glycosydic linkages as previously reported to occur in some edible plants producing C-glycosyl flavonoids [9]. For the C-glycosides (Figure 3) ESI-MS data was in agreement with the proposed fragmentation [26]. The analysis showed that compounds 10, 18, 21 and 24 were structurally related to compound 31, previously isolated from leaves of P. tripartita and unambiguously elucidated by NMR spectroscopy [19]. The compounds 3 and 8 were structurally related to the diglycoside leucenin-II (compound 5, MSn in agreement on comparison with a pure standard compound). The compounds 1, 9, 14 and 20 relate to standards of vicenin-II (compound 13) or vitexin (compound 16).
The fragmentation behaviour of all detected C-glycoside derivatives substituted at positions 6 and 8 were investigated using LC-MSn, and the main fragments are shown in Table 2 and Figure 5, Figure 6, Figure 7. The observed fragment ions at m/z 179, 151 and 121 evidenced that the aglycone of compounds 3, 5, 8, 18 and 24 was luteolin. The aglycone of compounds 10, 21 and 31 was luteolin-4′methyl-eter (diosmetin) and fragments at m/z 179 and 151 evidenced that the aglycone of compounds 1, 9, 13, 16 and 20 was apigenin. This fact was further corroborated by analyzing pure standards of apigenin, luteolin, orientin, isoorientin, vitexin and isovitexin, which produced the corresponding MS fragments. The proposed identity of all phenolic compounds detected as well as LC-DAD, LC–MS and MS/MS data is depicted in Table 2, and their identification is explained below.

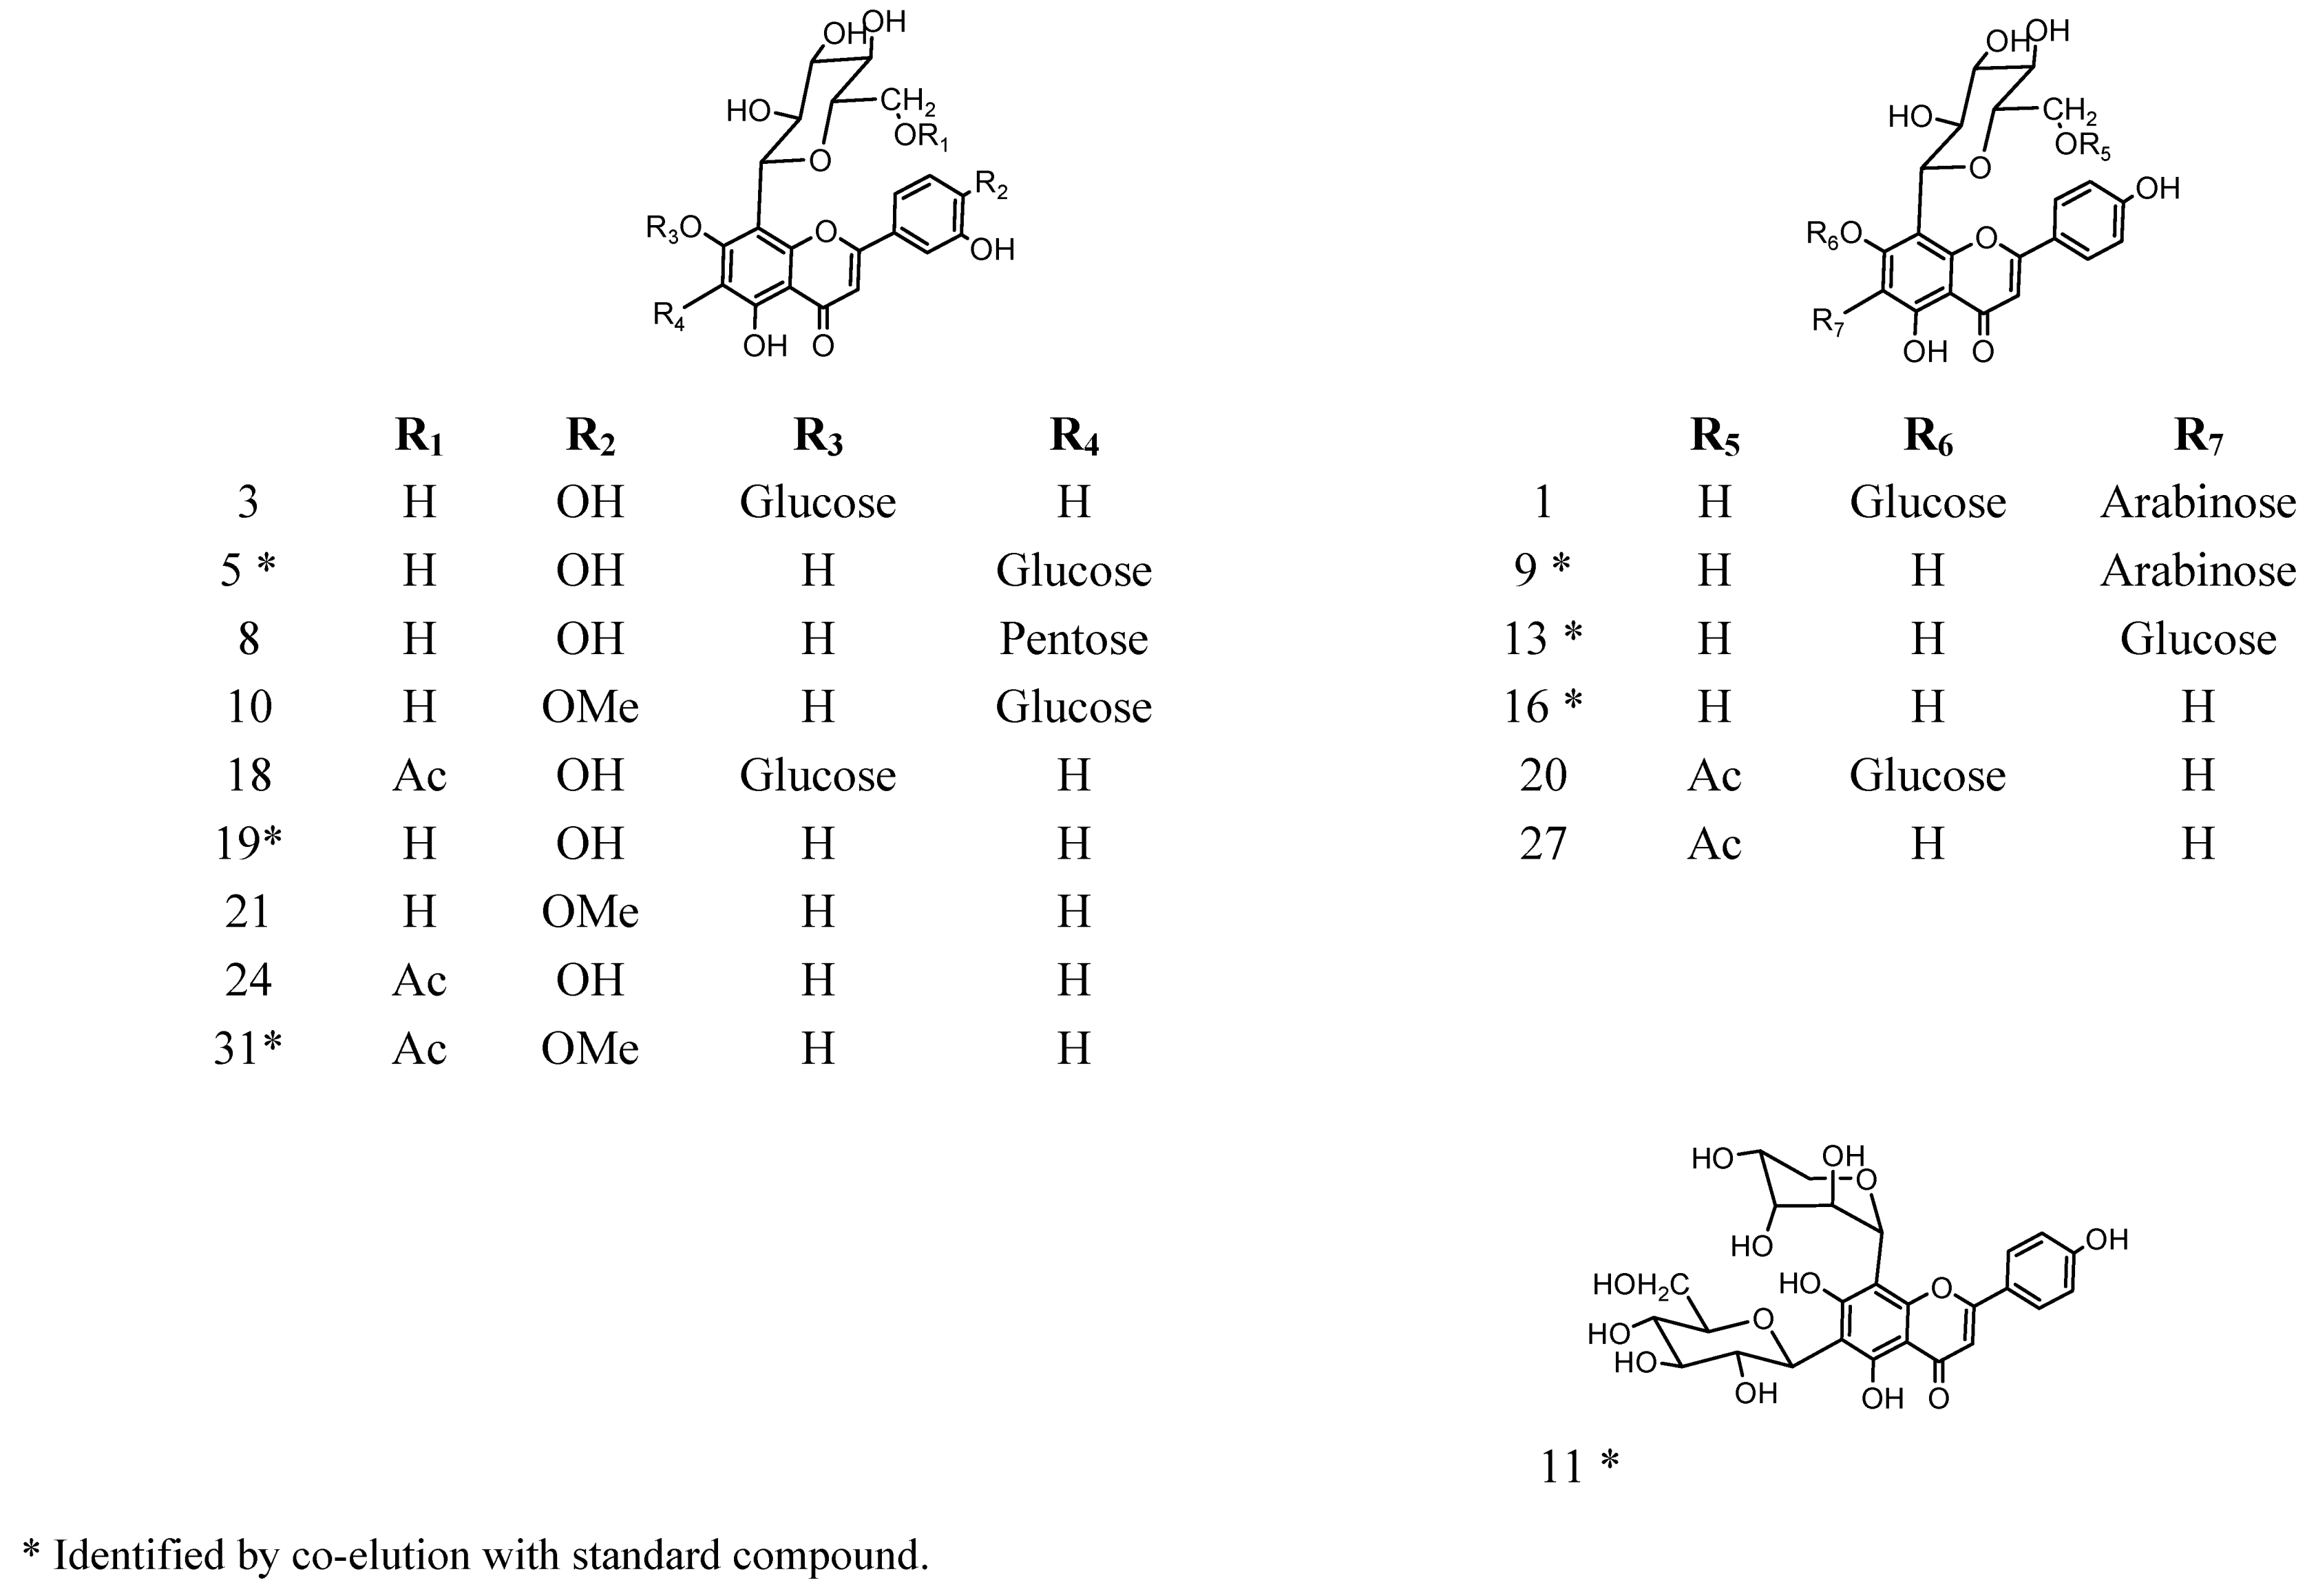
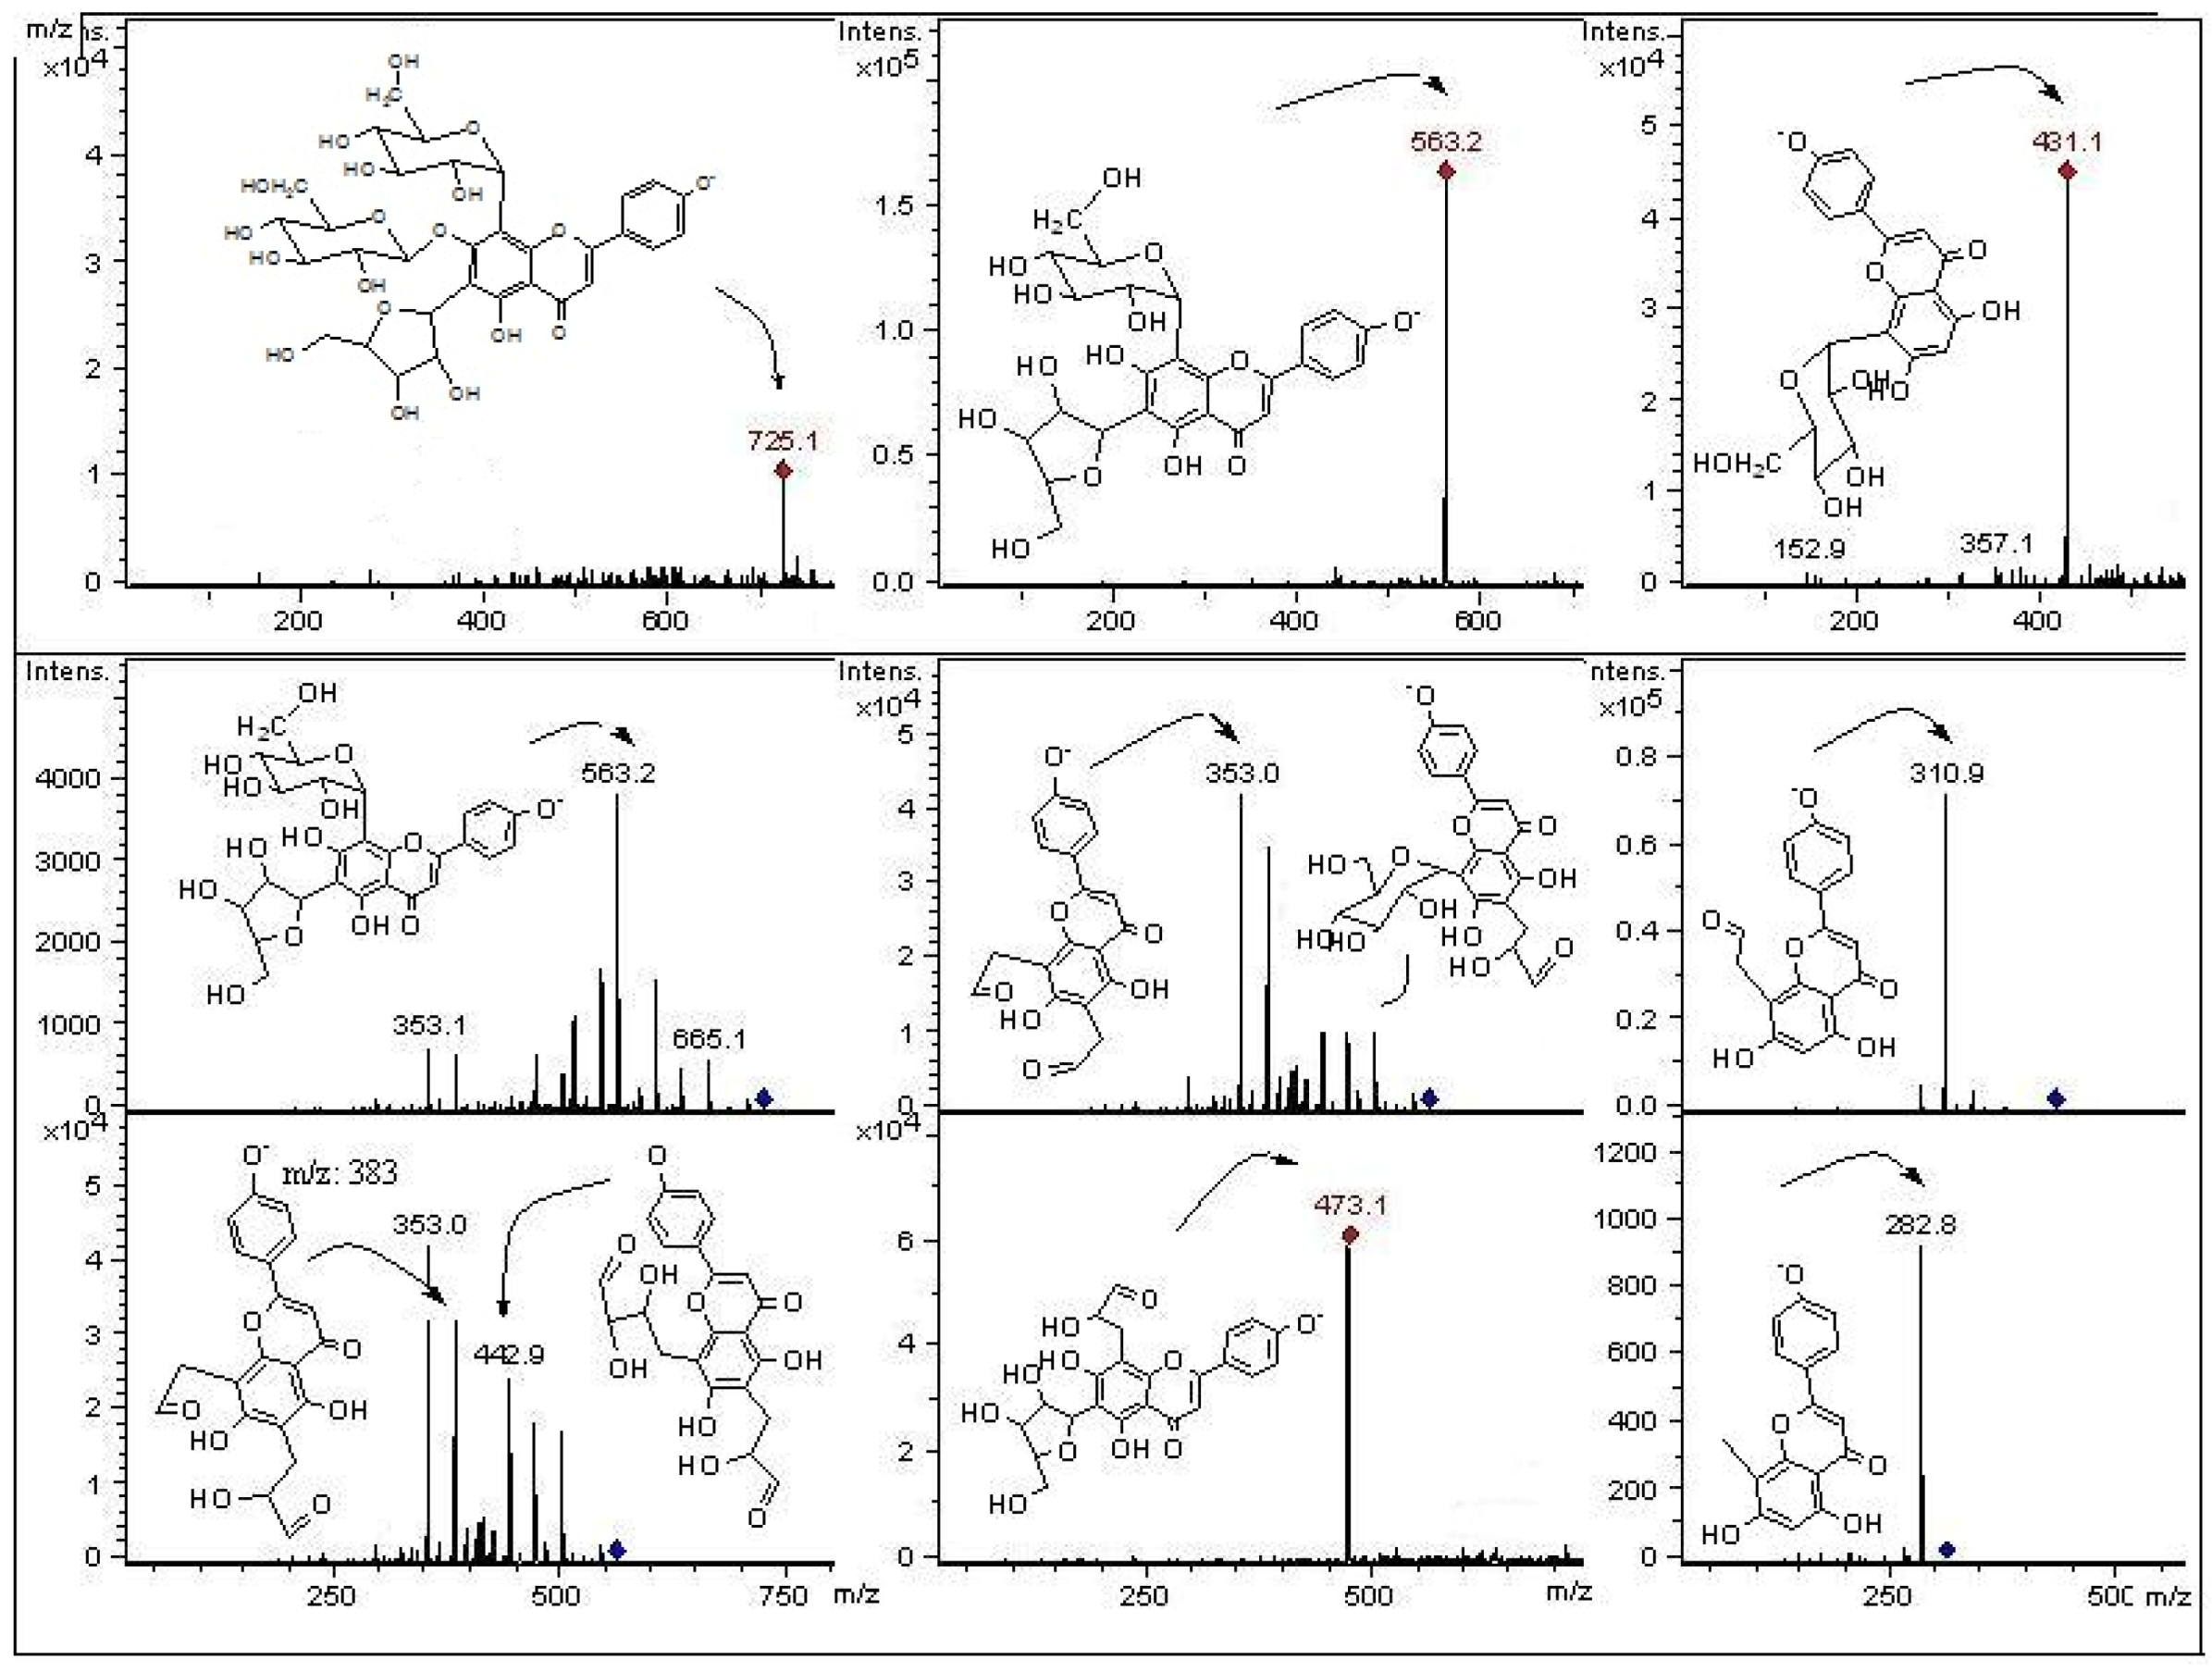
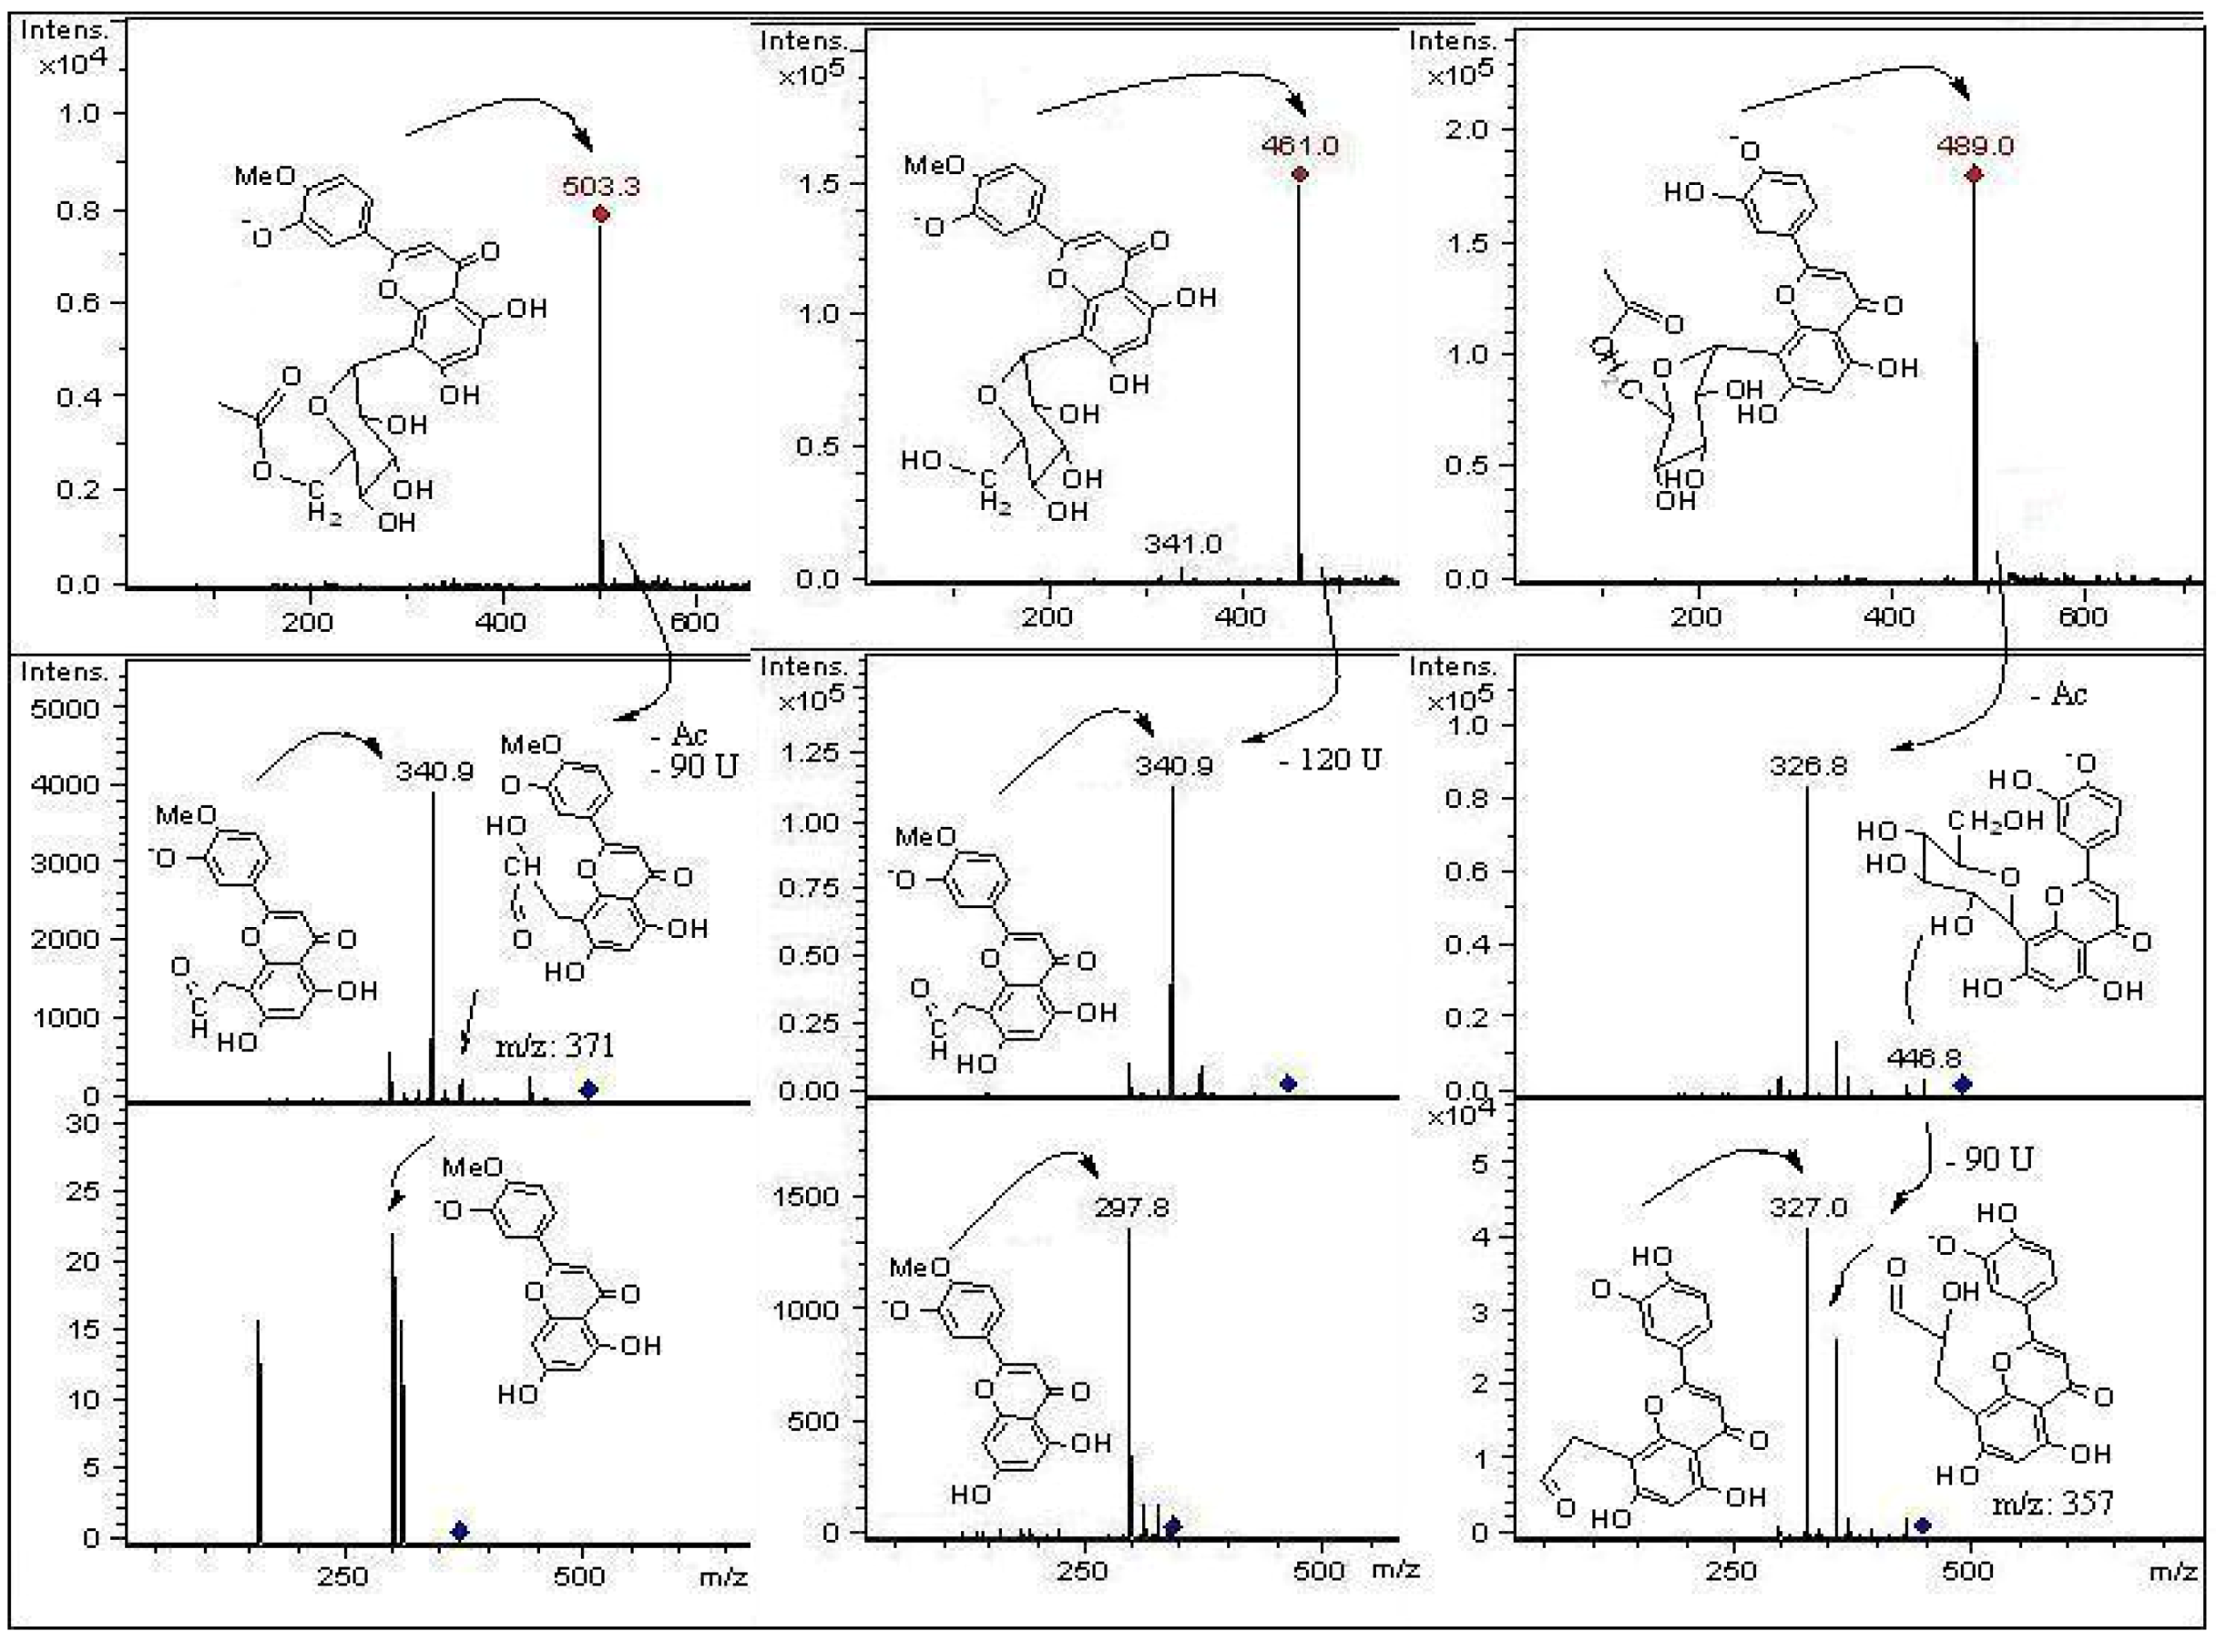
2.2.1. C-Glycosyl Flavones

Peaks 3 and 5 have a full MS spectrum with a [M−H] ion at m/z 609. Peak 5 has a pseudomolecular ion at m/z 609 which produced daughter MS ions at m/z: 591 (M−H−H2O), 489 (M−H−120), MS2 at m/z 399 (489−90), 369 (489−120 or [M−H−2 × 120]), and 327 (369-42). The retention time, UV spectrum and MS fragmentation agree with that of the di-C-hexosyl flavone leucenin-II (luteolin-6,8-di-C-β-D-glucopyranoside, Figure 3 and Figure 6). The identity was confirmed by spiking experiments with standard compound. The MS spectrum of peak 8 showed mainly fragments at m/z: 489, 399, 369, and 327 (Figure 6). The [M−H] ion at m/z 579 in the full MS spectrum of peak 8 pointed out to a pentose instead of an hexose, differing from leucenin-II (peak 5) in one of the C-linked sugars. Thus, peak 8 was assigned as a 6-C-pentose orientin derivative, tentatively as a luteolin-(6-C-pentosyl)-8-C-β-D-glucopyranoside isomer (Figure 3 and Figure 6). Peak 9 was identified as the apigenin di-C-glycoside isoschaftoside (Figure 4) by co-elution with authentic compound. The MS/MS spectrum of peak 10 with a pseudomolecular ion at m/z 623 showed daughter fragments at m/z: 533 ([M−H−90], 503 [M−H−120], 413 [M−H−90−120], and 383 [M−H−2 × 120]), as observed for leucenin II (Figure S5). The fragmentation indicate that compound 10 has the same glycosylation pattern as leucenin II (compound 3) but with an additional methyl group in the genine, tentatively placed at position 4′. This structural feature was also observed in other methoxylated flavone derivatives (compounds 21 and 31), tentatively identified as diosmetin derivatives (Figure 3 and Figure 5). Thus compound 10 was identified as leucenin II 4′ methyl ether (or 4′-methoxyluteolin-6,8-di-C- β-D-glucopyranoside) as reported previously [27]. Peak 11 was the apigenin di-C-glycoside schaftoside with [M−H] ion at m/z 563 U (MS3 ions at 473, 442, 383 and 353), while peak 16 was identified as a glucosyl-apigenin (vitexin, Figure S5) with a molecular anion at m/z 431, yielding fragments at m/z 357, 311 and 283 (Figure 4). In the same manner, peak 13 with a molecular anion at m/z 593 and typical fragments at m/z 503, 473, 413 and 383 was assigned as apigenin-6,8-di-C-β-D-glucopyranoside (vicenin II, Figure 7), identity further confirmed by spiking experiments with standard compound. Peak 14 with similar fragmentation pattern was identified as an isomer of the later compound. Peak 17 was identified as eriodyctiol 6,8 di-C-glucoside as previously reported [27]. The full MS spectrum of the abundant peak 31 (ion at m/z 503, [M−H]) was consistent with the molecular formula C24H23O12 and the UV spectrum could be assigned to that of a chrysoeriol, luteolin or diosmetin derivative. Daughter MS ions at m/z: 371 (M−H−Ac−90), 341 (M−H−Ac−120) and 299 (M−H−Ac-sugar) (Figure 5) were indicative of the loss of acetyl moiety and cleavages of a glucose moiety of the flavone structure reported for the main compound isolated from the leaves of this plant [19]. The presence of the acetoxyl (at C-6′′) and methoxyl groups (at C-4′) and their location were established on the basis of the NMR spectra reported for this diosmetin derivative and further confirmed with literature data for similar compounds [6]. Peak 21 ([M−H] ion at m/z 461) could be assigned as a luteolin glucuronide with a MW of 462. However, it produced similar MS fragments at m/z 341 (M−H−120), 371 (M−H−90) and 299 (M-H-sugar, diosmetin moiety) as peak 31, while peak 24 ([M−H] ion at m/z 489) showed the deacetylated daughter ion at 447 and prominent C-glycoside flavonoid MS3 ions at 357 (447-90) and 327 (447-120). Thus, peaks 21 and 24 were assigned as the de-acetyl and de-methyl derivatives of compound 31: 4′-methoxyluteolin-8-C-β-D-glucopyranoside and luteolin-8-C-(6′′acetyl)-β-D-glucopyranoside, respectively (Figure 5). In the same manner, peak 20([M−H] ion at m/z 635, MSn ions at 473 and 311 U) was identified as apigenin-5-O-β-D-glucopyranosyl-8-C-(6”acetyl)-β-D-glucopyranoside (Figure 7) while peak 27 with main MS signals at 473 and 311 was identified as apigenin-8-C-(6”acetyl)-β-D-glucopyranoside.

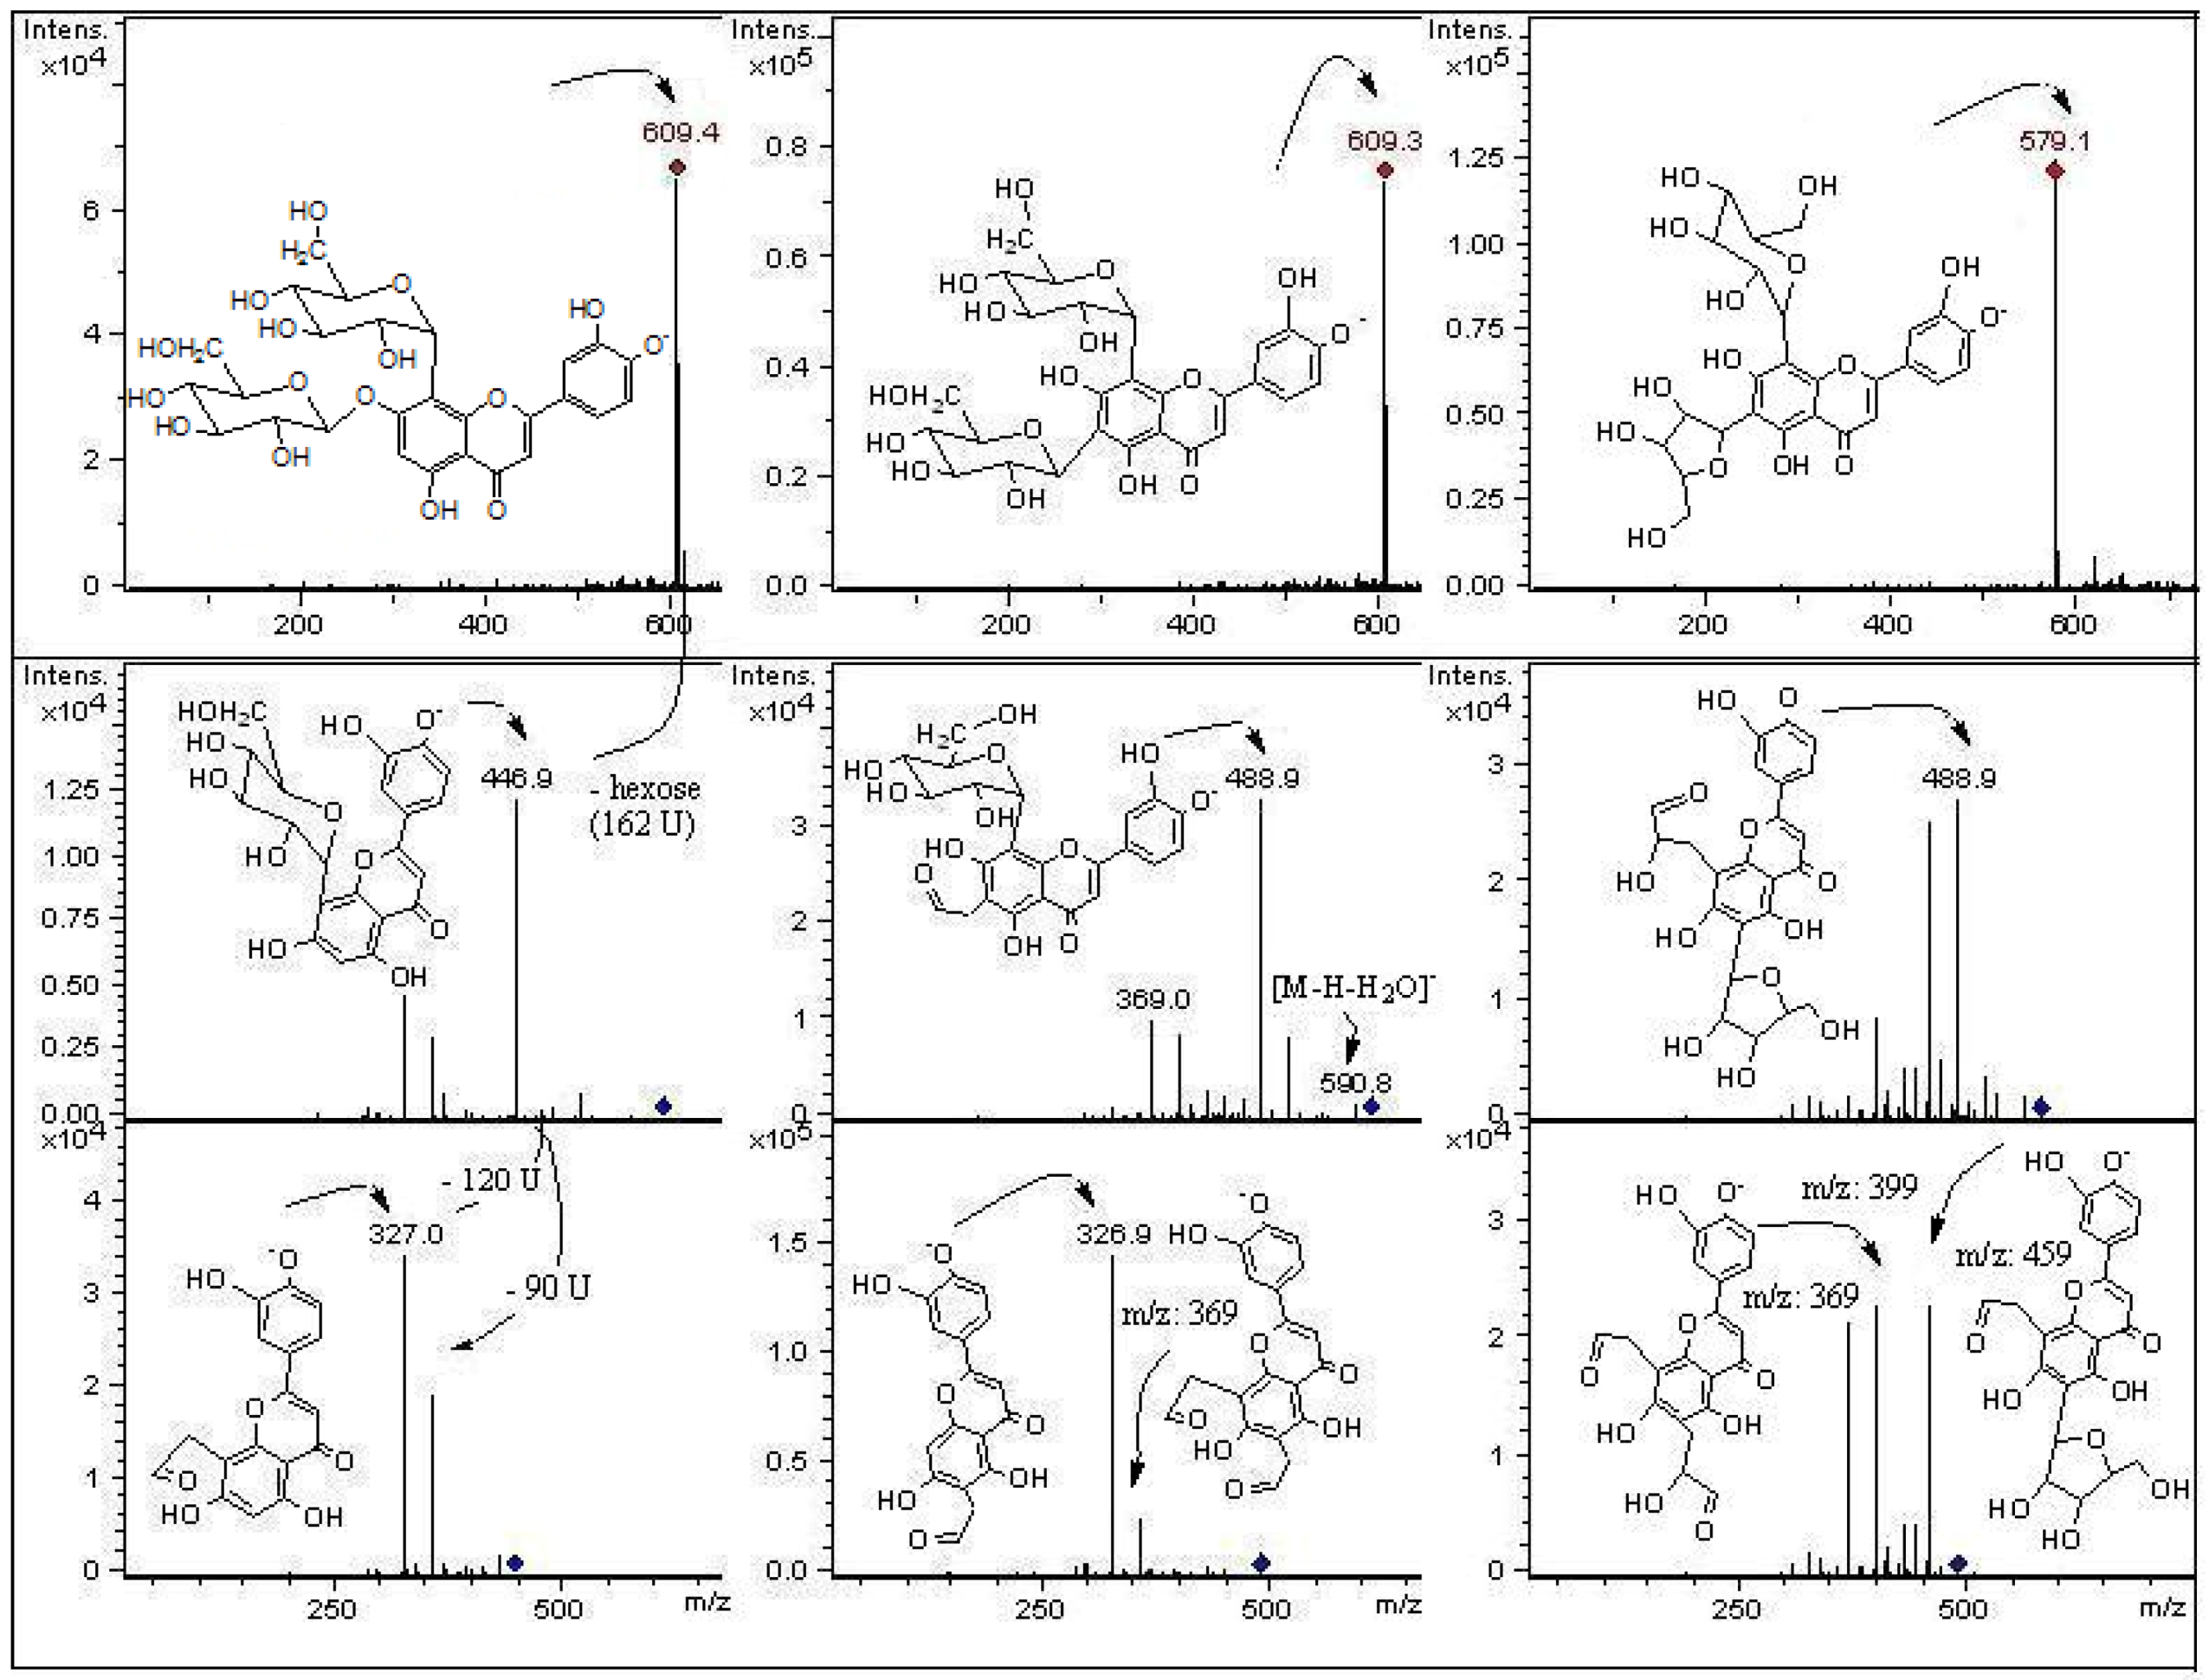
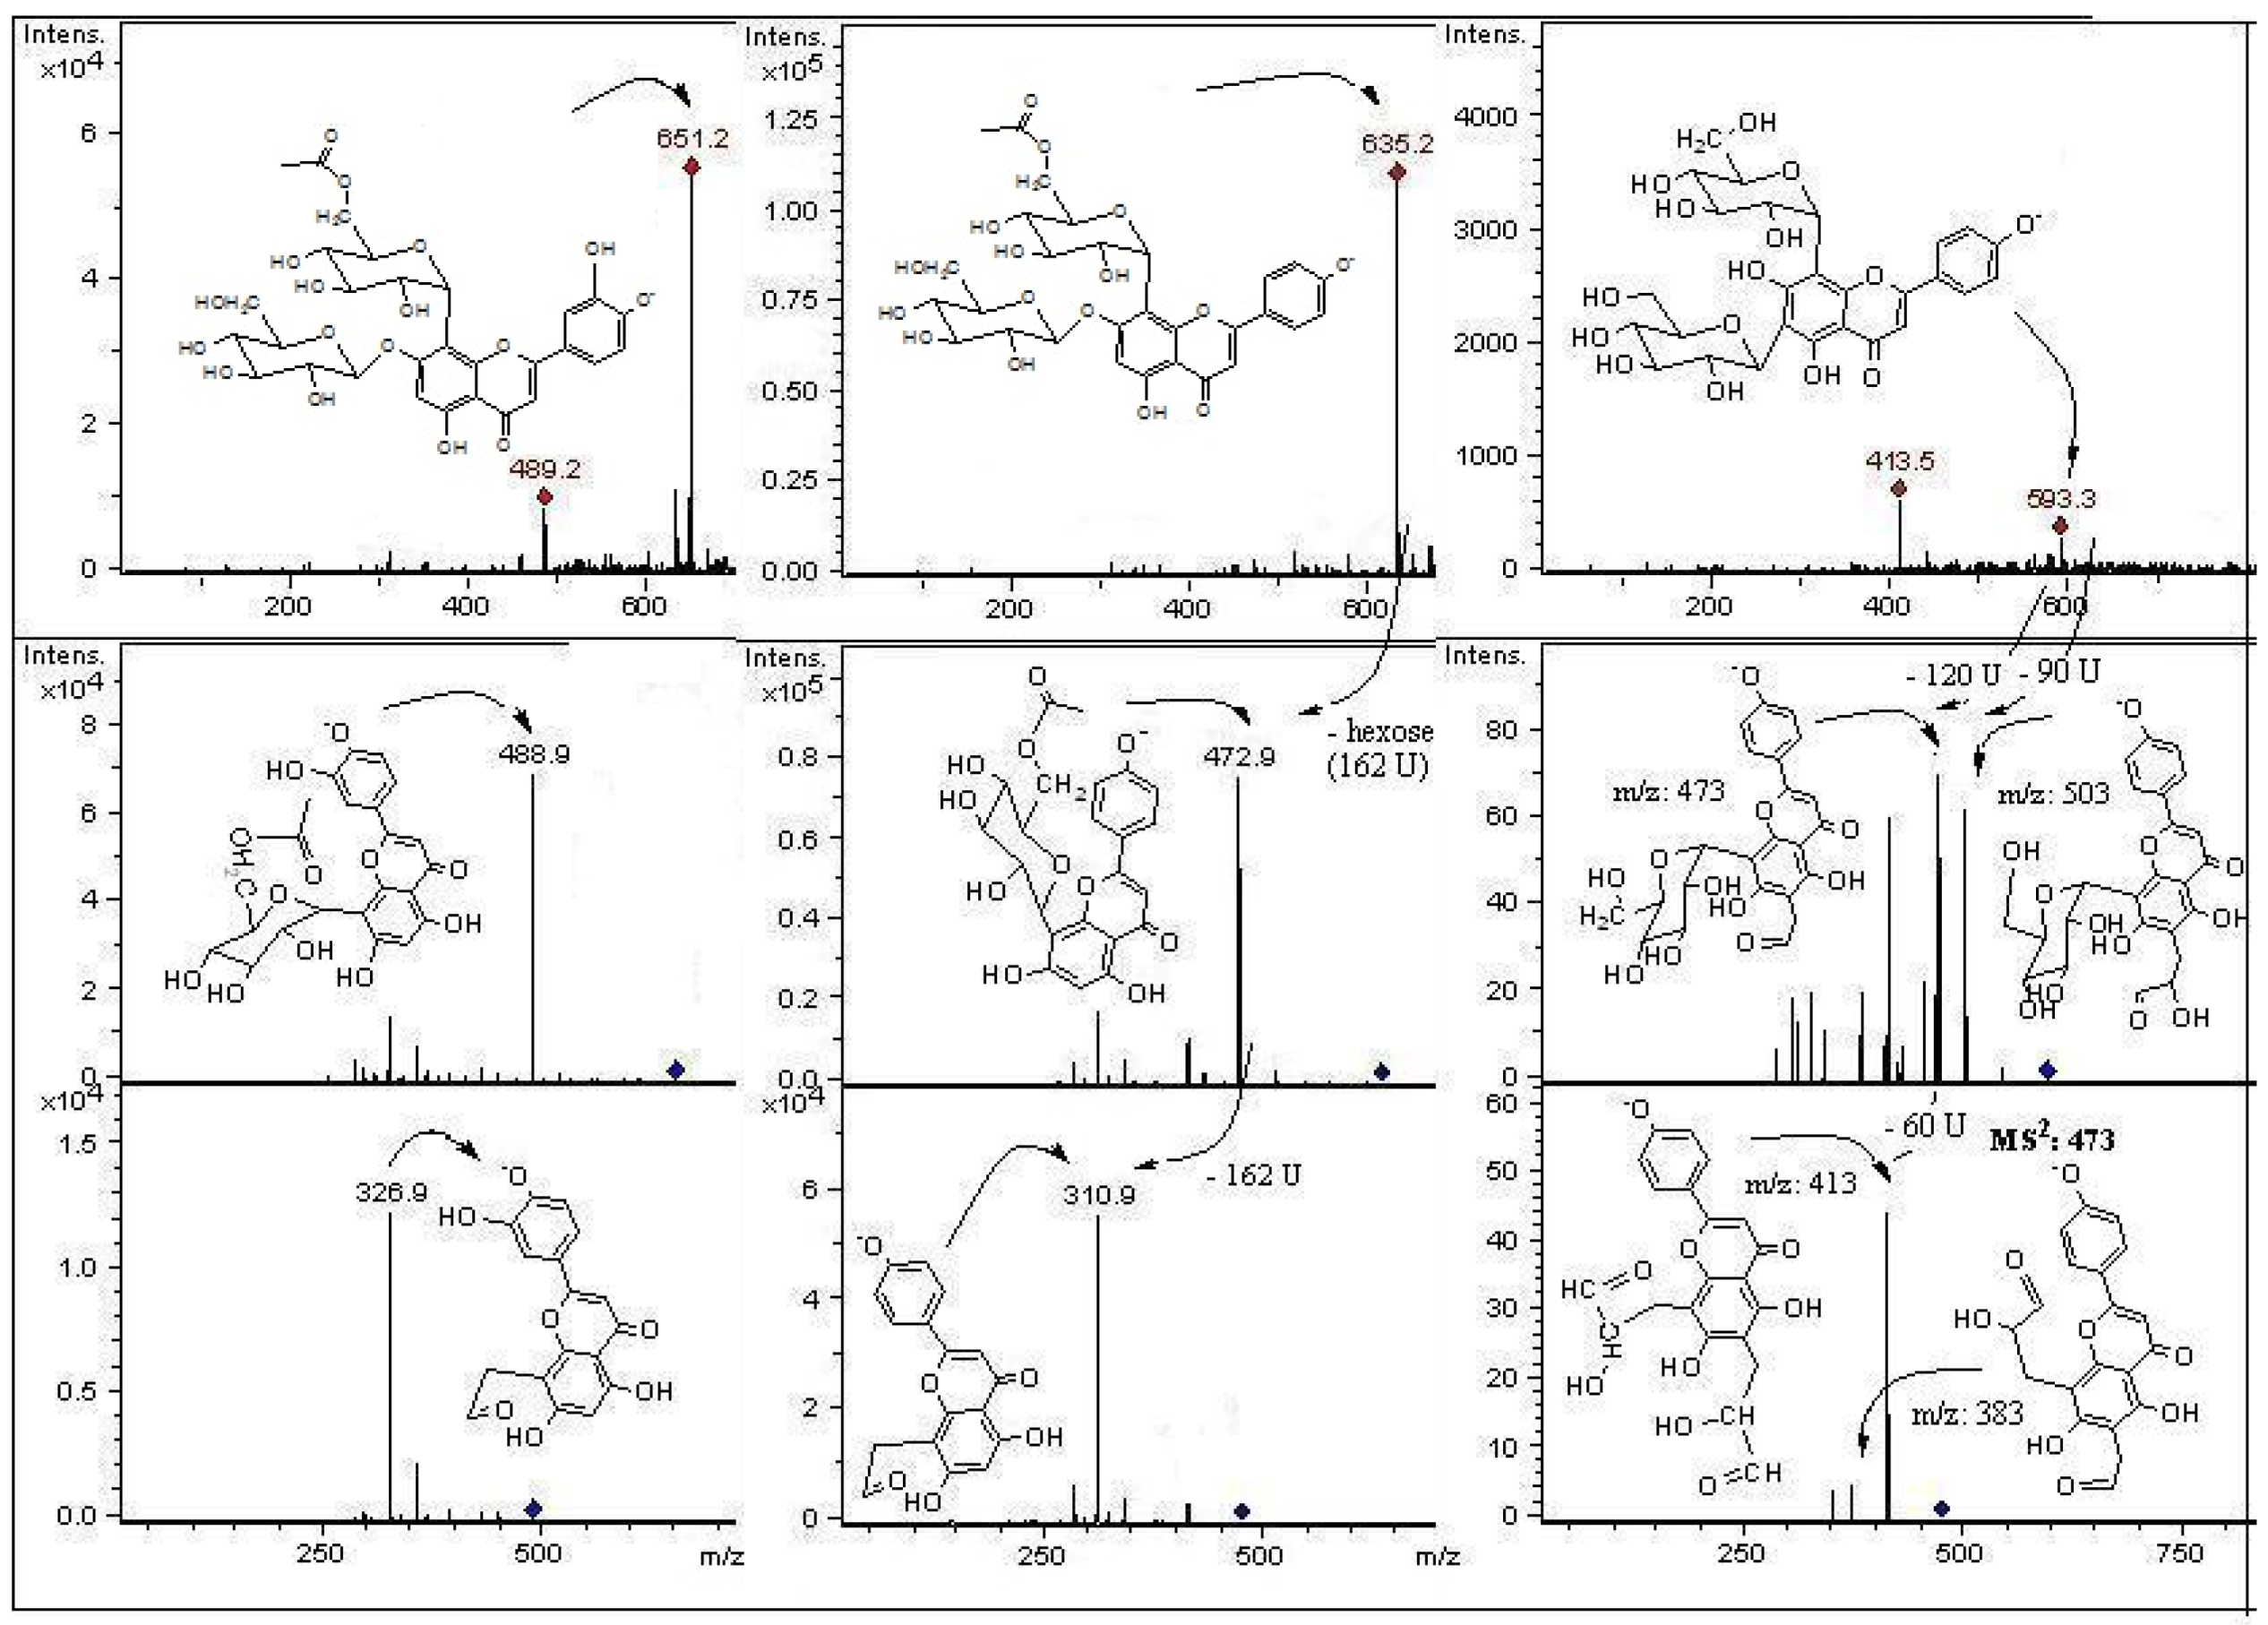
2.2.2. C- and O-Glycosyl Flavones

The MS/MS fragmentation analysis of peak 1 eluting at Rt = 2.2 min showed a [M−H] ion at m/z 725, while peaks 18 ([M−H] ion at m/z 651) and peak 19 ([M−H] ion at m/z 447, Figure S5) presented MSn fragments indicating loss of 162 U (dehydrated hexose moiety) as reported for O-glycosyl flavonoids [28]. Peak 1 with three sugar moieties showed the loss of a dehydrated hexose (162 U) leading to a di-C-glucoside assigned as apigenin (6-C-α-L-arabinopyranosyl)-8-C-β-D-glucopyranoside (isoschaftoside, this compound peak 9, was assigned by a spiking experiment with authentic standard). The MS2 at m/z 563 and main MS3 ions at m/z 443, 383 and 353) support the assignation of compound 1 as the isoschaftoside derivative (6-C-α-L-arabinopiranosyl)-7-O-glucosyl-8-C-β-D-glucopyranoside (Figure 4). Peak 3 with a molecular anion at m/z 609 showed a MS2 ion at m/z 447 (orientin moiety) after the loss of a dehydrated hexose (M−H−162), tentatively attached at position 7 of the orientin structure. The loss of the hexose as a dehydrated sugar residue (162 U) rather than an entire sugar molecule (180 U for hexose) for this compound suggested that this additional sugar moiety could be linked at one of the phenolic OH groups of the flavonoid structure instead to an OH of the primary sugar, as previously reported for flavonols bearing a branched glycosyl group with glucose or galactose as the primary sugar [29,30]. The fragment at m/z 447 showed the characteristic orientin MS3 ions at m/z 357 (M−H−90), and 327 (M−H−120). The compound was tentatively assigned as luteolin-(7-O-glucopyranosil)-8-C-glucopyranoside (orientin-7-O-glucoside, Figure 6). Peak 23 with UV data compatible with a flavonol glycoside, pseudomolecular ion at m/z 631 and MS-MS ions at m/z 479 and 317 was identified as myricetin-3-O-(6” galloyl) galactoside as reported [31]. Peak 25 with a pseudomolecular ion at m/z691 and fragment at m/z 631 (myricetin-3-O-(6” galloyl) galactoside, and 479 (myricetin-3-O galactoside) was identified as a myricetin-3-O-(6” galloyl) glycoside derivative.
Table 2. Identification of phenolic compounds in tumbo fruits by LC-DAD, LC–MS and MS/MS data.
PeakRt(min)λ max (nm)[M−H]Fragment ions (m/z)Compound identificationFruit part
12.1269, 340725665, 563, 443, 383, 353(6-C-α-L-arabinopiranosyl)-7-O-glucosyl-8-C-β-D-glucopyranoside (7-O-glucosyl-isoschaftoside)P, J
22.8288, 322897457, 451, 325, 305Feruloylated oligosaccharideP, J
39.4270, 349609489, 369, 327Luteolin-(7-O-glucopyranosil)-8-C-glucopyranoside (Orientin-7-O-glucosideP
49.6270, 349645447, 357, 327Luteolin-di-glycoside derivativeP
59.9269, 350609447, 357, 327Luteolin-6,8-di-C-β-D-glucopyranoside (Leucenin II) *P
610.2269, 335629593Vicenin II derivativeP
710.7-5333715′-Methoxy-demethylpiperitol-4-O-glucosideP, J
814.0269, 349579489, 459, 399, 369Luteolin-(6-C-pentosyl)-8-C-β-D-glucopyranoside isomer P, J
914.1269, 337563503, 473, 443, 383, 353(6-C-α-L-arabinopiranosyl)-8-C-β-D-glucopyranoside (Isoschaftoside) *P
1014.3271, 346623533, 503, 413, 3834′-Methoxyluteolin -6,8-di-C-β-D-glucopyranoside(Leucenin II, 4′-methyl ether)P
1114.6269, 337563473, 353Apigenin (6-C-β-D-glucopyranosyl) 8-C-α-L-arabinoside (Schaftoside) *P, J
1214.7270, 348687651,489, 327Luteolin-5-O-glucosyl-8-C-(6”acetyl)-β-D-glucopyranoside derivative P
1315.6269, 335593503, 473, 413, 383Apigenin-6,8-di-C-β-D-glucopyranoside (Vicenin II) *P, J
1416.2269, 335593503, 473, 413, 383Vicenin II isomerP, J
1516.8270, 340523361Unknown di- glucosyl flavonoidP, J
1617.5269, 338431357, 311, 283Apigenin-8-C-β-D-glucopyranoside (Vitexin) *P
1718.0-611593, 491, 429, 393, 369, 327Eriodictyol 6,8 di-C-glucosideP
1818.3270, 348 651489, 327Luteolin-7-O -glucopyranosyl 8-C-(6”acetyl)-glucopyranosideP, J
1918.6270, 349 447285Luteolin-8-C-β-D-glucopyranoside (Orientin) *P,J
2017.0269, 338635473, 311Apigenin-5-O-β-D-glucopyranosyl, 8-C-(6”acetyl)-β-D-glucopyrano- sideP, J
2120.2270, 347461285, 2164′-Methoxyluteolin-8-C-β-D-glucopyranosideP, J
2220.4257, 361317300, 179, 151Myricetin *P
2321.3257, 361631479, 317Myricetin-3-O- (6”-galloyl) glycosideP
2424.5270, 350489447, 327Luteolin-8-C-(6”acetyl)-β-D-glucopyranosideP, J
2524.7257, 361691631, 479, 335, 317, 273Myricetin-3-O-(6” galloyl) glycoside derivativeP
2625.1257, 361331315, 300, 179, 151Myricetin 3′ methyl etherP
2725.7269, 338473413, 311Apigenin-8-C-(6”acetyl)-β-D-glucopyranosideP
2827.6270, 335713677, 533, 451, 337Unknown C-glycosyl derivativeP
2928.4270, 335723677, 533, 451, 337Unknown C-glycosyl derivativeP, J
3028.7272, 330857501, 337Unknown C-glycosyl derivativeP
3129.1269, 346503371, 341, 2994′- Methoxyluteolin-8-C-(6”acetyl)-β-D-glucopyranoside *P, J
Fruit part: P: peel, J: pulp and juice. * Identified by spiking experiments with a standard compound.
Figure 6. Structures, fragmentation, full ESI-MS and MS-MS spectra of peaks 3, 5 and 8.
Molecules 18 01672 g006
Figure 7. Structures, fragmentation, full ESI-MS and MS-MS spectra of peaks 18, 20, and 13.
Molecules 18 01672 g007

2.2.3. Other Phenolic Compounds

Peak 2 with a pseudomolecular ion at 897 U and UV maxima at 322 nm, compatible with ferulic acid, produced in the ion trap MS daughter ions at m/z: 457, 451, 325, 305 and was assigned as a feruloyl-oligosaccharide composed by four arabinose residues associated with two ferulic acid moieties, as reported from sugar beet (Beta vulgaris) [32]. Peak 7 with a pseudomolecular ion at m/z 533 which yielded a main MS2 ion at m/z 371 was tentatively identified as 5′-methoxy- demethylpiperitol-4-O-glucoside as reported [33].

2.2.4. Unidentified Compounds

Peaks 4, 12, 15, 28, 29 and 30 remain unidentified. Peak 4 showed a similar UV spectra to peak 3max 270, 349). The mass spectrum of peak 4 with a [M−H] ion at m/z 645 yielded MS ions at m/z 609, 447, 357 and 327 and was tentatively characterized as a luteolin-di-glycoside derivative with an unidentified additional sugar moiety. Peak 12 with a [M−H] ion at m/z 687 produced ions at m/z 651, 489, 327 which matches the MS data found for peak 18 (luteolin-7-O-glucopyranosyl, 8-C-(6′′acetyl)-glucopyranoside, full MS at m/z 651) after the loss of 38 amu and thus was tentatively assigned as an unknown derivative of compound 18. Peak 15 with a ion at m/z 561 which produced an MS2 ion at m/z 361 was also reported to occur in Ginkgo biloba extract [34] and was assigned to an unidentified glycosyl flavonoid derivative (λmax 270, 340). Peaks 28, 29 and 30 showed pseudomolecular ions of m/z 713, 723 and 857 U respectively. A flavanone derivative with pseudomolecular ion at m/z 723 was identified in bergamot juice as naringin di-oxalate [35]. However, compound 29 ([M−H] ion at m/z 723) as well as 28 and 30 showed UV spectra compatible with a bi- C-glycosyl-flavone (Table 1). We were not able to match a flavonoid structure for the full mass and fragmentation patterns (MSn at 677, 533, 451 and 337) observed for compounds 28 and 29 as well as for 501 and 337 found for compound 30.

2.3. Total Phenolic, Total Flavonoid Content and Antioxidant Power of Tumbo Fruits

The peel of tumbo fruits cultivated in the Oasis de Pica, Chile, showed total phenolic content of 56.03 ± 4.34 mg per 100 g dry material (Table 1). This value is 2.5 times higher than the content in pulp and juice (22.57 ± 1.43 mg/ 100 g dry material). However, the value was lower to that reported for a sample from Perú (2.16 mg GAE/100 g fresh weight) [16]. The total flavonoid content of the peel was 1.81 times higher than that of the pulp and juice (140.17 ± 4.2 versus 77.16 ± 8.4 mg per 100 g dry weight, respectively). The antioxidant power measured as the DPPH scavenging capacity and the ferric reducing antioxidant power (FRAP) was higher in the peel with values of 10.41 µg/mL and 462.47 mmol/100 g dry weight than in the pulp (12.89 µg/mL and 85.78 mmol/100 g dry weight, respectively) (Table 2). The values correlates well with the total phenolic, total flavonoid as well as with the number and intensity of phenolics detected in the extracts (Figure 3, Table 1). When comparing with fruits from other South American countries, the FRAP capacity of the pulp and peel were lower than that reported for a tumbo sample from Colombia (114 ± 3.28 and 42.2 ± 2.29 µmol TE/g fresh weight, respectively) [36]. The known C-glycosyl flavonoids isolated shower high antioxidant power (Table 2) as previously reported [37] while the acetylmethyl orientin derivative 31 showed two times less DPPH bleaching capacity than its related compound orientin (19), probably due to the substitution of an OH group by a OCH3 function.

3. Experimental

3.1. General

HPLC grade methanol, ethyl acetate and 1-butanol were purchased either from Merck (Darmstadt, Germany) or from J.T. Baker (Phillipsburg, NJ, USA). Aluminum-coated silica gel thin layer chromatography (TLC, Kieselgel F254) plates and formic acid from Merck. Sephadex LH-20 was obtained from Pharmacia Fine Chemicals (Piscataway, NJ, USA). Amberlite XAD-7HP 20-60 mesh resin, quercetin, 1,1-diphenyl-2-picrylhydrazyl (DPPH.), and gallic acid were purchased from Sigma Chemical Co. (St. Louis, MO, USA). Deuterated MeOH, HPLC water, HCl, KCl, Folin–Ciocalteu phenol reagent, sodium acetate, aluminum chloride hexahydrate and sodium carbonate were from Merck. Vicenin II, leucenin II, vitexin, orientin, isovitexin, homoorientin, schaftoside, myricetin and isoschaftoside for HPLC analysis all with purity higher than 95% (with HPLC certificate) were purchased either from ChromaDex (Santa Ana, CA, USA) or Extrasynthèse (Genay, France).
LC-DAD analyses were carried out using a Merck-Hitachi equipment with a quaternary L-7100 pump, a L-7455 UV diode array detector, and a D-7000 chromato-integrator (LaChrom, Tokyo, Japan). A 250 × 4.6 mm i.d., 5 μm, Purospher star-C18 column (Merck) set at 25 °C was used for the separation of all phenolics. Detection was carried out at 280 and 365 nm, with peak scanning between 200 and 600 nm. Gradient elution was performed with water/1% formic acid (solvent A) and acetonitrile/1% formic acid (solvent B) at a constant flow rate of 1.0 mL/min. An increasing linear gradient (v/v) of solvent B was used [t (min), % A]: 0, 90; 4, 90; 25, 75; 40, 90. For LC-ESI-MS analysis an Esquire 4000 Ion Trap mass spectrometer (Bruker Daltoniks, Bremen, Germany) was connected to an Agilent 1100 HPLC (Agilent Technologies, Waldbronn, Germany) instrument via ESI interface. A Bruker Daltoniks 3.2 data analysis software was used for acquisition and processing. Full scan mass spectra were measured between m/z 150 and 2000 U in negative ion (preferred) mode. Nitrogen was used as nebulizer gas at 27.5 psi, 350 °C and at a flow rate of 8 L/min. The mass spectrometric conditions were: electrospray needle, 4000 V; end plate offset, −500 V; skimmer 1, −56.0 V; skimmer 2, −6.0 V; capillary exit offset, −84.6 V. Collision induced dissociation (CID) spectra were obtained with a fragmentation amplitude of 1.00 V (MS/MS) using ultrahigh pure helium as the collision gas.
Preparative HSCCC was carried out using a Quattro AECS-QuikPrep™ coil planet centrifuge high-speed counter-current chromatograph model MK-7 (AECS- QuikPrep Ltd., Bristol, UK) equipped with four stained steel coils of 2.1 mm I.D. and 25, 210, 115 and 115 mL capacity, respectively. All coils could be used individually, or as any combination of numbers in series or in parallel. We used the 115 mL preparative coil whose β values range from 0.62 at internal to 0.82 at the external .The mobile phase was pumped using two series II HPLC pump (Scientific Systems, Inc., State College, PA, USA). The sample was injected using a 7 mL loop through a rheodine valve, and solvents for the gradient run were switched through a switching valve. An UV detector (ECOM-Flash 06 S single wavelength, Prague, Czech Republic) at 254 nm was used after the HSCCC machine, and chromatograms were visualized using ECOMAC software. The proton and carbon (1H: 400 MHz; 13C: 100.25 MHz) NMR experiments were performed in a Bruker Avance 400 UltraShield spectrometer using CD3OD or deuterated DMSO as solvent. The spectroscopic measurements were performed using a Unico 2800 UV-vis spectrophotometer (Unico Instruments, Co, Ltd., Shangai, China).

3.2. Plant Material

The study was undertaken with ripe banana passion (P. tripartita var. mollissima, local name tumbo) fruits cultivated at the Oasis de Pica (I Region of Chile) in January 2011. The ripe fruits were immediately processed upon arrival to the laboratory. A lyophilized sample is deposited at the Laboratorio de Productos Naturales, Universidad de Antofagasta, under reference number Pt15-01-12.

3.2.1. Extraction of Tumbo Fruits

Fresh ripe fruits (1.98 kg, Figure S6) were carefully washed. The peel, pulp-juice and seeds were manually separated to yield 1,127 g of pulp and juice and 555 g of peel. The pulp/juice and peel were lyophilized yielding 110.44 g (9.80% w/w) and 61.0 g (10.99% w/w) of dry material, respectively. The lyophilized pulp-juice and peel were homogenized in a mortar and extracted three times with MeOH/H2O 7:3 v/v (3 × 1,000 mL and 3 × 500 mL each, respectively) at room temperature in the dark using an ultrasound bath (25 °C, 40 Hz), for 1 h per extraction. Extracts were combined, filtered and concentrated under reduced pressure below 50 °C. Afterwards the extracts were suspended in water, filtered using a Buchner funnel and separately loaded onto an Amberlite XAD7 HP (500 and 300 g, respectively) resin column. This polymeric resin was used for pre-concentration of ionic and small polar compounds. Amberlite XAD7 HP can adsorb all phenolic compounds which can be desorbed with a polar organic solvent. The column was rinsed with 2 L and 1 L respectively of HPLC grade water and compounds were desorbed-eluted with 1 L MeOH for each extract. Both eluates were concentrated under reduced pressure below 45 °C to give 4.5 g (0.22% w/w yield) of a brown extract for the pulp-juice and 3.2 g (0.16% w/w yield) of a yellow-brown extract for the peel.

3.2.2. Isolation and Characterization of Phenolics from the Peel Extract

The peel extract obtained as explained above was subjected to gradient preparative high speed centrifugal countercurrent chromatography (HSCCC). First, a suitable solvent system was chosen by HPLC and TLC according to the partition coefficients (0.5 < K < 2.0) between a series of biphasic solvent systems. The solvent systems were mixtures of n-hexane–ethyl acetate–methanol–water, ethyl acetate–n-butanol–water and ethyl acetate–n-butanol–water-acetic acid using different (v:v:v:v), ratios as follows. About 2.0 mg of tumbo peel extract was added to each test tube, and then 2 mL of each phase of a pre-equilibrated two-phase solvent system was added and thoroughly mixed. Each test tube was shaken with a vortex mixer for one minute and left to stand at room temperature until equilibrium was attained between the two phases. Then, the upper and lower phases were analyzed by TLC and HPLC at 280 nm to obtain K values of all flavonoid target compounds. The partition coefficient (K) is defined as K = AUp/ALo, where AUp and ALo were the HPLC peak areas of glycoside compounds or TLC spot areas from the upper and lower phase, respectively. The solvent system: ethyl acetate–n-butanol–water in a 1:1:1 v/v/v ratio provided the better K values for all mayor compounds (0.9 < K < 1.3). In order to perform gradient preparative HSCCC, four two-phase solvent systems composed of ethyl acetate (EtOAc), n-butanol (BuOH), and water (W) were prepared as follows. Solvent A: EtOAc–BuOH–W 1:1:1 v/v/v ratio, solvent B: EtOAc–BuOH–W 1:0.5:1 v/v/v ratio, solvent C: EtOAc–BuOH–W 1:0.3:1 v/v/v ratio and solvent D: EtOAc–BuOH–W 1:0.2:1 v/v/v ratio, respectively. The solvent systems were prepared, shaken in a funnel, equilibrated overnight, and the two phases separated shortly before use. The first lower aqueous phase (solvent system A) served as the stationary phase and was pumped into the coil until it was filled with no rotation. The first mobile phase (A) was then pumped in a tail to head mode with the planetary rotor at 850 rpm at a flow rate of 2.0 mL/min and 25 °C. When only mobile phase emerged from the column, the percentage retention of the stationary phase was recorded (62%) and then 1.0 g of filtered Tumbo peel extract (dissolved in 3.5 mL of mobile and 3.5 mL of stationary phase) was injected into the coil through an injection loop using a Rheodine valve. The mobile upper phase was switched from A to D using a switching valve every 60 minutes. The effluent from the outlet of the column was continuously monitored with a UV detector at 254 nm (see experimental) and four (T1-T4) fraction pools were collected (Figure 2). After stopping rotation, the stationary phase contained an unresolved complex mixture of polar flavonoids as verified by NMR spectroscopy. The four flavonoid-enriched fractions were concentrated under reduced pressure and then purified by permeation on Sephadex LH-20 columns (10% loading capacity) using HPLC grade MeOH as eluent. The fractions collected from the open column permeation were compared by analytical TLC using BuOH-AcOH-H2O in a 80:25:4 ratio as the mobile phase. The chromatograms were visualized under UV light (254 nm) and then sprayed with 1% vanillin in EtOH (w/v) and heated (60 °C) to see the compound spots. From fractions T1 (35 mg), T2 (42 mg), T3 (135 mg) and T4 (37 mg), the following pure compounds were obtained: 11 (schaftoside, 12 mg), 13 (vicenin II, 14 mg), 16 (vitexin, 7 mg), 19 (orientin, 24 mg), and 31 (4′-methoxy-luteolin-8-C-(6′′acetyl)- β-D-glucopyranoside, 27 mg).

3.3. Polyphenolic Content

A precisely weighed amount of each extract (approximately 1 mg/mL) as explained in Section 3.3 was used for total phenolic (TPC) and total flavonoid (TFC) content. Extracts were dissolved in a MeOH-water 7:3 v/v solution. Appropriate dilutions were prepared and absorbance was measured using a spectrophotometer (see section 3.1). The TPCs were determined by the Folin and Ciocalteu’s reagent method [38]. Briefly, the appropriate extract dilution was oxidized with the Folin-Ciocalteu reagent (2 mL, 10% v/v), and the reaction was neutralized with sodium carbonate. The calibration curve was performed with gallic acid (concentrations ranging from 16.0 to 500.0 μg/mL, R2 = 0.999). The absorbance of the resulting blue color of the complex formed was measured at 740 nm after 30 min., and the results were expressed as mg of gallic acid equivalents per 100 g dry material. The TFCs in the samples were determined as previously reported [39]. The absorbance of the reaction mixture (2.5 mL) was measured at 430 nm and quercetin was used as a reference for the calibration curve (concentrations ranging from 16.0 to 800.0 µg/mL, R2 = 0.994). Results were expressed as mg quercetin equivalents per 100 g dry weight. Data are reported as mean ± SD for at least three replicates.

3.4. Antioxidant Assessment

3.4.1. Bleaching of the 2,2-Diphenyl-1-picrylhydrazyl (DPPH) Radical Assay

Free radical scavenging capacity was evaluated according to the method described previously. Aliquots of samples (100 μL) were assessed by their reactivity with a methanol solution of 100 μM DPPH. The reaction mixtures (2 mL) were kept for 30 min at room temperature in the dark. The decrease in the absorbance (n = 3) was measured at 517 nm, in a Unico 2800 UV-vis spectrophotometer (Unico Instruments, Co, Ltd, Shanghai, China). The percent DPPH scavenging ability was calculated as: DPPH scavenging ability = (Acontrol – A sample/Acontrol) × 100. Afterwards, a curve of % DPPH scavenging capacity versus concentration was plotted and IC50 values were calculated. IC50 denotes the concentration of sample required to scavenge 50% of DPPH free radicals. The lower the IC50 value the more powerful the antioxidant capacity. If IC50 ≤ 50 μg/mL the sample has high antioxidant capacity, if 50 μg/mL < IC50 ≤ 100 μg/mL the sample has moderate antioxidant capacity and if IC50 > 200 μg/mL the sample has no relevant antioxidant capacity. In this assay, the standard antioxidant compound gallic acid showed an IC50 value of 1.16 μg/mL (6.81 μM).

3.4.2. Ferric Reducing Antioxidant Power (FRAP) Assay

The FRAP assay was done according to [40] with some modifications. The stock solutions included 300 mM acetate buffer pH 3.6, 10 mM TPTZ (2,4,6-tripyridyl-s-triazine) solution in 40 mM HCl, and 20 mM FeCl3·6H2O solution. The working solution was prepared by mixing 50 mL acetate buffer, 10 mL TPTZ solution, and 15 mL FeCl3.6 H2O solution and then warmed at 37 °C before using. Tumbo fruit extracts (100 μL) were allowed to react with 2 mL of the fresh FRAP solution for 30 min in the dark. Readings of the coloured product ferrous tripyridyltriazine complex were then taken at 593 nm (n = 3). The standard curve was performed with the standard antioxidant Trolox (R² = 0.9995). Results are expressed in mM TE (Trolox equivalents)/100 g dry mass.

3.5. Statistical Analysis

The statistical analysis was carried out using the originPro 9.0 software packages (Originlab Corporation, Northampton, MA, USA). The determination was repeated at least three times for each sample solution. Analysis of variance was performed using ANOVA. Significant differences between means were determined by student’s t-test (p values < 0.05 were regarded as significant).

4. Conclusions

The juice and pulp of banana passion fruit (P. tripartita), locally known as “tumbo” and cultivated in northern Chile, were investigated for phenolic and flavonoid content, antioxidant capacity and phenolic compounds composition using hyphenated techniques. The fruit peel showed higher antioxidant power and higher content of phenolics than the pulp and juice. Thirty one phenolic compounds were detected in tumbo peel by HPLC-DAD and ESI-MS/MS analysis. From them, eighteen compounds were characterized as C-glycosyl flavonoids and four were O-glycosyl flavonoids. Only fifteen out of the 31 phenolics found in the peel were detected in the juice and pulp, namely compounds 1, 2, 7, 8, 11, 1315, 1821, 24, 29 and 31. Compounds 1, 3, 5, 811, 13, 16, 1821, 27 and 31 were assigned as C-glycosyl flavonoids, while compounds 10, 21, 31 are methoxyluteolin derivatives. Five compounds (11, 13, 16, 19 and 31) were isolated from the fruit peel extract by HSCCC and identified by spectroscopic and spectrometric means. This method proved to be suitable for the preparative isolation of polar constituents of tumbo fruits and can be applied to other mixtures of close related C-glycosyl flavonoids. Compounds 18 (main compound) and 20 are acetyl C-glycosyl flavonoids and are reported for the first time in the genus Passiflora.
The whole fruit, including peel, pulp and juice, presented high antioxidant power, which is related to the high total phenolic and flavonoid content and number of healthy C-glycosides detected and characterized in the samples. The polyphenolic fingerprint described in this report and the occurrence of unusual chemical markers such as compounds 10, 21 and 31 can be used to differentiate Passiflora tripartita var. mollissima from other Passiflora species containing flavonoid C-glycosides. Most of the compounds described in this article are reported for the first time in P. tripartita except peak 31. This study presents the first comprehensive examination of phenolics in banana passion fruits and encourages further studies on the nutraceutical properties of Andean edible fruits as new crops with beneficial effects in the health of consumers worldwide.

Supplementary Materials

Supplementary materials can be accessed at: https://www.mdpi.com/1420-3049/18/2/1672/s1.

Acknowledgments

Financial support by FONDECYT (Grant 1110068) and CODEI (University of Antofagasta, Grant 5383) are gratefully acknowledged.
  • Sample Availability: Samples of the isolated compounds and extracts are available from the authors.

References

  1. Jaroszewski, J.W.; Olafsdottir, E.S.; Wellendorph, P.; Christensen, J.; Franzyk, H.; Somanadhan, B.; Budnik, B.A.; Bolt Jørgensen, L.; Clausen, V. Cyanohydrin glycosides of Passiflora: Distribution pattern, A saturated cyclopentane derivative from P. guatemalensis, And formation of pseudocyanogenic α-hydroxyamides as isolation artefacts. Phytochemistry 2002, 59, 501–511. [Google Scholar]
  2. Vargas, A.J.; Geremias, D.S.; Provensi, G.; Fornari, P.E.; Reginatto, F.H.; Gosmann, G.; Schenkel, E.P.; Fröde, T.S. Passiflora alata and Passiflora edulis spray-dried aqueous extracts inhibit inflammation in mouse model of pleurisy. Fitoterapia 2007, 78, 112–119. [Google Scholar] [CrossRef]
  3. Deng, J.; Zhou, Y.; Bai, M.; Li, H.; Li, L. Anxiolytic and sedative activities of Passiflora edulis f. flavicarpa. J. Ethnopharmacol. 2010, 128, 148–153. [Google Scholar] [CrossRef]
  4. Li, H.; Zhou, P.; Yang, Q.; Shen, Y.; Deng, J.; Li, L.; Zhao, D. Comparative studies on anxiolytic activities and flavonoid compositions of Passiflora edulis ‘edulis’ and Passiflora edulis ‘flavicarpa’. J. Ethnopharmacol. 2011, 133, 1085–1090. [Google Scholar] [CrossRef]
  5. Bocco, A.; Cuvelier, M.E.; Richard, H.; Berset, C. Antioxidant activity and phenolic composition of Citrus peel and seed extracts. J. Agric. Food Chem. 1998, 46, 2123–2129. [Google Scholar] [CrossRef]
  6. Piccinelli, A.L.; Garcia Mesa, M.; Armenteros, D.M.; Alfonso, A.; Arevalo, A.C.; Campone, L.; Rastrelli, L. HPLC-PDA-MS and NMR characterization of C-glycosyl flavones in a hydroalcoholic extract of Citrus aurantifolia leaves with antiplatelet activity. J. Agric. Food Chem. 2008, 56, 1574–1581. [Google Scholar] [CrossRef]
  7. Prinza, S.; Ringla, A.; Huefnerb, A.; Pempa, E.; Kopp, B. 4′′′-Acetylvitexin-2′′-O-rhamnoside, isoorientin, orientin, and 8-methoxykaempferol-3-O-glucoside as markers for the differentiation of Crataegus monogyna and Crataegus pentagyna from Crataegus laevigata (Rosaceae). Chem. Biodivers. 2007, 4, 2920–2931. [Google Scholar] [CrossRef]
  8. Participants in the WHO Consultation on Medicinal Plants Commonly Used in NIS, Folium cum Flore Crataegi. In WHO Monographs on Medicinal Plants Commonly Used in the Newly Independent States; WHO Library Cataloguing-in-Publication Data: Paris, France, 2010; pp. 91–111.
  9. Figueirinha, A.; Paranhos, A.; Pérez-Alonso, J.J.; Santos-Buelga, C.; Batista, M.T. Cymbopogon citratus leaves: Characterisation of flavonoids by HPLC-PDA-ESI/MS/MS and an approach to their potential as a source of bioactive polyphenols. Food Chem. 2008, 718–728. [Google Scholar]
  10. Chassagne, D.; Crouzet, J.C.; Bayonove, C.L.; Baumes, R.L. Identification and quantification of Passion fruit cyanogenic glycosides. J. Agric. Food Chem. 1996, 44, 3817–3820. [Google Scholar] [CrossRef]
  11. Chassagne, D.; Crouzet, J.; Bayonove, C.L.; Baumes, R.L. Glycosidically bound eugenol and methyl salicylate in the fruit of edible Passiflora species. J. Agric. Food Chem. 1997, 45, 2685–2689. [Google Scholar] [CrossRef]
  12. Froehlich, O.; Duque, C.; Schreier, P. Volatile constituents of curuba (Passiflora mollissima) fruit. J. Agric. Food Chem. 1989, 37, 421–425. [Google Scholar] [CrossRef]
  13. Valente, A.; Albuquerque, T.G.; Sanches-Silva, A.; Costa, H.S. Ascorbic acid content in exotic fruits: A contribution to produce quality data for food composition databases. Food Res. Int. 2011, 44, 2237–2242. [Google Scholar] [CrossRef]
  14. Edwin, E.; Sheeja, E.; Dhanabal, S.P.; Suresh, B. Antihyperglycemic activity of Passiflora mollissima Bailey. Indian J. Pharm. Sci. 2007, 69, 570–571. [Google Scholar] [CrossRef]
  15. Kannan, S.; Parimala Devi, B.; Jayakar, B. In-vitro antibacterial activity of various extracts on the leaves of Passiflora mollissima. J. Chem. Pharm. Res. 2010, 2, 225–228. [Google Scholar]
  16. Muñoz Jáuregui, A.M.; Ramos-Escudero, D.F.; Alvarado-Ortiz Ureta, C.; Castañeda Castañeda, B. Evaluación de la capacidad antioxidante y contenido de compuestos fenólicos en recursos vegetales promisorios. Rev Soc. Quím. Perú. 2007, 73, 142–149. [Google Scholar]
  17. Simirgiotis, M.J.; Theoduloz, C.; Caligari, P.D. S.; Schmeda-Hirschmann, G. Comparison of phenolic composition and antioxidant properties of two native chilean and one domestic strawberry genotypes. Food Chem. 2009, 113, 377–385. [Google Scholar] [CrossRef]
  18. Simirgiotis, M.J.; Schmeda-Hirschmann, G. Direct identification of phenolic constituents in Boldo Folium (Peumus boldus Mol.) infusions by high-performance liquid chromatography with diode array detection and electrospray ionization tandem mass spectrometry. J. Chrom. A 2010, 1217, 443–449. [Google Scholar] [CrossRef]
  19. Ramos, F.A.R.; Castellanos, L.; Lopez, C.; Palacios, L.; Duque, C.; Pacheco, R.; Guzman, A. An Orientin derivative isolated from Passiflora tripartita var. mollissima. Lat. Am. J. Pharm. 2010, 29, 141–143. [Google Scholar]
  20. Nørbæk, R.; Brandt, K.; Kondo, T. Identification of flavone C-Glycosides Including a new flavonoid chromophore from Barley leaves (Hordeum vulgare L.) by improved NMR techniques. J. Agric. Food Chem. 2000, 48, 1703–1707. [Google Scholar] [CrossRef]
  21. Sato, S.; Koide, T. Synthesis of vicenin-1 and 3, 6,8- and 8,6-di-C-β-D-(glucopyranosyl-xylopyranosyl)- 40,5,7-trihydroxyflavones using two direct C-glycosylations of naringenin and phloroacetophenone with unprotected D-glucose and D-xylose in aqueous solution as the key reactions. Carbohydrate Res. 2010, 345, 1825–1830. [Google Scholar] [CrossRef]
  22. Choo, C.Y.; Sulong, N.Y.; Mana, F.; Wong, T.W. Vitexin and isovitexin from the Leaves of Ficus deltoidea with in vivo a-glucosidase inhibition. J. Ethnopharmacol. 2012, 142, 776–781. [Google Scholar] [CrossRef]
  23. Kumazawa, T.; Kimura, T.; Matsuba, S.; Sato, S.; Onodera, J.-I. Synthesis of 8-C-glucosylflavones. Carbohydrate Res. 2001, 334, 183–193. [Google Scholar] [CrossRef]
  24. Cuyckens, F.; Claeys, M. Optimization of a liquid chromatography method based on a simultaneous electrospray mass spectrometric and ultraviolet photodiode array detection for analysis of flavonoid glycosides. Rap. Comm. Mass Spec. 2002, 2341–2348. [Google Scholar] [CrossRef]
  25. Simirgiotis, M.J.; Silva, M.; Becerra, J.; Schmeda-Hirschmann, G. Direct characterisation of phenolic antioxidants in infusions from four Mapuche medicinal plants by liquid chromatography with diode array detection (HPLC-DAD) and electrospray ionisation tandem mass spectrometry (HPLC-ESI-MS). Food Chem. 2012, 131, 318–327. [Google Scholar] [CrossRef]
  26. Wang, X.; Liang, Y.; Zhu, L.; Xie, H.; Li, H.; He, J.; Pan, M.; Zhang, T.; Ito, Y. Preparative isolation and purification of flavone C-glycosides from the leaves of Ficus microcarpa L. f by medium-pressure liquid chromatography, high-speed countercurrent chromatography, and preparative liquid chromatography. J. Liq. Chrom. Rel. Tech. 2010, 33, 462–480. [Google Scholar] [CrossRef]
  27. Djoukeng, J.D.; Arbona, V.; Argamasilla, R.; Gomez-Cadenas, A. Flavonoid profiling in leaves of Citrus genotypes under different environmental situations. J. Agric. Food Chem. 2008, 56, 11087–11097. [Google Scholar] [CrossRef]
  28. Simirgiotis, M.J.; Schmeda-Hirschmann, G. Determination of phenolic composition and antioxidant activity in fruits, rhizomes and leaves of the white strawberry (Fragaria chiloensis spp. chiloensis form chiloensis) using HPLC-DAD-ESI-MS and free radical quenching techniques. J. Food Comp. Anal. 2010, 23, 545–553. [Google Scholar] [CrossRef]
  29. Kite, G.C.; Stoneham, C.A.; Veitch, N.C. Flavonol tetraglycosides and other constituents from leaves of Styphnolobium japonicum (Leguminosae) and related taxa. Phytochemistry 2007, 68, 1407–1416. [Google Scholar] [CrossRef]
  30. Simirgiotis, M.J.; Caligari, P.D. S.; Schmeda-Hirschmann, G. Identification of phenolic compounds from the fruits of the mountain papaya Vasconcellea pubescens A. DC. grown in Chile by liquid chromatography-UV detection-mass spectrometry. Food Chem. 2009, 115, 775–784. [Google Scholar] [CrossRef]
  31. Romani, A.; Campo, M.; Pinelli, P. HPLC/DAD/ESI-MS analyses and anti-radical activity of hydrolyzable tannins from different vegetal species. Food Chem. 2012, 130, 214–221. [Google Scholar] [CrossRef]
  32. Levigne, S.; Ralet, V.M.-C.J.; Quemener, B.C.; Pollet, B.N. L.; Lapierre, C.; Thibault, J.F.J. Isolation from sugar beet cell walls of arabinan oligosaccharides esterified by two ferulic acid monomers. Plant Phys. 2004, 134, 1173–1180. [Google Scholar] [CrossRef]
  33. Ye, M.; Yan, Y.; Guo, D.-A. Characterization of phenolic compounds in the Chinese herbal drug Tu-Si-Zi by liquid chromatography coupled to electrospray ionization mass spectrometry. Rap. Comm. Mass Spec. 2005, 19, 1469–1484. [Google Scholar]
  34. Ding, S.; Dudley, E.; Plummer, S.; Tang, J.; Newton, R.P.; Brenton, A.G. Fingerprint profile of Ginkgo biloba nutritional supplements by LC/ESI-MS/MS. Phytochemistry 2008, 69, 1555–1564. [Google Scholar]
  35. Gardana, C.; Nalin, F.; Simonetti, P. Evaluation of flavonoids and furanocoumarins from Citrus bergamia (Bergamot) Juice and Identification of new compounds. Molecules 2008, 13, 2220–2228. [Google Scholar] [CrossRef]
  36. Contreras-Calderón, J.; Calderón-Jaimes, L.; Guerra-Hernández, E.; García-Villanova, B. Antioxidant capacity, phenolic content and vitamin C in pulp, Peel and seed from 24 exotic fruits from Colombia. Food Res. Int. 2011, 44, 2047–2053. [Google Scholar] [CrossRef]
  37. Leong, A.C.-N.; Kinjo, Y.; Tako, M.; Iwasaki, H.; Oku, H.; Tamaki, H. Flavonoid glycosides in the shoot system of Okinawa Taumu (Colocasia esculenta S.). Food Chem. 2010, 119, 630–635. [Google Scholar] [CrossRef]
  38. Yildirim, A.; Mavi, A.; Kara, A. Determination of antioxidant and antimicrobial activities of Rumex crispus L. extracts. J. Agric. Food Chem. 2001, 49, 4083–4089. [Google Scholar] [CrossRef]
  39. Simirgiotis, M.J.; Adachi, S.; To, S.; Yang, H.; Reynertson, K.A.; Basile, M.J.; Gil, R.R.; Weinstein, I.B.; Kennelly, E.J. Cytotoxic chalcones and antioxidants from the fruits of Syzygium samarangense (Wax Jambu). Food Chem. 2008, 107, 813–819. [Google Scholar] [CrossRef]
  40. Benzie, I.F.F.; Strain, J.J. The ferric reducing ability of plasma (FRAP) as a measure of “Antioxidant Power”: The FRAP assay. Anal. Biochem. 1996, 239, 70–76. [Google Scholar] [CrossRef]

