Article

Tungsten Trioxide as a Visible Light Photocatalyst for Volatile Organic Carbon Removal

Particles and Catalysis Research Group, School of Chemical Engineering, The University of New South Wales, Sydney, NSW 2052, Australia
*
Author to whom correspondence should be addressed.
Molecules 2014, 19(11), 17747-17762; https://doi.org/10.3390/molecules191117747
Submission received: 27 August 2014 / Revised: 22 October 2014 / Accepted: 27 October 2014 / Published: 31 October 2014
(This article belongs to the Special Issue Photocatalysis)

Abstract

:
Tungsten trioxide (WO3) has been demonstrated to possess visible light photoactivity and presents a means of overcoming the UV-light dependence of photocatalysts, such as titanium dioxide. In this study, WO3 nanostructures have been synthesised by a hydrothermal method using sodium tungstate (Na2WO4·2H2O), sulphate precursors and pH as structure-directing agents and parameters, respectively. By altering the concentration of the sulphate precursors and pH, it was shown that different morphologies and phases of WO3 can be achieved. The effect of the morphology of the final WO3 product on the visible light photoactivity of ethylene degradation in the gas phase was investigated. In addition, platinum (Pt) was photodeposited on the WO3 structures with various morphologies to enhance the photocatalytic properties. It was found that the photocatalytic properties of the WO3 samples greatly depend on their morphology, chemical composition and surface modification. WO3 with a cuboid morphology exhibited the highest visible light photoactivity compared to other morphologies, while adding Pt to the surface improved the performance of certain WO3 structures.

1. Introduction

Volatile organic compounds (VOCs) are the group of airborne organic compounds capable of damaging human health and the environment. Indoor environments have been reported to contain up to ten times greater VOC pollutant levels than outdoor environments [1]. Indoor VOCs can originate from building materials, paints, glues, lacquer, carpet, office furnishings, cleaning compounds, cigarette smoke and other items [2,3]. Increasingly stringent regulations regarding acceptable VOC concentrations necessitate the implementation of technologies capable of meeting these requirements. Technologies based on adsorption or scrubbing the gas streams are capable of removing the VOCs, but generate secondary waste streams, which require disposal. Photocatalysis is an alternative technology for treating VOCs, converting them into comparatively benign water and carbon dioxide [4].
Titanium dioxide (TiO2) is generally the semiconductor of choice due to its high photoactivity, low cost, ready availability and non-toxic properties. However, TiO2 can only be activated by ultra-violet (UV) light (λ ≤ 380 nm), limiting the use of sunlight as the light source and rendering it virtually unusable in indoor environments without the presence of an external UV light source [5]. Tungsten trioxide (WO3) is a comparatively less studied semiconductor, which is capable of being activated by visible light (λ ≤ 450 nm) [6] and, consequently, may be a more suitable semiconductor for degrading VOCs in an indoor environment.
Several methods, including chemical vapour deposition (CVD) [7], thermal evaporation [8], electrochemical techniques [9], a spray pyrolysis approach [10], template-mediated synthesis [11], the sol-gel process [12] and hydrothermal reactions [13], have been reported for WO3 nanostructure synthesis. Of the listed methods, hydrothermal synthesis is a facile technique, which is well-suited to producing a range of nanostructured morphologies by simple variations to the precursor solution. For instance, controlled synthesis of WO3 nanostructures by the hydrothermal method has been performed with the help of structure-directing chemicals, like Na2SO4, Rb2SO4, K2SO4, Li2SO4, FeSO4 and Na2S [14,15,16,17,18]. This work focuses on fabricating tungsten oxide photocatalysts using a hydrothermal technique with varying pH, as well as the amount and type of sulphate precursor. Emphasis is placed on the influence of preparation conditions on the characteristics of WO3 nanostructures and, subsequently, on its capacity to photodegrade gas-phase ethylene using visible light as the energy source.
The relative energy of the electrons in the WO3 conduction band restricts their capacity to reduce oxygen, which results in a build-up of these electrons, followed by an increased incidence of recombination with holes and, ultimately, a decrease in photocatalytic performance. Improvements in WO3 photoactivity, so as to counteract this limitation, may be achieved by closely controlling particle morphology [19] or by loading platinum (Pt) deposits on the surface. The noble metal Pt is believed to greatly assist in electron transfer during the oxidation-reduction reactions in the photocatalysis process [20]. Pt loaded onto WO3 nanoparticles has been shown to enhance aqueous acetic acid mineralisation compared to bare WO3 photocatalysts under visible light illumination [21]. Similarly, WO3 photocatalysts with different platinum loadings have been proven to be more efficient for phenol oxidation [22], as well as tetracycline oxidation [23] in an aqueous suspension. Even at a 0.1% Pt loading on WO3 nanoparticles, notable improvement of the water splitting reaction has been demonstrated [24]. A beneficial impact of Pt deposits on WO3 was also observed in the gas phase for acetaldehyde photodegradation [25]. In this work, the influence of loading the surface with nanosized Pt deposits on visible light photoactivity is also considered.

2. Results and Discussion

The alkaline solution precursor of Na2WO4·2H2O essentially contains stable WO42− ions. With the supply of H+ ions from the resin, the WO42− ions gradually underwent condensation reactions in the column to form paratungstate ions, such as [W12O41]10− and [H2W12O40]6− (at pH ~ 4.0–7.0), and the metatungstic acid, (WO3)n·xH2O, (at pH ~ 1–4), according to the equations below [26].
Molecules 19 17747 i001
Molecules 19 17747 i002
Molecules 19 17747 i003
The condensation reaction involves protonation of tungsten oxyanions, formation of oxygen bridging between the protonated monomeric tungsten oxyanions and the release of water molecules. The rates of condensation are strictly controlled by the flow rate of solution and the amount of resin used.
WO3 particles prepared from the neat tungstic acid precursor (i.e., W0) were found from ICP-AES analysis to contain a sodium atomic content of 2.78 × 10⁻⁴ per atom of W. Since the starting solution contained two atoms of Na per atom of W, the significant reduction from the original amount indicates high removal efficiency by the ion-exchange process. The W0 particles were yellow in colour and identified by XRD analysis (spectra are located in the Supporting Information, Figure S1) to be a mixture of the monoclinic WO3 phase (cell constants: a = 7.2970 Å, b =7.5390 Å, c = 7.6880 Å; JCPDS 01-071-2141) and the orthorhombic WO3·⅓H2O phase (cell constants: a = 7.3590 Å, b = 12.5130 Å, c = 7.7040 Å; JCPDS 00-035-0270). The mixture of phases in W0 conforms to the tungstic acid dehydration evolution profile as described by Livage and Guzman [27]. SEM imaging indicates that the W0 morphology comprises a mixture of large slabs with clusters of columnar crystals, as observed from Figure 1A.
Figure 1F shows the SEM image for the commercial Sigma Aldrich WO3 (WSA). WSA consists of nanoparticles with a size distribution from 30–100 nm and, from XRD (spectra are located in the Supporting Information, Figure S1) was found to possess a pure monoclinic crystalline phase.

2.1. Effect of Sulphate Anions and pH on WO3 Characteristics

The impact of sulphate (originating from Na2SO4) as the shape directing agent on WO3 morphology is illustrated in Figure 1B,C for W0.3NaS and W7.6NaS (see Experimental Section 3.2 and Table 1 for an explanation of the sample abbreviations), respectively. The two samples show more elongated structures when compared to W0. The W0.3NaS particles consist mainly of randomly orientated columnar crystals and individual particles, while the W7.6NaS particles exhibit a bundled structure consisting of aligned nanorods. The difference in the morphology can be attributed predominantly to the addition of the SO42− anions, as the pH values of the final solutions were similar (Table 1). It is readily apparent that the SO42− anions promote anisotropic growth. One manner by which shape-controlling additives can behave is to “cap” the growth of particles along a particular crystal plane. That is, they preferentially interact with one or two crystal faces, hindering growth on those planes, which then favours growth on the “uncapped” face, resulting in elongated structures [28]. To explain the tendency of the nanorods to align parallel to each other for W7.6NaS, it is speculated that the lateral capillary forces along the length of the nanorod are higher compared to its width, causing side-by-side alignment rather than end-to-end. The aggregation of the pre-formed nanorods by oriented attachment [29] may be energetically favoured to reduce the surface energy of the system, and consequently, the nanorod WO3 bundles are obtained for W7.6NaS.
Figure 1. SEM images of: (A) hydrothermally synthesised WO3 with no additives (W0); (B) hydrothermally synthesised WO3 with Na2SO4 added at a SO42−:WO42− ratio of 0.3 (W0.3NaS); (C) hydrothermally synthesised WO3 with Na2SO4 added at a SO42−:WO42− ratio of 7.6 (W7.6NaS); (D) hydrothermally synthesised WO3 with H2SO4 added at a SO42−:WO42− ratio of 0.3 (W0.3HS); (E) hydrothermally synthesised WO3 with H2SO4 added at a SO42−:WO42− ratio of 7.6 (W7.6HS); (F) commercial Sigma Aldrich WO3 (WSA).
Molecules 19 17747 g002
Table 1. Selected synthesis parameters and characteristics for the different WO3 photocatalysts. Included are the characteristics for commercial Sigma Aldrich WO3 (WSA).
SamplePrecursor SolutionMolar Ratio Molecules 19 17747 i007Final pHMorphologyCrystalline Phase (Chemical Formula)Surface Area (m2/g)Band-Gap (eV)
W020 mL 0.1 M H2WO4-1.61slabs with columnar clustersmonoclinic (WO3) + orthorhombic (WO3·⅓H2O)n.a.n.a.
W0.3NaS20 mL 0.1 M H2WO4 + SO42− (from Na2SO4)0.31.3columnar crystalsmonoclinic (WO3) + orthorhombic (WO3·⅓H2O)n.a.n.a.
W7.6NaS20 mL 0.1 M H2WO4 + SO42− (from Na2SO4)7.61.15nanobundleshexagonal (WO3)44.42.68
W0.3HS20 mL 0.1 M H2WO4 + H2SO40.3<0.3nanocubesmonoclinic (WO3) + orthorhombic (WO3·⅓H2O)n.a.n.a.
W7.6HS20 mL 0.1 M H2WO4 + H2SO47.6<0.3nanocubesmonoclinic (WO3) + orthorhombic (WO3·⅓H2O)7.02.75
WSACommercial WO3 (Sigma Aldrich) --nanoparticlesmonoclinic (WO3)8.32.61
Using different amounts of the sulphate additive in hydrothermal synthesis can produce different WO3 crystalline phases. At the lower SO42−/WO42− ratio (W0.3NaS), XRD indicated that the crystalline phase was the same as W0 (Table 1 and Supporting Information, Figure S1). The addition of excess sulphate additive induces a change in the crystalline phase from a mixture of monoclinic and orthorhombic in W0.3NaS to hexagonal-phase WO3 (cell constants: a = 7.3244 Å, b =7.3244 Å, c = 7.6628 Å; JCPDS 01-085-2459) in W7.6NaS. This observation suggests that not only does the sulphate additive play a crucial role in altering the morphology, but also in governing the crystalline phase of the product. Studies by Gu et al. [30] and Huang et al. [17] have also demonstrated the role of sulphate salt addition in determining crystalline phase of the WO3 product. Upon adding an increased amount of sulphate alkali metal salts, it was reported that the hexagonal phase becomes gradually dominant, which agrees with our result. Here, although the sodium ions in the Na2SO4 additive were removed during the ion exchange process, it is possible that a certain amount of Na+ ions still exist in the precursor solution (especially in W7.6NaS with a much higher Na2SO4 concentration) and therefore act as stabilising ions for the hexagonal and triangular tunnels in the formation of metastable hexagonal WO3.
To further investigate the unique behaviour of sulphate ions, H2SO4 was also used as a capping agent. The amount of H2SO4 added was adjusted, such that the SO42−/WO42− ratios were equivalent to those used during W0.3NaS and W7.6NaS synthesis. A consequence of using H2SO4 was a simultaneous increase in the free H+ ions present, whereby the pH dropped to below 0.3. At this low pH, the resulting WO3 crystal morphology did not resemble any of the previous systems. Aggregated nanocubes (edge length of approximately 100–200 nm) were obtained for both W0.3HS and W7.6HS (Figure 1D,E, respectively), with the size of the WO3 particles being noticeably smaller than for the Na2SO4 additive. The diffraction lines for both powder samples (XRD spectra are located in Supporting Information, Figure S1) were designated as containing mainly monoclinic WO3 (cell constants: a = 7.2970 Å, b = 7.5390 Å, c = 7.6880 Å; JCPDS 01-071-2141) and partially orthorhombic WO3·⅓H2O (cell constants: a = 7.3590 Å, b = 12.5130 Å, c = 7.7040 Å; JCPDS 00-035-0270). It appears that the addition of more H2SO4 has little influence in terms of the overall morphology of the product or the crystalline phase, at least for SO42−/WO42− ratios over the range 0.3 to 7.6.
It is suspected that the presence of the H+ ions is mainly responsible for both the cuboid morphology and the monoclinic-orthorhombic crystalline phase. pH has been demonstrated by Reis et al. [31] to have a marked influence on the crystalline phase of structures formed during hydrothermal acid hydrolysis of sodium tungstate (Na2WO4.2H2O), while Gu et al. [28] established pH variations over the range <0.5, 1.0–1.4 and 1.5–2.0 gave nanoparticle, nanobundle and nanowire WO3 structures, respectively. A possible explanation for the particle size shrinkage observed for the hydrothermally produced W0.3HS and W7.6HS samples might be that at a low pH value, the tungstic acid solution is so supersaturated that nucleation occurs homogeneously, rapidly generating a large number of small WO3 nuclei [32]. This nucleation reduces the supersaturation and consumes most of the resources for growth, which then results in a briefer ripening process.
Band-gaps derived from UV-Vis spectra (see Supporting Information, Figure S2), which are an indicator of the wavelength of light capable of photoactivating the material, ranged between 2.61 for WSA to 2.75 for W7.6HS (Table 1), which is typical for WO3 [24]. Table 1 also indicates that the specific surface area of the WO3 nanobundles is around five- to six-times greater than both the nanocubes and the nanoparticles.

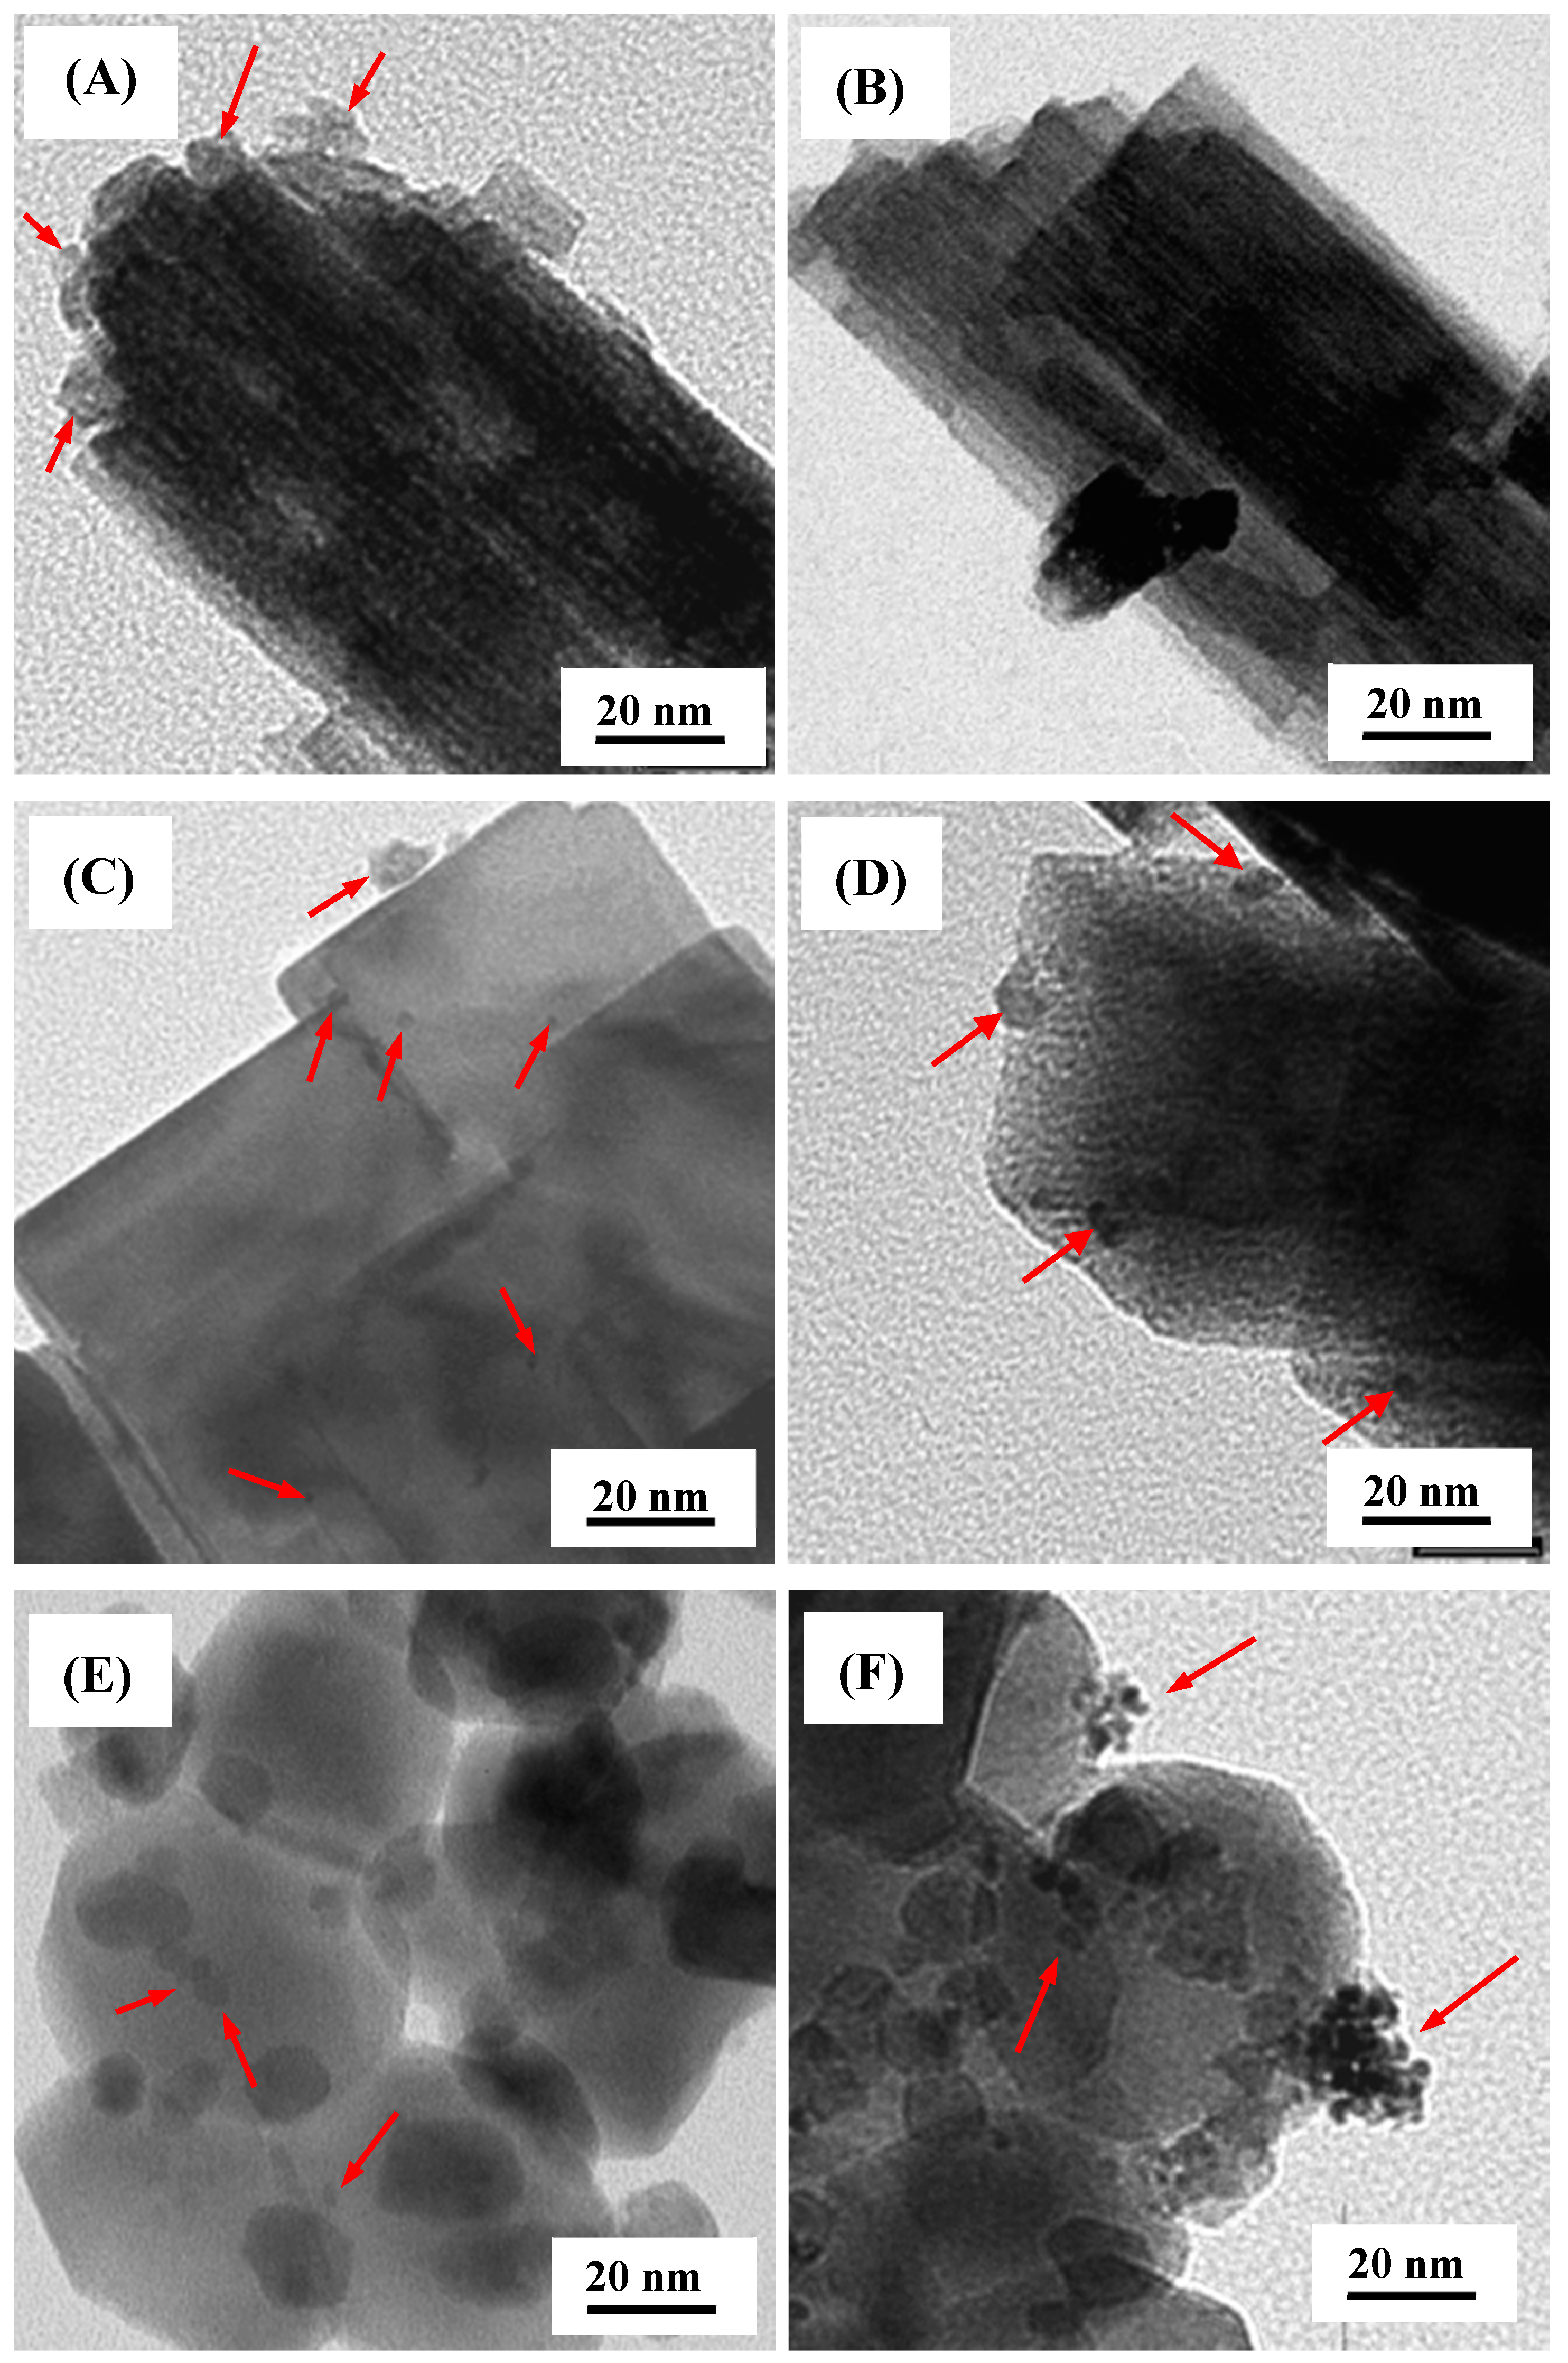
2.2. Pt/WO3 Characteristics

TEM micrographs showing Pt deposits on the various particle morphologies are provided in Figure 2. Figure 2A suggests that for W7.6NaS, there are Pt deposits (with diameters over the range 5–10 nm) loaded onto the nanorods when using UV-A light, although similarities in contrast between the Pt and WO3 make them difficult to discern. Identifying Pt deposits on W7.6NaS following visible light photodeposition (Figure 2B) was challenging with no clear evidence of Pt deposits being present in the TEM image. The presence of Pt being photodeposited on the WO3 nanocubes (W7.6HS) using both UV-A and visible light was more apparent, as illustrated in Figure 2C,D, respectively. In both instances, the Pt deposits are hemispherical and dispersed in nature, with photodeposition under UV-A light appearing to give a greater prevalence of smaller (2–3 nm) deposits. Visible light photodeposition appears to favour Pt deposits in the range of 5–10 nm, although photodeposition using UV light also provided some larger Pt deposits (~10 nm). The WSA sample exhibited the most distinct difference in Pt photodeposit characteristics arising from the different light sources. Figure 2E indicates that Pt photodeposits from UV-A light are present as individual, roughly hemispherical deposits, although, again, the low contrast makes them difficult to identify. Visible light Pt photodeposition on WSA (Figure 2F) results in clusters of small Pt deposits accumulating on the WO3 particles. Pt nanoparticles within the clusters appear to have diameters of 2–3 nm, while the clusters themselves are up to 20 nm in diameter. It also appears that individual Pt deposits are present on the WO3 particles. From the TEM images, we can infer that the different WO3 morphologies and the light wavelengths impact the Pt photodeposition process. Particle morphology (e.g., nanocube versus irregular) will govern the number of potential sites (e.g., steps, edges, defects) where Pt deposition is favoured, as too will the crystalline phase (e.g. monoclinic versus hexagonal).
Figure 2. TEM micrographs of Pt photodeposited on WO3 nanorod bundles W7.6NaS using (A) UV-A light and (B) visible light; WO3 nanocubes W7.6HS using (C) UV-A light and (D) visible light; Sigma Aldrich WO3 WSA using (E) UV-A light and (F) visible light. Arrows indicate the Pt deposits.
Molecules 19 17747 g002
The valence state of the deposited platinum nanoparticles plays an important role during charge trapping and interfacial charge transfer, and subsequently, the photocatalytic efficiency of the resulting platinised metal oxide. Figure 3 shows the XPS spectra of the platinised WO3 nanocuboids (W7.6HS) in the platinum (Pt4f) region (70–79 eV) arising from both UV-A and visible light photodeposition. In terms of the platinum oxidation state, the spectrum could be deconvoluted into two pairs of doublets. The main doublets located ca. 71.2 and 74.8 eV were attributed to atomic state Pt0, while the second pair of doublets at ca. 73.1 eV and 76.2 eV corresponded to the oxidation states of PtII. By comparing the normalised peak areas, Pt0 was found to be the dominant species from both UV-A and visible light photodeposition. However, the relative percentage of PtII in the deposits was greater for the visible light particles (44%) than the UV-A particles (21%). The difference in the extent of reduced Pt between the two samples may arise from the higher tendency of PtIV to be reduced (Equation (5)) compared to PtII (Equation (4)) [33]. Although we have employed a longer irradiation time during the photodeposition of platinum on WO3 supports using visible light (3 h) compared to UV (1 h), we cannot exclude the possibility that the total amount of photons from the visible light illumination were not enough to reduce the Pt precursor into Pt metal.
Molecules 19 17747 i004
Molecules 19 17747 i005
Figure 3. XPS spectra over the platinum Pt4f region for platinum photodeposited on WO3 nanocubes (W7.6HS) using: (A) UV-A light for 1 h; (B) visible light for 3 h.
Molecules 19 17747 g003

2.3. Ethylene Photodegradation

Ethylene photodegradation profiles for neat WO3 nanocubes (W7.6HS) and WO3 nanocubes loaded with Pt using either visible light (3 h) or UV-A (1 h) are provided in Figure 4A. Upon illumination, the ethylene concentration drops sharply within the first 2.5 min for all samples, after which it increases slowly, eventually reaching a stable conversion level. The gradual increase in the ethylene concentration after the initial drop was postulated to be due to the formation of intermediate products, which compete with ethylene during the photocatalytic degradation process. Unfortunately, these intermediate products were not able to be detected by the GC/flame ionisation detector (FID) instrument, such that no identification of these products was available. Once stabilised, ethylene conversion was in the order neat WO3 ≈ Pt/WO3 (visible light 3 h) < Pt/WO3 (UV-A light 1 h). Despite displaying similar ethylene conversion levels after 30 min of illumination, it appears that, at least initially, the WO3 nanocubes platinised using visible light are more active than the neat WO3 nanocubes. The findings indicate that loading platinum deposits on the WO3 nanocubes improves their capacity for photodegrading ethylene. The greater photoactivity exhibited by the nanocubes loaded with Pt using UV-A light may arise from the greater portion of Pt0 within the deposits (Figure 3). Pt0/TiO2 has been reported to be more active than PtII/PtIV species on TiO2 for photocatalytic degradation of various organic contaminants [34,35]. The PtII or PtIV can undergo consecutive oxidation/reduction cycles, which consume excited charge carriers and lowers performance. A control system comprising only the washed silica beads is included in Figure 4 for comparison showing that the ethylene photodegradation derives solely from the neat and platinised WO3 nanostructures.
Figure 4. Photodegradation profiles displaying: (A) ethylene conversion with time for neat WO3 nanocubes (W7.6HS) and WO3 nanocubes platinised using visible light for 3 h or UV-A light for 1 h. Included is a silica control profile. (B) Steady-state ethylene conversion (as a percentage of initial ethylene concentration) for neat and platinised (visible light for 3 h or UV-A light for 1 h) WO3 nanobundles (W7.6NaS), nanoparticles (WSA) and nanocubes (W7.6HS).
Molecules 19 17747 g004
Figure 4B demonstrates that particle morphology has an influence on photocatalytic performance. In the case of neat WO3, the activity for ethylene photodegradation was in the order of nanocubes > nanobundles > nanoparticles. Despite having similar surface areas (Table 1), the WO3 nanocubes exhibit approximately 10% greater conversion of ethylene over the nanoparticles once the photoactivities had stabilised. This may be due to the more “edged” nature of the cuboid morphology, reducing the photogenerated electron-hole recombination, similar to that described by Kato et al. [36] in their study on photocatalytic water splitting by NiO/NaTaO3. Alternately, the relative proportion of different exposed crystal facets for the different morphologies may have influenced the photoactivity, as was demonstrated by Xie et al. for WO3 [37]. They observed that WO3 in a sheet-like form possessed a greater percentage of the (002) facet compared with WO3 cuboids. The dominance of the (002) facet blue-shifted the band-gap of the sheet-like structure, as well as increased the reduction potential of the conduction (and valence) band(s), relative to the cuboid structure. The deeper valence band maximum of the cuboid structure was used to account for it being the more effective structure when evolving oxygen during photocatalytic water oxidation in the presence of an electron acceptor. Interestingly, the nanobundles have a comparably higher surface area than the other nanostructures and a partially edged morphology, but do not display a correspondingly larger photoactivity. This may result from the hexagonal crystalline phase not being as active as the monoclinic-orthorhombic phase, with this postulation requiring further investigation.
Platinising the WO3 nanoparticles and nanocubes appears to have a more pronounced effect on ethylene photodegradation than for the nanobundles, especially when UV-A is used as the light source. In this instance, the photoactivity order becomes Pt/nanocubes > Pt/nanoparticles > Pt/nanobundles. This could derive from the hexagonal crystalline phase of the nanobundles being less active than the monoclinic phase and/or the comparative lack of Pt deposits on the nanobundles. Further study is needed to identify the parameter responsible for the result.
In general, the presence of metal deposits on the surface of a photocatalyst acts as an electron sink, trapping electrons and allowing for greater photogenerated hole availability for photodegradation reactions. However, the Pt deposits can also facilitate the transfer of electrons to electron scavengers in the system, most often O2 (Equation (6)). Wang et al. [38] suggested that the consumption of electrons by O2 is the rate limiting step in photocatalysis, and the presence of metal deposits can help alleviate this. In the instance of WO3, the reduction potential for the photogenerated electron (present in the conduction band) is not large enough for the single electron reduction of O2. That is, it does not possess enough energy to be picked up by O2 in accordance with Equation (6). However, the photogenerated electron does have enough energy to participate in the multi-electron reduction of O2 (Equations (7) and (8)), but the need for more than one electron in close proximity to invoke this reduction is not as favourable. This is depicted schematically in Figure 5. The valence and conduction band potentials of TiO2 are also provided for comparison.
Molecules 19 17747 i006
O2 + 2H+ + 2e → H2O2
O2 + 4H+ + 2e → 2H2O2
The presence of Pt facilitates the multi-electron reduction of O2 due to the ready availability of electrons in close proximity to one another on the Pt deposit. Consequently, the Pt reduces the limitation of the smaller conduction band electron potential of WO3, in turn promoting the photocatalytic activity. Similar to the result from this study, Abe et al. [21] also found that the decomposition of organic compounds under visible light irradiation with platinum loaded WO3 sample was enhanced significantly and postulated this to be due to the promotion of multi-electron O2 reduction on the Pt co-catalyst.
Figure 5. Valence and conduction band potentials for WO3 and single and multi-electron potentials for oxygen. The valence and conduction band potentials for TiO2 are included for comparison.
Molecules 19 17747 g005

3. Experimental Section

3.1. Materials

Commercial tungsten (VI) oxide nanopowder, WO3 (Sigma-Aldrich, St. Louis, MO, USA, denoted as “WSA”), with a mean particle size of less than 100 nm was used as the benchmark photocatalyst. For the hydrothermal synthesis of WO3 nanostructures, the following chemicals were used as received: Na2WO4·2H2O (99.0%, A.C.S. reagent, Sigma-Aldrich); Na2SO4, (99.0%, Ajax Finechem Pty. Ltd., Auburn, NSW, Australia) and “Amberlite” IR-120 (H) ion-exchange resin (BDH Laboratory Supplies).
Platinum (Pt) was loaded onto the WO3 nanostructures by a photodeposition method. H2PtCl6 (Sigma-Aldrich) was employed as the platinum precursor, and methanol, CH3OH (99.7%, Ajax Finechem Pty. Ltd.), acted as the hole-scavenger in the system. Nitrogen gas, N2 (>99%, Coregas Pty. Ltd., Yennora, NSW, Australia), was used to purge the solution during the photodeposition reaction.
Visible light photodegradation focused on ethylene (508 ppm, Coregas Pty. Ltd.) as the VOC model pollutant. Compressed air (79% N2, 21% O2, Coregas, Pty. Ltd.) acted as the diluent of the gas stream, while compressed nitrogen, N2 (>99%, Coregas Pty. Ltd.), was used as the carrier gas in the gas chromatograph. The flame ionisation detector (FID) was fuelled by compressed hydrogen, H2 (Coregas, Pty. Ltd.), blended with compressed air.

3.2. Hydrothermal Synthesis of WO3 Nanostructures

Five variants of WO3 particles were hydrothermally synthesised: one without any shape-directing agent, denoted as “W0” (where “W” represents tungsten trioxide and “0” represents no shape directing agents); two with different concentrations of Na2SO4, denoted as “WxNaS” (where “x” represents the SO42−:WO42− molar ratio during hydrothermal synthesis and “NaS” indicates that Na2SO4 was the shape directing agent); and two with different concentrations of H2SO4, denoted as “WxHS” (where “HS” indicates that H2SO4 was the shape directing agent). An ion-exchange column containing approximately 35 g of “Amberlite” IR-120 (H) was set up to remove sodium ions (Na+) from the NaWO4 solution. When preparing the precursor for W0 and WxHS synthesis, a solution of Na2WO4·2H2O (0.1 M) was passed through the column at 1 mL/min, and the eluent was collected. The resulting tungstic acid (H2WO4·2H2O) solution displayed a pale yellow colour and possessed a pH between 1.61 and 1.67. In the case of the WxNaS precursor, a specified amount of Na2SO4 (see Table 1) was added to the H2WO4·2H2O (0.1 M) solution and then passed through the ion-exchange column to remove the Na ions from the Na2SO4.
To prepare the W0 particles, 20 mL of the H2WO4 precursor solution was initially placed in a 50-mL Teflon tube. In the case of WxHS particle synthesis, a small amount of H2SO4 with a specified concentration (see Table 1) was added to the H2WO4 precursor solution in the Teflon tube. For WxNaS particle synthesis, 20 mL of the mixed tungstic-sulphate precursor was placed in the 50-mL Teflon tube. Following precursor addition, the Teflon tube was then sealed in a stainless steel autoclave and heated in an oven at 200 °C for 10 h. The resulting precipitate was recovered by centrifuging (Beckmann Coulter Allegra 25R, 10,000 rpm), washed at least five times with deionised water to remove any unreacted precursors and air-dried in a 60 °C oven for approximately 15 h.

3.3. Photodeposition of Platinum on WO3 Nanostructured Supports

Platinum was loaded onto the WO3 nanostructure surface using photodeposition in a 500-mL Pyrex glass annular reactor surrounding a 20-W NEC T10 black light blue lamp (λmax = 360 nm). A 1 g/L WO3 slurry was dispersed ultrasonically for 15 min, with 550 mL of this slurry transferred to the photoreactor and circulated for 30 min under illuminated conditions. Light pre-treatment was designed to remove adsorbed organic impurities from the particle surface. The UV lamp was then turned off, and 2000 µg carbon, in the form of methanol, were added to the system as a hole scavenger. The metal precursor (H2PtCl6) was added to give the required Pt loading (1.0 at. %); the pH was adjusted to 3 using dilute perchloric acid, and the system was purged with nitrogen gas at a flow rate of 50 mL/min for 20 min. The conditioned slurry was illuminated for 60 min, recovered by centrifuging and washed with deionised water for a minimum of five times. The washed particles were dried in an oven at 60 °C for 12 h and then ground and stored in a desiccator prior to use.
As a comparison, the effect of using visible light as the source of illumination during Pt photodeposition was investigated. In this instance, an 18-W fluorescent light (Sylvania Luxline Plus F18/860, Erlangen, Germany) with a cut-off filter (λ > 420 nm) was employed as the light source. The photodeposition procedure was the same as for the UV-lamp apart from the illumination period (during Pt photodeposition) being extended to 3 h, due to the weaker irradiance of the fluorescent lamp.

3.4. Photocatalytic Oxidation of Ethylene

Neat and Pt-loaded WO3 nanostructures were assessed for gas-phase ethylene photodegradation using an annular-type packed-bed photoreactor, as described previously [39]. The photoreactor consisted of a 400 mm-long Pyrex glass tube (15 mm outside diameter (o.d.), 1.2 mm wall thickness) containing a glass filler tube (12 mm o.d.). The packed-bed reactor was prepared by filling the annular gap with a catalyst/silica bead mixture in a 1:10 ratio (total weight of 0.66 g) to give a catalyst bed approximately 50 mm in length. The bed was supported at each end by washed silica beads and held in position by quartz wool. Prior to use, the silica beads were cleaned with 1 wt % HCl solution and then rinsed with deionised water until no pH change was observed. The washed beads were then dried in an oven at 100 °C. Illumination was provided by four 6-W Sylvania fluorescent lamps spaced equidistantly around the reactor. Inlet ethylene concentration was maintained at 50 ppm in air at a flow rate of 20 mL/min. Ethylene concentration was measured using a Shimadzu GC-8A (Shimadzu Co., Tokyo, Japan) equipped with an FID. Gas component separation was achieved with an Alltech HAYESEP Q 80/100 column (Alltech Associates, Inc., Deerfield, IL, USA).
Photocatalysis experiments involved passing 10 mL/min air through the packed bed for 10 min, whereby the lamps were switched on for 60 min to remove impurities from the photocatalyst surface. The lamps were then switched off, and the ethylene:air mix passed through the bed (20 mL/min) until ethylene concentration in the reactor effluent was the same as that in the reactor inlet. At this point, the lamps were switched on and the reactor effluent analysed for ethylene concentration. Samples were taken every 2 min.

3.5. Characterisation

Morphology characterisation of the samples was obtained by a scanning electron microscope (Hitachi S900 SEM, Tokyo, Japan) at an applied voltage of 4 kV and a high resolution transmission electron microscope (CM200 TEM, Philips Co., Amsterdam, The Netherlands) operated at 200 kV. X-ray diffraction (XRD) spectroscopy with a Philips X’pert Pro MPD (Philips Co., Eindhoven, The Netherlands), Cu Kα1 radiation λ = 1.54060 Å, 45 kV, 40 mA, was used to identify the crystalline phase of the product. N2 physisorption on a Micromeritics TriStar 3000 (Micromeritics, Norcross, GA, USA) was employed to evaluate the specific surface area of the product. Prior to analysis, the sample was degassed at 150 °C under vacuum overnight. The Brunauer–Emmett–Teller (BET) model (5-points) was used to determine the specific surface area. The photoresponses and band gap properties of all tungsten oxide catalysts were measured using UV-Vis spectroscopy (Varian Cary 300) from 200–800 nm, with barium sulphate (BaSO4) as the reference material. The oxidation states of platinum nanodeposits were determined by X-ray photoelectron spectroscopy (XPS-EscaLab 220-iXL, Al Kα radiation (1486.6 eV), Thermo VG Scientific Ltd., East Grinstead, UK). Inductively coupled plasma-atomic emission spectroscopy (ICP-AES, Varian Vista AX, Varian, Palo Alto, CA, USA) was used to determine the Na content within the synthesised particles.

4. Conclusions

The presence of SO42− anions and pH control has been demonstrated to play an important role in controlling the final morphology and crystalline phase of hydrothermally synthesised WO3 nanostructures. SO42− anions promoted the formation of hexagonal nanobundles, while at pH values below 0.3, nanocube formation with a monoclinic-orthorhombic crystalline structure was favoured. The influence of WO3 nanostructure morphology and crystalline phase on its capacity to photodegrade ethylene using visible light was investigated. The WO3 nanocubes provide the best photodegradation performance due to their unique geometric configuration. The presence of Pt deposits improved the photoactivity of the nanoparticles and nanocubes, which was assigned to the Pt deposits ability to facilitate the multi-electron reduction of O2. Utilising different light sources (i.e., visible light or UV-A) to photodeposit the Pt on the WO3 nanostructures altered the Pt deposit morphology, size and oxidation state, which also influenced the photocatalytic performance. The smallest photoactivity improvement was apparent for Pt loaded on the nanobundles, with this tentatively attributed to their hexagonal crystalline phase.

Supplementary Materials

Supplementary materials can be accessed at: https://www.mdpi.com/1420-3049/19/11/17747/s1.

Supplementary Files

Supplementary File 1

Acknowledgments

The authors would like to acknowledge the assistance of personnel at the Mark Wainwright Analytical Centre (UNSW) with the XPS analysis, ICP-AES analysis and XRD training, as well as the Electron Microscopy Unit (UNSW) for help with the SEM/TEM imaging.

Author Contributions

Yossy Wicaksana was responsible for the experimental component of the study, including WO3 particle synthesis, particle characterisation, photocatalytic experiments, compilation and interpretation of the results and manuscript proofing. Sanly Liu was responsible for preparation and proofing of the manuscript. Jason Scott was responsible for research direction and editing the manuscript. Rose Amal was responsible for research direction and proofing the manuscript.

Conflicts of Interest

The authors declare no conflict of interest.

References

  1. Kotzias, D. Indoor air and human exposure assessment-needs and approaches. Exp. Toxicol. Pathol. 2005, 57, 5–7. [Google Scholar] [CrossRef]
  2. Kostiainen, R. Volatile organic compounds in the indoor air of normal and sick houses. Atmos. Environ. 1995, 29, 693–702. [Google Scholar] [CrossRef]
  3. Jo, W.K.; Park, K.H. Heterogeneous photocatalysis of aromatic and chlorinated volatile organic compounds (vocs) for non-occupational indoor air application. Chemosphere 2005, 57, 555–565. [Google Scholar] [CrossRef]
  4. Mo, J.; Zhang, Y.; Xu, Q.; Lamson, J.J.; Zhao, R. Photocatalytic purification of volatile organic compounds in indoor air: A literature review. Atmos. Environ. 2009, 43, 2229–2246. [Google Scholar] [CrossRef]
  5. Wang, S.; Ang, H.M.; Tade, M.O. Volatile organic compounds in indoor environment and photocatalytic oxidation: State of the art. Environ. Int. 2007, 33, 694–705. [Google Scholar] [CrossRef] [PubMed]
  6. Yu, J.; Qi, L. Template-free fabrication of hierarchically flower-like tungsten trioxide assemblies with enhanced visible-light-driven photocatalytic activity. J. Hazard. Mater. 2009, 169, 221–227. [Google Scholar] [CrossRef] [PubMed]
  7. Wang, X.P.; Yang, B.Q.; Zhang, H.X.; Feng, P.X. Tungsten oxide nanorods array and nanobundle prepared by using chemical vapor deposition technique. Nanoscale Res.Lett. 2007b, 2, 405–409. [Google Scholar]
  8. Ponzoni, A.; Comini, E.; Ferroni, M.; Sberveglieri, G. Nanostructured WO3 deposited by modified thermal evaporation for gas-sensing applications. Thin Solid Films 2005, 490, 81–85. [Google Scholar] [CrossRef]
  9. Baeck, S.H.; Choi, K.S.; Jaramillo, T.F.; Stucky, G.D.; McFarland, E.W. Enhancement of photocatalytic and electrochromic properties of electrochemically fabricated mesoporous WO3 thin films. Adv. Mater. 2003, 15, 1269–1273. [Google Scholar] [CrossRef]
  10. Arutanti, O.; Ogi, T.; Nandiyanto, A.B.D.; Iskandar, F.; Okuyama, K. Controllable crystallite and particle sizes of WO3 particles prepared by a spray-pyrolysis method and their photocatalytic activity. Am. Inst. Chem. Eng. J. 2014, 60, 41–49. [Google Scholar] [CrossRef]
  11. Satishkumar, B.C.; Govindaraj, A.; Nath, M.; Rao, C.N.R. Synthesis of metal oxide nanorods using carbon nanotubes as templates. J. Mater. Chem. 2000, 10, 2115–2119. [Google Scholar] [CrossRef]
  12. Badilescu, S.; Ashrit, P.V. Study of sol-gel prepared nanostructured WO3 thin films and composites for electrochromic applications. Solid State Ion. 2003, 158, 187–197. [Google Scholar] [CrossRef]
  13. Song, X.C.; Zheng, Y.F.; Yang, E.; Wang, Y. Large-scale hydrothermal synthesis of WO3 nanowires in the presence of K2SO4. Mater. Lett. 2007, 61, 3904–3908. [Google Scholar] [CrossRef]
  14. Salmaoui, S.; Sediri, F.; Gharbi, N. Characterization of h-WO3 nanorods synthesized by hydrothermal process. Polyhedron 2010, 29, 1771–1775. [Google Scholar] [CrossRef]
  15. Gu, Z.; Zhai, T.; Gao, B.; Sheng, X.; Wang, Y.; Fu, H.; Ma, Y.; Yao, J. Controllable assembly of WO3 nanorods/nanowires into hierarchical nanostructures. J. Phys. Chem. B 2006, 110, 23829–23836. [Google Scholar] [CrossRef] [PubMed]
  16. Rajagopal, S.; Nataraj, D.; Mangalaraj, D.; Djaoued, Y.; Robichaud, J.; Khyzhun, O.Y. Controlled growth of WO3 nanostructures with three different morphologies and their structural, optical, and photodecomposition studies. Nanoscale Res. Lett. 2009, 4, 1335–1342. [Google Scholar] [PubMed]
  17. Huang, K.; Pan, Q.; Yang, F.; Ni, S.; Wei, X.; He, D. Controllable synthesis of hexagonal WO3 nanostructures and their application in lithium batteries. J. Phys. D: Appl. Phys. 2008, 41, 155417. [Google Scholar]
  18. Xu, Z.; Tabata, I.; Hirogaki, K.; Hisada, K.; Wang, T.; Wang, S.; Hori, T. Preparation of platinum-loaded cubic tungsten oxide: A highly efficient visible light-driven photocatalyst. Mater. Lett. 2011, 65, 1252–1256. [Google Scholar] [CrossRef]
  19. Amano, F.; Ishinaga, E.; Yamakata, A. Effect of particle size on the photocatalytic activity of WO3 particles for water oxidation. J. Phys. Chem. C 2013, 117, 22584–22590. [Google Scholar] [CrossRef]
  20. Denny, F.; Scott, J.; Chiang, K.; Teoh, W.Y.; Amal, R. Insight towards the role of platinum in the photocatalytic mineralisation of organic compounds. J. Mol. Catal. A: Chem. 2007, 263, 93–102. [Google Scholar] [CrossRef]
  21. Abe, R.; Takami, H.; Murakami, N.; Ohtani, B. Pristine simple oxides as visible light driven photocatalysts: Highly efficient decomposition of organic compounds over platinum-loaded tungsten oxide. J. Am. Chem. Soc. 2008, 130, 7780–7781. [Google Scholar] [CrossRef] [PubMed]
  22. Sclafani, A.; Palmisano, L.; Marc, G.; Venezia, A.M. Influence of platinum on catalytic activity of polycrystalline WO3 employed for phenol photodegradation in aqueous suspension. Sol. Energy Mater. Sol. Cells 1998, 51, 203–219. [Google Scholar] [CrossRef]
  23. Zhang, G.; Guan, W.; Shen, H.; Zhang, X.; Fan, W.; Lu, C.; Bai, H.; Xiao, L.; Gu, W.; Shi, W. Organic additives-free hydrothermal synthesis and visible-light-driven photodegradation of tetracyline of WO3 nanosheets. Ind. Eng. Chem. Res. 2014, 53, 5443–5450. [Google Scholar] [CrossRef]
  24. Bamwenda, G.R.; Arakawa, H. The visible light induced photocatalytic activity of tungsten trioxide powders. Appl. Catal. A: Gen. 2001, 210, 181–191. [Google Scholar] [CrossRef]
  25. Murata, A.; Oka, N.; Nakamura, S.; Shigesato, Y. Visible-light active photocatalytic WO3 films loaded with Pt nanoparticles deposited by sputtering. J. Nanosci. Nanotechnol. 2012, 12, 5082–5086. [Google Scholar] [CrossRef] [PubMed]
  26. Choi, Y.G.; Sakai, G.; Shimanoe, K.; Miura, N.; Yamazoe, N. Preparation of aqueous sols of tungsten oxide dihydrate from sodium tungstate by an ion-exchange method. Sens. Actuator B-Chem. 2002, 87, 63–72. [Google Scholar] [CrossRef]
  27. Livage, J.; Guzman, G. Aqueous precursors for electrochromic tungsten oxide hydrates. Solid State Ion. 1996, 84, 205–211. [Google Scholar] [CrossRef]
  28. Gu, Z.; Li, H.; Zhai, T.; Yang, W.; Xia, Y.; Ma, Y.; Yao, J. Large-scale synthesis of single-crystal hexagonal tungsten trioxide nanowires and electrochemical lithium intercalation into the nanocrystals. J. Solid State Chem. 2007, 180, 98–105. [Google Scholar] [CrossRef]
  29. Wang, H.L.; Ma, X.D.; Qian, X.F.; Yin, J.; Zhu, Z.K. Selective synthesis of CdWO4 short nanorods and nanofibers and their self-assembly. J. Solid State Chem. 2004, 177, 4588–4596. [Google Scholar] [CrossRef]
  30. Gu, Z.; Ma, Y.; Yang, W.; Zhang, G.; Yao, J. Self-assembly of highly oriented one-dimensional h-WO3 nanostructures. Chem. Commun. 2005, 28, 3597–3599. [Google Scholar] [CrossRef]
  31. Reis, K.P.; Ramanan, A.; Whittingham, M.S. Hydrothermal synthesis of sodium tungstates. Chem. Mater. 1990, 2, 219–221. [Google Scholar] [CrossRef]
  32. Wang, J.; Khoo, E.; Lee, P.S.; Ma, J. Controlled synthesis of WO3 nanorods and their electrochromic properties in H2SO4 electrolyte. J. Phys. Chem. C 2009, 113, 9655–9658. [Google Scholar] [CrossRef]
  33. Lide, D.R. CRC Handbook of Chemistry and Physics, 88th Ed. ed; CRC Press: Boca Raton, FL, USA, 2007–2008; pp. 8-20–8-29. [Google Scholar]
  34. Lee, J.; Choi, W. Photocatalytic reactivity of surface platinized TiO2: Substrate specificity and the effect of Pt oxidation state. J. Phys. Chem. B 2005, 109, 7399–7406. [Google Scholar] [CrossRef] [PubMed]
  35. Vorontsov, A.; Savinov, E.; Zhensheng, J. Influence of the form of photodeposited platinum on titania upon its photocatalytic activity in CO and acetone oxidation. J. Photochem. Photobiol. A: Chem. 1999, 125, 113–117. [Google Scholar] [CrossRef]
  36. Kato, H.; Asakura, K.; Kudo, A. Highly efficient water splitting into H2 and O2 over lanthanum-doped NaTaO3 photocatalysts with high crystallinity and surface nanostructure. J. Am. Chem. Soc. 2003, 125, 3082–3089. [Google Scholar] [CrossRef] [PubMed]
  37. Xie, Y.P.; Liu, G.; Yin, L.; Cheng, H.-M. Crystal facet-dependent photocatalytic oxidation and reduction reactivity of monoclinic WO3 for solar energy conversion. J. Mater. Chem. 2012, 22, 6746–6751. [Google Scholar] [CrossRef]
  38. Wang, C.M.; Heller, A.; Gerischer, H. Palladium catalysis of O2 reduction by electrons accumulated on TiO2 particles during photoassisted oxidation of organic compounds. J. Am. Chem. Soc. 1992, 114, 5230–5234. [Google Scholar] [CrossRef]
  39. Lee, S.L.; Scott, J.; Chiang, K.; Amal, R. Nanosized metal deposits on titanium dioxide for augmenting gas-phase toluene photooxidation. J. Nanopart. Res. 2009, 11, 209–219. [Google Scholar] [CrossRef]
  • Sample Availability: Samples of the compounds are not available from the authors.

