Article

Influence of Extractive Solvents on Lipid and Fatty Acids Content of Edible Freshwater Algal and Seaweed Products, the Green Microalga Chlorella kessleri and the Cyanobacterium Spirulina platensis

1
Department of Food Analysis and Chemistry, Faculty of Technology, Tomas Bata University in Zlin, nam. T. G. Masaryka 5555, Zlin CZ-760 01, Czech Republic
2
Department of Chemistry, Faculty of Technology, Tomas Bata University in Zlin, nam. T. G. Masaryka 5555, Zlin CZ-760 01, Czech Republic
3
Department of Viticulture and Enology, Faculty of Horticulture, Mendel University in Brno, Valticka 337, Lednice CZ-691 44, Czech Republic
4
Department of Natural and Informatics Sciences, Faculty of Central European Studies, Constantine the Philosopher University in Nitra, Drazovska 4, Nitra SK-949 74, Slovak Republic
*
Author to whom correspondence should be addressed.
Molecules 2014, 19(2), 2344-2360; https://doi.org/10.3390/molecules19022344
Submission received: 6 December 2013 / Revised: 5 February 2014 / Accepted: 7 February 2014 / Published: 21 February 2014
(This article belongs to the Section Natural Products Chemistry)

Abstract

:
Total lipid contents of green (Chlorella pyrenoidosa, C), red (Porphyra tenera, N; Palmaria palmata, D), and brown (Laminaria japonica, K; Eisenia bicyclis, A; Undaria pinnatifida, W, WI; Hizikia fusiformis, H) commercial edible algal and cyanobacterial (Spirulina platensis, S) products, and autotrophically cultivated samples of the green microalga Chlorella kessleri (CK) and the cyanobacterium Spirulina platensis (SP) were determined using a solvent mixture of methanol/chloroform/water (1:2:1, v/v/v, solvent I) and n-hexane (solvent II). Total lipid contents ranged from 0.64% (II) to 18.02% (I) by dry weight and the highest total lipid content was observed in the autotrophically cultivated cyanobacterium Spirulina platensis. Solvent mixture I was found to be more effective than solvent II. Fatty acids were determined by gas chromatography of their methyl esters (% of total FAMEs). Generally, the predominant fatty acids (all results for extractions with solvent mixture I) were saturated palmitic acid (C16:0; 24.64%–65.49%), monounsaturated oleic acid (C18:1(n-9); 2.79%–26.45%), polyunsaturated linoleic acid (C18:2(n-6); 0.71%–36.38%), α-linolenic acid (C18:3(n-3); 0.00%–21.29%), γ-linolenic acid (C18:3(n-6); 1.94%–17.36%), and arachidonic acid (C20:4(n-6); 0.00%–15.37%). The highest content of ω-3 fatty acids (21.29%) was determined in Chlorella pyrenoidosa using solvent I, while conversely, the highest content of ω-6 fatty acids (41.42%) was observed in Chlorella kessleri using the same solvent.

1. Introduction

Many recent studies have focused on the chemical composition of seaweeds, their positive contributions to human health and their possible usage as foodstuffs. Seaweed consumption has a long tradition in Asian countries and has increased in European countries in recent years, therefore approximately 20 species of edible algae are now available on the European market. Nowadays, freshwater algae and seaweeds have been extensively studied as good sources of many bioactive substances such as fatty acids, sterols, proteins, amino acids, minerals, polysaccharides or selected halogenated compounds, with extensive health benefit activities [1,2,3,4,5,6]. Freshwater algae and seaweeds, like fruits and vegetables, exhibit antibacterial, anti-inflammatory, anticancer, antiviral, anticoagulant, and other interesting properties [7,8,9]. There are many possibilities for their usage, especially in medicine, pharmacy and the food industry. For instance, seaweeds have been utilized industrially as a source of agar, carrageenans and alginates [1,10,11] and freshwater algae and seaweeds have been evaluated as nutraceutical foods [12,13].
Lipids, including their fatty acids (FAs), are essential human nutrients that can be classified as saturated (SFAs), monounsaturated (MUFAs), and polyunsaturated FAs (PUFAs), according to the absence or presence of unsaturated bonds. Humans are able to synthesize SFAs and MUFAs, but unfortunately, PUFAs with the first double bond on the third or sixth carbon atom (essential fatty acids—EFAs) are essential because they cannot be synthesized by humans [4,14].
Generally, the total lipid content of seaweeds by dry weight varies from 1% to 6% [15,16]. On the other hand, the total lipid content of freshwater green microalga Chlorella sp. was in the range from 2% to 22% by dry weight and the total lipid content of Spirulina sp. cyanobacterium ranged from 6.4% to 14.3% by dry weight [17,18,19]. Despite a low lipid content, seaweeds are rich in ω-3 and ω-6 FAs [15,16,20]. Red and brown seaweeds have a high concentration of eicosapentaenoic acid (EPA, C20:5) and arachidonic acid (C20:4), green algae are rich in α-linolenic acid (ALA, C18:3) and Spirulina cyanobacteria are rich in γ-linolenic acid (GLA, C18:3) [21,22].
The contemporary Western human diet is known for an increased intake of SFAs and ω-6 FAs that results in an imbalance of ω-3 and ω-6 FAs [4,23]. Seaweeds contain a higher proportion of ω-3 FAs, which are components of all cell membranes and are precursors of biochemical and physiological reactions in the body, acting against atherosclerosis, hypertension, inflammatory diseases, cystic fibrosis, rheumatoid arthritis and helping prevent mental illnesses [2,4,24].
The chemical composition of seaweed is affected by many factors such as the seaweed species, location and time of harvest, intensity of light, water chemistry at the location, and the part of plants used [2,25]. Studies of the lipid profile in seaweeds have investigated the seasonal variation [26], effect of growth conditions [27,28], and differences among diverse seaweed tissues [29]. Most studies which were focused on the total lipid contents and on the FA profiles have concerned fresh seaweeds [26,28,29]. However, the effect of algae and seaweed processing, i.e., drying, packaging, transporting, and subsequent storage, on the lipid content and FAs composition is rarely studied.
The present paper evaluates and compares the lipid profiles of nine commercially available seaweed microalgal and cyanobacterial products, and autotrophically cultivated samples of the green microalga Chlorella kessleri and the cyanobacterium Spirulina platensis. In addition, yield of lipids and FA profiles of seaweeds extracted using different solvents were compared. The new information presented herein should be useful to support more abundant consumption of dry seaweed products as a source of ω-3 and ω-6 FAs, and also for better revaluating the real contribution of freshwater algal and seaweed products to PUFA enrichment of the human food chain.

2. Results and Discussion

2.1. Total Lipid Contents

Total lipid contents of analyzed samples were determined in extracts obtained by different solvents (Table 1). Evidently, extraction using a 1:2:1 mixture of methanol/chloroform/water (solvent I) resulted in higher contents of lipids among all determined samples, ranging from 1.32% (P. palmata) to 18.02% (S. platensis), whereas the extraction with hexane (solvent II) was less effective in relation to lipid contents, that ranged from 0.64% (P. palmata) to 13.41% (S. platensis) for the same algal samples as in the previous analysis.
Moreover, the total lipid content seemed to be influenced by the cultivation or technology process. Here, the results showed much higher total lipid contents in autotrophically cultivated microalgae compared to freshwater edible products in pill form using both solvent systems. In detail, autotrophically cultivated cyanobacterium S. platensis contained 18.02% lipids (I), in comparison with 10.23% in the spirulina product (I). Similarly, 18.01% was measured in the autotrophically cultivated green microalga C. kessleri compared to 3.70% in the green microalga C. pyrenoidosa product after extraction with solvent I. Further, the content of total lipids obtained from the green microalga C. pyrenoidosa with solvent I (3.70%) was lower than established by Ortega-Calvo et al. in dry C. vulgaris algal product (8.6%) after extraction by dichloromethane/methanol (2:1) [19]. Similarly, D’Oca et al. presented results of lipid contents in C. pyrenoidosa in the range from 1.55% to 20.74%, depending on the different solvents and extraction methods used [18].
Table 1. Total lipid content (%) of dry samples of cyanobacterial, microalgal and seaweed products and autotrophically cultivated S. platensis and C. kessleri, in means ± SD.
Sample Total lipid content [%]
Mean 1SD 1Mean 2SD 2
S10.23 a0.593.50 b0.37
SP18.02 a1.1513.41 b0.79
C3.70 a0.313.41 a0.32
CK18.01 a1.159.87 b0.89
N1.61 a0.100.93 b0.13
D1.32 a0.180.64 b0.10
K3.11 a0.261.83 b0.19
A2.02 a0.221.58 b0.12
W1.66 a0.150.73 b0.17
WI3.31 a0.341.11 b0.15
H1.55 a0.161.17 b0.08
Spirulina platensis—S; Spirulina platensis cultivated autotrophically in a solar photobioreactor—SP; Chlorella pyrenoidosa—C; Chlorella kessleri cultivated autotrophically in a solar photobioreactor—CK; Porphyra tenera—N; Palmaria palmata—D; Laminaria japonica—K; Eisenia bicyclis—A; Undaria pinnatifida—W, WI; Hizikia fusiformis—H; 1 extraction with a 1:2:1 solvent mixture of methanol/chloroform/water (solvent I); 2 extraction with hexane (solvent II); a,b values in a row without a common superscript are significantly different (p < 0.05).
A similar result (14.3%) for total lipid content in the cyanobacterium S. platensis after extraction by a mixture of chloroform/methanol (2:1) was published by Babadzhanov et al. [17]. On the other hand, Ortega-Calvo et al. reported much lower contents of lipids in the cyanobacterial food products of S. platensis, S. maxima, and Spirulina sp. (6.4%–7.5% in dry weight) using a mixture of dichloromethane/methanol (2:1) [19].
The total lipid contents after extraction of the red seaweed products by solvent I were in the range from 1.32% (P. palmata) to 1.61% (P. tenera). These results are in accordance with literature lipid values in Porphyra sp. (1.0%–2.8%) and P. palmata (0.9%–1.8%) [15,19,20], although those lipid extractions were effected using different solvent mixtures: methanol/chloroform/water (1:2:1) [15], dichloromethane/methanol (2:1) [19] and chloroform/methanol (2:1) [20,30].
Lipid contents after extraction of brown algal products with solvent I were in the range from 1.55% (H. fusiformis) to 3.31% (U. pinnatifida WI). Observed total lipids results in brown seaweeds were largely in accordance with reported values: L. japonica 1.0% [15], Eisenia arborea 0.6% [31], U. pinnatifida 1.05%–4.5% [15,20], and finally H. fusiformis 0.7%–1.4% [15,19]. However, depending on the variability of the chemical composition of algae and methods of analysis, reported results are highly variable.
It was obvious that freshwater green microalgae and cyanobacteria contained higher concentrations of lipids than seaweed products. This could be caused by the specific metabolism and growth conditions of these algae.
In accordance with our findings, significant discrepancies in the efficiency of various solvent mixtures used for lipid extraction were reported in several studies [15,17,18,19,20]. That could be caused by the presence of different lipid components in the algal biomass. Generally, a higher amount of polar lipid compounds in algal biomass results in worse lipid extraction yields by nonpolar solvents and vice versa [18].

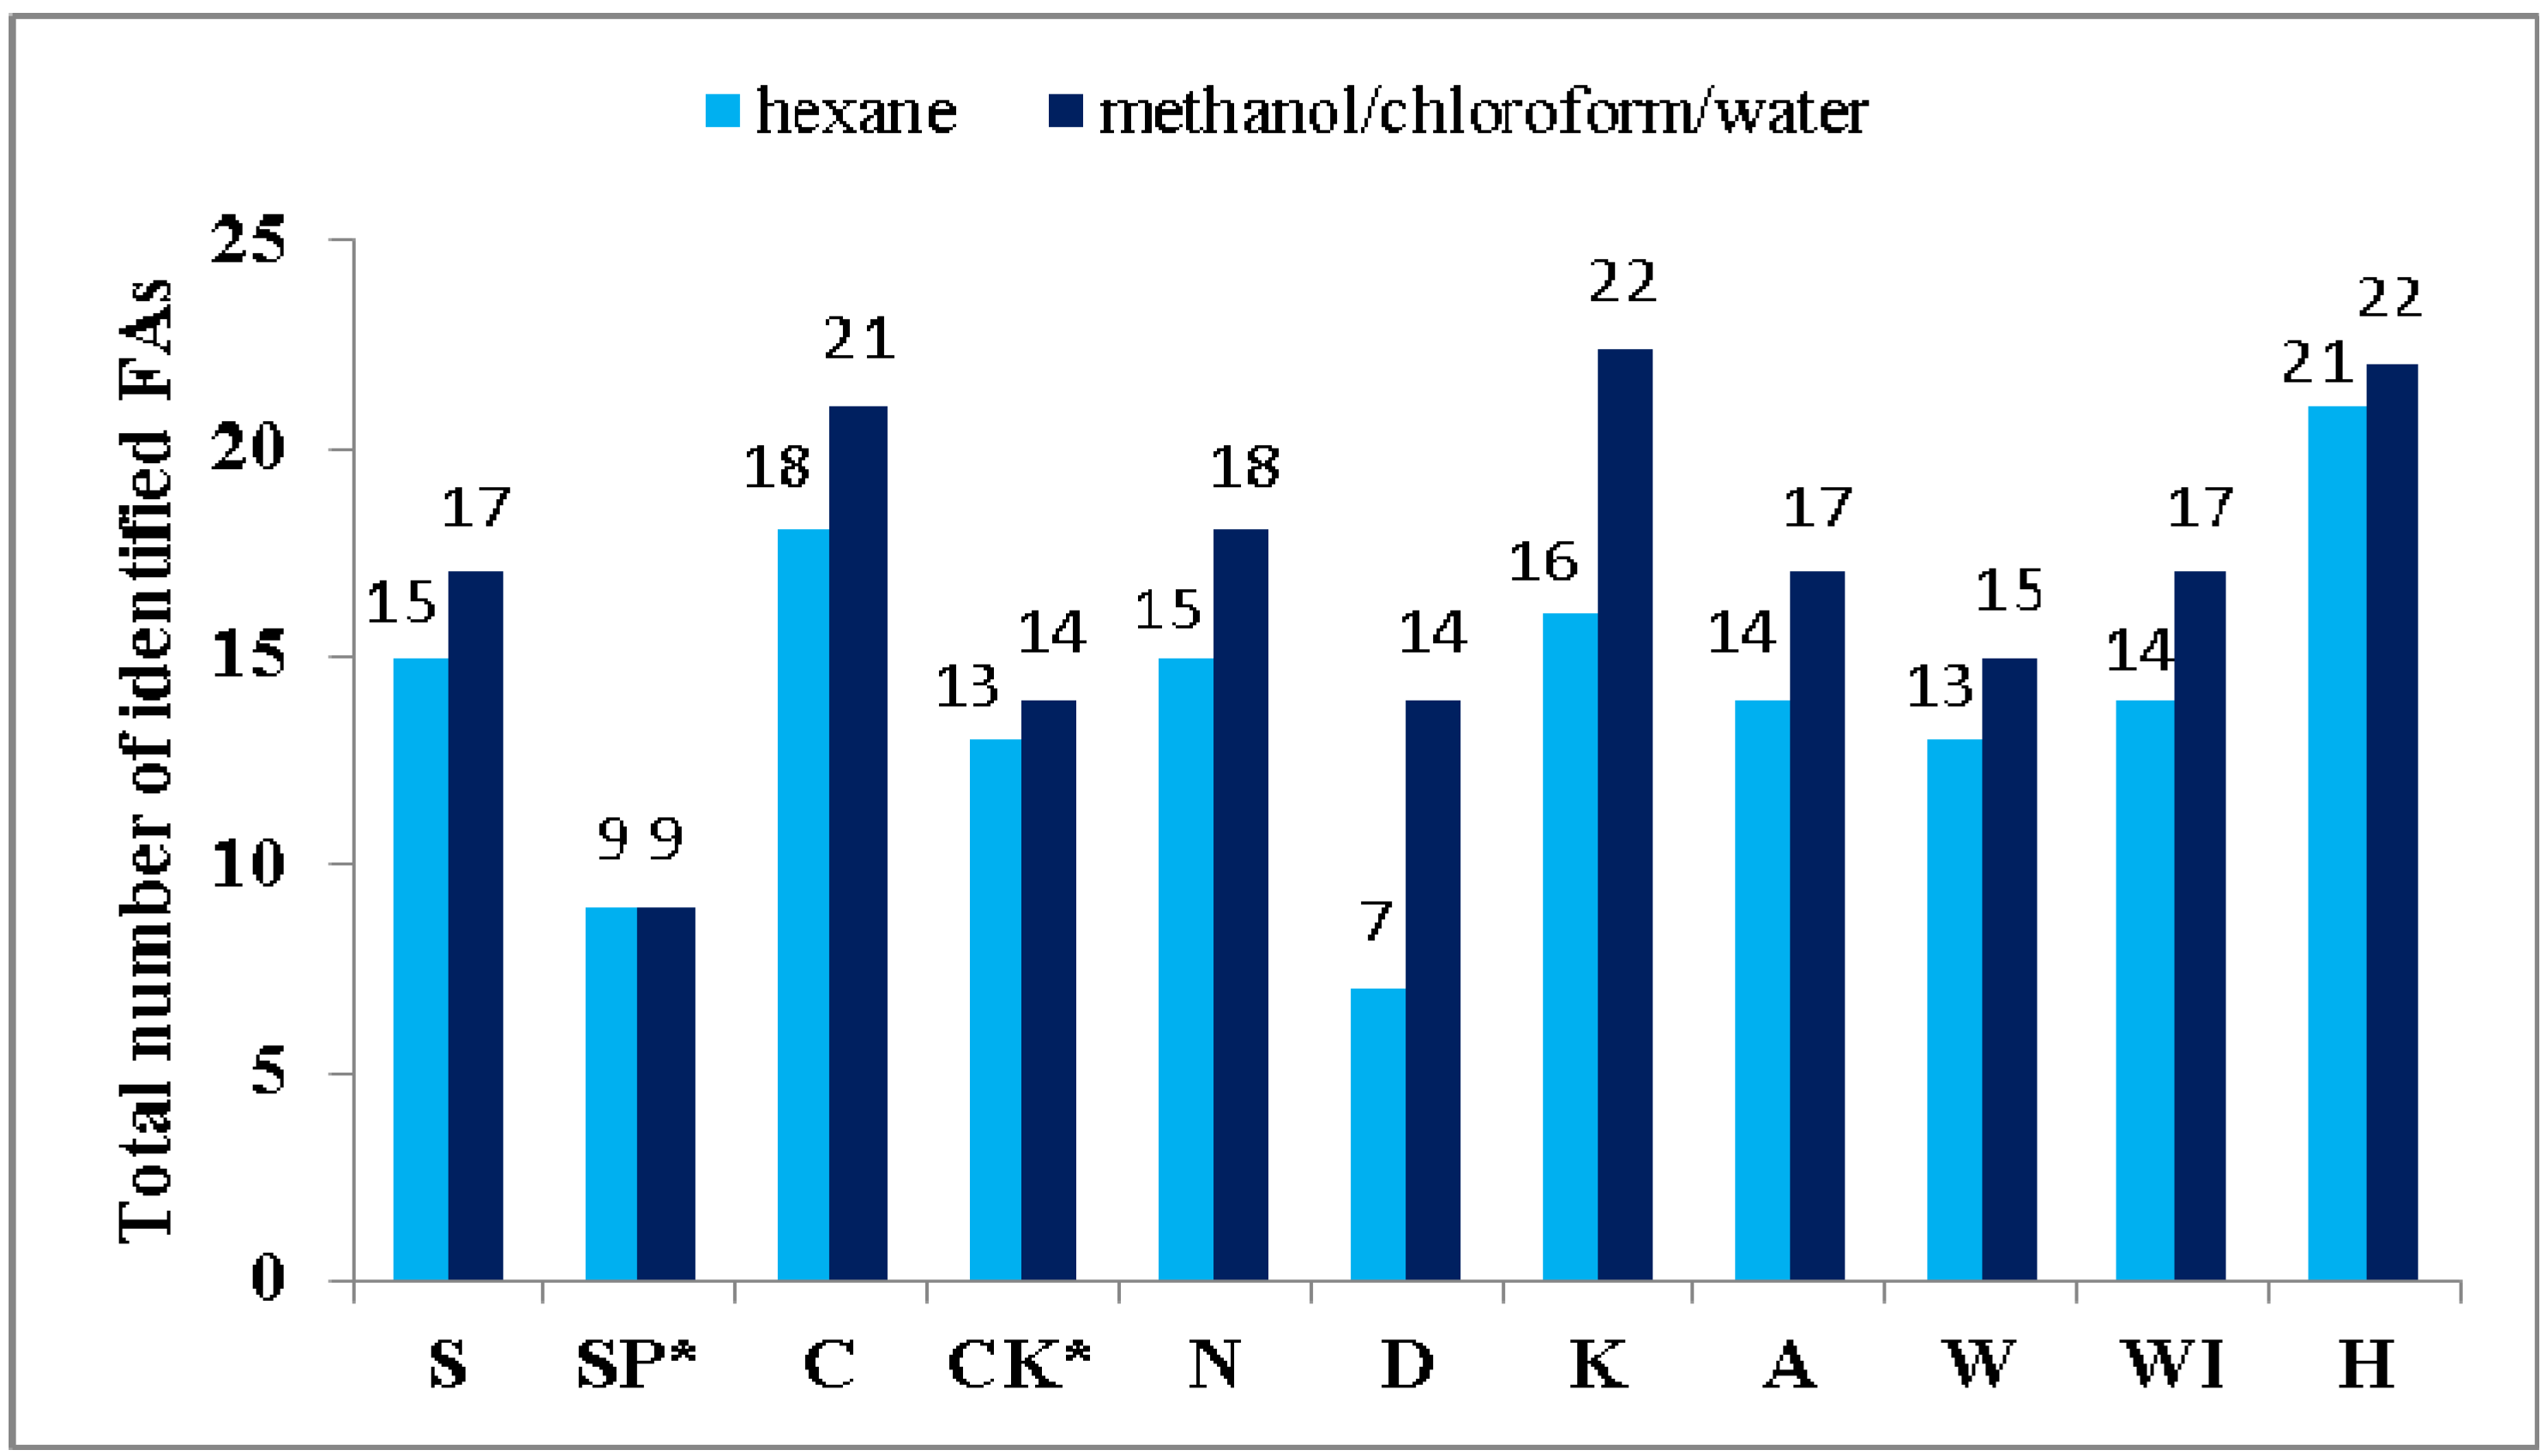
2.2. Influence of Extractive Solvents on the Number and Amount of Identified Fatty Acids

Significant differences in the FA composition of the nine algal products and the autotrophically cultivated S. platensis and C. kessleri were established. Variations in FA contents are ordinarily attributable both to environmental and genetic differences [20,32]. Nevertheless, the extractive solvents had an influence on the number and amount of identified FAs. The impact of the solvents used on the total number of identified FAs and different amounts of determined SFAs, MUFAs and PUFAs are presented in Figure 1, Figure 2, Figure 3 and Figure 4.
Figure 1. Numbers of identified FAs in cyanobacterial, microalgal and seaweed products and autotrophically cultivated S. platensis and C. kessleri extracted by solvent I or II.
Molecules 19 02344 g001
Figure 2. Comparison of the SFA contents (expressed in % of total FAMEs) extracted from cyanobacterial, microalgal and seaweed products and autotrophically cultivated S. platensis and C. kessleri by solvent I and II.
Molecules 19 02344 g002
Figure 3. Comparison of the PUFA contents (expressed in % of total FAMEs) extracted from cyanobacterial, microalgal and seaweed products and autotrophically cultivated S. platensis and C. kessleri by solvent I and II.
Molecules 19 02344 g003
Figure 4. Comparison of the MUFA contents (expressed in % of total FAMEs) extracted from cyanobacterial, microalgal and seaweed products and autotrophically cultivated S. platensis and C. kessleri by solvent I and II.
Molecules 19 02344 g004
From Figure 1 can be concluded that 9 to 22 or 7 to 21 FAs were identified, respectively, depending on whether solvent I or II was used. The solvent I was found more effective than solvent II in relation to a number of identified FAs for almost all samples, except for autotrophically cultivated S. platensis, where the same efficiency for both solvents was established.
The different efficiency of the two solvents used for the extraction of algal lipids in relation to the proportions of the different FAs is evident too from the obtained results shown in Figure 2, Figure 3 and Figure 4. Higher amounts of SFAs (Figure 2) were obtained from all samples except for Spirulina genus using solvent II. The solvent I was more effective for PUFAs for almost in all samples, except for both Spirulina genus samples and the product from the brown seaweed H. fusiformis (Figure 3). Further, solvent II was more effective for MUFA extraction in both samples of the green freshwater algae C. kessleri and C. pyrenoidosa and in the three brown seaweed products L. japonica, and U. pinnatifida (W, WI). Finally, in samples of autotrophically cultivated S. platensis and E. bicyclis, no difference between the two solvents used was observed (Figure 4).

2.3. Fatty Acid Profiles

FA compositions of cyanobacterial, microalgal and seaweeds products and two samples of autotrophically cultivated green microalga and cyanobacteria obtained by different solvent extractions are presented in Table 2 and Table 3 and the results are given in % of total FAMEs.
Table 2. FA profiles of the cyanobacterial, microalgal and seaweed products and autotrophically cultivated cyanobacterium S. platensis and microalga C. kessleri (% of total FAMEs) of lipid extracted by solvent I.
CyanobacteriaGreen microalgaeRed seaweedsBrown seaweeds
FAsSSP *CCK *NDKAWWIH
C10:00.11nd0.20nd1.400.570.040.130.100.090.16
C12:00.21nd0.080.110.290.580.050.080.100.110.13
C14:00.560.460.441.141.9912.325.828.185.885.165.09
C15:00.10nd0.120.720.881.790.200.590.440.330.45
C16:053.0261.0625.5924.6457.6165.4931.2131.1033.3831.0533.80
C17:00.280.270.360.290.280.450.200.280.360.340.39
C18:04.751.409.480.741.403.455.000.962.041.431.19
C20:00.06nd0.09ndndnd0.671.360.780.650.19
C21:0ndndndnd0.36ndndndndnd0.92
C22:0ndnd0.16nd1.71ndndndndnd0.49
C24:00.38nd0.471.23nd1.954.063.42ndnd4.68
C16:1(n-7)3.362.591.491.612.205.010.7910.041.801.045.25
C17:1(n-7)0.50nd0.15nd0.42nd0.090.57nd0.130.44
C18:1trans (n-9)0.08nd5.052.501.49nd0.20ndndndnd
C18:1cis (n-9)2.795.298.065.503.795.2926.4513.3913.3211.9110.00
C20:1(n-9)ndndndnd3.98nd2.833.54ndnd9.86
C22:1(n-9)ndndndndndndndndnd0.223.51
C18:2cis (n-6)16.1718.4218.7936.388.900.718.769.5510.129.855.07
C18:3(n-3)ndnd21.2919.763.520.381.22nd10.4817.171.46
C18:3(n-6)17.3610.447.644.748.661.961.943.025.747.522.43
C20:2(n-6)0.11nd0.260.64ndnd0.93ndndndnd
C20:3(n-6)0.15nd0.14ndndnd0.940.340.790.610.35
C20:4(n-6)ndndndnd1.48nd8.5713.5415.3712.3813.97
Other a0.000.070.130.000.000.080.050.000.000.000.16
ΣSFAs59.4763.1836.9928.8765.5686.5847.2446.0143.0939.1747.49
ΣMUFAs6.737.9614.789.6111.8810.3830.3827.5414.4013.3029.07
ΣPUFAs33.7928.8648.2361.5222.563.0422.3926.4542.5147.5323.44
Σn3-FAs0.000.0021.2919.763.520.381.220.0010.4817.171.46
Σn6-FAs33.7928.8626.9341.4219.042.6721.1726.4532.0230.3621.98
* samples cultivated autotrophically in a solar photobioreactor; nd—FAs not detected; Other a includes FAs determined in trace amounts, such as C14:1(n-5), C24:1(n-9), C18:2trans(n-6).
Table 3. FA profiles of the cyanobacterial, microalgal and seaweed products and autotrophically cultivated cyanobacterium S. platensis and microalga C. kessleri (% of total FAMEs) of lipid extracted by solvent II.
CyanobacteriaGreen microalgae Red seaweedsBrown seaweeds
FAsSSP *CCK *NDKAWWIH
C10:00.19nd0.09nd0.583.730.160.420.710.840.30
C12:00.360.100.170.470.962.45ndnd0.290.600.17
C14:00.710.480.572.251.9713.166.679.566.647.475.49
C15:00.12nd0.131.083.24nd0.130.71nd0.780.50
C16:044.8550.4327.5320.3346.5048.8234.6738.3535.4936.9334.36
C17:00.430.510.391.373.8113.170.321.041.850.420.54
C18:09.901.3016.833.797.5811.935.552.978.616.711.31
C20:00.12nd0.16nd3.23nd0.711.501.420.570.40
C21:0ndnd0.03ndndndnd0.91ndnd0.99
C22:0ndndndndndndndndndnd1.36
C24:0ndnd0.65nd8.70nd2.20ndnd4.533.91
C16:1(n-7)2.563.101.521.361.28nd0.759.442.761.102.67
C17:1(n-7)0.42nd0.10nd0.21ndndndndnd0.33
C18:1trans (n-9)0.08nd3.441.910.04nd0.20ndndndnd
C18:1cis (n-9)2.465.1311.007.862.876.7430.4916.289.3515.3011.28
C20:1(n-9)ndndndndndnd2.112.117.958.858.46
C22:1(n-9)ndndndndndndndndndnd2.78
C18:2cis (n-6)13.6523.7316.1225.898.44nd8.307.944.929.885.60
C18:3(n-3)ndnd13.4110.86ndndndndndnd1.97
C18:3(n-6)23.9815.227.785.9510.60nd1.712.4719.16nd2.28
C20:2(n-6)0.16nd0.08ndndndndndndndnd
C20:3(n-6)ndndndndndnd0.62ndndnd0.91
C20:4(n-6)ndndndndndnd5.416.290.856.0314.39
Other a0.000.000.0016.880.000.000.000.000.000.000.00
ΣSFAs56.7052.8246.5629.2976.5693.2650.4155.4655.0258.8449.34
ΣMUFAs5.518.2316.0628.014.416.7433.5527.8420.0525.2425.52
ΣPUFAs37.7938.9537.3842.7019.040.0016.0316.7024.9315.9125.15
Σn3-FAs0.000.0013.4110.860.000.000.000.000.000.001.97
Σn6-FAs37.7938.9523.9731.8419.040.0016.0316.7024.9315.9123.18
* Samples cultivated autotrophically in a solar photobioreactor; nd—FAs not detected, Other a includes FAs determined in trace amounts, such as C24:1(n-9).

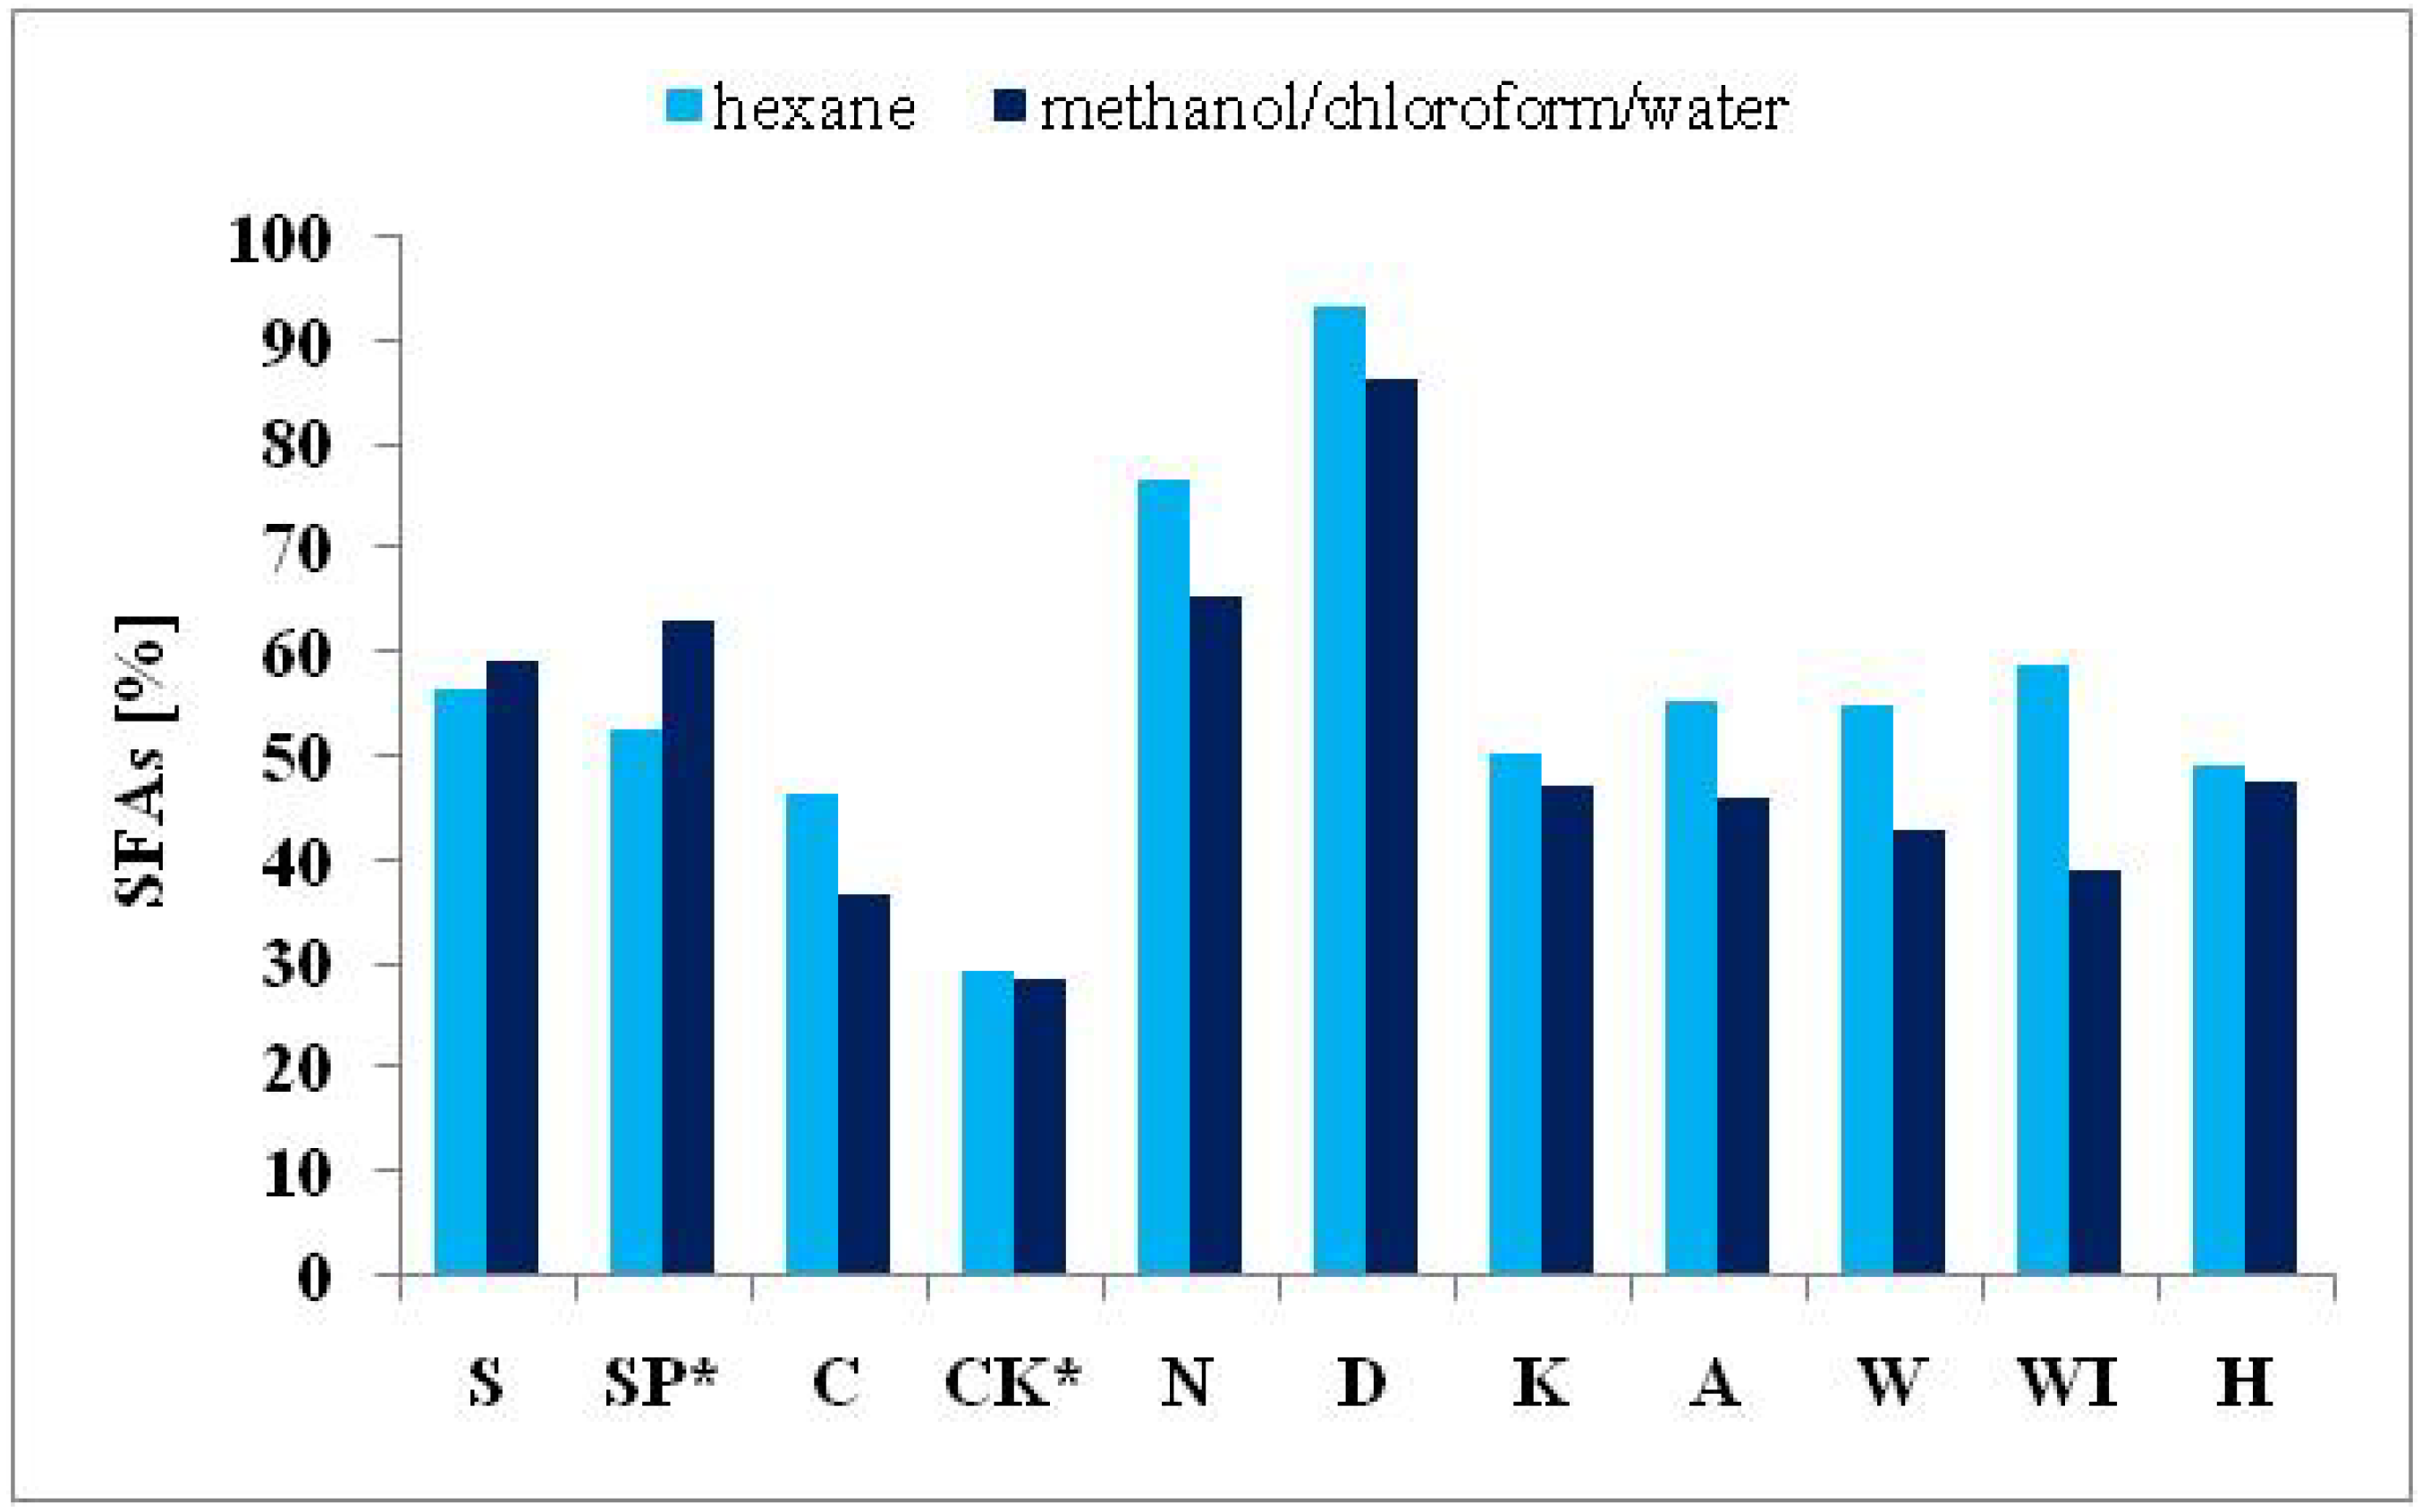
2.3.1. Saturated Fatty Acids

Pursuant to published data, the most abundant groups of algal lipids among the total FAMEs are SFAs or PUFAs, depending on the algal species [15,33]. The majority of the investigated samples showed the highest proportions of SFAs in their FAMEs distribution regardless of the solvent used. The highest contents of SFAs obtained with the solvents I and II were established in the red seaweeds P. palmata (86.58%/93.26%) and P. tenera (65.56%/76.56%). Conversely, the cultivated freshwater green microalga C. kessleri had the lowest contents of SFAs (28.87%/29.29%).
Palmitic acid (C16:0) was found to be the predominant SFA in all samples, present in a range from 24.64% of total FAMEs (cultivated C. kessleri, I) to 65.49% (P. palmata, I) and from 20.33% (cultivated C. kessleri, II) to 50.43% (cultivated S. platensis, II).
Comparable contents of palmitic acid (C16:0) were found in the cyanobacterial S. platensis product (53.02%/44.85%) and in autotrophically cultivated S. platensis (61.06%/50.43%) in comparison with the reported amounts (49.1%–56.2%) for Spirulina sp., S. platensis and S. maxima [19], and for autotrophically cultivated S. platensis (44.9%) [17].
Likewise, comparable contents of palmitic acid (C16:0) were established in the green microalgae C. pyrenoidosa (25.59%/27.53%) and in cultivated C. kessleri (24.64%/20.33%) compared to reported data for the microalgal product C. vulgaris (22%, 25.1% of total FAMEs) [19,34].
Contents of palmitic acid (C16:0) in the red seaweeds P. palmata (65.49%/48.82%) and P. tenera (57.61%/46.50%) were determined as the highest from almost all samples with both solvents. These results are in accordance with the published data for Porphyra sp. (30.8%–63.19%) [15,20] and P. palmata (23.3%–65.8%) [19,35].
Generally, contents of palmitic acid (C16:0) in brown seaweed products obtained by solvent II (34.36%–38.35%) were surprisingly higher than those obtained by solvent I (31.10%–33.80%). It was observed that the content of palmitic acid (C16:0) in L. japonica (31.21%/34.67%) was in keeping with the reported content of palmitic acid (C16:0) in the brown seaweed Laminaria sp. (36.0%) [15], but differed from the result reported for the same seaweed L. japonica (12.3%) [36]. Further, in H. fusiformis, higher amounts of palmitic acid (33.80%/34.36%) were found in comparison with the reported contents (26.8%–31.0%) [15,19]. Similarly, in the samples of the other brown seaweed U. pinnatifida (W, WI), higher amounts of palmitic acid (C16:0) were measured (33.38%/35.49% for W; 31.05%/36.93% for WI) in comparison with the published data (13.5%–26.8%) [15,36]. SFAs with a higher carbon number (C20–C22) mostly occurred in small amounts or they were not identified in the analyzed samples, except for C24 in both extracts.

2.3.2. Monounsaturated Fatty Acids

MUFAs were distributed in less amounts than SFAs and their contents ranged from 6.73% (S. platensis) to 30.38% (L. japonica) in the solvent I extract and from 4.41% (P. tenera) to 33.55% (L. japonica) in solvent II extracts. In general, large differences were found in MUFA contents among the analyzed algal species. The highest contents of MUFAs were determined in brown seaweeds, whilst the lowest contents were detected in the samples of cyanobacteria and red seaweeds, depending on the solvents used.
Oleic acid C18:1(n-9) was found as the most abundant MUFA in all samples, except for S. platensis and P. tenera, where palmitooleic acid C16:1(n-7) and eicosenoic acid C20:1(n-9), were established as the predominant MUFAs, respectively. Contents of oleic acid expressed as a sum of C18:1(n-9) ranged from 2.86%/2.54% (S. platensis) to 26.65%/30.69% (L. japonica) of total FAMEs. However, the results of oleic acid C18:1(n-9) determined in almost all samples differed from the values reported in literature (e.g., oleic acid in Spirulina sp., S. platensis, and S. maxima in trace amounts [19] versus 10.1% in autotrophically cultivated S. platensis [17]).
The values (8.06%/11.00%) of oleic acid (C18:1) in C. pyrenoidosa also did not match the reported value (5%) in photoautotrophically cultivated C. pyrenoidosa [34], or even in a microalgal product of another genus, C. vulgaris (25.3%) [19].
Further, disagreement with published data concerning oleic acid in red seaweed products was established. The determined sums of oleic acid C18:1(n-9) in P. tenera (5.29%/6.74%) were lower compared to reported data for Porphyra sp. (7.16%–15.3% of total FAMEs expressed as a sum of C18:1 [15]; 6.70% of oleic acid C18:1(n-9) of total FAMEs [20]). However, a higher content (5.29%/6.74%) as the sum of oleic acids C18:1(n-9) was analyzed in the other red seaweed P. palmata contrary to the published value for Palmaria sp. (3.13%) [20].
In keeping with reports on brown seaweeds, MUFAs with higher numbers of carbons were identified as more abundant than in other algal species. The summed contents of oleic acid C18:1(n-9) in L. japonica gave the highest amount (26.65%/30.69%) of total FAMEs, unlike reported data (8.4%) [36]. In the two products from U. pinnatifida (W, WI), higher contents of oleic acid C18:1(n-9) (13.32%/9.35% in W; 11.91%/15.30% in WI) were determined than reported in published data (6.79%–10.2%) [20,35]. The same situation was observed in the last product from the brown seaweed H. fusiformis, where 10.00% and 11.28% were determined, contrary to a published 7.68% values for total FAMEs expressed as a sum of C18:1 [15].
Eicosenoic acid C20:1(n-9) was identified in the red seaweed P. tenera (3.98%), in three products from brown seaweeds (2.83% in L. japonica, 3.54% in E. bicyclis and 9.86% in H. fusiformis, all extracted with solvent I). These data differed from published values (1.42%, 1.52% in P. tenera [15]; 4.70% in Porphyra sp. [20]; 0.2%, 0.6% in P. palmata [20,35]; 1.55% in Laminaria sp.; 4.09% in H. fusiformis [15]). In solvent II extracts, eicosenoic acid C20:1(n-9) was only identified in products from brown seaweeds (2.11%–8.85%).

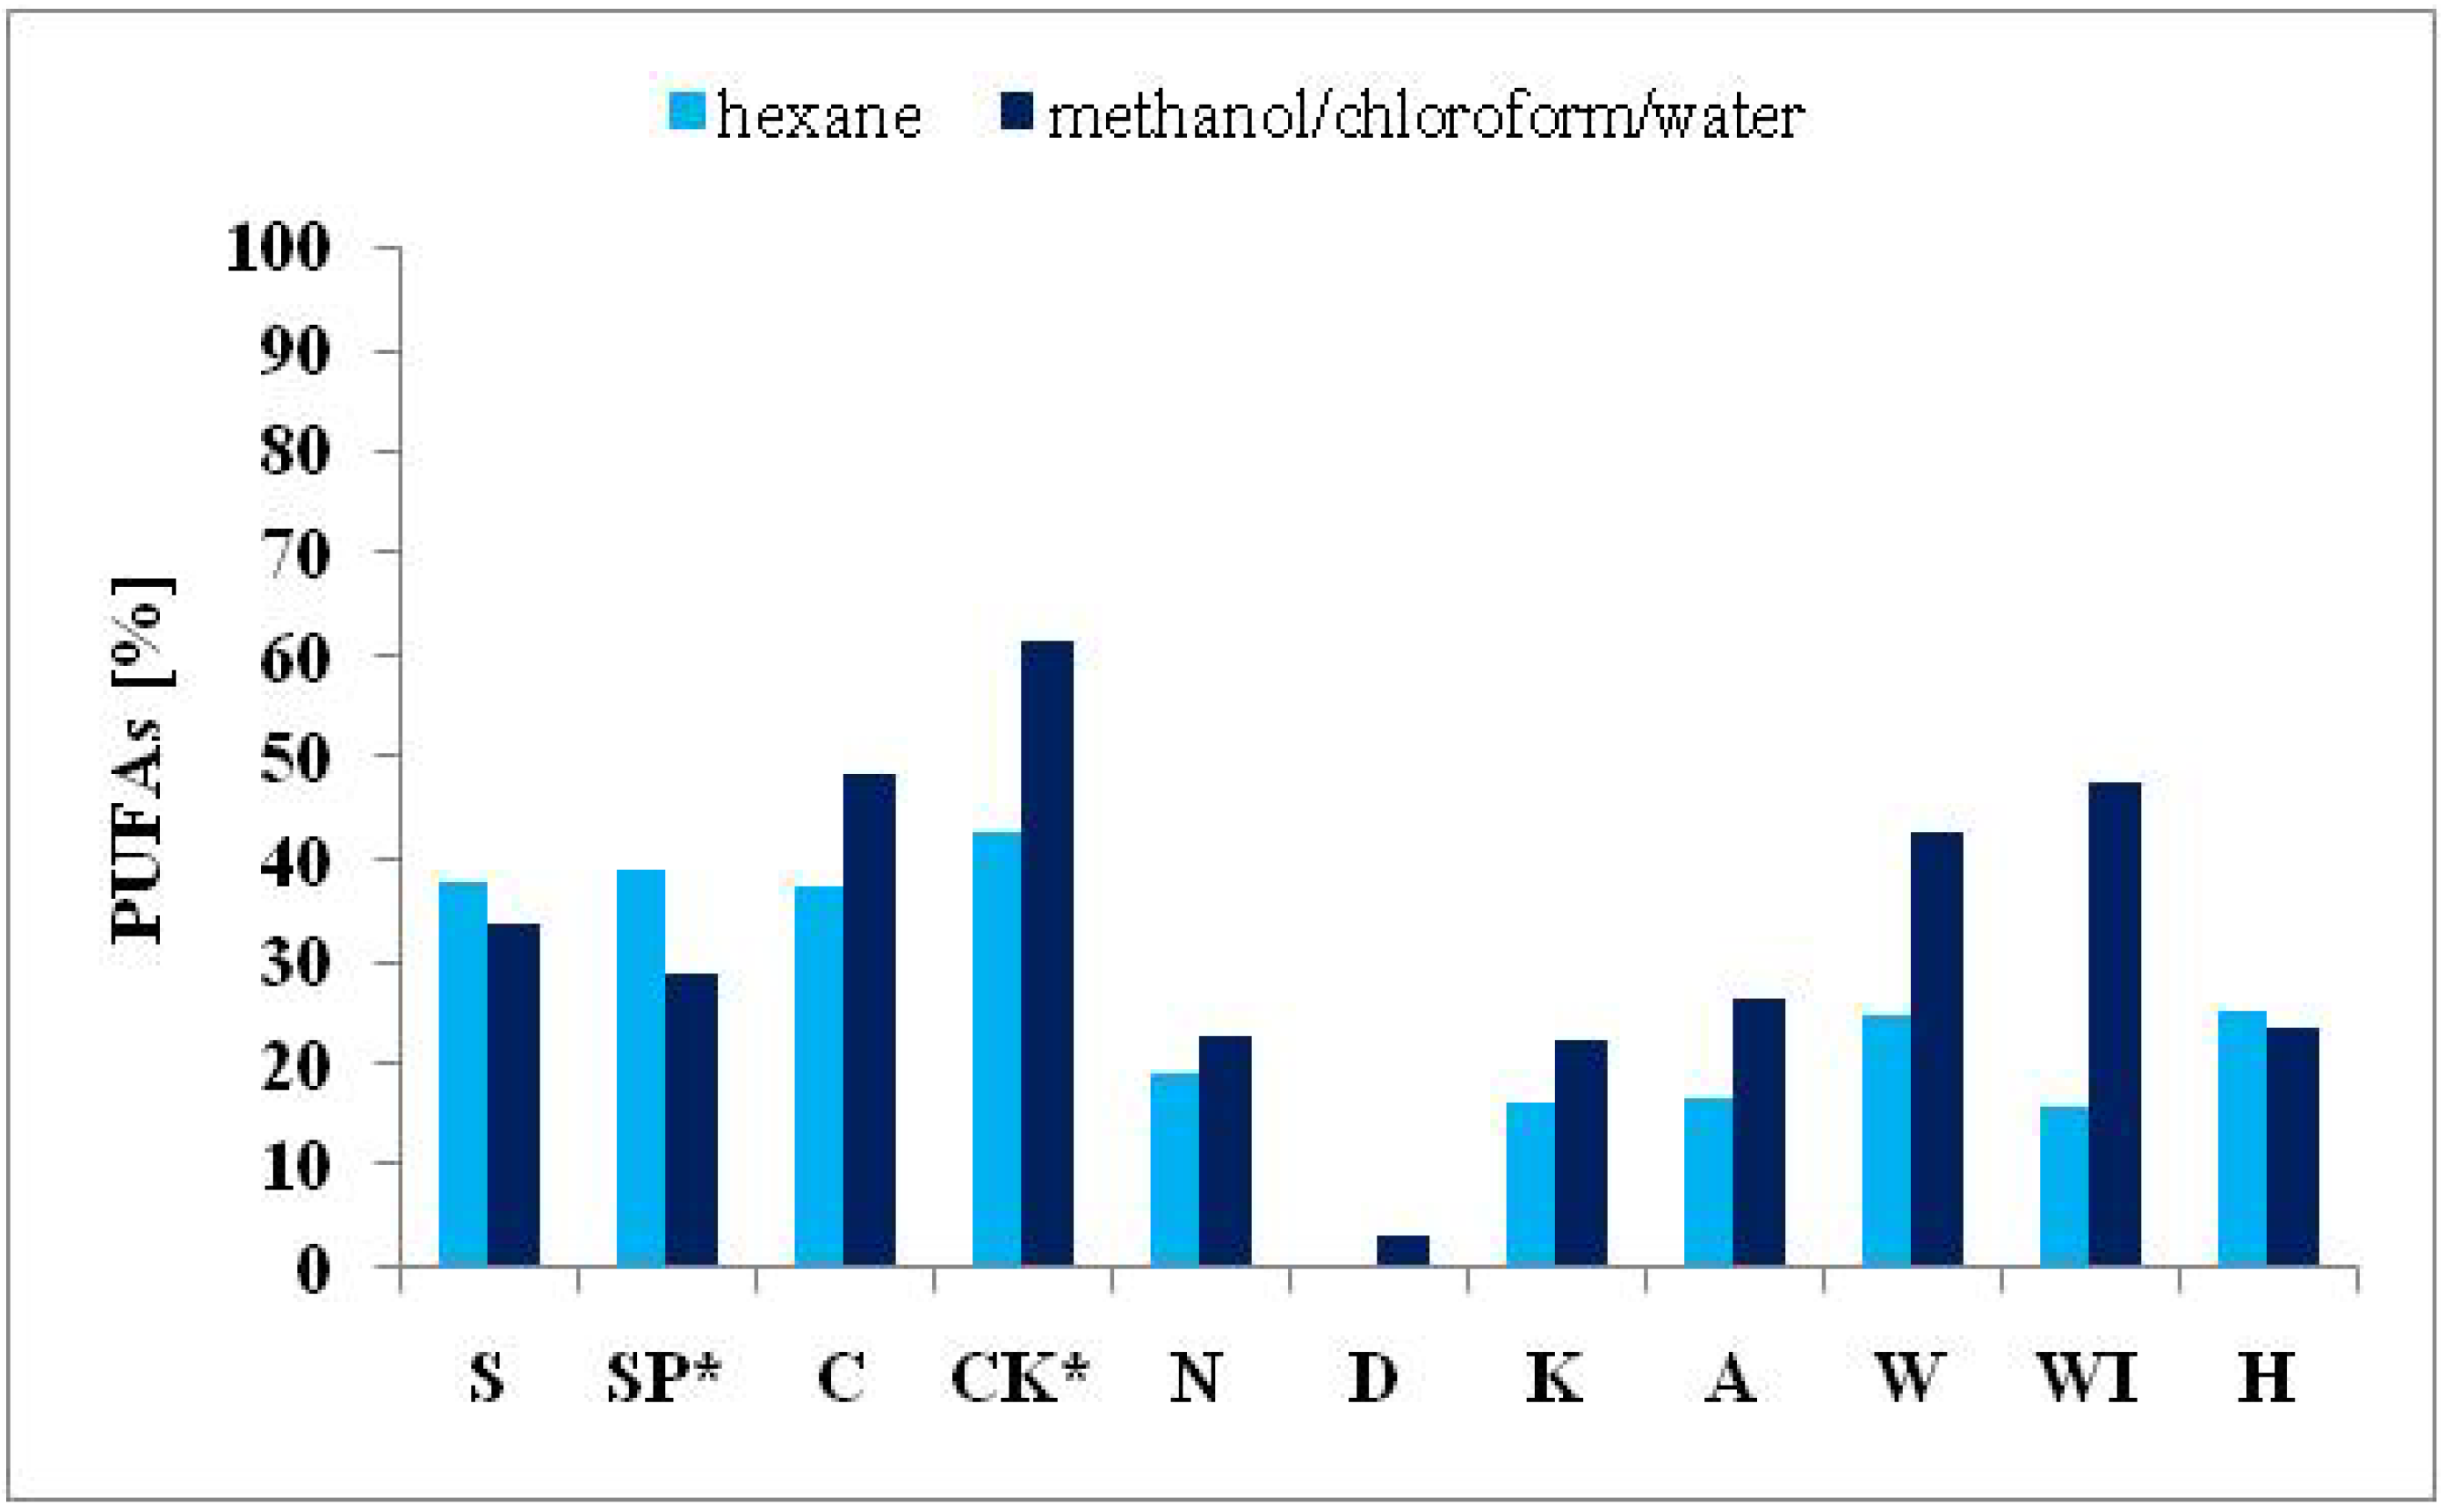
2.3.3. Polyunsaturated Fatty Acids

PUFA contents ranged from 3.04% (P. palmata) to 61.52% (cultivated C. kessleri) using solvent I, whereas solvent II extracts were in the range from 0.00% (P. palmata) to 42.70% (cultivated C. kessleri) of total FAMEs. The extraction of lipids by solvent II seemed to be insufficient for the isolation of PUFAs with higher carbon numbers, as they were not detected in most of the analyzed samples, except for C20:4(n-6) determined in the brown seaweed products.
Predominantly, PUFAs were the most abundant; namely linoleic acid C18:2(n-6) which varied from 0.71%/0.00% (P. palmata) to 36.38%/25.89% (cultivated C. kessleri) of total FAMEs; α-linolenic acid C18:3(n-3) which ranged from 0.00% (S. platensis, cultivated S. platensis, Eisenia bicyclis) to 21.29% (C. pyrenoidosa); γ-linolenic acid C18:3(n-6) in the range from 1.94% (L. japonica) to 17.36% (S. platensis) (all with solvent I) and in solvent II extracts from 0.00% (P. palmata, U. pinnatifida WI) to 23.98% (S. platensis). Finally, in three products from brown seaweeds: E. bicyclis, U. pinnatifida (W), and H. fusiformis, arachidonic acid C20:4(n-6) was the most represented PUFA (13.54%–15.37%, I; 0.85%–14.39%, II).
The content of linoleic acid (C18:2) in the analyzed S. platensis was approximately the same as reported for Spirulina sp., S. platensis and S. maxima (12.6%–21.7%) [19] and S. platensis (11.1%) [17]. However, C18:3(n-3) was not identified in the surveyed samples, compared to the published values of C18:3 in Spirulina sp., S. platensis, and S. maxima (5.9%–15.8%) [19] and in S. platensis (17.1%) [17].
According to Petkov and Garcia [34], linoleic acid (C18:2) was present in C. vulgaris in a higher amount (24.0%) than in the analyzed sample of Chlorella pyrenoidosa (18.79%, I), whilst the reported amount (18.0%) in photoautotrophically cultivated C. pyrenoidosa was half that in the analyzed sample of autotrophically cultivated C. kessleri (36.38%, I). On the other hand, an agreement with the C18:3(n-3, 6, 9) result, 27% was measured in a photoautotrophically cultivated C. pyrenoidosa [34] compared with the analyzed samples.
In the samples from red seaweeds, higher amounts of linoleic acid C18:2(n-6) were established in P. tenera than published for Porphyra sp. (1.17%–7.06%) [15,20]. Further, agreement with published C18:2(n-6) content (0.3%) in P. palmata was found [35].
The observed content of linoleic acid C18:2(n-6) in the product from the brown seaweed L. japonica was in agreement with data reported for the same species (8.4%) [36], while a lower amount (6.79%) of this PUFA was found in another genus, Laminaria ochroleuca [20]. A lower amount of linoleic acid C18:2(n-6) (6.23%) was reported for another brown U. pinnatifida seaweed [20] than determined in our analyzed samples from U. pinnatifida (W, WI). With respect to the presentation of other important PUFAs in the products from U. pinnatifida, similar results to those reported for α-linolenic acid C18:3(n-3) (5.8%–11.97%) [20,37], and for arachidonic acid C20:4(n-6) (12.7%–17.5%) [35,36] were found. Finally, in the product from H. fusiformis, agreement with the amount of arachidonic acid C20:4(n-6) with the published data (14.1%) was observed [19], while less content (5.30%) of this PUFA was reported by other authors [15].
Generally, α-linolenic (ALA) and linoleic acids (LA) are the primary precursors of ω-3 and ω-6 EFAs, respectively. Both are formed by the gradual desaturation of oleic acid in the endoplasmic reticulum and plantae chloroplasts. Importantly, humans cannot synthesize ALA due to the absence of the ∆12 and ∆15 desaturases required for the synthesis of ALA from stearic acid (18:0) or PUFAs with the first double bond on the C3 (ω-3) and C6 (ω-6) from the methyl-end. Thus, the level of these PUFAs in the human body depends on their intake from the diet [4]. Generally, ω-3 PUFAs play crucial roles in many biochemical pathways which results in various health benefits, especially cardioprotective effects that result from their considerable anthiatherogenic, antithrombotic, anti-inflammatory, antiarrhytmic, hypolipidemic effects, and other health benefits, based on the complex influence of the concentrations of lipoproteins, fluidity of biological membranes, function of membraned enzymes and receptors, modulation of eicosanoids production, blood pressure regulation, and finally on the metabolism of minerals [4,38,39,40,41,42].
Fish oil is considered as the main source of essential PUFAs. Nevertheless, fish also cannot synthesize these PUFAs because of the absence of crucial enzymes and the high level of essential PUFAs in fish oil is a direct consequence of the presence of marine microorganisms and algae in the fish trophic chain. The highest content of ω-3 FAs was determined in the green microalga C. pyrenoidosa (21.29%, I) and the highest content of ω-6 FAs was observed in the other cultivated freshwater green microalga C. kessleri sample (41.42%, I).

2.4. Fatty Acid Profiles of Autotrophically Cultivated Cyanobacteria and Microalga

Autotrophically cultivated S. platensis showed a similar FA composition to the cyanobacterial product of S. platensis, except for a slightly higher content of C16:0 and lower content of C18:3(n-6) in the cultivated alga. In contrast, the other autotrophically cultivated freshwater green alga C. kessleri showed a higher amount of PUFAs than the microalgal product of C. pyrenoidosa, the highest of all analyzed samples. The content of linoleic acid C18:2(n-6), which was the predominant PUFA in cultivated C. kessleri, exceeded the amount of this PUFA in product from C. pyrenoidosa by 51.6%.

2.5. PUFAs/SFAs Fatty Acids Ratio

The PUFAs/SFAs fatty acids ratio (hereinafter referred to as ratio) could be used for a rapid evaluation of FA profiles of analyzed samples; the higher value of this ratio means more health benefits. Ratio in the product from S. platensis (0.57/0.66) and in autotrophically cultivated S. platensis (0.46/0.74) are in accordance with the reported ratios in Spirulina sp., S. platensis, and S. maxima (0.25–0.75) [19] and in the cyanobacterium S. platensis (0.54) [17].
The determined ratios (1.30/0.80) of the C. pyrenoidosa product was slightly higher than reported (0.71) for the microalgal product from C. vulgaris [19]. On the other hand, the ratios (2.13/1.46) of autotrophically cultivated C. kessleri were fractionally lower than the ratio (2.83) of photoautotrophically cultivated C. pyrenoidosa [34].
In the red seaweed products of P. tenera (0.34/0.06) and P. palmata (0.04/0.07), the lowest ratios of all samples due were measured to the highest levels of SFAs. Several authors have also reported low ratios in different red seaweed species, such as Porphyra sp. (0.76, 1.25 [15]; 0.25 [20]) and P. palmata (0.0–0.48 [19,20]).
Established low values of ratios in the products from the brown seaweeds L. japonica (0.47/0.32), E. bicyclis (0.57/0.30), U. pinnatifida (W, 0.99/0.45; WI, 1.21/0.27), and H. fusiformis (0.49/0.51) agreed with a higher presence of SFAs in their lipids, except for the two products from U. pinnatifida (W, WI), where an equal or higher amount of PUFAs were determined in the extracts obtained with solvent I. Higher ratios for Laminaria sp. (0.96), U. pinnatifida (4.21) and H. fusiformis (2.02) [15] and similar ratio values in U. pinnatifida (1.10) and in H. fusiformis (0.5) [19] were previously published.
Based on the obtained results and data presented in literature [15,17,18,19,20], it is evident very significant differences exist within the FA profiles in the same species of algae and seaweeds depending on the used solvents and methods of analysis. Further, chemical composition of seaweed and microalgae is affected by many factors (species of seaweed, location and time of harvest, light intensity, water chemistry and the used part of plants); therefore, the results obtained from various analyses may differ [2,25].

3. Experimental

3.1. Samples and Chemicals

The study was conducted with eight representative species of dried cyanobacterial, microalgal and seaweed products purchased in a special local store in dried form; they were represented by green microalga (Chlorophyta), cyanobacteria (Cyanophyceae), brown seaweeds (Phaeophyta), red seaweeds (Rhodophyta), and two samples of autotrophically cultivated freshwater green microalga Chlorella kessleri (No. 260) and cyanobacterium Spirulina platensis (No. 27) obtained from the Culture Collection of Autotrophic Organisms, Institute of Botany, Academy of Sciences of the Czech Republic, Centre of Phycology (Trebon, Czech Republic). Both autotrophically cultivated species were harvested in exponential growth phase. Characteristics of all the samples are summarized in Table 4.
Table 4. Characteristics of cyanobacterial, microalgal and seaweed samples.
Algal groupAlgal speciesSampleProductCountryForm
GreenChlorella pyrenoidosaCChlorella TabsTaiwanpills
Chlorella kessleriCK *-Czech Republicdried alga
CyanobacteriaSpirulina platensisSSpirulina BioIndiapills
Spirulina platensisSP *-Czech Republicdried alga
RedPorphyra teneraNNori flakesJapandried seaweed
Palmaria palmataDDulse flakes BioUSAdried seaweed
BrownLaminaria japonicaKKombuJapandried seaweed
Eisenia bicyclisAArameJapandried seaweed
Undaria pinnatifidaWWakameJapandried seaweed
Undaria pinnatifidaWIWakame-instantJapandried seaweed
Hizikia fusiformisHHijikyJapandried seaweed
* samples cultivated autotrophically in a solar photobioreactor.
All product samples were pulverized with a mixer (Vorwerk Thermomix TM 31, Wuppertal, Germany) to obtain a homogenous powder with a particle size of 1 mm and they were stored in airtight plastic bags at room temperature (25 °C). Freshwater green microalga Chlorella kessleri and cyanobacterium Spirulina platensis were cultivated autotrophically in a solar photobioreactor as described in the study by Masojídek et al. [43]. For the cultivation of microalgae, BG11 culture medium was used [44]. After the cultivation, the algal biomass was lyophilized (Alpha 1-4 LSC, Christ, Osterode am Harz, Germany) and stored in airtight plastic bags at room temperature (25 °C). All used chemicals were of analytical grade and were purchased from Merck (Darmstadt, Germany), except for the standard mixture of 37 FAMEs (FAME Mix, Supelco, Bellefonte, PA, USA), and methyl undecanoate purchased from Sigma Aldrich Chemical Co. (St. Louis, MO, USA).

3.2. Total Lipids Determination

Total lipids of the analyzed samples were extracted using two different solvents. Either a mixture of methanol/chloroform/water (1:2:1, v/v/v) according to the modified method of [45] or n-hexane was used. Specifically, a portion (2 g) of every dried ground sample was weighed into an extraction thimble and subjected to a Soxhlet extraction for 4 h with 100 mL of the solvent mixture. Subsequently, the solvent was removed on a vacuum rotary evaporator (Laborota 4010 Digital, Heidolph, Schwabach, Germany) and the lipid extracts were dried at 105 °C for 2 h (Venticell 111 Komfort, BMT, Brno, Czech Republic). The amount of total lipid contents of all samples was determined gravimetrically [18].

3.3. GC Analysis of FAMEs

FAs were determined by gas chromatography (GC) of their methyl esters (FAMEs) in the lipid extracts obtained by above described method, excluding drying. Briefly, 0.5 M sodium hydroxide in methanol (4 mL) was added to the lipid extract (obtained from 2 g of sample) in a 250 mL flask. The flask was closed and heated for 30 min under nitrogen on a heating block (LTHS 250, Brnenska Druteva, Brno, Czech Republic). Then, freshly prepared 15% boron trifluoride in methanol (5 mL), was added to methylate the samples. After 2 min, heptane (5 mL) and sodium chloride (saturated solvent, 2 mL) were added and the sample was removed from the heating block. Next, heptane (15 mL) and sodium chloride (saturated solvent, 40 mL) were added to extract the FAMEs, the mixture was shaken and phases were separated and subsequently washed with sodium chloride (saturated solvent, 40 mL). The heptane phase was separated and anhydrous sodium sulfate was added. Quantitative determinations of FAMEs were conducted using a Shimadzu GC-2010 gas chromatograph (Shimadzu Corporation, Tokyo, Japan) equipped with a flame ionization detector (FID) and a HP-88 (Agilent Technologies, Englewood, CO, USA) capillary column (100 m × 0.25 mm, 88% cyanopropyl-arylpolysiloxane stationary phase with the thickness of 0.25 μm). The injection volume was 1.0 μL, the temperature of injection port was 250 °C with the split ratio of 1:100 and nitrogen was used as a carrier gas, temperature program was 80 °C/5 min, 200 °C/30 min, 250 °C/15 min. Identification of FAMEs was conducted by comparing their retention times with those of a 37 FAME reference standard. For quantification of FAMEs, methyl undecanoate was used as an internal standard. The FA results are expressed as a percentage of total FAMEs.

3.4. Statistics

The results of total lipids were expressed as means with standard deviations (SD) of each sample. Each sample was analyzed in triplicate (n = 3). Statistical differences among the samples were estimated by unpaired t-test and a probability value of p < 0.05 was considered to be statistically significant. Statistical analysis was performed using the StatPlus:mac LE Version 2009 software (AnalystSoft Inc., Atlanta, GA, USA). The analytical FA composition results are expressed as the average of six analyses (n = 6).

4. Conclusions

This study has examined nine commercially available edible cyanobacterial, microalgal and seaweed products and, moreover, autotrophically cultivated samples of the green microalga Chlorella kessleri and the cyanobacterium Spirulina platensis. Lipid content and FA profiles were determined using two different solvents, a mixture of methanol/chloroform/water (1:2:1, v/v/v, solvent I) and hexane (solvent II). In addition, yields of lipids and FA profiles after the extraction with different solvents were compared and, furthermore, comparison of data obtained from the determination of microalgal and cyanobacterial products and autotrophically cultivated microalga and cyanobacterium was accomplished.
Evidently, edible microalgal and cyanobacterial products contained a higher proportion of lipids than edible seaweed products using both solvent systems, and the highest lipid content was observed in autotrophically cultivated C. kessleri and S. platensis. From the lipid content point of view, the cultivated algae appear to be a better source of lipids than analyzed processed algal products.
The highest content of PUFAs, especially ω-3 FAs, was determined in the microalgal product of the green alga C. pyrenoidosa and two products of the brown seaweed U. pinnatifida (W, WI).
Even though fresh microalgae and unprocessed algae usually contain higher amounts of lipids, the dried edible microalgal product of C. pyrenoidosa examined in this work had a relatively high total lipid content and the highest level of PUFAs, especially ω-3 FAs. This investigation of edible cyanobacterial, microalgal and seaweed products and cultivated algae attested to the presence of health-promoting nutrients, such as PUFAs, especially essential ω-3 FAs, and this fact makes them a useful food supplement.

Acknowledgments

Jiri Sochor would like to express his thanks for CZ.1.07/2.3.00/30.0017 Postdocs in Biological Sciences at MENDELU support. This research was also supported by the internal grant of TBU in Zlin No. IGA/FT/2014/011. We gratefully acknowledge Jiri Masojidek and Magda Sergejevova from the Laboratory of Algal Biotechnology, Algatech Center, Institute of Microbiology, Academy of Science (Trebon, Czech Republic) for providing the samples of freshwater microalga and cyanobacterium.

Conflicts of Interest

The authors declare no conflict of interest.

References

  1. Cardoso, K.H.M.; Guaratini, T.; Barros, M.P.; Falcão, V.R.; Tonon, A.P.; Lopes, N.P.; Campos, S.; Torres, M.A.; Souza, A.O.; Colepicolo, P.; et al. Metabolites from algae with economical impact. Comp. Biochem. Physiol. C 2007, 146, 60–78. [Google Scholar] [CrossRef]
  2. Holdt, S.L.; Kraan, S. Bioactive compounds in seaweed: Functional food applications and legislation. J. Appl. Phycol. 2011, 23, 543–597. [Google Scholar] [CrossRef]
  3. Mišurcová, L. Chemical Composition of Seaweeds. In Handbook of Marine Macroalgae: Biotechnology and Applied Phycology; John Wiley & Sons: Chichester, UK, 2011; pp. 173–192. [Google Scholar]
  4. Mišurcová, L.; Ambrožová, L.; Samek, D. Seaweed lipids as nutraceuticals. Adv. Food Nutr. Res. 2011, 64, 339–355. [Google Scholar] [CrossRef]
  5. Mišurcová, L.; Machů, L.; Orsavová, J. Seaweed minerals as nutraceuticals. Adv. Food Nutr. Res. 2011, 64, 371–390. [Google Scholar] [CrossRef]
  6. Mišurcová, L.; Škrovánková, S.; Samek, D.; Ambrožová, J.; Machů, L. Health benefits of algal polysaccharides in human nutrition. HAdv. Food Nutr. Res. 2012, 66, 75–146. [Google Scholar] [CrossRef]
  7. Juríková, T.; Balla, S.; Sochor, J.; Pohanka, M.; Mlcek, J.; Baron, M. Flavonoid profile of saskatoon berries (Amelanchier alnifolia Nutt.) and their health promoting effects. Molecules 2013, 18, 12571–12586. [Google Scholar] [CrossRef]
  8. Rop, O.; Balík, J.; Řezníček, V.; Juríková, T.; Škardová, P.; Salaš, P.; Sochor, J.; Mlček, J.; Kramářová, D. Chemical characteristics of fruits of some selected quince (Cydonia oblonga Mill.) cultivars. Czech. J. Food Sci. 2011, 29, 65–73. [Google Scholar]
  9. Van, T.T.T.; Hieu, V.M.N.; Vi, T.N.H.; Ly, B.M.; Thuy, T.T.T. Antioxidant activities and total phenolic content of macroalgae from central coast of Vietnam. Asian J. Chem. 2013, 25, 6639–6642. [Google Scholar]
  10. Gamal, A.A.E. Biological importance of marine algae. Saudi Pharm. J. 2010, 18, 1–25. [Google Scholar]
  11. Gupta, S.; Abu-Ghannam, N. Bioactive potential and possible health effects of edible brown seaweeds. Trends Food Sci. Technol. 2011, 22, 315–326. [Google Scholar] [CrossRef]
  12. Kucekova, Z.; Mlcek, J.; Humpolicek, P.; Rop, O. Edible flowers—Antioxidant activity and impact on cell viability. Cent. Eur. J. Biol. 2013, 8, 1023–1031. [Google Scholar] [CrossRef]
  13. Mlcek, J.; Rop, O. Fresh edible flowers of ornamental plants—A new source of nutraceutical foods. Trends Food Sci. Technol. 2011, 22, 561–569. [Google Scholar] [CrossRef]
  14. Grofová, Z. Fatty acids. (In Czech)Med. Praxi 2010, 7, 388–390. [Google Scholar]
  15. Dawczynski, C.; Schubert, R.; Jahreis, G. Amino acids, fatty acids, and dietary fibre in edible seaweed products. Food Chem. 2007, 103, 891–899. [Google Scholar] [CrossRef]
  16. Polat, S.; Ozogul, Y. Seasonal proximate and fatty acid variations of some seaweeds from the northeastern Mediterranean coast. Oceanologia 2013, 55, 375–391. [Google Scholar] [CrossRef]
  17. Badzhanov, A.S.; Abdusamatova, N.; Yusupova, F.M.; Faizullaeva, N.; Mezhlumyan, L.G.; Malikova, M.K. Chemical composition of Spirulina platensis cultivated in Uzbekistan. Chem. Nat. Compd. 2004, 40, 276–279. [Google Scholar] [CrossRef]
  18. D’Oca, M.G.M.; Viegas, C.V.; Lemoes, J.S.; Miyasaki, E.K.; Morón-Villarreyes, J.A.; Primel, E.G.; Abreu, P.C. Production of FAMEs from several microalgal lipidic extracts and direct transesterification of the Chlorella pyrenoidosa. Biomass Bioenergy 2011, 35, 1533–1538. [Google Scholar] [CrossRef]
  19. Ortega-Calvo, J.J.; Mazuelos, C.; Hermosin, B.; Saiz-Jimenez, C. Chemical composition of Spirulina and eukaryotic algae food products marked in Spain. J. Appl. Phycol. 1993, 5, 425–435. [Google Scholar] [CrossRef]
  20. Sánchez-Machado, D.I.; Lopéz-Cervantes, J.; Lopéz-Hernandéz, J.; Paseiro-Losada, P. Fatty acids, total lipid, protein and ash contents of processed edible seaweeds. Food Chem. 2004, 85, 439–444. [Google Scholar] [CrossRef]
  21. Burtin, P. Nutritional value of seaweeds. Electron. J. Environ. Agric. Food Chem. 2003, 2, 498–503. [Google Scholar]
  22. Habib, M.A.B.; Parvin, M.; Huntington, T.C.; Hasan, M.R. A Review on Culture, Production and Use of Spirulina as Food for Humans and Feeds for Domestic Animals and Fish; FAO Fisheries and Aquaculture Circular: Rome, Italy, 2008; pp. 1–33. [Google Scholar]
  23. Simopoulos, A.P. The importance of the Omega-6/Omega-3 fatty acid ratio in cardiovascular disease and other chronic diseases. Exp. Biol. Med. 2008, 233, 674–688. [Google Scholar] [CrossRef]
  24. Žák, A.; Tvrzická, E.; Zeman, M.; Vecka, M. Pathophysiology of and clinical significance of polyunsaturated fatty acids n-3 family. (In Czech)Čas. Lék. Česk. 2005, 144, 6–18. [Google Scholar]
  25. McHugh, D.J. A Guide to the Seaweed Industry; Food and Agriculture Organization of the United Nations: Rome, Italy, 2003. [Google Scholar]
  26. Sanina, N.M.; Goncharova, S.N.; Kostetsky, E.Y. Seasonal changes of fatty acid composition and thermotropic behavior of polar lipids from marine macrophytes. Phytochemistry 2008, 69, 1517–1527. [Google Scholar] [CrossRef]
  27. Colla, L.M.; Bertolin, T.E.; Costa, J.A.V. Fatty acids profile of Spirulina platensis grown under different temperatures and nitrogen concentrations. Z. Naturforsch. C 2004, 59, 55–59. [Google Scholar]
  28. Mishra, V.K.; Temelli, F.; Ooraikul, B.; Shacklock, P.F.; Craigie, J.S. Lipids of the red alga, palmaria palmata. Bot. Mar. 1993, 36, 169–174. [Google Scholar]
  29. Khotimchenko, S.V.; Kulikova, I.V. Lipids of different parts of the lamina of Laminaria japonica Aresch. Bot. Mar. 2000, 43, 87–91. [Google Scholar]
  30. Erickson, M.C. Lipid extraction from channel catfish muscle: Comparison of solvent systems. J. Food Sci. 1993, 58, 84–89. [Google Scholar] [CrossRef]
  31. Hernández-Carmona, G.; Carrillo-Domínguez, S.; Arvizu-Higuera, D.L.; Rodríguez-Montesinos, Y.E.; Murillo-Álvarez, J.I.; Muñoz-Ochoa, M.; Castillo-Domínguez, R.M. Monthly variation in the chemical composition of Eisenia arborea J.E. Areschoug. J. Appl. Phycol. 2009, 21, 607–616. [Google Scholar] [CrossRef]
  32. Nelson, M.M.; Phleger, C.F.; Nichols, P.D. Seasonal lipid composition in macroalgae of the northeastern Pacific Ocean. Bot. Mar. 2002, 45, 58–65. [Google Scholar]
  33. Gressler, V.; Yokoya, N.S.; Fujii, M.T.; Colepico, P.; Filho, J.H.; Torres, R.P.; Pinto, E. Lipid, fatty acid, protein, amino acid and ash contents in four Brazilian red algae species. Food Chem. 2010, 120, 585–590. [Google Scholar] [CrossRef]
  34. Petkov, G.; Garcia, G. Which are fatty acids of the green alga Chlorella? Biochem. Syst. Ecol. 2007, 35, 281–285. [Google Scholar] [CrossRef]
  35. Fleurence, J.; Gutbier, G.; Mabeau, S.; Leray, C. Fatty acids from 11 marine macroalgae of the French Brittany coast. J. Appl. Phycol. 1994, 6, 527–532. [Google Scholar] [CrossRef]
  36. Khotimchenko, S.V. Fatty acids of brown algae from the Russian Far East. Phytochemistry 1998, 49, 2363–2369. [Google Scholar] [CrossRef]
  37. Li, X.; Fan, X.; Han, L.; Lou, Q. Fatty acids of some algae from Bohai Sea. Phytochemistry 2002, 59, 157–161. [Google Scholar] [CrossRef]
  38. Tvrzická, E.; Staňková, B.; Vecka, M.; Žák, A. Fatty acids 1. Occurrence and biological significance. (In Czech)Čas. Lék Čes. 2009, 148, 16–24. [Google Scholar]
  39. Flachs, P.; Horakova, O.; Brauner, P.; Rossmeisl, M.; Pecina, P.; Franssen-van Hal, N.; Ruzickova, J.; Sponarova, J.; Drahota, Z.; Vlcek, C.; et al. Polyunsaturated fatty acids of marine origin upregulate mitochondrial biogenesis and induce β-oxidation in white fat. Diabetologia 2005, 48, 2365–2375. [Google Scholar] [CrossRef]
  40. Kinsella, J.E.; Lokesh, B.; Stone, R.A. Dietary n-3 polyunsaturated fatty acids and amelioration of cardiovascular disease: Possible mechanisms. Am. J. Clin. Nutr. 1990, 52, 1–28. [Google Scholar]
  41. Weiss, L.A.; Barrett-Connor, E.; von Mühlen, D. Ratio of n-6 to n-3 fatty acids and bone mineral density in older adults: The Rancho Bernardo Study. Am. J. Clin. Nutr. 2005, 81, 934–938. [Google Scholar]
  42. Hu, F.B.; Manson, J.A.E.; Willett, W.C. Types of dietary fat and risk of coronary heart disease: A critical review. J. Am. Coll. Nutr. 2001, 20, 5–19. [Google Scholar] [CrossRef]
  43. Masojídek, J.; Sergejevová, M.; Rottnerová, K.; Jirka, V.; Korečko, J.; Kopecký, J.; Zaťková, I.; Torzillo, G.; Štys, D. A two-stage solar photobioreactor for cultivation of microalgae based on solar concentrators. J. Appl. Phycol. 2009, 21, 55–63. [Google Scholar] [CrossRef]
  44. Stanier, R.Y.; Kunisawa, R.; Mandel, M.; Cohen-Baziere, G. Purification and properties of unicellular blue-green algae (order Chroococcales). Bacteriol. Rev. 1971, 35, 171–205. [Google Scholar]
  45. Folch, J.; Lees, M.; Sloane Stanley, G.H. A simple method for the isolation and purification of total lipides from animal tissues. J. Biol. Chem. 1957, 226, 497–509. [Google Scholar]
  • Sample Availability: All samples are available from the authors.

