2.2. Method Validation
The validation and verification of the UFLC method was carried out according to international guidelines for validation of the Food and Drug Administration (FDA) and National Association of Testing Authorities (NATA):
Linearity The linearity was found to be in the range of 0.05 to 0.50 µg/g for both compounds
. Standard solutions were prepared from a stock solution of capsaicin and dihydrocapsaicin using six serial dilutions at 0.50, 0.40, 0.30, 0.20, 0.10 and 0.5 µg/g (acceptable by NATA). Each solution was injected three times and the average values of the triplicate analysis were presented in
Table 1. The standard solutions were run on the ultra high performance liquid chromatography and the standard curves were generated by plotting peak area against concentration. The external calibration curves (
Supplementary Data) were found at r
2 = 0.9999 for capsaicin and r
2 = 0.9996 for dihydrocapsaicin. The values of r
2 were highly significant confirming the good linearity of the method. The regression line equations were:
Table 1.
Calibration data of the UFLC method for the determination of capsaicinoids (µg/g).
Table 1.
Calibration data of the UFLC method for the determination of capsaicinoids (µg/g).
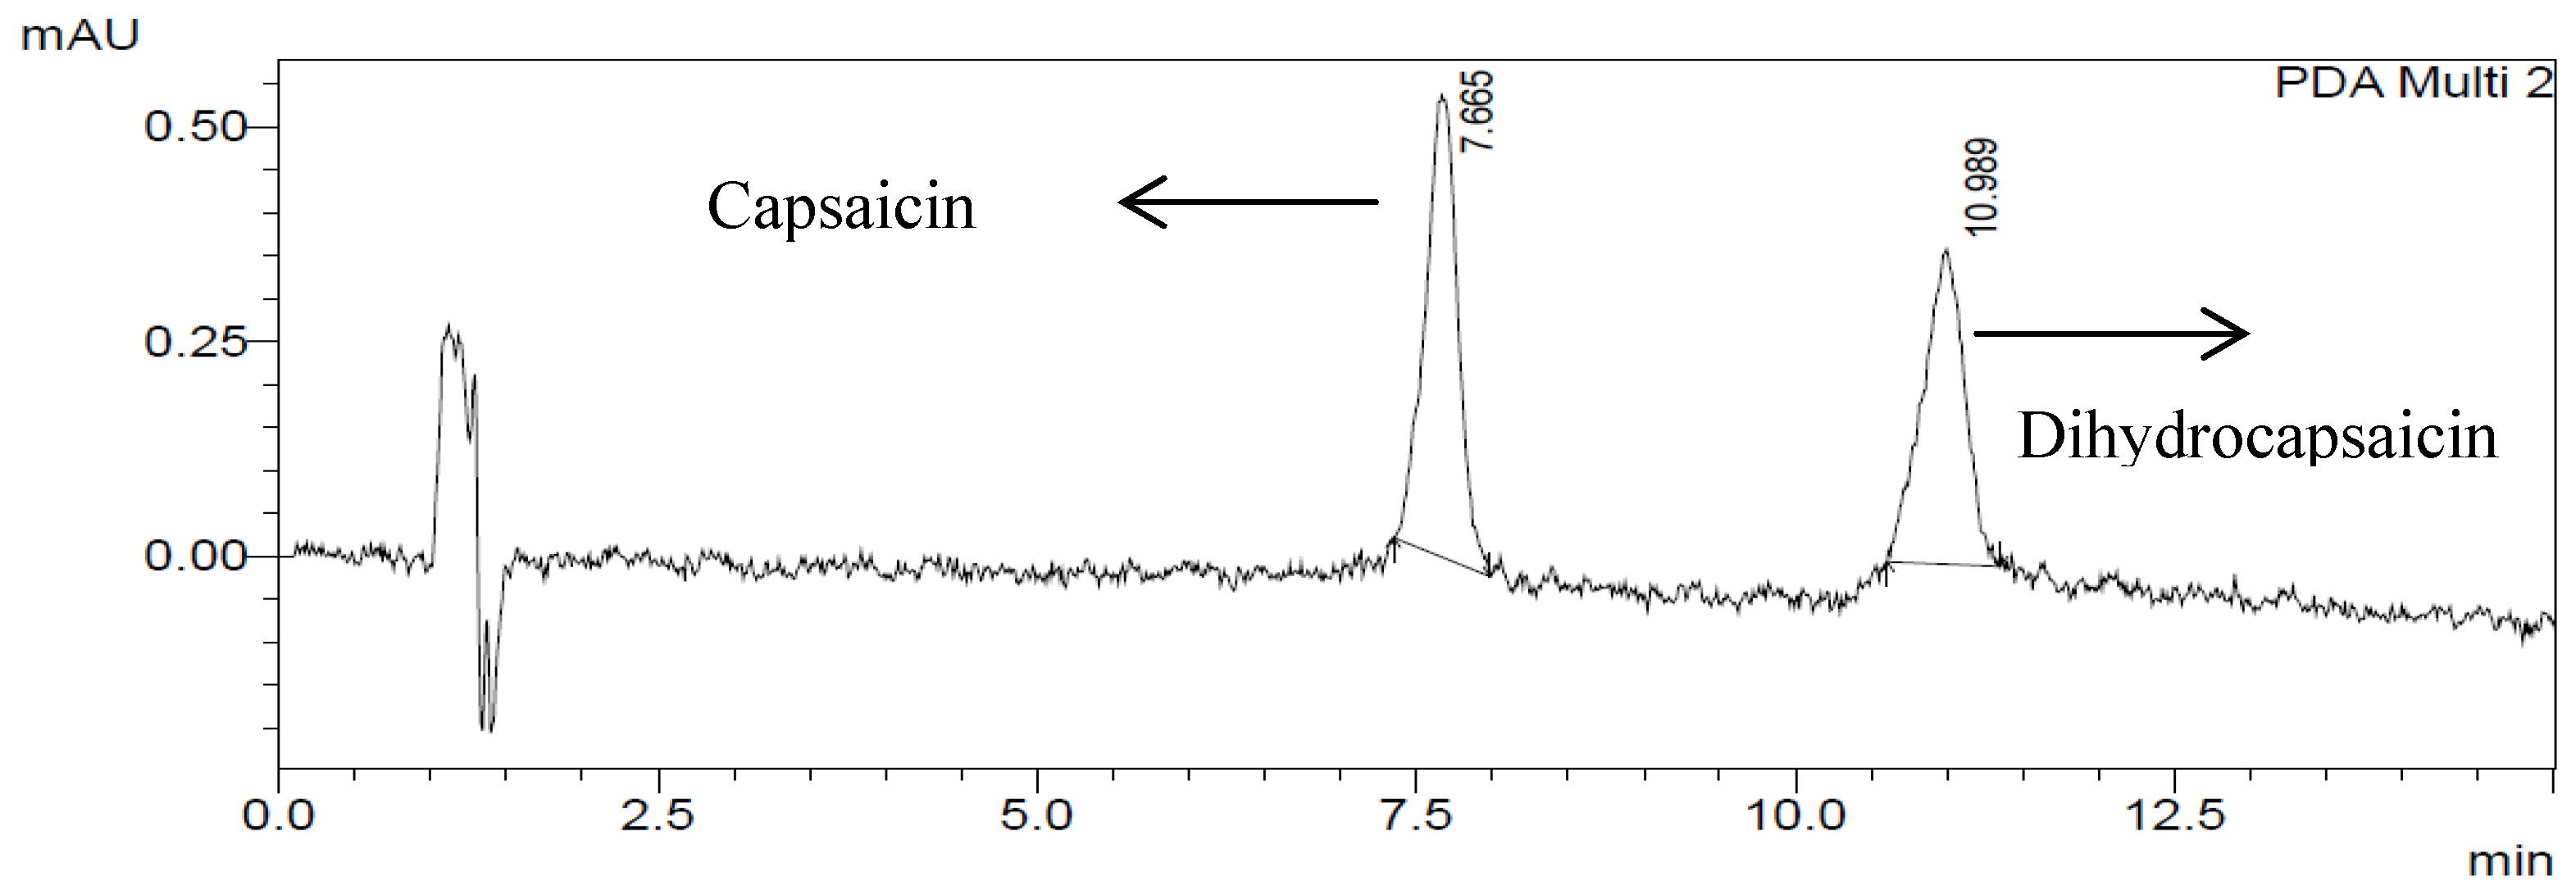
| Capsaicinoids | Linear Range | R2 | Ret. Time | Average Peak Area | SD | % RSD |
|---|
| Capsaicin | 0.05–0.50 | 0.9999 | 7.665 | 4947.1 | 27.7 | 0.56 |
| Dihydrocapsaicin | 0.05–0.50 | 0.9996 | 10.989 | 4229.6 | 58.1 | 1.37 |
The y-intercept means that when the concentration (x) = 0, then the peak areas of capsaicin and dihydrocapsaicin would be 189 and 149, respectively. The lowest measured values in this investigation for capsaicin and dihydrocapsaicin were 1,106 and 949 respectively, which are already five times the y-intercepts. This showed that all other values would be reliable. However, in this context, y-intercepts are not relevant, since at 0 µg/g of capsaicins and dihydrocapsaicins no peak area would be detected.
To check for the significant intercepts, we calculated percentage of y-intercept by dividing its value by the response of the 100% concentration response, multiplied by 100. We obtained values within ±2.0% both for capsaicin and dihydrocapsaicin, which are associated to the correlation coefficient which were more or equal to 0.999; we therefore considered that the standard curves are linear. For capsaicin, 100% concentration response was 9,392 (y-intercept 2.0%) and for dihydrocapsaicin it was 8,097 (y-intercept 1.8%). These limits are acceptable by the international guidelines for validation of the FDA.
Expected and actual concentration responses were plotted against expected concentrations (0.5, 0.25, 0.125 and 0.0625 µg/g) using four dilution factors (0, 2, 4 and 8). They both gave an equation (y = bx). The expected stock dilutions are more concentrated than the actual concentration dilutions which indicated that the dilutions are the concentrations expected (see
Supplementary Data).
Limit of Detection (LOD) and Limit of Quantitation (LOQ) The method was validated by evaluating limit of detection (LOD) and limit of quantitation (LOQ) for both capsaicinoids. LOD and LOQ were estimated at an SD/b ratio of 3 and 10, where SD and b stand for the standard deviation of the slope and intercept of the regression line, respectively. The limit of detection (LOD) was 0.045 µg/kg and 0.151 µg/kg for capsaicin and dihydrocapsaicin, respectively. The limit of quantitation (LOQ) was 0.110 µg/kg and 0.368 µg/kg for capsaicin and dihydrocapsaicin, respectively.
Reproducibility An inter-day reproducibility (
n = 30; acceptable by FDA and NATA) test was performed on capsaicin and dihydrocapsaicin for the UFLC method using four different chili pepper genotypes. The average relative standard deviations of the 30 replicate analysis of the inter-day reproducibility were represented in
Table 2. This showed that the UFLC method is highly reproducible.
Repeatability An intra-day repeatability (
n = 30) test was performed on capsaicin and dihydrocapsaicin for the UFLC method using four different chili pepper genotypes. The average relative standard deviations of the 30 replicate analysis of the intra-day repeatability were represented in
Table 3. The result shows that the method is highly repeatable.
Table 2.
Inter-day reproducibility data of the UFLC method for the determination of capsaicinoids in pepper (µg/kg).
Table 2.
Inter-day reproducibility data of the UFLC method for the determination of capsaicinoids in pepper (µg/kg).
| AVPP0705 | AVPP0002 | AVPP0805 | C05573 |
|---|
| No. Sample | Cap | Dihy | Cap | Dihy | Cap | Dihy | Cap | Dihy |
|---|
| 1 | 1908 (1) | 711 | 768 | 486 | 492 | 420 | 476 | 358 |
| 2 | 1868 | 690 | 811 | 485 | 502 | 433 | 466 | 360 |
| 3 | 1798 | 750 | 798 | 501 | 472 | 390 | 456 | 371 |
| 4 | 1867 | 701 | 779 | 499 | 501 | 387 | 500 | 350 |
| 5 | 1902 | 699 | 700 | 512 | 512 | 417 | 467 | 351 |
| 6 | 1998 | 680 | 801 | 501 | 511 | 401 | 480 | 354 |
| 7 | 1798 | 712 | 822 | 512 | 499 | 413 | 456 | 348 |
| 8 | 1811 | 718 | 783 | 493 | 518 | 429 | 489 | 359 |
| 9 | 1798 | 675 | 814 | 524 | 522 | 410 | 480 | 366 |
| 10 | 1928 | 700 | 780 | 505 | 498 | 386 | 457 | 379 |
| 11 | 1788 | 690 | 764 | 516 | 519 | 427 | 470 | 367 |
| 12 | 1901 | 721 | 817 | 507 | 510 | 388 | 469 | 346 |
| 13 | 1691 | 710 | 818 | 498 | 486 | 427 | 498 | 379 |
| 14 | 1800 | 724 | 808 | 509 | 532 | 430 | 481 | 380 |
| 15 | 1860 | 691 | 802 | 481 | 520 | 379 | 465 | 356 |
| 16 | 2198 | 736 | 821 | 521 | 472 | 424 | 488 | 345 |
| 17 | 1998 | 722 | 729 | 462 | 494 | 378 | 487 | 361 |
| 18 | 1878 | 716 | 813 | 481 | 514 | 415 | 497 | 344 |
| 19 | 1754 | 702 | 794 | 474 | 512 | 411 | 476 | 368 |
| 20 | 1791 | 683 | 765 | 535 | 508 | 402 | 486 | 376 |
| 21 | 1802 | 724 | 816 | 506 | 519 | 378 | 472 | 358 |
| 22 | 1855 | 731 | 807 | 527 | 481 | 367 | 459 | 364 |
| 23 | 1868 | 734 | 818 | 508 | 496 | 432 | 469 | 361 |
| 24 | 1801 | 745 | 799 | 487 | 477 | 421 | 480 | 357 |
| 25 | 1831 | 728 | 840 | 520 | 462 | 389 | 490 | 383 |
| 26 | 1808 | 767 | 788 | 491 | 530 | 398 | 487 | 377 |
| 27 | 1798 | 771 | 801 | 522 | 505 | 435 | 477 | 354 |
| 28 | 1818 | 747 | 810 | 502 | 528 | 426 | 485 | 362 |
| 29 | 1899 | 789 | 824 | 524 | 497 | 419 | 491 | 391 |
| 30 | 1861 | 724 | 775 | 515 | 474 | 399 | 475 | 365 |
| Mean | 1855.44 | 719.71 | 795.50 | 503.47 | 502.10 | 407.70 | 477.63 | 363.00 |
| SD | 92.37 | 27.50 | 29.31 | 17.29 | 18.76 | 19.45 | 12.53 | 11.99 |
| RSD% | 4.98 | 3.82 | 3.68 | 3.43 | 3.74 | 4.77 | 2.62 | 3.30 |
Precision and accuracy Intra-day and inter-day precision data of the UFLC method were given in
Table 4, indicating that the relative standard deviations are better than 5.0% for capsaicin and 9.9% for dihydrocapsaicin. Recovery experiments were performed using the standard addition method in order to study the accuracy of the UFLC method. The recovery of the added standard to the assay samples was calculated according to [
26]:
where C
t is the total concentration of the analyte found, C
u is the concentration of the present analyte in the original AVPP0705, and C
a is the concentration of the pure analyte added to the original AVPP0705. The results were given in
Table 4. The average recoveries obtained were quantitative (89.4%–90.1% for capsaicin, 92.4%–95.2% for dihydrocapsaicin), indicating good accuracy of the UFLC method.
Table 3.
Intra-day repeatability data of the UFLC method for the determination of capsaicinoids inpepper (μg/kg).
Table 3.
Intra-day repeatability data of the UFLC method for the determination of capsaicinoids inpepper (μg/kg).
| AVPP0705 | AVPP0002 | AVPP0805 | C05573 |
|---|
| No. Sample | Cap | Dihy | Cap | Dihy | Cap | Dihy | Cap | Dihy |
|---|
| 1 | 1778 (1) | 794 | 677 | 411 | 481 | 389 | 386 | 288 |
| 2 | 1801 | 789 | 687 | 401 | 488 | 367 | 381 | 298 |
| 3 | 1798 | 777 | 666 | 409 | 498 | 380 | 388 | 290 |
| 4 | 1890 | 698 | 657 | 418 | 468 | 381 | 387 | 295 |
| 5 | 1870 | 650 | 689 | 399 | 470 | 385 | 370 | 280 |
| 6 | 1786 | 699 | 670 | 389 | 484 | 379 | 377 | 279 |
| 7 | 1832 | 730 | 697 | 388 | 479 | 370 | 376 | 281 |
| 8 | 1799 | 786 | 678 | 390 | 480 | 377 | 369 | 286 |
| 9 | 1875 | 756 | 680 | 400 | 485 | 384 | 380 | 291 |
| 10 | 1800 | 790 | 681 | 412 | 489 | 386 | 383 | 278 |
| 11 | 1776 | 769 | 699 | 408 | 500 | 378 | 379 | 299 |
| 12 | 1854 | 798 | 657 | 403 | 496 | 390 | 385 | 296 |
| 13 | 1831 | 766 | 673 | 398 | 477 | 391 | 397 | 285 |
| 14 | 1876 | 801 | 674 | 405 | 465 | 394 | 390 | 294 |
| 15 | 1894 | 799 | 660 | 410 | 478 | 387 | 389 | 284 |
| 16 | 1799 | 800 | 664 | 409 | 473 | 369 | 375 | 287 |
| 17 | 1876 | 811 | 675 | 420 | 476 | 388 | 367 | 287 |
| 18 | 1865 | 737 | 674 | 419 | 483 | 376 | 378 | 284 |
| 19 | 1745 | 788 | 679 | 396 | 454 | 395 | 394 | 280 |
| 20 | 1789 | 776 | 672 | 386 | 495 | 385 | 392 | 283 |
| 21 | 1699 | 781 | 669 | 397 | 475 | 380 | 386 | 278 |
| 22 | 1855 | 787 | 681 | 408 | 476 | 382 | 374 | 289 |
| 23 | 1866 | 780 | 679 | 415 | 476 | 375 | 384 | 300 |
| 24 | 1886 | 769 | 665 | 414 | 497 | 367 | 382 | 276 |
| 25 | 1876 | 770 | 671 | 402 | 469 | 366 | 372 | 288 |
| 26 | 1856 | 779 | 677 | 412 | 472 | 387 | 378 | 277 |
| 27 | 1767 | 784 | 686 | 397 | 486 | 386 | 379 | 286 |
| 28 | 1803 | 793 | 676 | 386 | 465 | 388 | 383 | 281 |
| 29 | 1896 | 764 | 654 | 399 | 490 | 374 | 371 | 284 |
| 30 | 1876 | 813 | 649 | 407 | 477 | 385 | 369 | 273 |
| Mean | 1830.5 | 771.13 | 673.9 | 403.6 | 480.1 | 381.4 | 380.7 | 285.9 |
| SD | 50.76 | 36.13 | 11.76 | 9.83 | 11.03 | 8.11 | 7.87 | 7.16 |
| RSD% | 2.77 | 4.69 | 1.75 | 2.44 | 2.30 | 2.13 | 2.07 | 2.50 |
Table 4.
Precision and accuracy data of the UFLC for the determination of capsaicinoids in AVPP0705.
Table 4.
Precision and accuracy data of the UFLC for the determination of capsaicinoids in AVPP0705.
| Component (1) | Spiked amount (µg/kg) | Intra-day (%) | Inter day (%) | Recovery (%) |
|---|
| Capsaicin | 1302 | 2.07 | 5.01 | 90.1 |
| 3009 | 4.81 | 3.27 | 89.4 |
| Dihydrocapsaicin | 807.6 | 5.81 | 9.89 | 95.2 |
| 3541 | 5.00 | 4.63 | 92.4 |
2.3. Analysis of Capsaicinoids in Samples
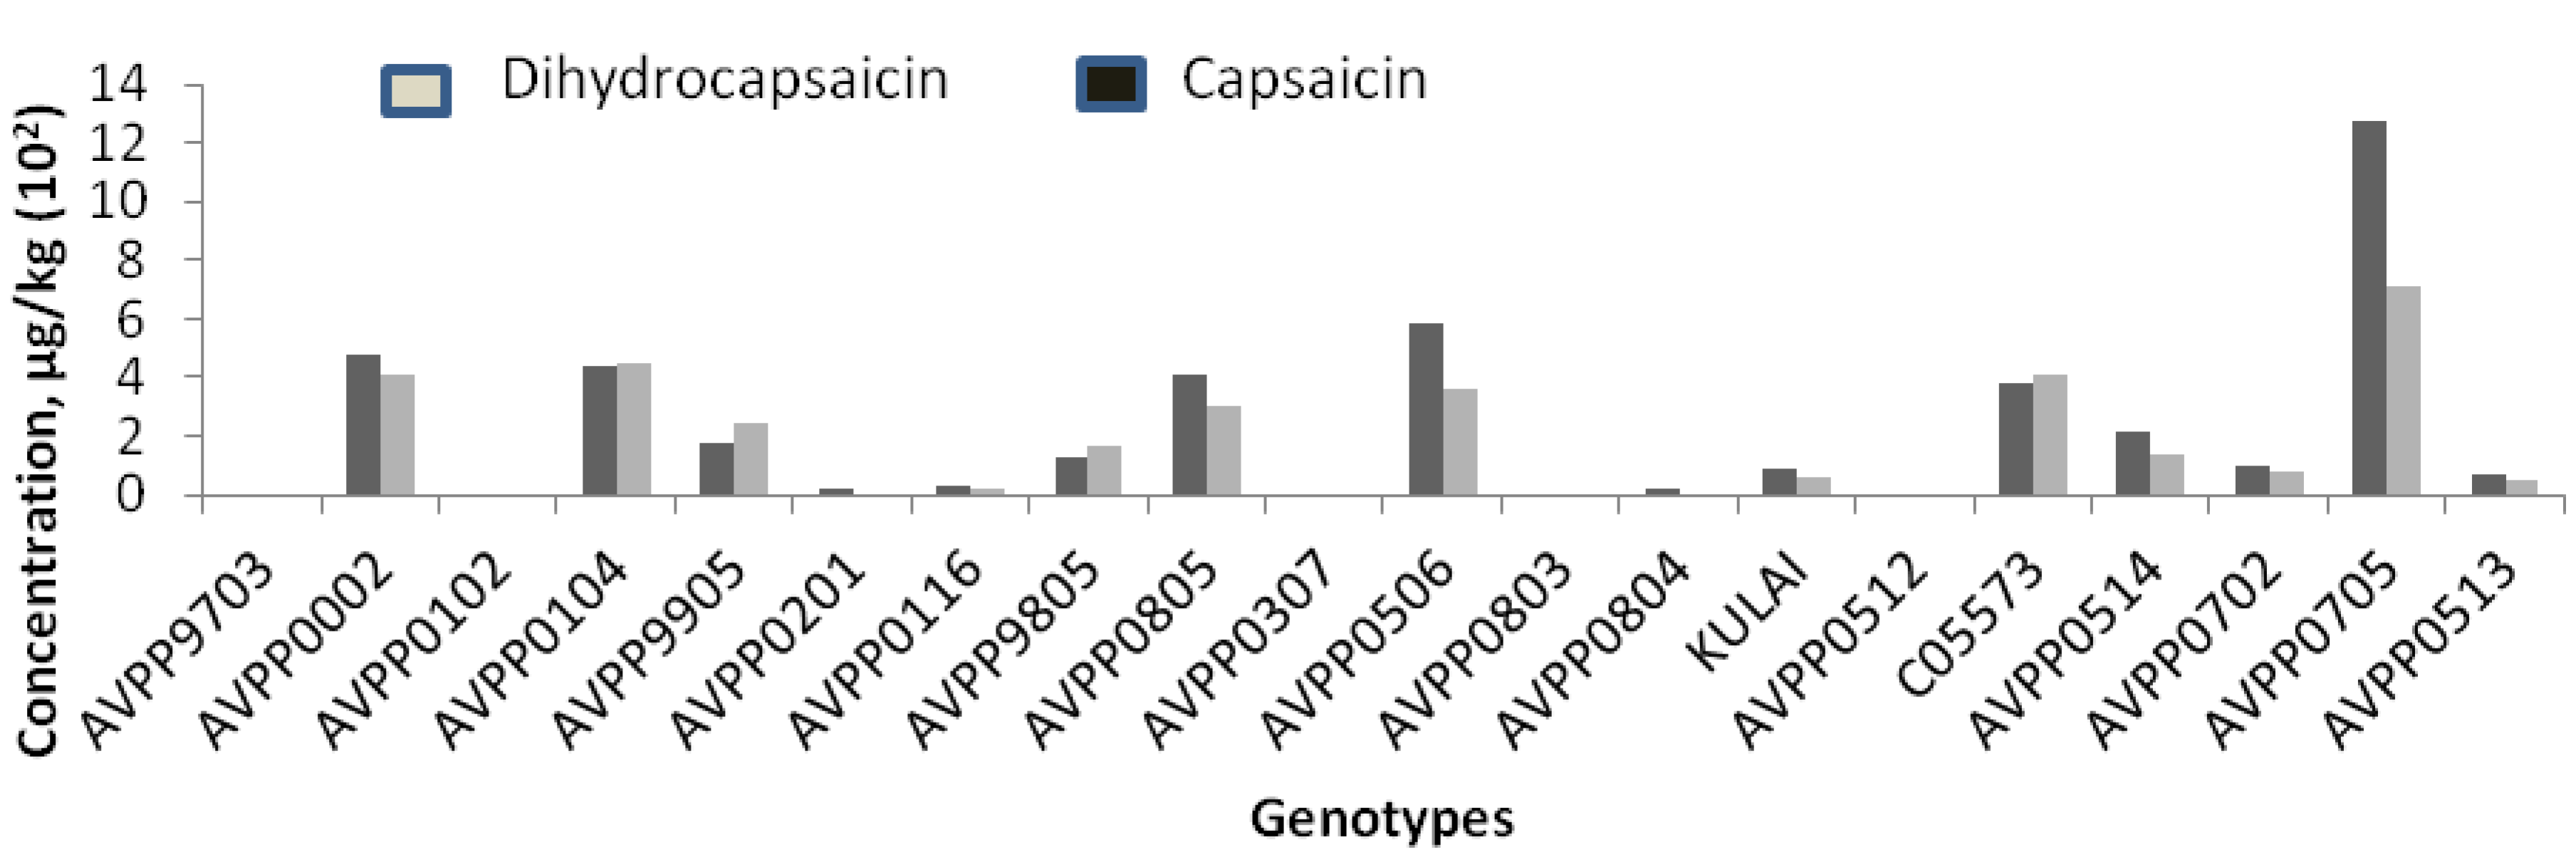
The high-speed analysis of the UFLC method was considered as providing good-efficiency analysis and to be environmentally friendly. The UFLC method was applied to determine the content of capsaicin and dihydrocapsaicin contents of twenty-one pepper genotypes and their corresponding pungency levels. The chromatograms attached (
supplementary data) correspond to an extracted solution of some genotypes. From the chromatograms obtained from the studied chili peppers, the main peaks of interest identified among the capsaicinoids were capsaicin and dihydrocapsaicin. The UV absorption spectra corresponding to capsaicin and dihydrocapsaicin peaks were obtained from the photo diode array detector (PDA). The ultraviolet detection wavelength was set at 280 nm for all the capsaicinoids, because it is the maximum absorbance for both capsaicinoids. The chromatogram showed a complete separation between the two elements (capsaicin and dihydrocapsaicin) and no interference with other capsaicinoid peaks. The capsaicinoid contents are calculated and presented in
Figure 3. The amount of capsaicin and dihydrocapsaicin from the chili pepper samples were found to differ significantly (
p > 0.05). It ranged from 0–13,076 µg/kg and 0–7,155 µg/kg for both capsaicin and dihydrocapsaicin, respectively, as shown in
Table 5. Genotype AVPP0705 was found to record the highest capsaicin content and was the highest in pungency which was significantly (
p > 0.05) higher than all the other samples tested. Genotypes AVPP9703, AVPP0512, AVPP0307, AVPP0803 and AVPP0102 were found to record no capsaicin and therefore be non-pungent. Similar variation in capsaicin content of different peppers has been previously reported [
27,
28,
29].
Figure 3.
Capsaicin and dihydrocapsaicin obtained using acetonitrile as extraction solvent.
Figure 3.
Capsaicin and dihydrocapsaicin obtained using acetonitrile as extraction solvent.
Table 5.
The capsaicinoids content of the twenty-one chilli pepper genotype samples (µg/kg).
Table 5.
The capsaicinoids content of the twenty-one chilli pepper genotype samples (µg/kg).
| Genotypes | Capsaicin | Dihydrocapsaicin | Total Capsaicinoids |
|---|
| AVPP0705 | 13076 | 7155 | 20231 |
| AVPP0506 | 5945 | 2999 | 8944 |
| AVPP0104 | 4283 | 4698 | 8981 |
| AVPP0002 | 4945 | 4346 | 9291 |
| C05573 | 2989 | 4280 | 7269 |
| AVPP0805 | 4230 | 3340 | 7570 |
| AVPP9905 | 2054 | 2218 | 4272 |
| AVPP0904 | 2012 | 1613 | 3625 |
| AVPP0514 | 2468 | 1470 | 3938 |
| AVPP9805 | 1248 | 1568 | 2816 |
| AVPP0702 | 1524 | 850 | 2374 |
| KULAI | 799 | 606 | 1405 |
| AVPP0513 | 892 | 553 | 1445 |
| AVPP0116 | 299 | 246 | 545 |
| AVPP0804 | 191 | ND | 191 |
| AVPP0201 | 186 | ND | 186 |
| AVPP9703 | ND | ND | ND |
| AVPP0512 | ND | ND | ND |
| AVPP0307 | ND | ND | ND |
| AVPP0803 | ND | ND | ND |
| AVPP0102 | ND | ND | ND |
For all the chili pepper samples, the correlation between Scoville heat unit (SHU) and the two capsaicinoids obtained was calculated as shown in
Table 5 and
Table 6 by using the relationship between this content (µg/kg) and its SHU rating of approximately 15 SHU equivalents to 10 µg/kg of capsaicinoids [
30]. Therefore, their corresponding SHU were found in the range of 0-237,245 SHU. From these results, it is indicated that capsaicin and dihydrocapsaicin were primarily responsible for the SHU rating. Thus, the chili sample AVPP0705 gave quite a high SHU related with its higher content of the capsaicinoids. Therefore, total yields of capsaicinoids in these chili peppers ranged from 0–20,231 µg/kg. In addition, capsaicin and dihydrocapsaicin have the same trend in contents of the capsaicinoids, and in particular capsaicin was found in higher contents than dihydrocapsaicin in all samples studied except C05573, AVPP9905 and AVPP9805. Genotypes were classified into five different classes viz: very highly pungent, highly pungent, moderately pungent, mildly pungent and non-pungent as shown in
Table 6. AVPP0705 recorded the highest while AVPP9703, AVPP0512, AVPP0307, AVPP0803 and AVPP0102 were recorded as non-pungent.
2.4. Percentage Capsaicin Content
The number of SHUs of the pepper in isolation is not the critical factor. The most important factor is the capsaicin content. All peppers used in this study, fall outside the pungency limit (0.5%–0.9%) presented by the BPC (British Pharmaceutical Codex) [
31] except AVPP0506, AVPP0104, AVPP0002, C05573 and AVPP0805 that fall within the pungency limit (
Table 6), hence could be recommended for oleoresin production, which is used in the formulation of certain pharmaceuticals. Despite the fact that AVPP0705 gave the highest capsaicin content, it would not be recommended for pharmaceutical Industry because the percentage capsaicin content is high (1.5%) as there have been no proof it is safe for human use [
32,
33]. Therefore, on the basis of capsaicin content, only AVPP0506, AVPP0104, AVPP0002, C05573 and AVPP0805 can serve as potential sources of capsaicin for use in the pharmaceutical industry.
Table 6.
The % capsaicin content, Scoville heat units, and degree of pungency of twenty-one chilli pepper genotype samples (dry weight).
Table 6.
The % capsaicin content, Scoville heat units, and degree of pungency of twenty-one chilli pepper genotype samples (dry weight).
| Genotypes | % Capsaicin Content | Scoville Heat Unit | Degree of Pungency |
|---|
| AVPP0705 | 1.49 | 237245 | very highly pungent |
| AVPP0506 | 0.66 | 104888 | very highly pungent |
| AVPP0104 | 0.69 | 110796 | very highly pungent |
| AVPP0002 | 0.65 | 104678 | very highly pungent |
| C05573 | 0.57 | 91097 | very highly pungent |
| AVPP0805 | 0.56 | 88906 | very highly pungent |
| AVPP9905 | 0.30 | 47946 | highly pungent |
| AVPP0904 | 0.30 | 47372 | highly pungent |
| AVPP0514 | 0.28 | 44259 | highly pungent |
| AVPP9805 | 0.22 | 35769 | highly pungent |
| AVPP0702 | 0.14 | 22146 | moderately pungent |
| KULAI | 0.13 | 20564 | moderately pungent |
| AVPP0513 | 0.13 | 20566 | moderately pungent |
| AVPP0116 | 0.04 | 7170 | moderately pungent |
| AVPP0804 | 0.02 | 2767 | mildly pungent |
| AVPP0201 | 0.02 | 3020 | mildly pungent |
| AVPP9703 | 0 | 0 | non-pungent |
| AVPP0512 | 0 | 0 | non-pungent |
| AVPP0307 | 0 | 0 | non-pungent |
| AVPP0803 | 0 | 0 | non-pungent |
| AVPP0102 | 0 | 0 | non-pungent |

 ,
, 


