Hologram QSAR Studies of Antiprotozoal Activities of Sesquiterpene Lactones


Abstract
:1. Introduction
2. Results and Discussion


| Tbr HQSAR models | ||||||
|---|---|---|---|---|---|---|
| Fdist | q2 | SEV | r2 | SEE | HL | PC |
| A/B/C | 0.637 | 0.576 | 0.822 | 0.404 | 53 | 4 |
| A/C/Ch | 0.619 | 0.591 | 0.823 | 0.403 | 83 | 4 |
| A/C/Ch/DA | 0.601 | 0.604 | 0.871 | 0.343 | 53 | 4 |
| A/C | 0.577 | 0.622 | 0.835 | 0.389 | 71 | 4 |
| A/B/C/Ch | 0.573 | 0.625 | 0.833 | 0.391 | 307 | 4 |
| Tcr HQSAR models | ||||||
| Fdist | q2 | SEV | r2 | SEE | HL | PC |
| A/C | 0.721 | 0.297 | 0.939 | 0.139 | 71 | 6 |
| A/B/C | 0.697 | 0.309 | 0.950 | 0.125 | 53 | 6 |
| A/B | 0.695 | 0.303 | 0.884 | 0.187 | 353 | 5 |
| A/B/C/DA | 0.694 | 0.304 | 0.922 | 0.153 | 71 | 5 |
| A/C/Ch | 0.667 | 0.317 | 0.919 | 0.156 | 151 | 5 |
| Ldon HQSAR models | ||||||
| Fdist | q2 | SEV | r2 | SEE | HL | PC |
| A/C/Ch/DA | 0.775 | 0.279 | 0.972 | 0.098 | 83 | 6 |
| A/C/DA | 0.768 | 0.283 | 0.959 | 0.119 | 61 | 6 |
| A/B | 0.731 | 0.289 | 0.920 | 0.158 | 71 | 4 |
| A/C | 0.727 | 0.292 | 0.892 | 0.183 | 61 | 4 |
| A/C/Ch | 0.707 | 0.319 | 0.970 | 0.103 | 199 | 6 |
| Pfc HQSAR models | ||||||
| Fdist | q2 | SEV | r2 | SEE | HL | PC |
| A/C | 0.703 | 0.254 | 0.950 | 0.104 | 83 | 6 |
| A/B/C | 0.684 | 0.262 | 0.951 | 0.104 | 307 | 6 |
| A/C/Ch | 0.682 | 0.263 | 0.948 | 0.106 | 61 | 6 |
| A/C/DA | 0.676 | 0.265 | 0.954 | 0.100 | 151 | 6 |
| A/B/C/DA | 0.668 | 0.253 | 0.888 | 0.147 | 151 | 4 |
| L6 HQSAR models | ||||||
| Fdist | q2 | SEV | r2 | SEE | HL | PC |
| A/C/Ch/DA | 0.647 | 0.343 | 0.893 | 0.189 | 61 | 5 |
| A/B/C/Ch | 0.646 | 0.351 | 0.907 | 0.180 | 61 | 6 |
| A/C | 0.636 | 0.348 | 0.852 | 0.222 | 257 | 5 |
| A/B/C/H | 0.633 | 0.357 | 0.912 | 0.175 | 353 | 6 |
| A/B/C | 0.629 | 0.351 | 0.862 | 0.215 | 353 | 5 |
| Tbr HQSAR models with Fdist = A/B/C | ||||||
|---|---|---|---|---|---|---|
| Fsize (atoms) | q2 | SEV | r2 | SEE | HL | PC |
| 1 to 4 | 0.407 | 0.736 | 0.708 | 0.517 | 97 | 4 |
| 2 to 5 | 0.547 | 0.644 | 0.761 | 0.467 | 83 | 4 |
| 3 to 6 | 0.546 | 0.644 | 0.808 | 0.419 | 97 | 4 |
| 4 to 7 | 0.637 | 0.576 | 0.822 | 0.404 | 53 | 4 |
| 5 to 8 | 0.588 | 0.614 | 0.833 | 0.391 | 307 | 4 |
| 6 to 9 | 0.565 | 0.631 | 0.817 | 0.409 | 53 | 4 |
| 7 to 10 | 0.519 | 0.663 | 0.826 | 0.398 | 61 | 4 |
| 8 to 11 | 0.480 | 0.690 | 0.819 | 0.406 | 151 | 4 |
| Tcr HQSAR models with Fdist = A/C | ||||||
| Fsize (atoms) | q2 | SEV | r2 | SEE | HL | PC |
| 1 to 4 | 0.330 | 0.440 | 0.640 | 0.322 | 53 | 4 |
| 2 to 5 | 0.518 | 0.381 | 0.825 | 0.230 | 53 | 5 |
| 4 to 7 | 0.721 | 0.297 | 0.939 | 0.139 | 71 | 6 |
| 3 to 6 | 0.637 | 0.339 | 0.934 | 0.145 | 199 | 6 |
| 5 to 8 | 0.741 | 0.280 | 0.948 | 0.126 | 151 | 5 |
| 6 to 9 | 0.729 | 0.286 | 0.953 | 0.120 | 151 | 5 |
| 7 to 10 | 0.748 | 0.282 | 0.965 | 0.106 | 151 | 6 |
| 8 to 11 | 0.689 | 0.299 | 0.923 | 0.149 | 353 | 4 |
| Ldon HQSAR models with Fdist = A/C/Ch/DA | ||||||
| Fsize (atoms) | q2 | SEV | r2 | SEE | HL | PC |
| 1 to 4 | 0.542 | 0.398 | 0.881 | 0.203 | 151 | 6 |
| 2 to 5 | 0.618 | 0.364 | 0.904 | 0.182 | 83 | 6 |
| 3 to 6 | 0.706 | 0.319 | 0.966 | 0.108 | 151 | 6 |
| 4 to 7 | 0.775 | 0.279 | 0.972 | 0.098 | 83 | 6 |
| 5 to 8 | 0.770 | 0.282 | 0.982 | 0.080 | 199 | 6 |
| 6 to 9 | 0.747 | 0.296 | 0.976 | 0.091 | 199 | 6 |
| 7 to 10 | 0.733 | 0.296 | 0.968 | 0.103 | 307 | 5 |
| 8 to 11 | 0.716 | 0.305 | 0.965 | 0.106 | 257 | 5 |
| Pfc HQSAR models Fdist = A/C | ||||||
| Fsize (atoms) | q2 | SEV | r2 | SEE | HL | PC |
| 1 to 4 | 0.458 | 0.333 | 0.809 | 0.197 | 59 | 5 |
| 2 to 5 | 0.615 | 0.280 | 0.875 | 0.160 | 61 | 5 |
| 3 to 6 | 0.730 | 0.242 | 0.944 | 0.110 | 71 | 6 |
| 4 to 7 | 0.703 | 0.254 | 0.950 | 0.104 | 83 | 6 |
| 5 to 8 | 0.706 | 0.253 | 0.961 | 0.092 | 307 | 6 |
| 6 to 9 | 0.683 | 0.262 | 0.965 | 0.087 | 353 | 6 |
| 7 to 10 | 0.736 | 0.232 | 0.960 | 0.090 | 97 | 5 |
| 8 to 11 | 0.732 | 0.241 | 0.982 | 0.063 | 353 | 6 |
| L6 HQSAR models Fdist = A/C/Ch/DA | ||||||
| Fsize (atoms) | q2 | SEV | r2 | SEE | HL | PC |
| 1 to 4 | 0.204 | 0.504 | 0.713 | 0.303 | 61 | 4 |
| 2 to 5 | 0.465 | 0.422 | 0.856 | 0.219 | 71 | 5 |
| 3 to 6 | 0.568 | 0.371 | 0.843 | 0.224 | 307 | 4 |
| 4 to 7 | 0.647 | 0.343 | 0.893 | 0.189 | 61 | 5 |
| 5 to 8 | 0.673 | 0.337 | 0.952 | 0.129 | 71 | 6 |
| 6 to 9 | 0.619 | 0.363 | 0.966 | 0.109 | 59 | 6 |
| 7 to 10 | 0.549 | 0.379 | 0.889 | 0.188 | 151 | 4 |
| 8 to 11 | 0.583 | 0.373 | 0.948 | 0.131 | 151 | 5 |

| HQSAR Models | |||||
|---|---|---|---|---|---|
| Tbr | Tcr | Ldon | Pfc | L6 | |
| Fdist | A/B/C | A/C | A/C/Ch/DA | A/C | A/C/Ch/DA |
| Fsize | 4–7 atoms | 7–10 atoms | 4–7 atoms | 7–10 atoms | 5–8 atoms |
| HL | 53 | 151 | 83 | 97 | 71 |
| PC | 4 | 6 | 5 | 5 | 6 |
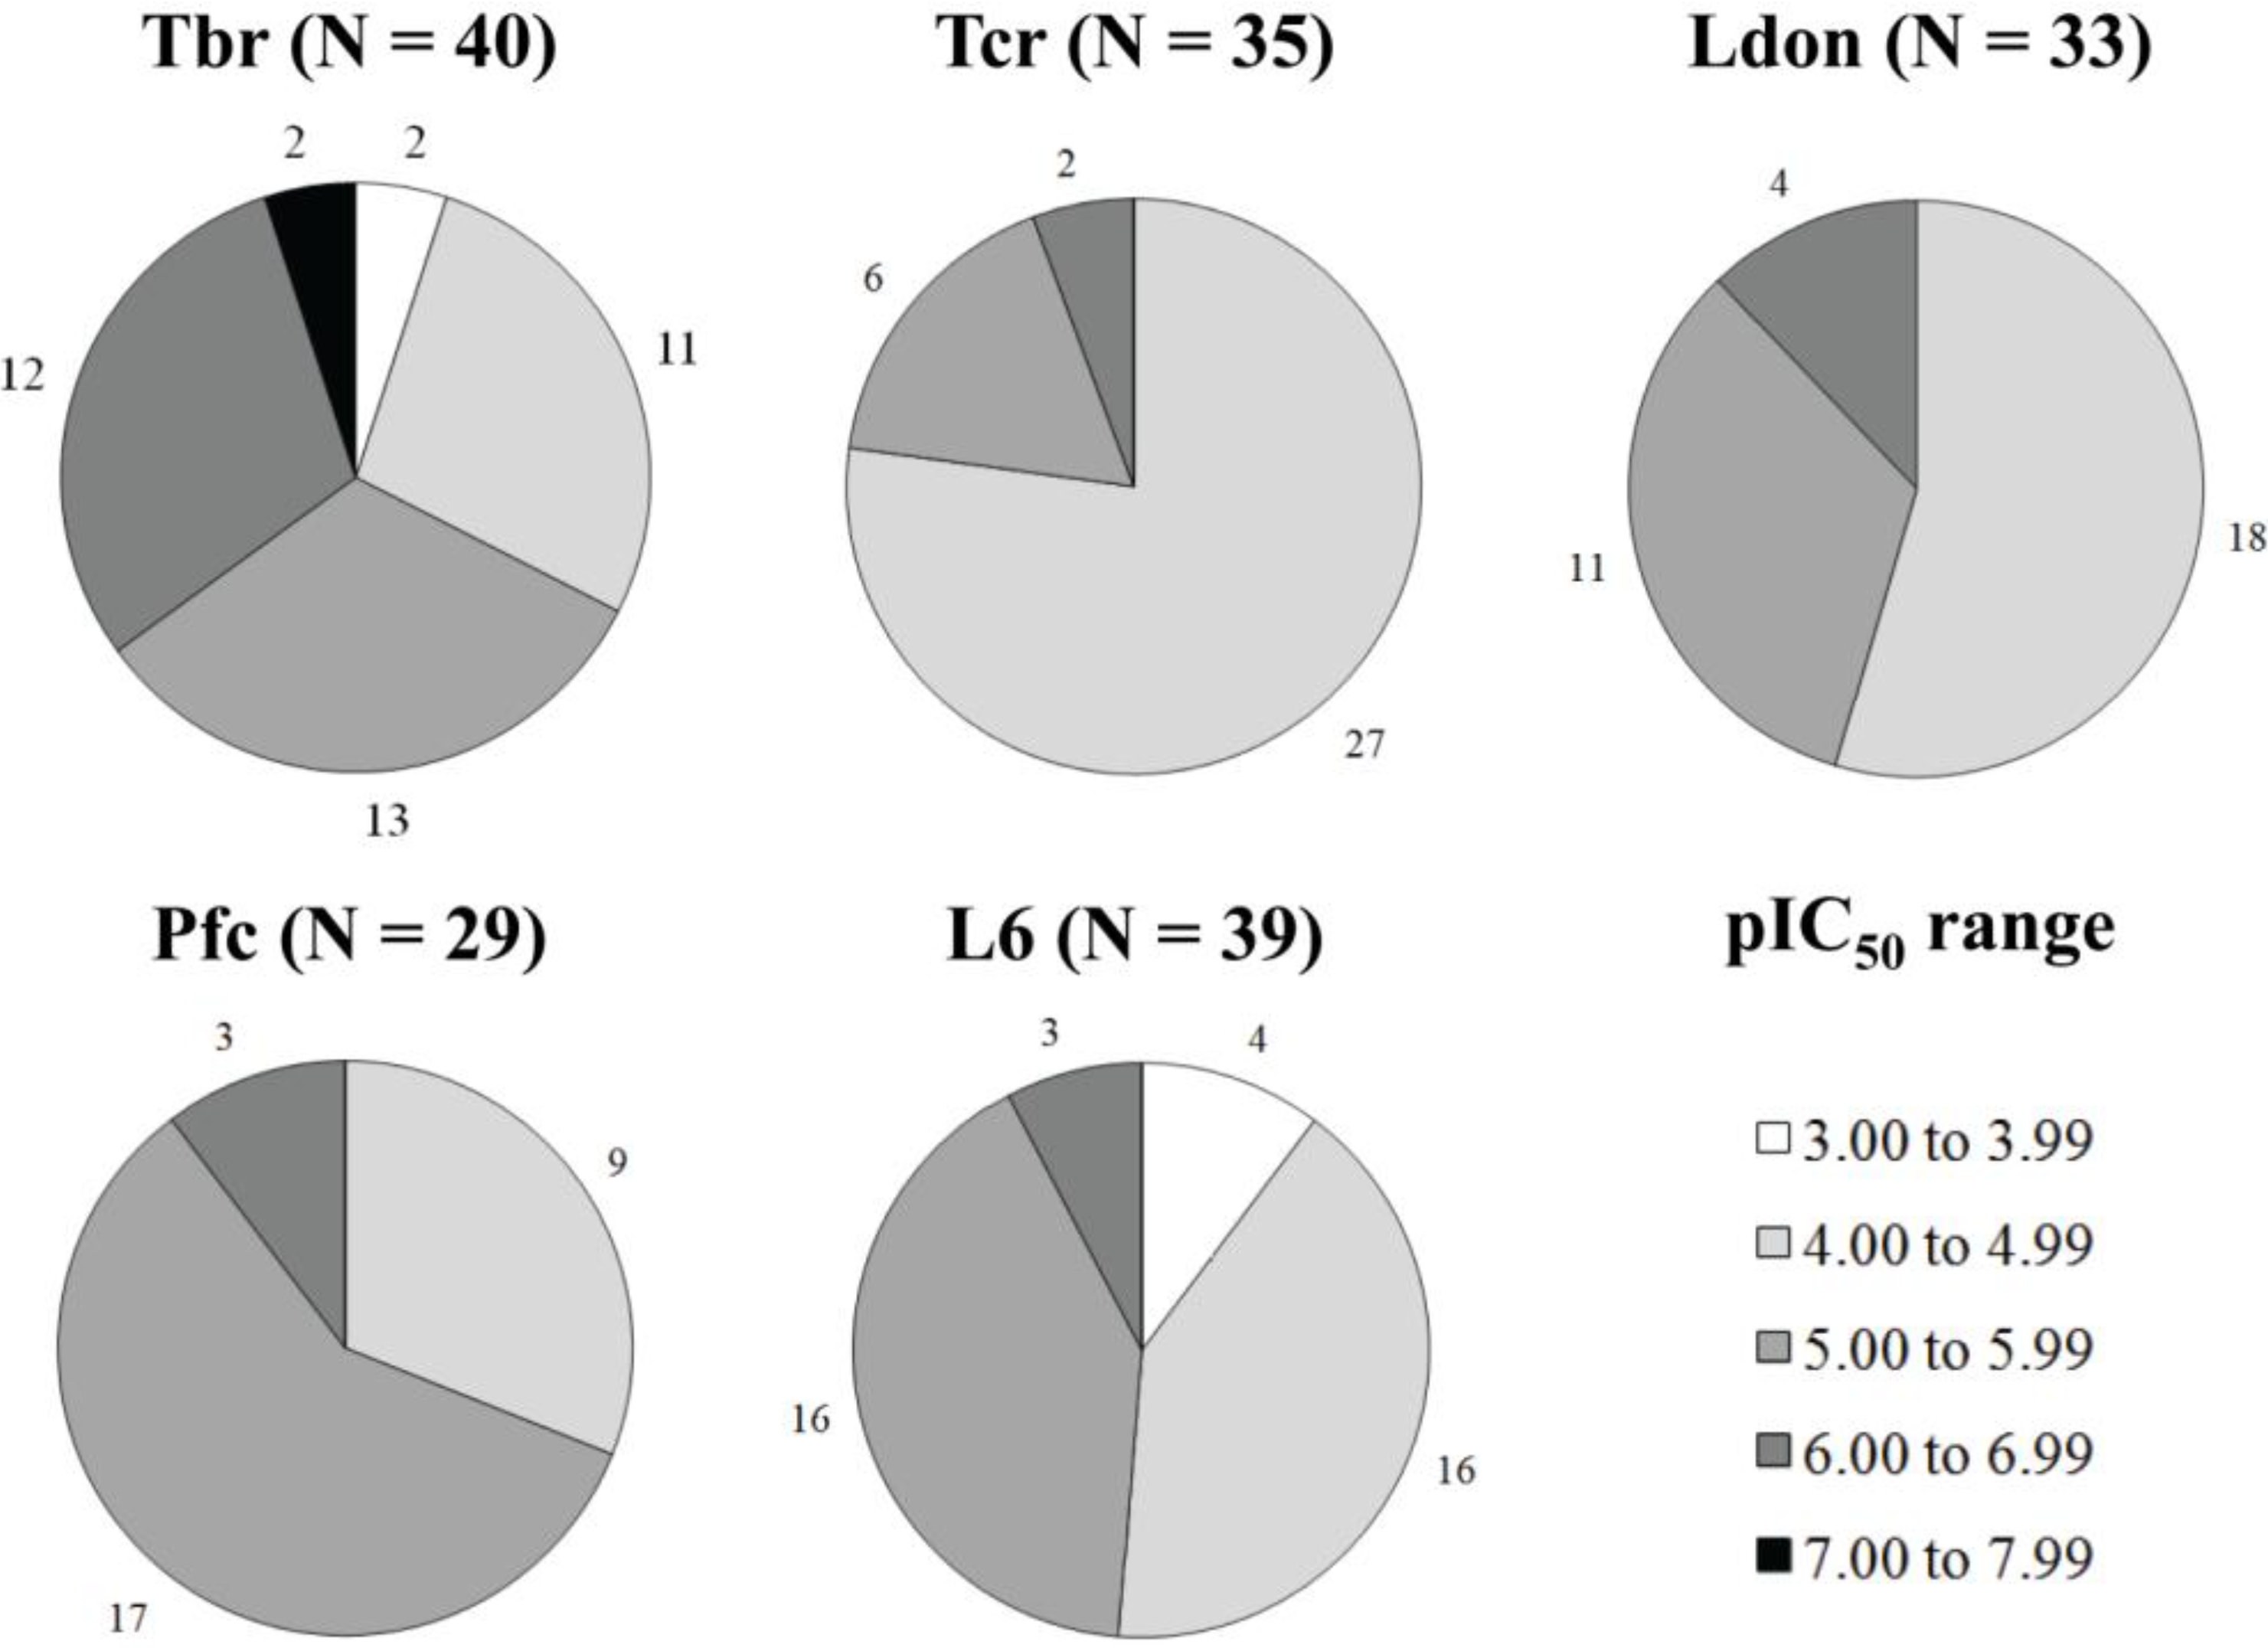
| N | 31 | 28 | 25 | 23 | 30 |
| q2LOO | 0.637 | 0.748 | 0.775 | 0.736 | 0.673 |
| SEV | 0.576 | 0.282 | 0.279 | 0.232 | 0.337 |
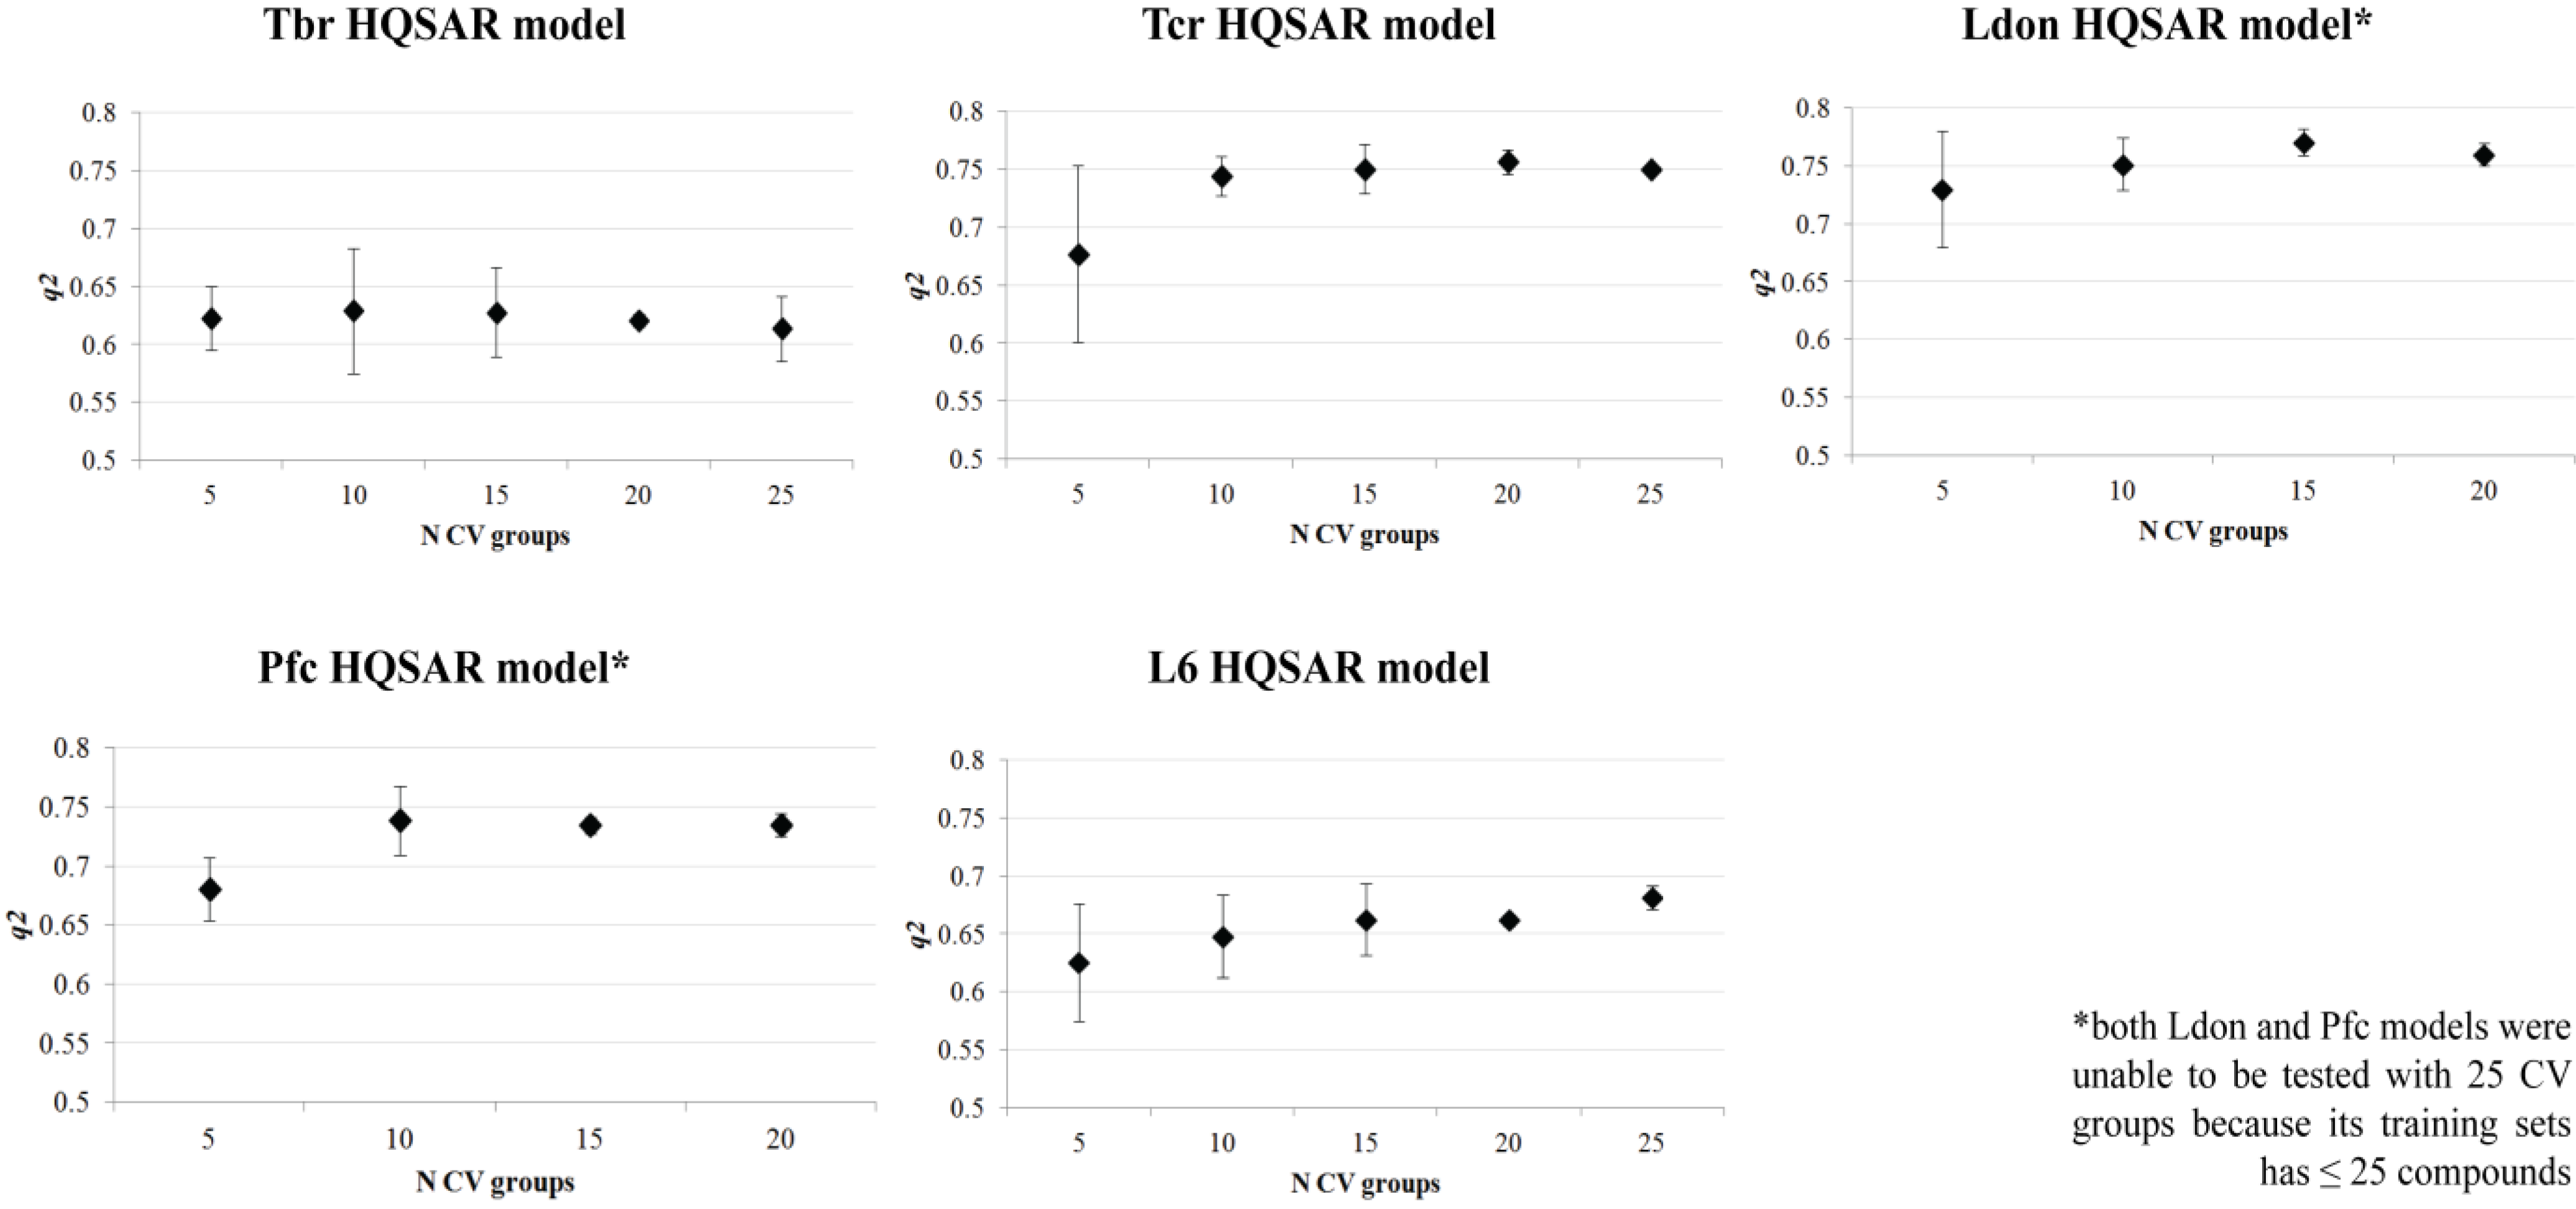
| q2CV | 0.623 ± 0.03 | 0.736 ± 0.03 | 0.753 ± 0.02 | 0.722 ± 0.02 | 0.656 ± 0.03 |
| r2 | 0.822 | 0.965 | 0.972 | 0.960 | 0.952 |
| SEE | 0.404 | 0.106 | 0.098 | 0.090 | 0.129 |
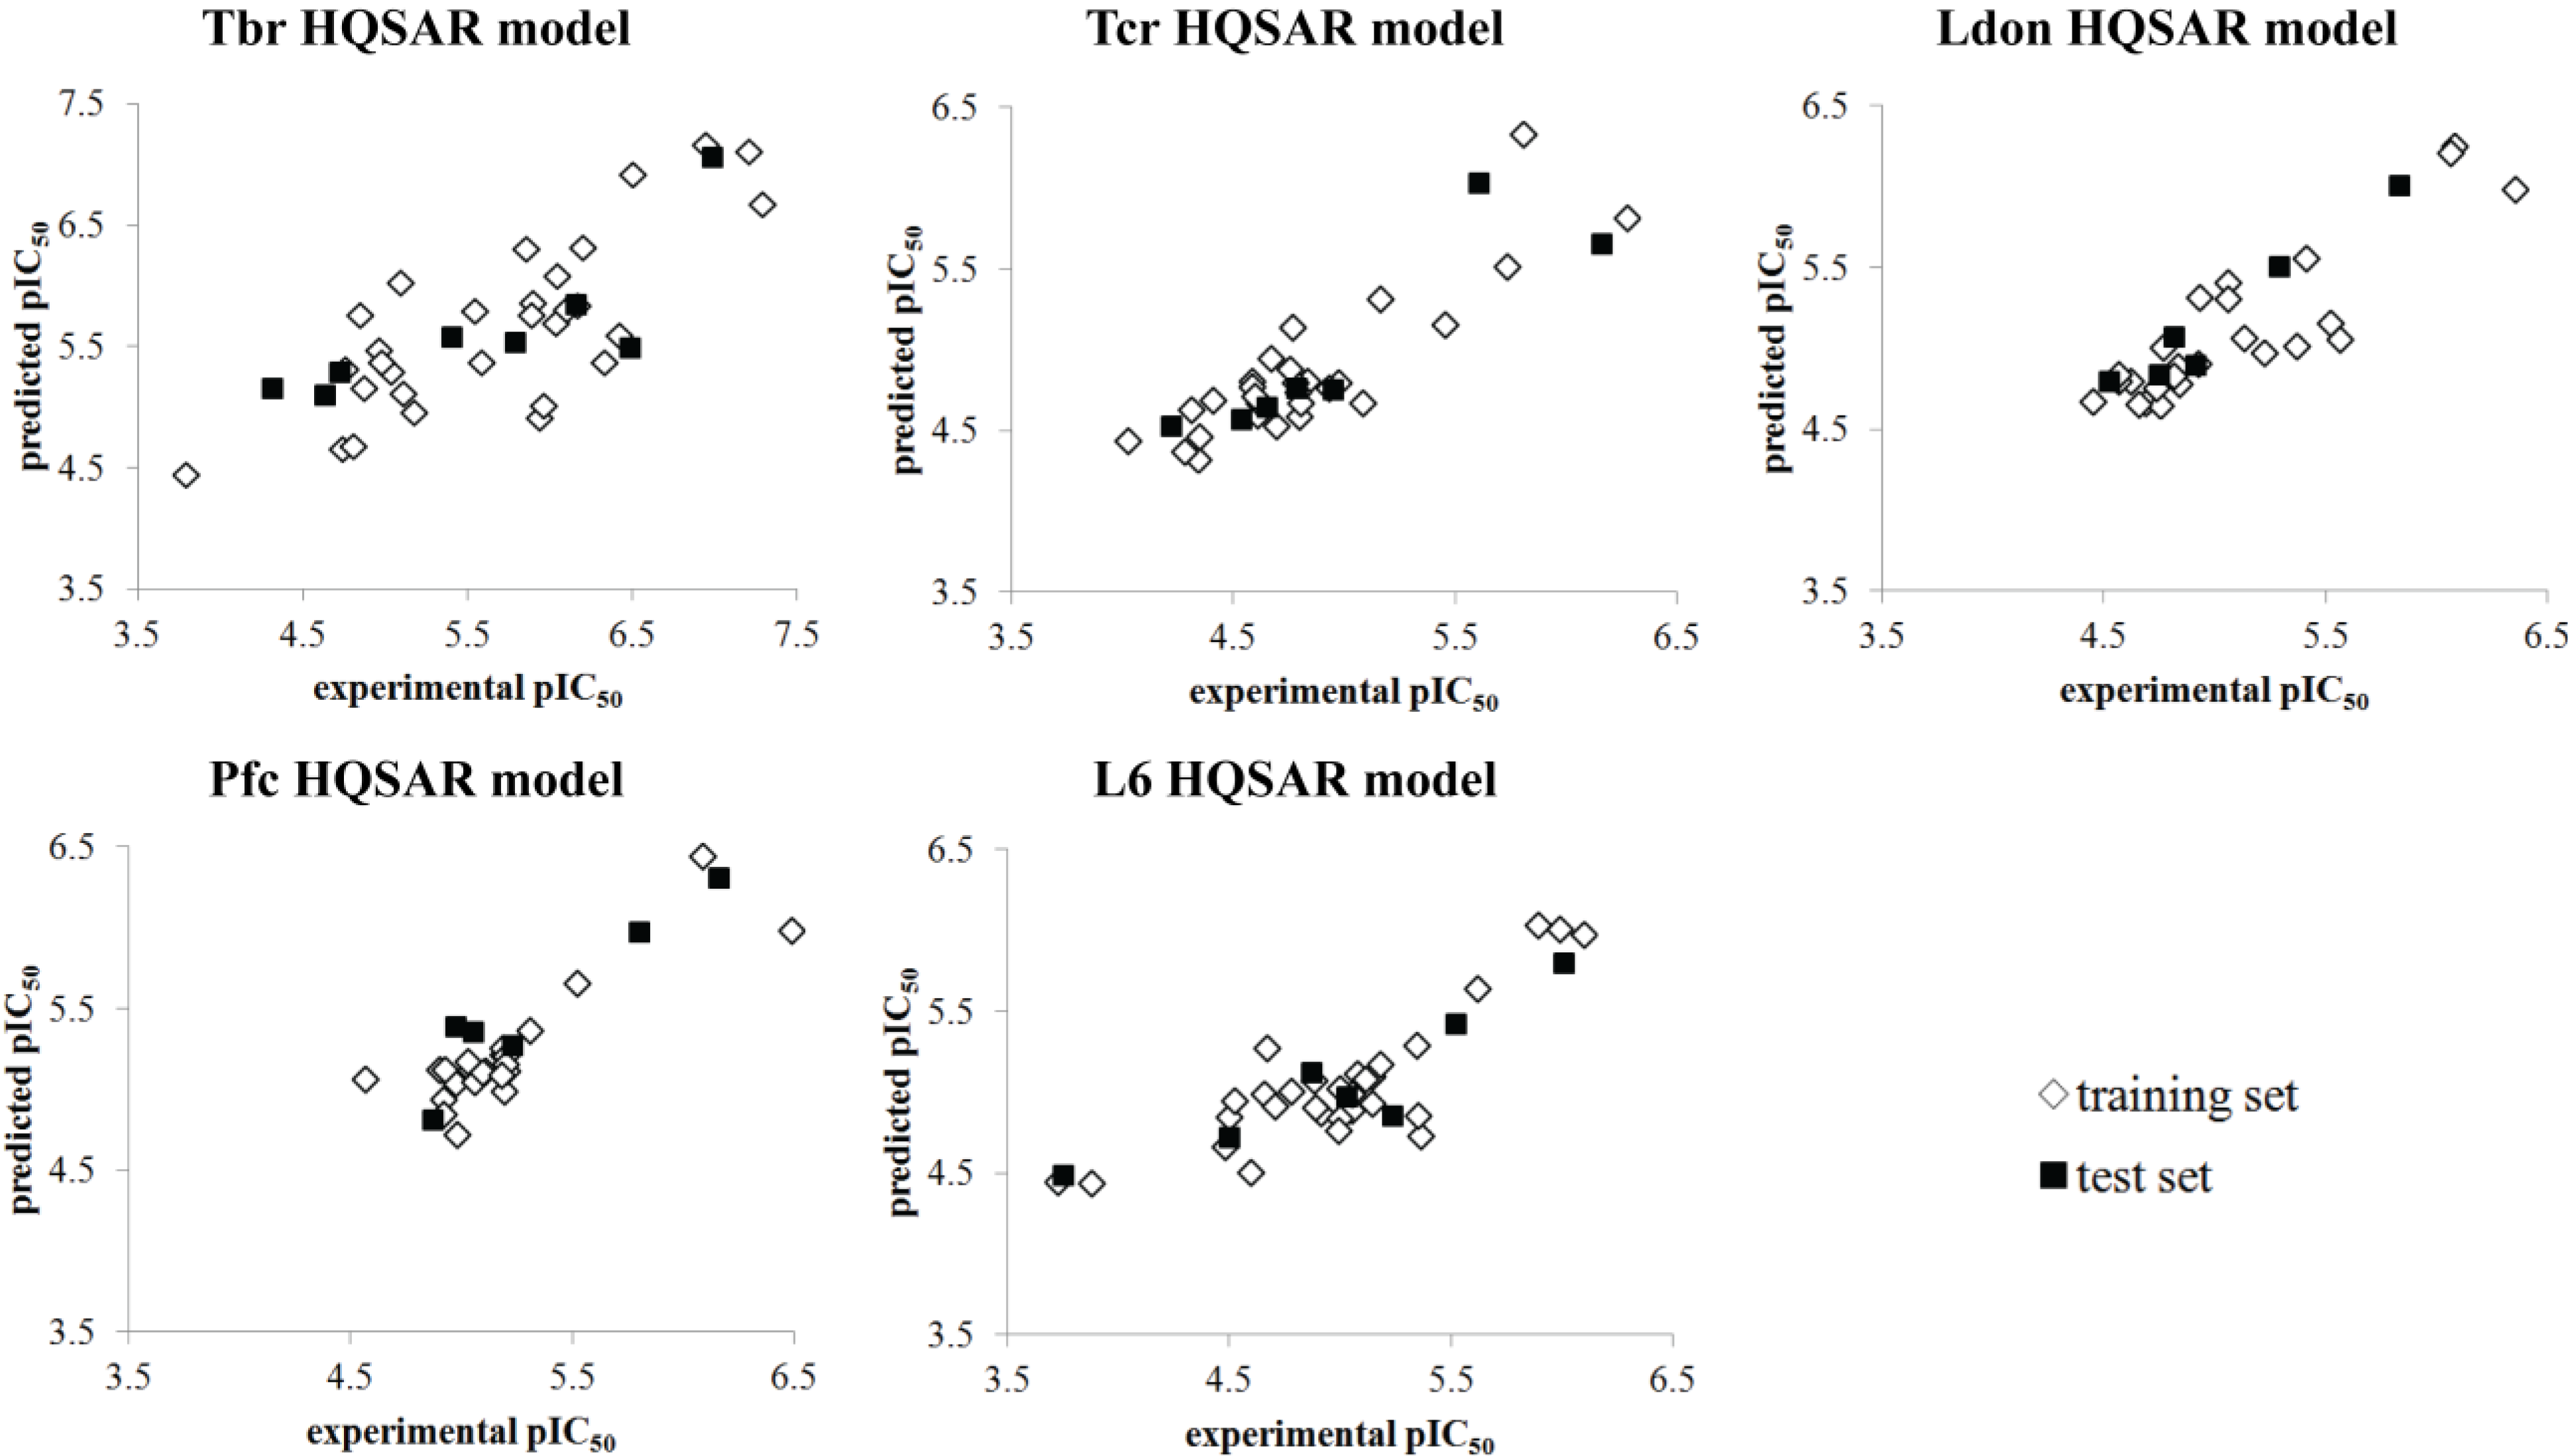
| r2test | 0.653 | 0.790 | 0.944 | 0.897 | 0.831 |


| Frag 01 | Frag 02 | Frag 03 | Frag 04 * | Frag 05 * |
|---|---|---|---|---|
 |  |  |  |  |
| 0.025 | 0.025 | 0.025 | 0.022 | 0.022 |
| Frag 06 | Frag 07 | Frag 08 | Frag 09 * | Frag 10 * |
 |  |  |  |  |
| −0.016 | −0.016 | −0.016 | −0.016 | −0.016 |

3. Experimental Section
3.1. Data Set
| Pseudoguaianolides | ||||||||||||||||||||
|---|---|---|---|---|---|---|---|---|---|---|---|---|---|---|---|---|---|---|---|---|
| Cpd | Structure | R | Tbr | Tcr | Ldon | Pfc | L6 | |||||||||||||
| 1 |  | H | 7.284 (19.1) | 6.158 (1.4) | n.a. | n.a. | 6.003 | |||||||||||||
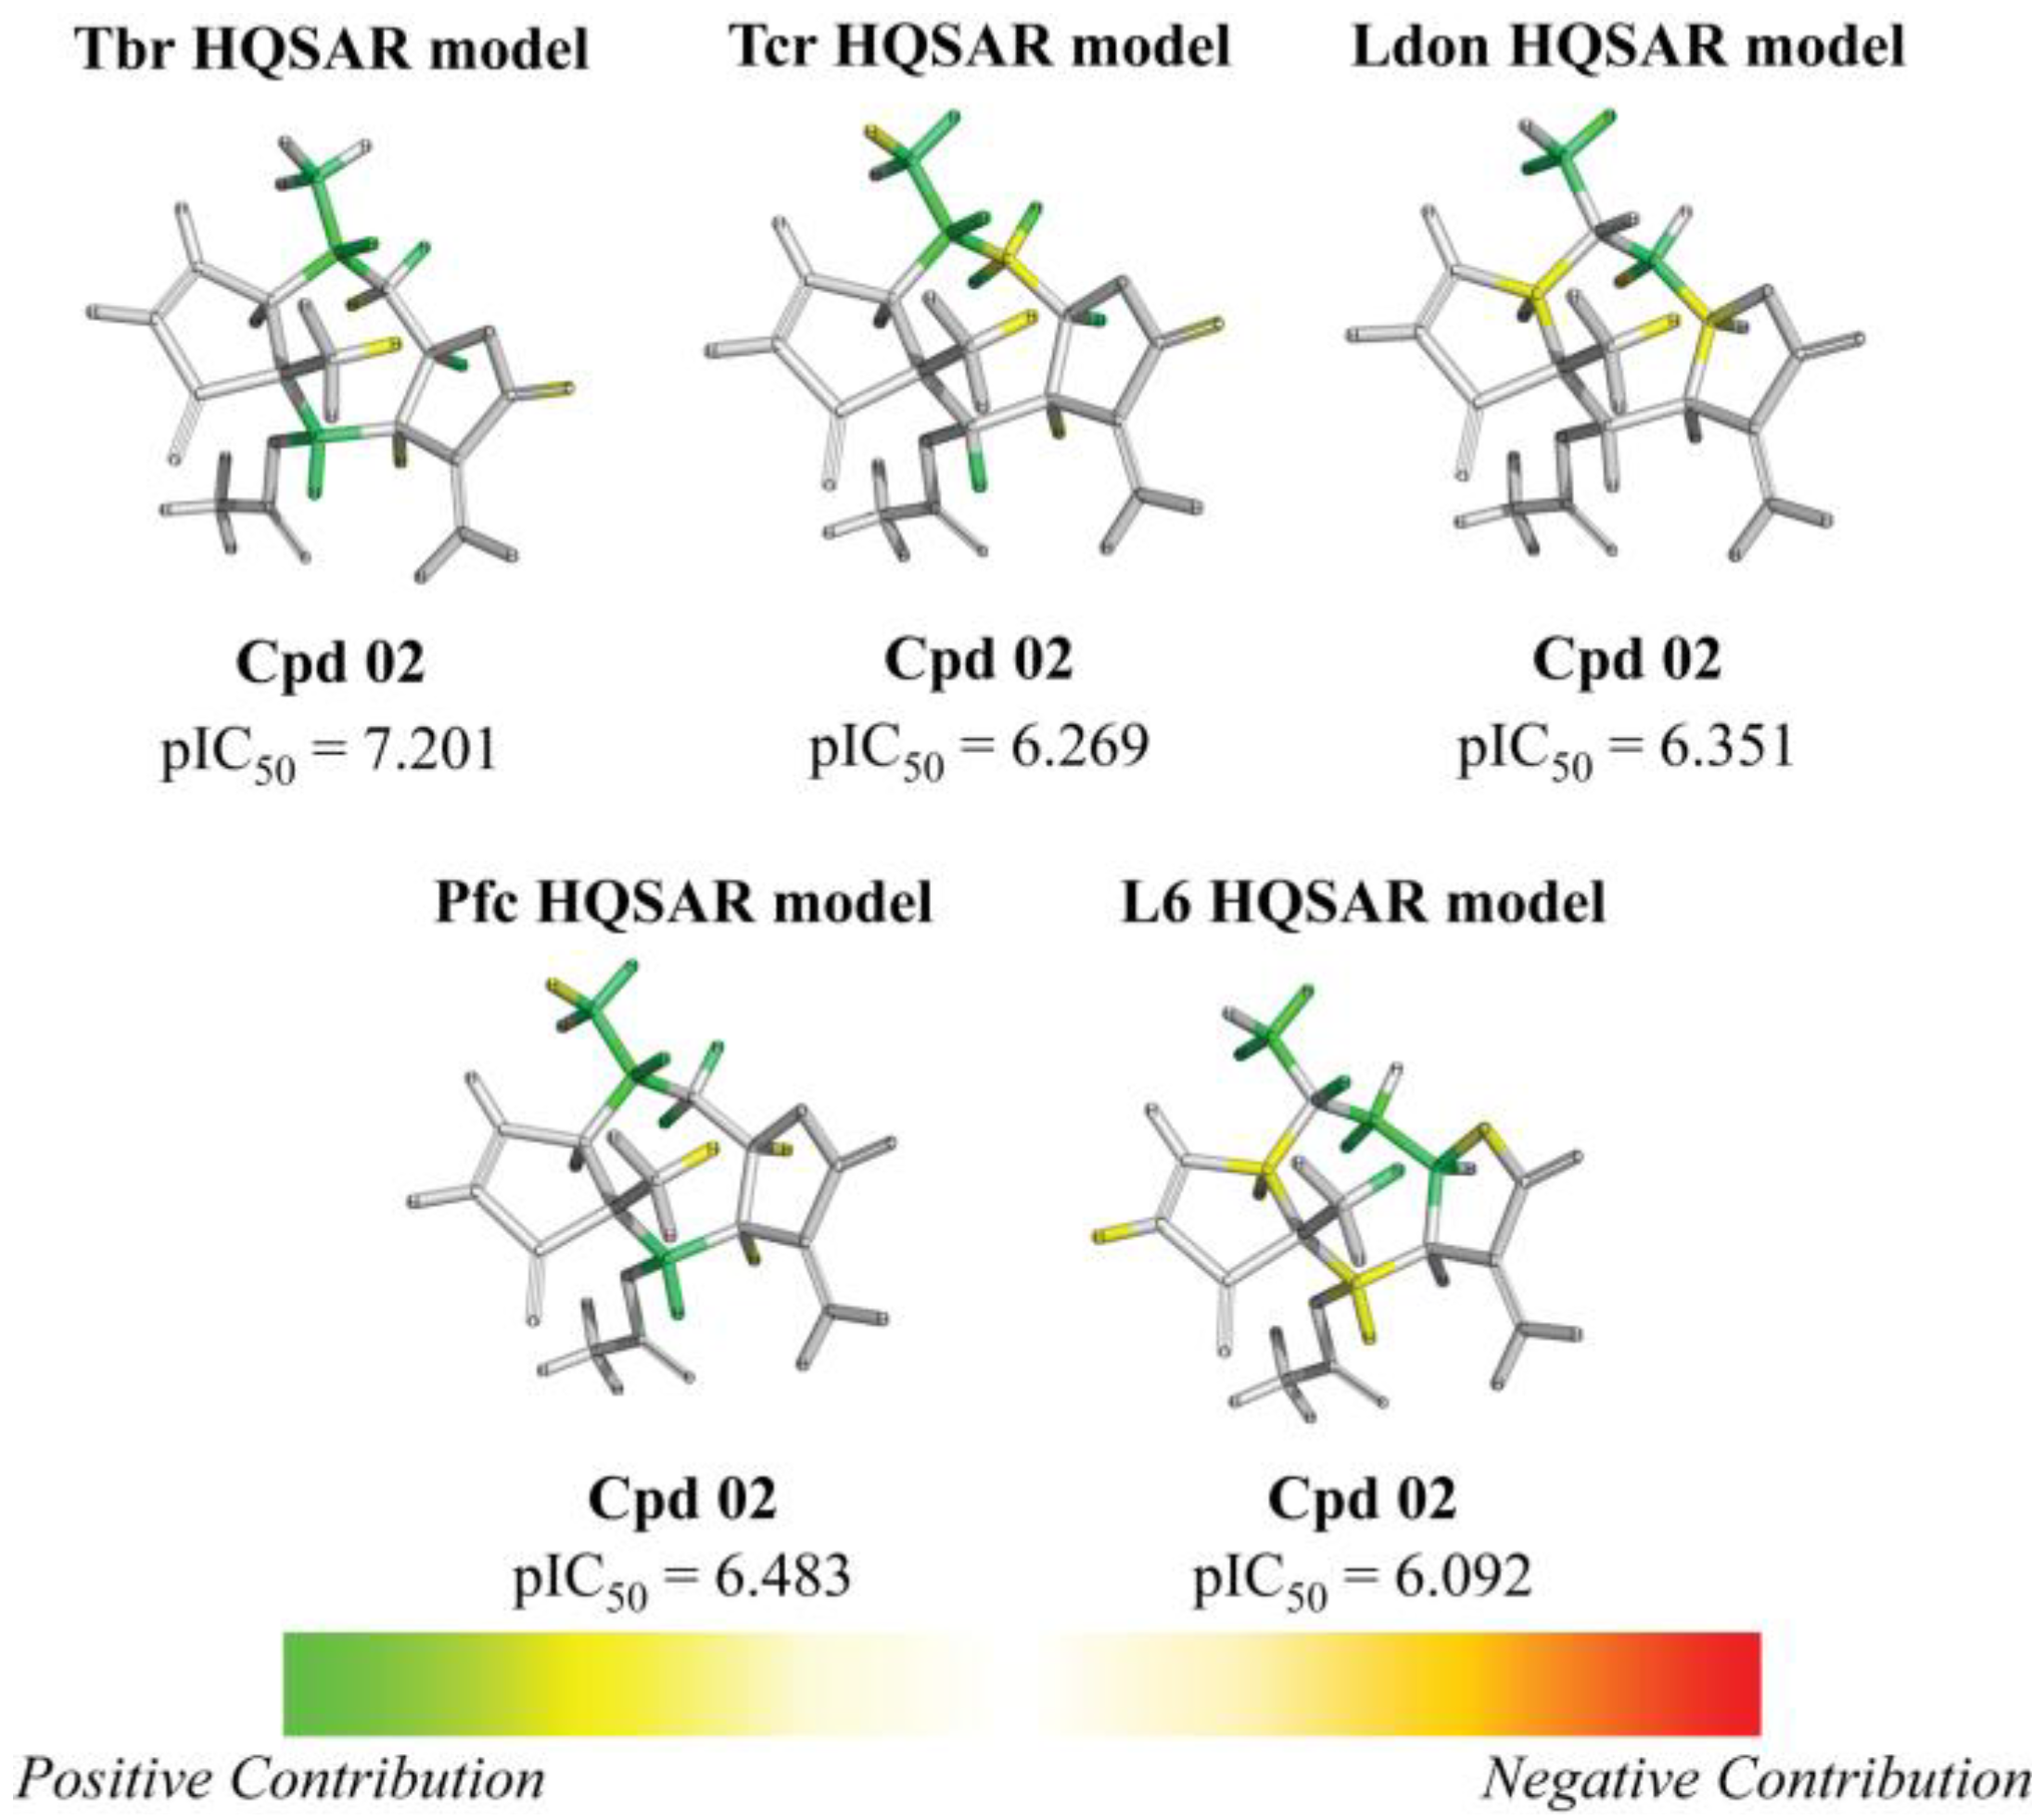
| 2 | ac | 7.201 (12.9) | 6.269 (1.5) | 6.351 (1.8) | 6.483 (2.5) | 6.092 | ||||||||||||||
| 3 | i-butyryl | 6.979 (9.8) | 5.805 (0.7) | 6.077 (1.2) | 6.155 (1.5) | 5.987 | ||||||||||||||
| 4 | i-valeryl | 6.936 (11.2) | 5.606 (0.5) | 6.060 (1.5) | 6.085 (1.6) | 5.887 | ||||||||||||||
| 5 |  | H | 6.164 (13.0) | 4.668 (0.4) | 5.415 (2.3) | 5.516 (2.9) | 5.051 | |||||||||||||
| 6 | Ac | 5.849 (2.2) | 5.159 (0.4) | n.a. | n.a. | 5.515 | ||||||||||||||
| 7 | i-valeryl | 6.040 (5.0) | 5.452 (1.3) | 5.831 (3.1) | 5.795 (2.9) | 5.339 | ||||||||||||||
| 8 |  | - | 6.496 (7.7) | 5.728 (1.3) | n.a | n.a. | 5.612 | |||||||||||||
| 9 |  | Ac | H | OH | 5.033 (1.3) | 4.339 (0.3) | n.a. | n.a. | 4.911 | |||||||||||
| 10 | Ac | H | H | 5.174 (0.7) | 4.690 (0.2) | 4.912 (0.4) | 5.190 (0.7) | 5.357 | ||||||||||||
| 11 | H | H | H | 4.736 (1.7) | 4.278 (0.6) | 4.686 (1.5) | 4.916 (2.6) | 4.496 | ||||||||||||
| 12 | H | tig | OH | 4.961 (1.5) | 4.308 (0.3) | 4.746 (0.9) | 4.975 (1.6) | 4.778 | ||||||||||||
| 13 | H | H | Otig | 4.716 (1.7) | 4.221 (0.5) | 4.838 (2.2) | 4.561 (1.2) | 4.498 | ||||||||||||
| 14 | Ac | ac | H | 5.930 (7.2) | 4.834 (0.6) | 5.371 (2.0) | 5.049 (0.9) | 5.074 | ||||||||||||
| 15 | Ac | H | Oac | 5.402 (1.8) | 4.788 (0.4) | 5.062 (0.8) | 5.223 (1.2) | 5.138 | ||||||||||||
| 16 |  | - | - | - | 4.866 (1.6) | 4.348 (0.5) | 4.927 (1.8) | 4.972 (2.0) | 4.666 | |||||||||||
| Xanthanolides | ||||||||||||||||||||
| Cpd | Structure | Tbr | Tcr | Ldon | Pfc | L6 | ||||||||||||||
| 17 |  | 4.207 (2.9) | n.a. | 4.623 (7.5) | n.a. | 3.748 | ||||||||||||||
| 18 |  | 5.535 (10.4) | 4.581 (1.2) | 4.753 (1.7) | 5.107 (3.9) | 4.520 | ||||||||||||||
| 19 |  | 6.481 (67.0) | 4.948 (2.0) | 6.223 (37.0) | 5.186 (3.4) | 4.655 | ||||||||||||||
| 20 |  | 4.799 (1.3) | 4.409 (0.5) | 4.836 (1.4) | 4.896 (1.6) | 4.702 | ||||||||||||||
| Modified Xanthanolides | ||||||||||||||||||||
| Cpd | Structure | Tbr | Tcr | Ldon | Pfc | L6 | ||||||||||||||
| 21 |  | 6.195 (14.8) | 4.794 (0.6) | 4.657 (0.4) | 5.304 (1.9) | 5.026 | ||||||||||||||
| 22 |  | 5.890 (10.3) | 4.020 (0.1) | 4.570 (0.5) | 5.185 (2.0) | 4.877 | ||||||||||||||
| 23 |  | 3.790 | n.a. | 4.812 | n.a. | n.a. | ||||||||||||||
| 24 |  | 5.086 (52.1) | n.a. | 4.568 (15.8) | n.a. | 3.369 | ||||||||||||||
| Eudesmanolides | ||||||||||||||||||||
| Cpd | Structure | R | Tbr | Tcr | Ldon | Pfc | L6 | |||||||||||||
| 25 |  | H | 4.627 (0.2) | 4.652 (0.2) | n.a. | n.a. | 5.348 | |||||||||||||
| 26 | OH | 5.108 (0.1) | 4.606 (0.0) | n.a. | n.a. | 6.023 | ||||||||||||||
| 27 | Oac | 4.970 (0.8) | 4.614 (0.4) | 4.930 (0.8) | 5.036 (1.0) | 5.050 | ||||||||||||||
| 28 |  | - | 3.467 (0.5) | n.a. | n.a. | n.a. | 3.728 | |||||||||||||
| 29 |  | - | 5.581 (2.3) | 5.081 (0.7) | 5.519 (2.0) | 5.194 (0.9) | 5.223 | |||||||||||||
| 30 |  | - | 5.795 (6.4) | 4.763 (0.6) | 5.061 (1.2) | 4.971 (1.0) | 4.992 | |||||||||||||
| 31 |  | - | 4.749 (1.9) | 4.539 (1.1) | 5.221 (5.5) | 4.919 (2.8) | 4.479 | |||||||||||||
| 32 |  | - | 5.956 (23.1) | 4.582 (1.0) | 5.134 (3.5) | 4.866 (1.9) | 4.592 | |||||||||||||
| Germacranolides | ||||||||||||||||||||
| Cpd | Structure | R | Tbr | Tcr | Ldon | Pfc | L6 | |||||||||||||
| 33 |  | - | 5.885 (7.8) | 4.775 (0.6) | 4.818 (0.7) | 5.199 (1.6) | 4.991 | |||||||||||||
| 34 |  | - | 6.411 (18.7) | 4.972 (0.7) | 5.449 (0.3) | 4.925 (0.6) | 5.140 | |||||||||||||
| 35 |  | - | 4.310 (2.7) | n.a. | 4.449 (0.4) | n.a. | 3.877 | |||||||||||||
| 36 |  | H | 4.845 (1.0) | 4.592 (0.5) | 5.564 | 5.025 (1.4) | 4.866 | |||||||||||||
| 37 | ac | 6.321 (16.2) | 4.802 (0.5) | 5.285 | 5.198 (1.2) | 5.111 | ||||||||||||||
| Cpd | Structure | R1 | R2 | Tbr | Tcr | Ldon | Pfc | L6 | ||||||||||||
| 38 |  | H | H | 6.026 (13.8) | 4.783 (0.8) | 4.740 | 5.055 (1.5) | 4.887 | ||||||||||||
| 39 | ac | H | 6.095 (12.6) | 4.755 (0.6) | 4.522 | 5.093 (1.3) | 4.996 | |||||||||||||
| 40 | H | Oac | 6.156 (9.5) | 4.927 (0.6) | 4.767 | 5.178 (1.0) | 5.176 | |||||||||||||
3.2. Fragment-Based Strategy
3.3. QSAR Model Validation
4. Conclusions
Supplementary Materials
Acknowledgments
Author Contributions
Conflicts of Interest
References
- Gilbert, I.H. Drug discovery for neglected diseases: Molecular target-based and phenotypic approaches. J. Med. Chem. 2013, 56, 7719–7726. [Google Scholar] [CrossRef]
- Utzinger, J.; Becker, S.L.; Knopp, S.; Blum, J.; Neumayr, A.L.; Keiser, J.; Hatz, C.F. Neglected tropical diseases: Diagnosis, clinical management, treatment and control. Swiss Med Wkly. 2012, 142, w13727. [Google Scholar]
- WHO. 10 Facts on Neglected Tropical Diseases Web Page. Available online: http://www.who.int/features/factfiles/neglected_tropical_diseases/en/index.html (accessed on 2 October 2014).
- World Health Organization. Working to Overcome the Global Impact of Neglected Tropical Diseases: First Who Report on Neglected Tropical Diseases, 2010. Available online: http://www.who.int/neglected_diseases/2010report/en/ (accessed on 3 April 2014).
- Biamonte, M.A.; Wanner, J.; le Roch, K.G. Recent advances in malaria drug discovery. Bioorg. Med. Chem. Lett. 2013, 23, 2829–2843. [Google Scholar] [CrossRef]
- Hoet, S.; Opperdoes, F.; Brun, R.; Quetin-Leclercq, J. Natural products active against african trypanosomes: A step towards new drugs. Nat. Prod. Rep. 2004, 21, 353–364. [Google Scholar] [CrossRef]
- Newman, D.J.; Cragg, G.M.; Snader, K.M. Natural products as sources of new drugs over the period 1981−2002. J. Nat. Prod. 2003, 66, 1022–1037. [Google Scholar] [CrossRef]
- Schmidt, T.; Nour, A.; Khalid, S.; Kaiser, M.; Brun, R. Quantitative structure-antiprotozoal activity relationships of sesquiterpene lactones. Molecules 2009, 14, 2062–2076. [Google Scholar] [CrossRef]
- Langer, T.; Bryant, S.D. Chapter 10 - in Silico Screening: Hit finding from database mining. In The Practice of Medicinal Chemistry, 3rd ed.; Wermuth, C.G., Ed.; Academic Press: New York, NY, USA, 2008; pp. 210–227. [Google Scholar]
- Schmidt, T.J.; Heilmann, J. Quantitative structure-cytotoxicity relationships of sesquiterpene lactones derived from partial charge (q)-based fractional accessible surface area descriptors (q_frasas). Quant. Struct.-Act. Relat. 2002, 21, 276–287. [Google Scholar]
- Schmidt, T. Quantitative structure-cytotoxicity relationships within a series of helenanolide type sesquiterpene lactones. Pharm. Pharmacol. Lett. 1999, 9, 9–13. [Google Scholar]
- Scotti, M.T.; Fernandes, M.B.; Ferreira, M.J.; Emerenciano, V.P. Quantitative structure-activity relationship of sesquiterpene lactones with cytotoxic activity. Bioorg. Med. Chem. 2007, 15, 2927–2934. [Google Scholar] [CrossRef]
- Wagner, S.; Hofmann, A.; Siedle, B.; Terfloth, L.; Merfort, I.; Gasteiger, J. Development of a structural model for nf-kappab inhibition of sesquiterpene lactones using self-organizing neural networks. J. Med. Chem. 2006, 49, 2241–2252. [Google Scholar] [CrossRef]
- Schmidt, T.J.; da Costa, F.B.; Lopes, N.P.; Kaiser, M.; Brun, R. In silico prediction and experimental evaluation of furanoheliangolide sesquiterpene lactones as potent agents against trypanosoma brucei rhodesiense. Antimicrob. Agents Chemother. 2014, 58, 325–332. [Google Scholar] [CrossRef]
- Cronin, M.T.D.; Schultz, T.W. Pitfalls in QSAR. Comp. Theor. Chem. 2003, 622, 39–51. [Google Scholar]
- Schmidt, T.J. Toxic activities of sesquiterpene lactones: Structural and biochemical aspects. Curr. Org. Chem. 1999, 3, 599–600. [Google Scholar]
- Schmidt, T.J. Structure-activity relationships of sesquiterpene lactones. Stud. Nat. Prod. Chem. 2006, 33, 309–392. [Google Scholar] [CrossRef]
- Schomburg, C.; Schuehly, W.; da Costa, F.B.; Klempnauer, K.-H.; Schmidt, T.J. Natural sesquiterpene lactones as inhibitors of myb-dependent gene expression: Structure–activity relationships. Eur. J. Med. Chem. 2013, 63, 313–320. [Google Scholar] [CrossRef]
- Tripos. In Sybyl x 2.0; Tripos Inc.: St. Louis, MO, USA, 2010.
- Lowis, D.R. Hqsar: A new, highly predictive qsar technique. Tripos Technical Notes 1997, 1, 1–10. [Google Scholar]
- Seel, M.; Turner, D.B.; Willett, P. Effect of parameter variations on the effectiveness of HQSAR analyses. Quant. Struct.-Act. Relat. 1999, 18, 245–252. [Google Scholar]
- Salum, L.B.; Andricopulo, A.D. Fragment-based QSAR: Perspectives in drug design. Mol. Divers. 2009, 13, 277–285. [Google Scholar] [CrossRef] [Green Version]
- Salum, L.B.; Andricopulo, A.D. Fragment-based QSAR strategies in drug design. Expert. Opin. Drug Discov. 2010, 5, 405–412. [Google Scholar] [CrossRef]
- Garcia, T.S.; Honorio, K.M. Two-dimensional quantitative structure-activity relationship studies on bioactive ligands of peroxisome proliferator-activated receptor delta. J. Braz. Chem. Soc. 2011, 22, 65–72. [Google Scholar] [CrossRef]
- Araujo, S.C.; Maltarollo, V.G.; Honorio, K.M. Computational studies of TGF-βRI (ALK-5) inhibitors: Analysis of the binding interactions between ligand–receptor using 2D and 3D techniques. Eur. J. Pharm. Sci. 2013, 49, 542–549. [Google Scholar] [CrossRef]
- Guido, R.V.C.; Trossini, G.H.G.; Castilho, M.S.; Oliva, G.; Ferreira, E.I.; Andricopulo, A.D. Structure-activity relationships for a class of selective inhibitors of the major cysteine protease from trypanosoma cruzi. J. Enzyme Inhib. Med. Chem. 2008, 23, 964–973. [Google Scholar] [CrossRef]
- Moda, T.L.; Andricopulo, A.D. Consensus hologram qsar modeling for the prediction of human intestinal absorption. Bioorg. Med. Chem. Lett. 2012, 22, 2889–2893. [Google Scholar] [CrossRef]
- Ferreira, M.M.C. Multivariate QSAR. J. Braz. Chem. Soc. 2002, 13, 742–753. [Google Scholar]
- Gaudio, A.C.; Zandonade, E. Proposition, validation and analysis of QSAR models. Quím. Nova 2001, 24, 658–671. [Google Scholar]
- Gertrudes, J.C.; Maltarollo, V.G.; Silva, R.A.; Oliveira, P.R.; Honorio, K.M.; da Silva, A.B. Machine learning techniques and drug design. Curr. Med. Chem. 2012, 19, 4289–4297. [Google Scholar] [CrossRef]
- Tropsha, A. Best practices for qsar model development, validation, and exploitation. Mol. Inform. 2010, 29, 476–488. [Google Scholar] [CrossRef]
- Sample Availability: Samples of the compounds are available from T.J.S.
© 2014 by the authors. Licensee MDPI, Basel, Switzerland. This article is an open access article distributed under the terms and conditions of the Creative Commons Attribution license ( http://creativecommons.org/licenses/by/4.0/).
Share and Cite
Trossini, G.H.G.; Maltarollo, V.G.; Schmidt, T.J. Hologram QSAR Studies of Antiprotozoal Activities of Sesquiterpene Lactones. Molecules 2014, 19, 10546-10562. https://doi.org/10.3390/molecules190710546
Trossini GHG, Maltarollo VG, Schmidt TJ. Hologram QSAR Studies of Antiprotozoal Activities of Sesquiterpene Lactones. Molecules. 2014; 19(7):10546-10562. https://doi.org/10.3390/molecules190710546
Chicago/Turabian StyleTrossini, Gustavo H. G., Vinícius G. Maltarollo, and Thomas J. Schmidt. 2014. "Hologram QSAR Studies of Antiprotozoal Activities of Sesquiterpene Lactones" Molecules 19, no. 7: 10546-10562. https://doi.org/10.3390/molecules190710546