Article

Secondary Metabolite Profiling of Curcuma Species Grown at Different Locations Using GC/TOF and UPLC/Q-TOF MS

1
Integrated Metabolomics Research Group, Western Seoul Center, Korea Basic Science Institute, Seoul 120-140, Korea
2
Department of Chemistry, Sungkyunkwan University, Suwon 440-746, Korea
3
Basic Herbal Medicine Research Group, Herbal Medicine Research Division, Korea Institute of Oriental Medicine, Daejeon 305-811, Korea
4
Herbal Material Management Team, Herbal Medicine Research Division, Korea Institute of Oriental Medicine, Daejeon 305-811, Korea
5
Graduate School of Analytical Science and Technology, Chungnam National University, Daejeon 305-764, Korea
*
Authors to whom correspondence should be addressed.
These authors contributed equally to this work.
Molecules 2014, 19(7), 9535-9551; https://doi.org/10.3390/molecules19079535
Submission received: 16 April 2014 / Revised: 26 June 2014 / Accepted: 30 June 2014 / Published: 4 July 2014
(This article belongs to the Section Metabolites)

Abstract

:
Curcuma, a genus of rhizomatous herbaceous species, has been used as a spice, traditional medicine, and natural dye. In this study, the metabolite profile of Curcuma extracts was determined using gas chromatography-time of flight mass spectrometry (GC/TOF MS) and ultrahigh-performance liquid chromatography–quadrupole time-of-flight mass spectrometry (UPLC/Q-TOF MS) to characterize differences between Curcuma aromatica and Curcuma longa grown on the Jeju-do or Jin-do islands, South Korea. Previous studies have performed primary metabolite profiling of Curcuma species grown in different regions using NMR-based metabolomics. This study focused on profiling of secondary metabolites from the hexane extract of Curcuma species. Principal component analysis (PCA) and partial least-squares discriminant analysis (PLS-DA) plots showed significant differences between the C. aromatica and C. longa metabolite profiles, whereas geographical location had little effect. A t-test was performed to identify statistically significant metabolites, such as terpenoids. Additionally, targeted profiling using UPLC/Q-TOF MS showed that the concentration of curcuminoids differed depending on the plant origin. Based on these results, a combination of GC- and LC-MS allowed us to analyze curcuminoids and terpenoids, the typical bioactive compounds of Curcuma, which can be used to discriminate Curcuma samples according to species or geographical origin.

Graphical Abstract

1. Introduction

Curcuma is a genus comprised of ~70 known species in the plant family Zingiberaceae and has been historically used as a spice, medicine, and ceremonial dye [1]. Recently, this genus has been investigated for possible medicinal benefits, including antioxidant and anti-inflammation properties [2,3].
Curcuminoids and terpenoids are the major Curcuma bioactive compounds. Curcuminoids are vivid yellow natural phenols with antioxidant, anti-inflammatory and chemotherapeutic activities, and include curcumin (1) and its derivatives, such as demethoxycurcumin (2) and bisdemethoxycurcumin (3) [4,5]. Terpenoids are a diverse class of phytochemicals including aromatic, non-aromatic, volatile and non-volatile constituents that play a key role in traditional herbal remedies and are being investigated for antibacterial, antineoplastic, and other pharmaceutical potentials [6,7,8].
In metabolomics, mass spectrometry (MS) combined with chromatography is considered a keystone analytical technology [9] and is commonly used due to its large dynamic range, reproducibility, and ability to analyze complex biological samples [10]. This coupled analytical technique has been used to discriminate between plant species [11] and to characterize the biochemical behavior of plants exposed to various environmental situations, including growth conditions, stress, or seasonal changes [12,13]. Raven et al. investigated specific phytochemicals that were either genus or species specific [14], and found that these chemical components were affected by environmental factors such as temperature, precipitation, soil conditions, and seasonality [15]. GC/TOF MS technology offers high mass resolution, high mass accuracy and fast scan speeds, and has been applied recently in metabolomics for large-scale metabolite profiling of plant materials [16]. In addition, the combination of GC-MS and LC-MS has advantages for the analysis of compound classes over a range of polarity and relative molecular mass. The high polar components are profitable for LC-MS analysis whereas GC-MS are generally used to analyze non-polar components such as essential oils [17]. This dominant characteristics allow to analyze diverse components in crude extracts of plant materials and obtain more broad and comprehensive metabolite profiles [18,19].
In this study, MS-based metabolite profiling was used to investigate secondary metabolites that could discriminate between Curcuma longa and Curcuma aromatica grown in different locations (Jeju-do and Jin-do). C. aromatica and C. longa are representative Curcuma species grown in Korea, and both have long been cultivated in the southern islands of Jeju-do and Jin-do.
The abundant primary components of C. aromatica and C. longa grown in different regions were investigated using NMR-based metabolomics [20]. The same species was subsequently grown in the same regions and collected at the same time, but subjected to different extraction methods and analytical platforms. This present study reports the secondary metabolites of C. aromatica and C. longa grown in two locations using the combination of liquid chromatography (LC)- and gas chromatography (GC)-mass spectrometry. The typical bioactive compounds of Curcuma are curcuminoids and terpenoids, and these secondary metabolites can be analyzed using LC-MS and GC-MS, respectively. Furthermore, global and targeted metabolite profiling was used to identify possible species- and origin-specific markers.

2. Results and Discussion

Previous studies on Curcuma using MS were qualitative analyses [21,22] focusing on specific secondary metabolites such as curcuminoids [23,24] and essential oils [25,26]. To our knowledge, no qualitative and quantitative analysis of major secondary metabolites in Curcuma extracts has been performed. Moreover, we identified specific markers of Curcuma species using metabolic profiling and target analysis.

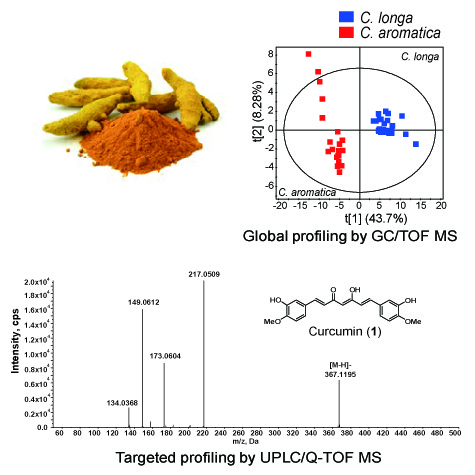
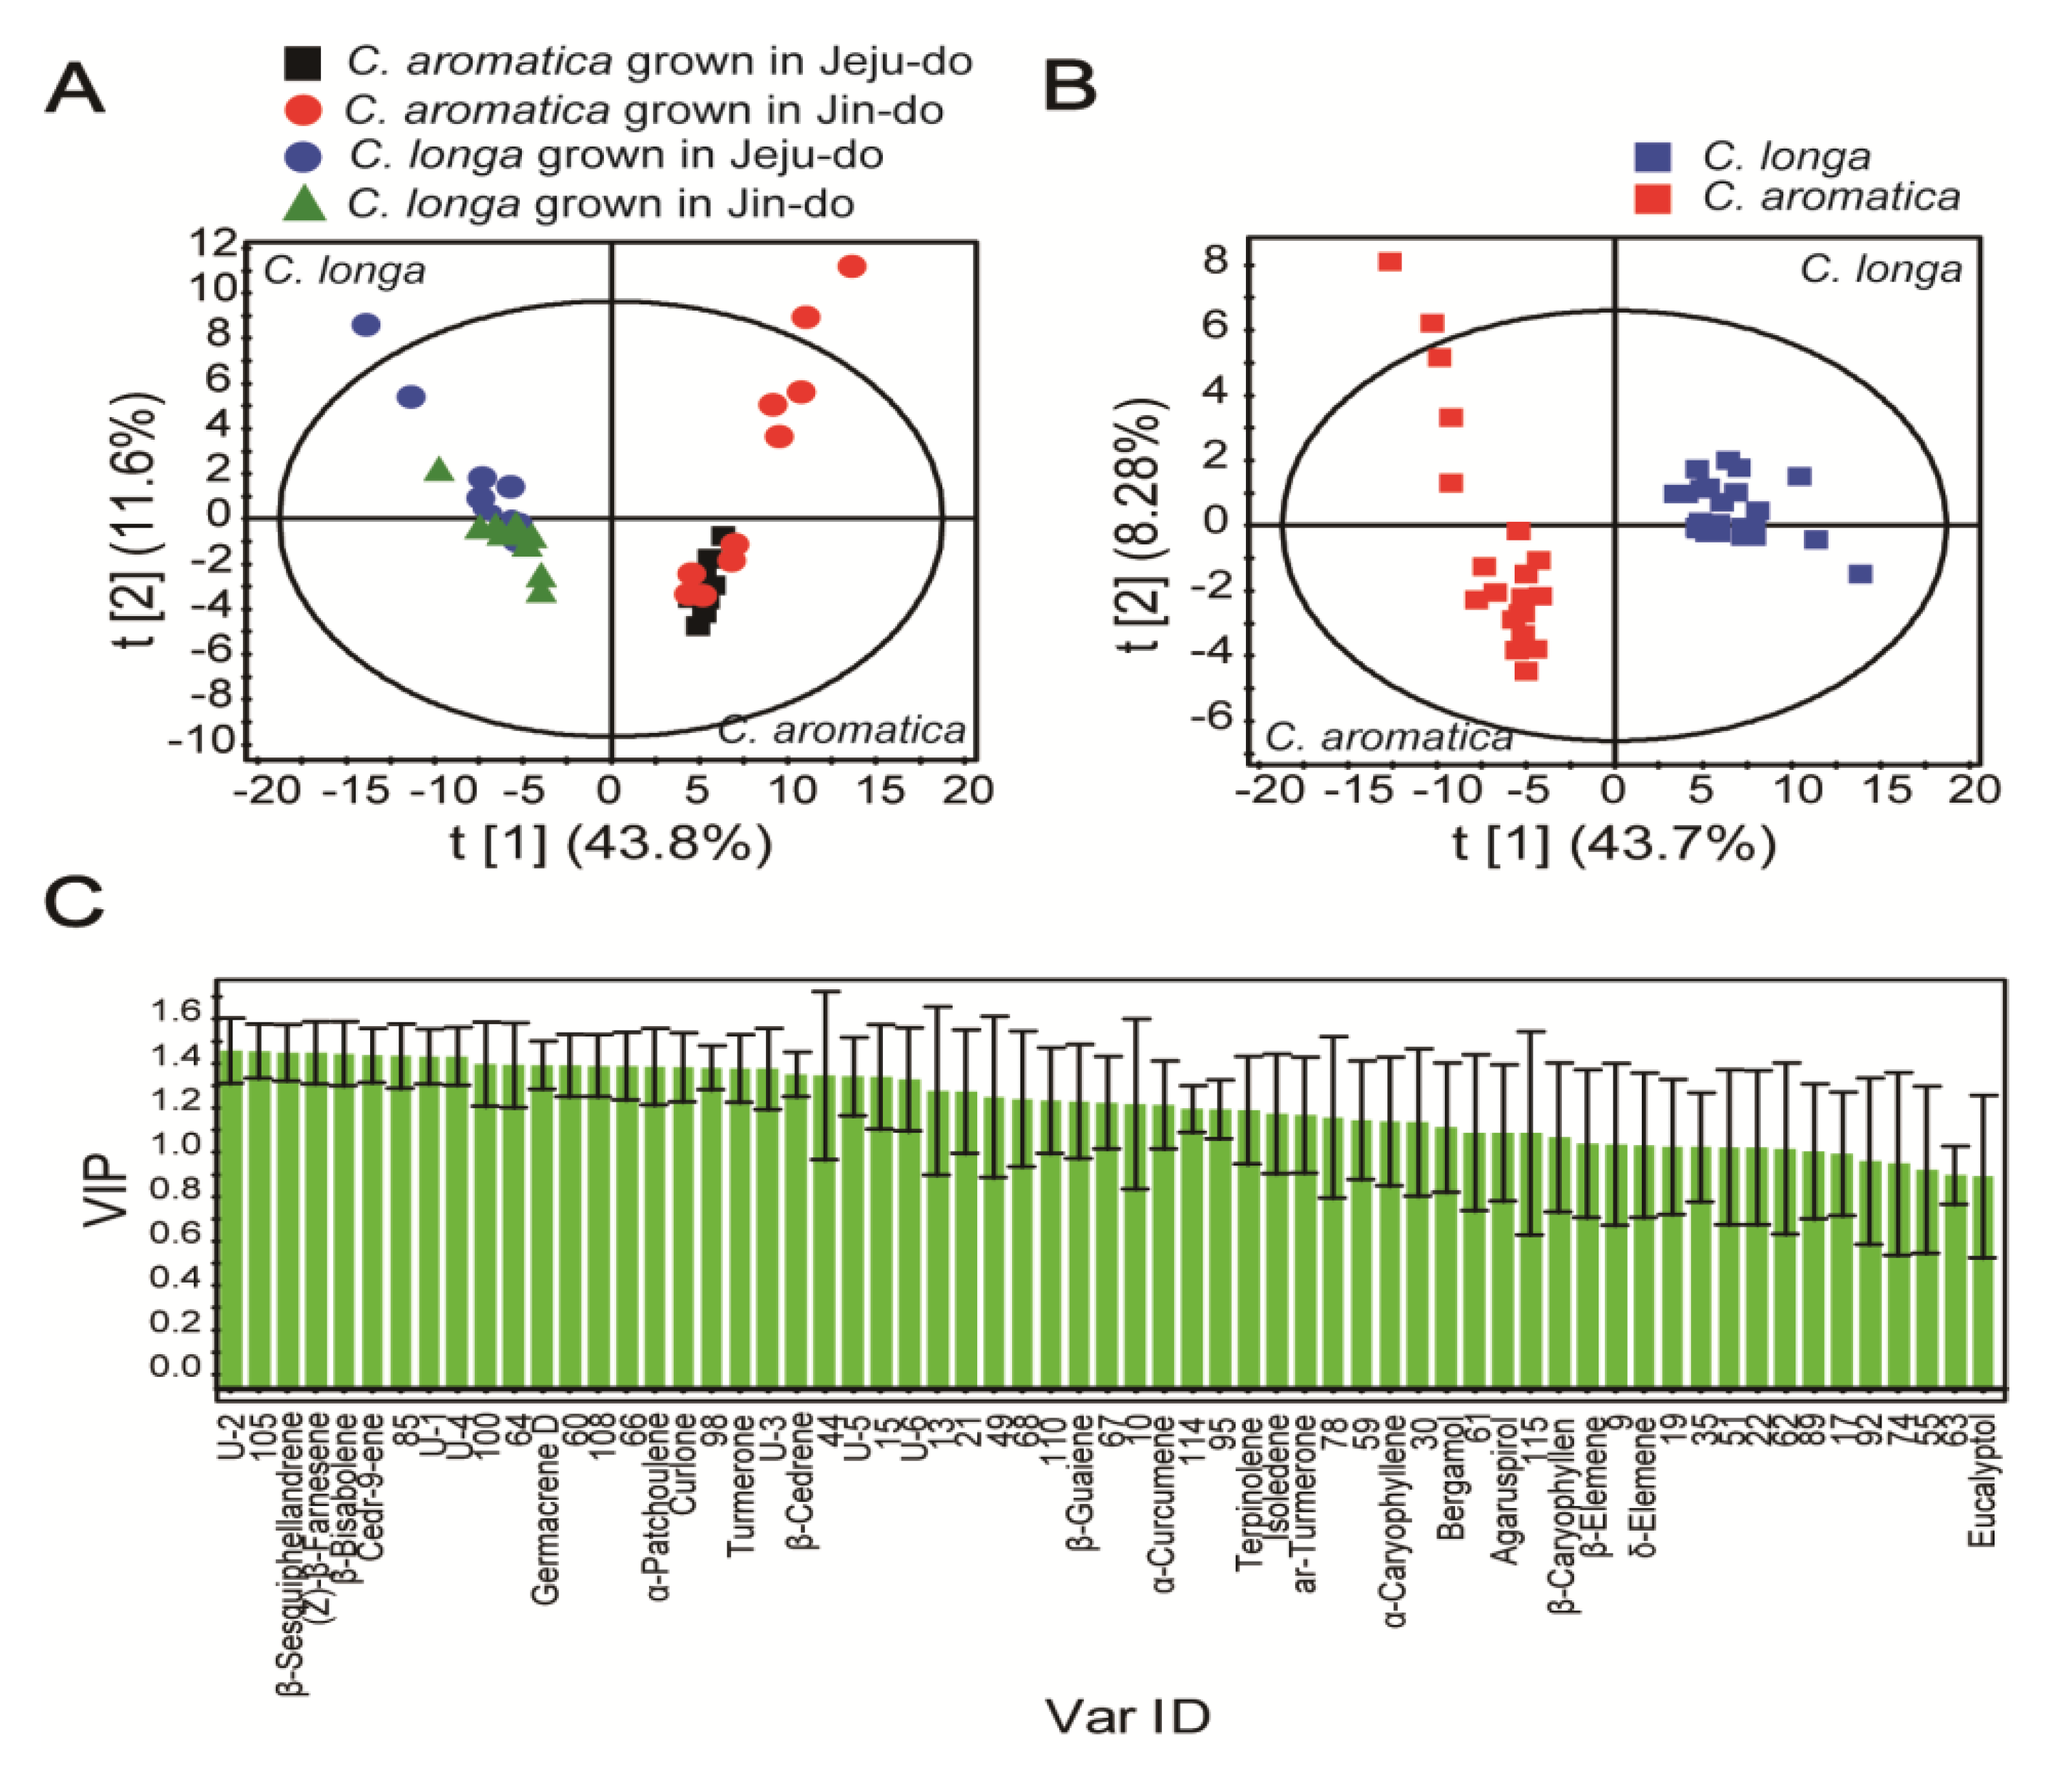
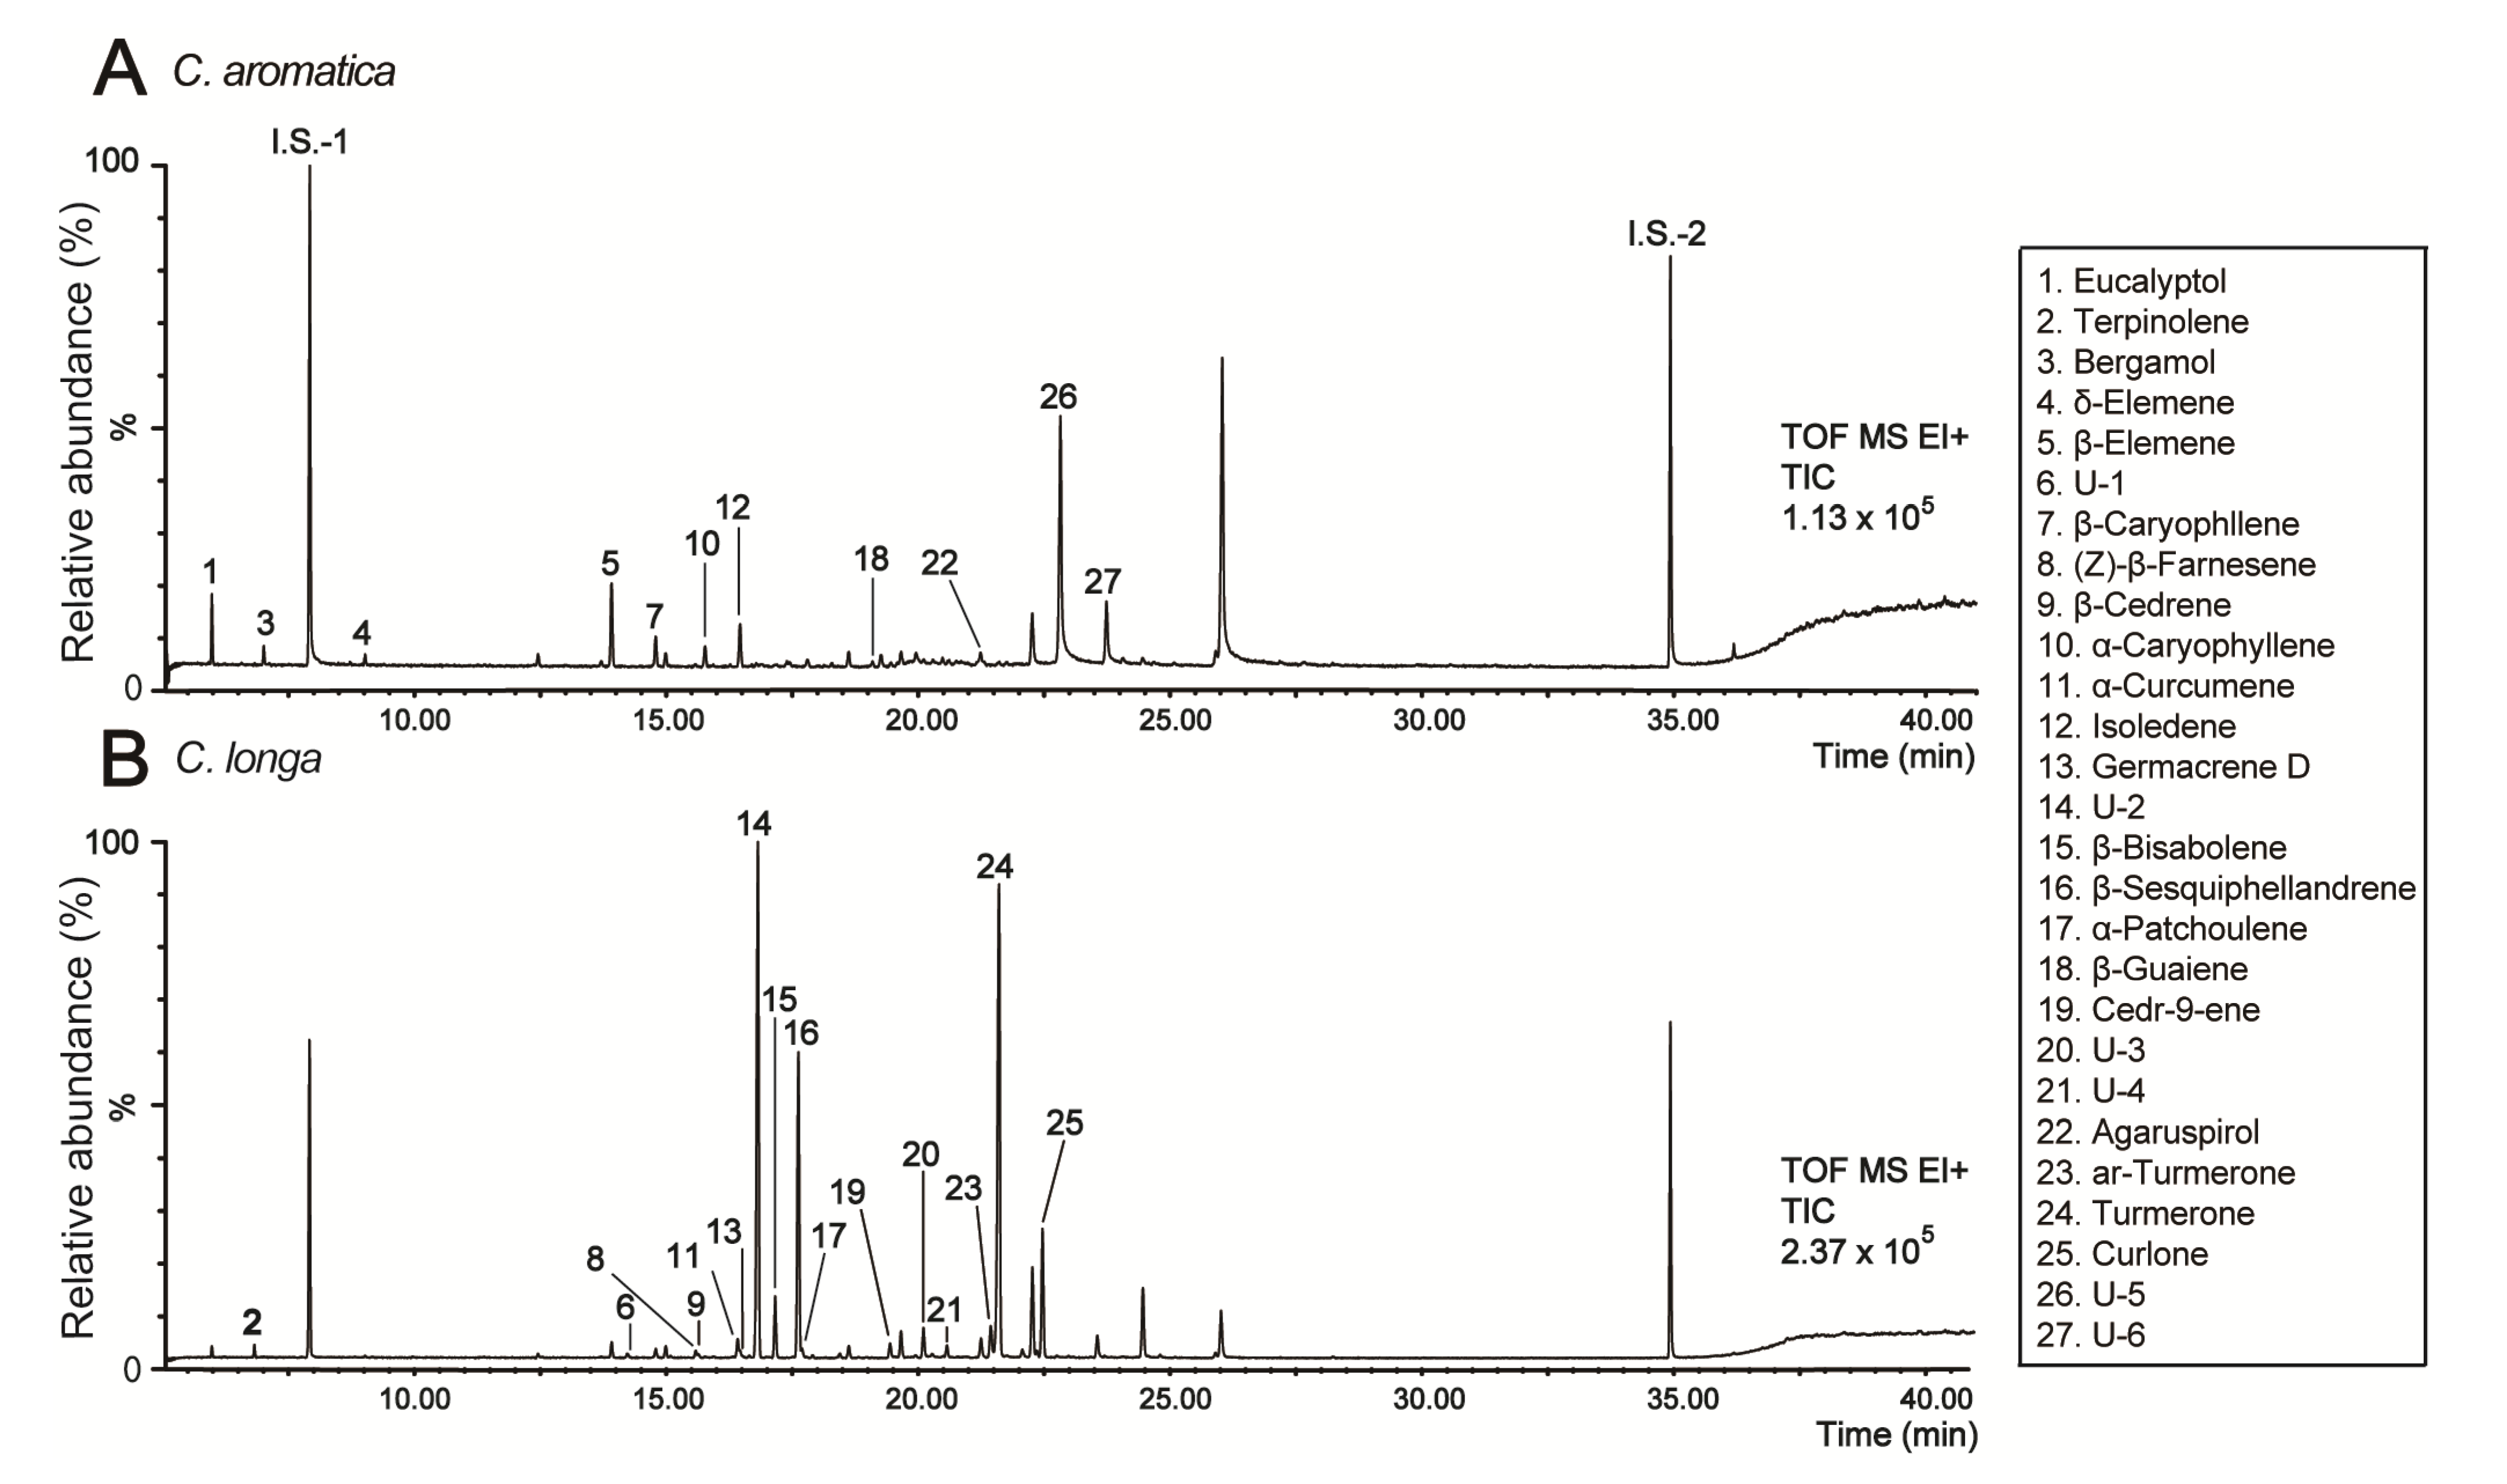
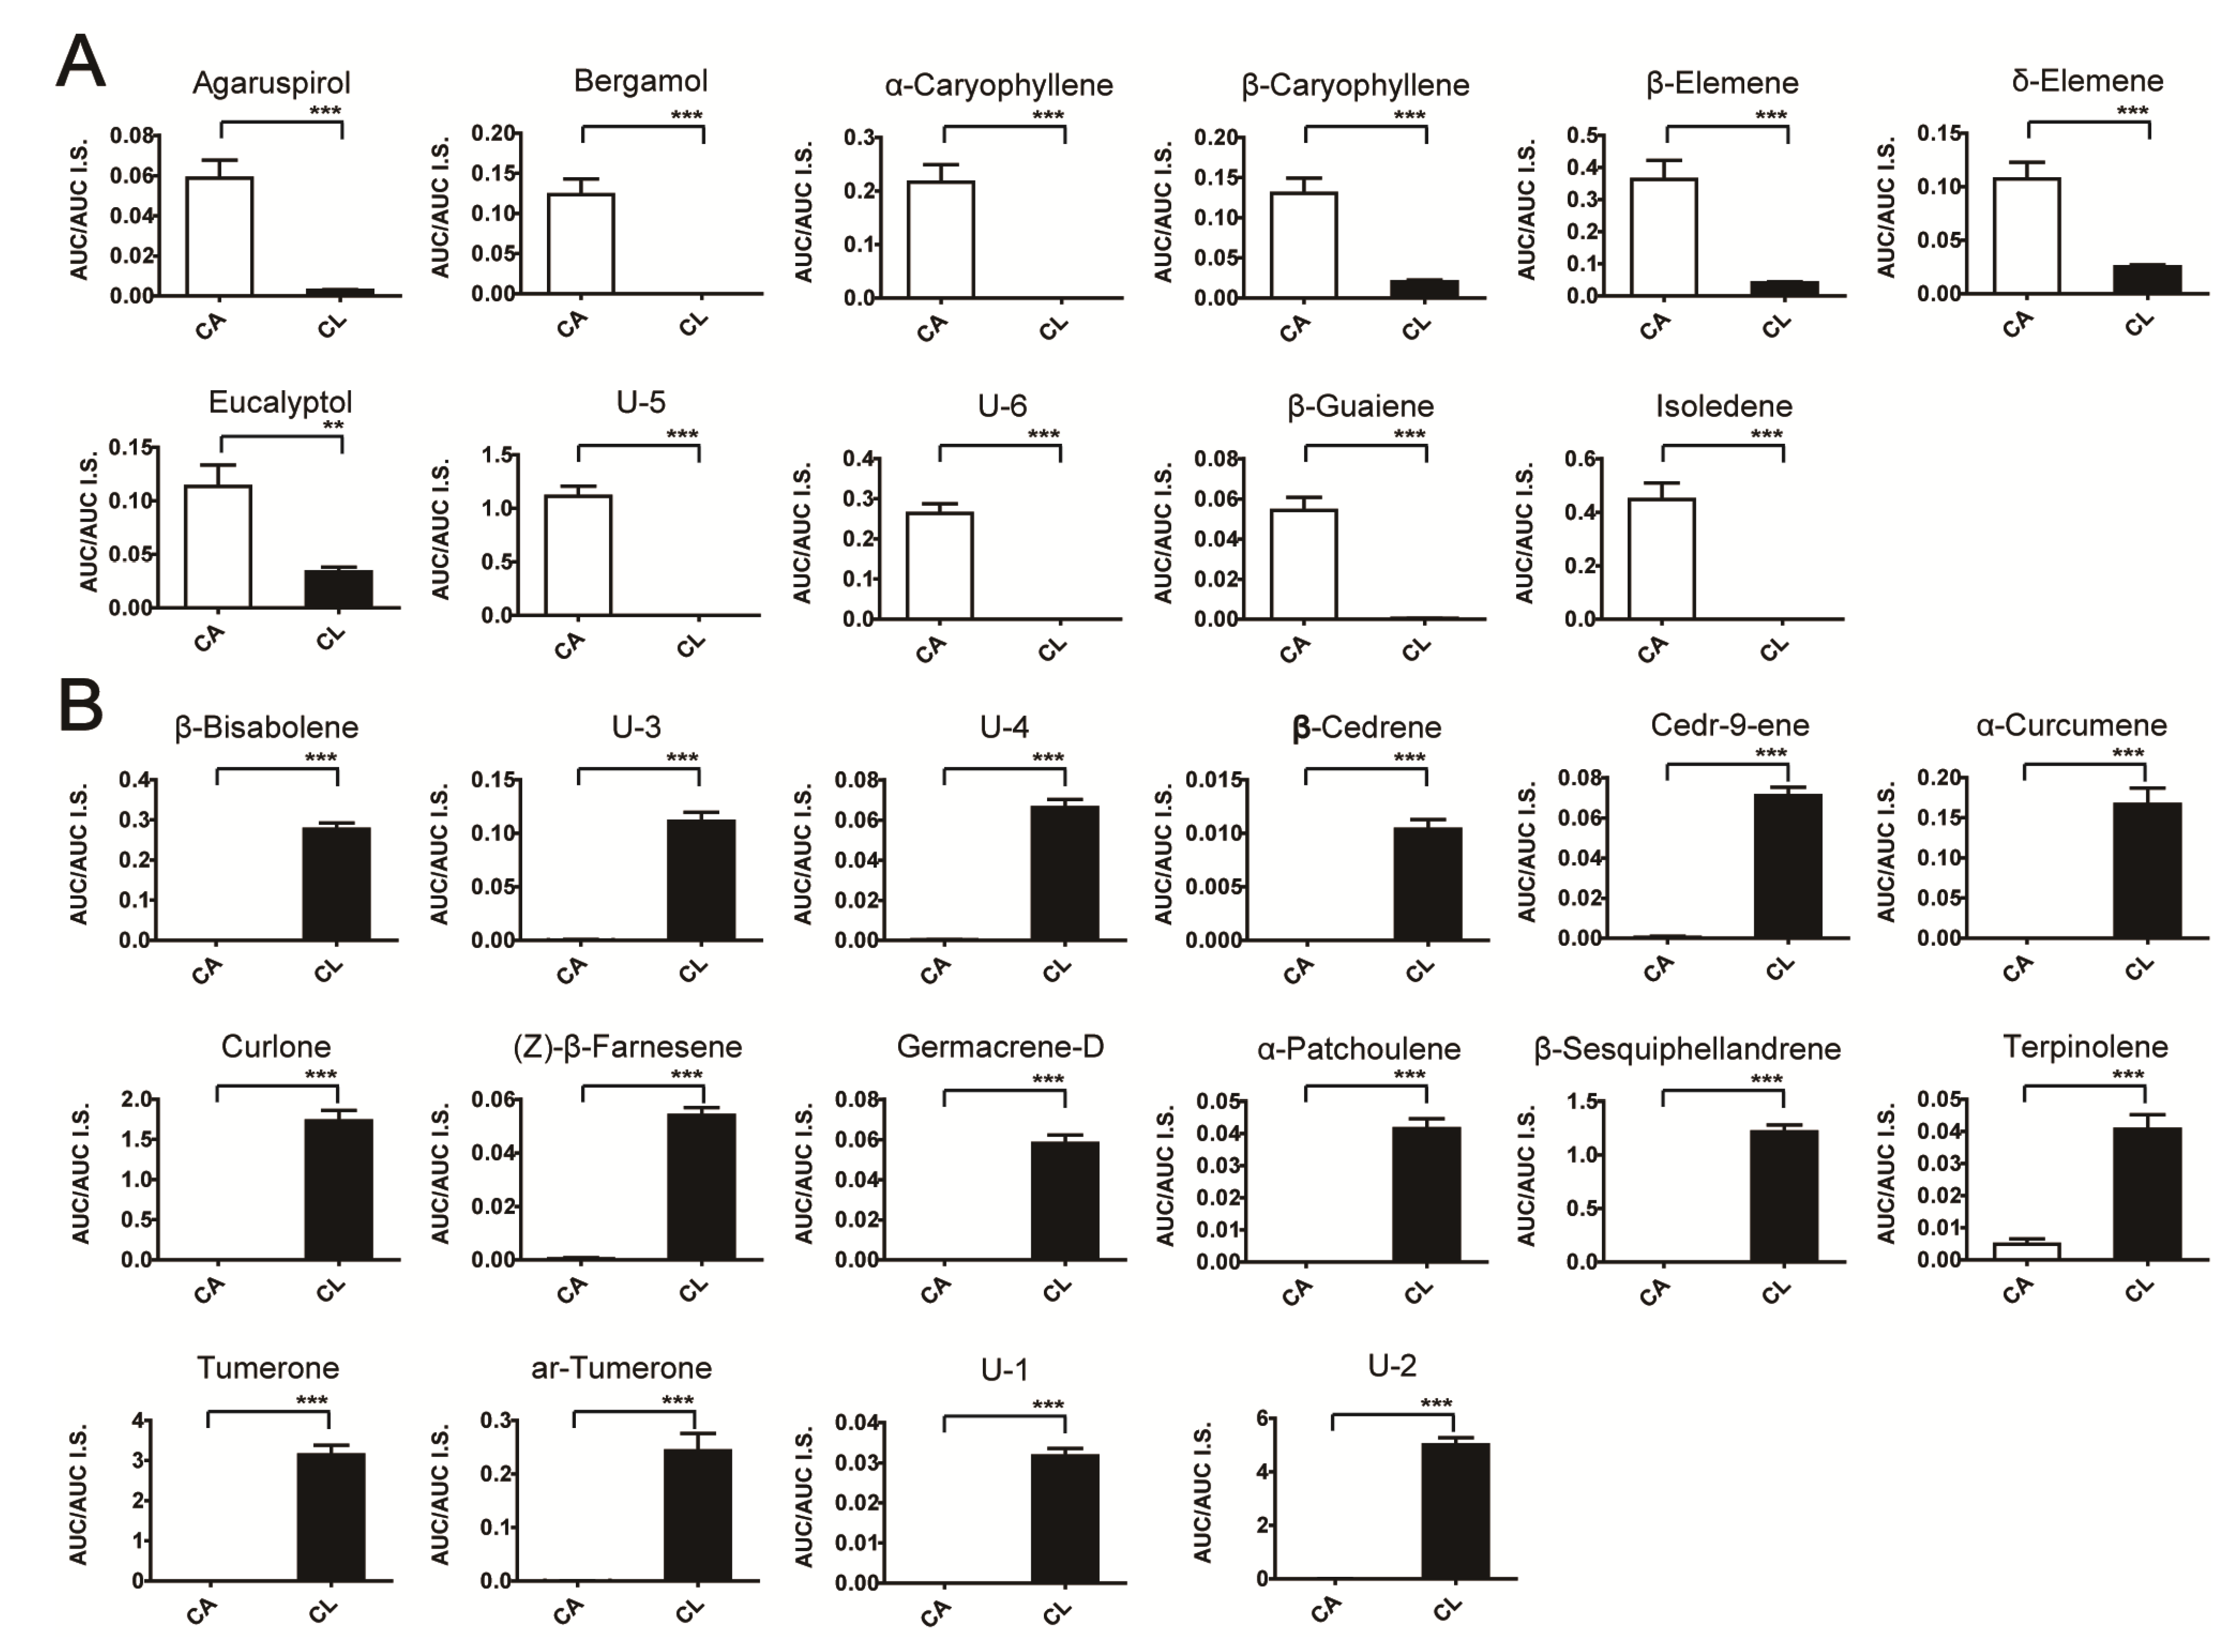
2.1. GC/TOF MS Analysis of Non-Polar Extracts in Curcuma Extracts

Based on spectral similarities and retention time-shift corrections, the integrated signal of the base peak ion was generated using the MarkerLynx software (Waters, Manchester, UK) and was subsequently used to generate multivariate statistics. A total of 121 features was obtained from GC/TOF MS spectra. Terpenoids (non-polar constituents) were included in Curcuma [27] and extracted using n-hexane [21,28]. Therefore, terpenoids were major components of non-polar extracts of Curcuma. To provide comparative interpretations and to visualize metabolic differences between Curcuma extracts grown in different areas, PCA and PLS-DA were applied to the GC/TOF MS spectrum data set. PCA score plots of GC/TOF MS spectra of Curcuma showed that the separation between C. longa and C. aromatica was clearer than between Jeju-do and Jin-do (Figure 1A). In addition, only t [1] (43.8% of variation) among the three t-axes generated using the PCA model showed significant differences between the two Curcuma species (p < 0.05). These results suggested that the species difference was larger than the geographical difference. This seems reasonable given that non-polar compounds are secondary metabolites and are not directly involved in the normal growth, development, or reproduction of an organism [29], and are restricted to a narrow set of compounds within a phylogenetic group [30]. Unique features were observed in the two Curcuma species (20 features for C. aromatica and 58 for C. longa), and a larger number of metabolites were present in C. longa than C. aromatica. These phenotypic variations in plant secondary chemicals arise from a combination of genetic, developmental and environmental sources [31]. Therefore, a greater number of rhizome essential oils are present in C. longa than C. aromatica, and so C. longa may have a stronger aromatic taste and more therapeutic potential than C. aromatica. Previous studies reported that non-polar compounds extracted from the rhizome of Curcuma species possessed antioxidant activities, and C. longa showed greater effectiveness than C. aromatica [32]. In addition, Ritwiz et al. revealed that among five species of Curcuma containing C. aromatica, C. longa had the highest antioxidant and antibacterial activities of leaf extract [33].
Figure 1. PCA score plot (A) derived from the GC/TOF MS spectra of non-polar Curcuma extracts from the two Curcuma species (C. longa and C. aromatica) grown at different locations: R2X = 0.623 and Q2 = 0.406; PLS-DA score (B) and VIP plots (C) derived from GC/TOF MS spectra of non-polar Curcuma extracts from the two Curcuma species grown at different locations: R2X = 0.584, R2Y = 0.982 and Q2 = 0.949. The ellipse represents the 95% confidence region for Hostelling’s T2. The y-axis of the VIP plot denotes the values of first variable importance in the projection in the VIP plot. U-1 to U-6 refer to unidentified compounds 1 to 6, respectively.
Molecules 19 09535 g001
To identify the Curcuma metabolites responsible for species differences, the PLS-DA score (Figure 1B) and variable importance in the projection (VIP) plot (Figure 1C) were generated. The PLS-DA model applied to the two Curcuma species showed a significant separation along the t [1] axis. R2X is the percentage of all GC/TOF MS response variables explained by the model. R2Y is the percentage of all observations or sample variables explained by the model. Q2 is the percentage of all observation or sample variables predicted by the model. The PLS-DA model showed an acceptable value of R2X (0.584), R2Y (0.982) and Q2 (0.949). Based on these results, 58.4% of response variables and 98.2% of observations were confidently explained to describe the difference between two Curcuma species. Moreover, a total of 94.9% of observations was predicted using this model. To validate PLS-DA model, permutation test using 100 random permutations was conducted (Figure S1). Therefore, the PLS-DA model can be used to discriminate and identify the two Curcuma species. VIP values were used to reflect the importance of variables in the model with respect to correlation with all responses and projections. The VIP reflects the influence of every term in the matrix X on the Y variables, where VIP values of ±1.0 are considered the most relevant for explaining Y [34].
Inspection of the VIP plot related to separation showed that 63 features had a VIP value >0.9, suggesting that changes in the concentration of these metabolites are significant (Figure 1C). The x-axis shows the 63 features labeled by chemical name, or arbitrarily assigned peak number for compounds that were not identified.
A statistical analysis was performed to investigate whether differences in metabolite concentrations were significant. Welch’s t-test was performed to examine significant differences in normalized peak intensities using methyl nonadecanoic acid (internal standard) between the two Curcuma species. A total of 96 features were identified as significant among the 121 features (p < 0.05). A total of 63 features with a VIP value above 0.9 and p-value less than 0.05 was selected and identified by searching the NIST mass spectral library. Several metabolites were verified using commercially available compounds and by performing analysis in chemical ionization mode. A total of 27 metabolites was identified, and of these, 26 metabolites (excluding eucalyptol) showed significant differences between groups after a Bonferroni correction for a p-value of 0.00041 (0.05/121) and a false discovery rate (FDR) <0.05 (Supplementary data, Table S1). In particular, the MS patterns of 27 metabolites showed at least 70% similarity to the library spectra (Table 1). Superscript a, b, and c represent similarities of 90%, 80%, and 70% with the library spectra, respectively. A total of six metabolites was labeled as unidentified in Table 1, and may be isomers or specific metabolites based on the fragmentation pattern: unidentified 1 and 2, α-zingiberene; unidentified 3 and 4, cedrene; unidentified 5 and 6, curdione. Typical total ion chromatograms of two Curcuma species (C. aromatica and C. longa grown in Jeju-do) from the nonpolar phase are shown in Figure 2. A comparison of C. aromatica (Figure 2A) and C. longa (Figure 2B) TICs showed the significantly different metabolites between the two Curcuma species. Specially, the bergamol (peak 3), α-caryophyllene (peak 10), isoledene (peak 12), unidentified 5 (peak 26) and unidentified 6 (peak 27) were found only in C. aromatica. In contrast, some volatile metabolites, such as (Z)-β-farnesene (peak 8), β-cedrene (peak 9), α-curcumene (peak 11), germacrene D (peak 13), β-bisabolene (peak 15), β-sesquiphellandrene (peak 16), α-patchoulene (peak 17), cedr-9ene (peak 19), aromatic (ar)-turmerone (peak 23), turmerone (peak 24), curlone (peak 25), unidentified 1 (peak 6), unidentified 2 (peak 14), unidentified 3 (peak 20), and unidentified 4 (peak 21) were detected only in C. longa. In total, 27 metabolites were quantified and shown in Figure 3. Peak intensities (analyte/internal standard) of 0 indicate that signals were below the detection limits or the metabolites were not detected in the Curcuma species. The metabolites detected in C. aromatica at higher concentrations included agaruspirol, bergamol, α-caryophyllene, β-caryophyllene, β-elemene, δ-elemene, unidentified 7, unidentified 8, β-guaiene, and isoledene. The metabolites present in C. longa at higher concentrations include β-bisabolene, unidentified 5, unidentified 6, β-cedrene, cedr-9-ene, α-curcumene, curlone, β-elemenone, (Z)-β-farnesene, germacrene D, α-patchoulene, β-sesquiphellandrene, terpinolene, turmerone, ar-turmerone, unidentified 1 and unidentified 3. Several of these metabolites were major volatile components in essential oils and natural phytochemicals known to have biological activity. Potent anti-inflammatory, antioxidant, and antimicrobial activities are important functions of terpenoids such as bergamol [35], curcumene [36], turmerone [37,38], germacrene D [39] and caryophyllene [40]. Curcuma oil containing ar-turmerone, α,β-turmerone, and curlone has been used as an effective and safe antiplatelet agent against intravascular thrombosis [41].
Table 1. Compounds in the Curcuma extracts identified using GC/TOF MS.
RT #Identified MetaboliteFormulaAccurate MassMain Fragments m/z (% bp) §
15.98Eucalyptol aC10H18O154.1358108.0945 (100); 154.1366 (96.7); 81.0707 (85.6)
26.81Terpinolene †bC10H16136.1252121.1021 (100); 136.1261 (80.7); 93.0701 (80.2)
37.01Bergamol cC12H20O2196.146393.0704 (100); 69.0709 (44.0); 79.0534 (27.1)
I.S.-17.912,5-Dimethylphenol (IS)C8H10O122.0732107.0501 (100); 122.0732 (95.6); 121.0664 (39.8)
412.44δ-Elemene bC15H24204.1878121.1027 (100); 136.1266 (60.4); 93.0707 (55.8)
513.90β-Elemene ‡aC15H24204.187893.0705 (100); 81.0710 (81.3); 147.1180 (68.7)
614.22U-1C15H24204.1878119.0862 (100); 93.0710 (92.0); 91.0545 (55.6)
714.78β-Caryophyllene bC15H24204.1878133.1020 (100); 91.0545 (84.8); 93.0713 (83.0)
815.58(Z)-β-Farnesene bC15H24204.187869.0703 (100); 93.0712 (87.9); 133.1023 (59.6)
915.63β-Cedrene cC15H24204.1878161.1329 (100); 69.0708 (86.3); 91.0546 (79.0)
1015.77α-Caryophyllene bC15H24204.187893.0705 (100); 121.121.1014 (39.1); 80.0632 (26.9)
1116.41α-Curcumene bC15H22202.1722119.0865 (100); 132.0939 (82.1); 105.0709 (60.4)
1216.47Isoledene bC15H24204.1878161.1341 (100); 105.0706 (41.1); 204.1890 (31.0)
13Germacrene D bC15H24204.1878161.1333 (100); 105.0705 (37.5); 91.0543 (31.3)
1416.81U-2C15H24204.1878119.0844 (100); 93.0699 (82.3); 91.0544 (51.8)
1517.15β-Bisabolene aC15H24204.187893.0701 (100); 69.0700 (76.99); 204.1880 (57.02)
1617.62β-Sesquiphellandrene bC15H24204.187869.0707 (100); 91.0558 (98.5); 93.0713 (93.2)
1717.68α-Patchoulene cC15H24204.187893.0706 (100); 107.0861 (98.7); 135.1187 (58.1)
1819.08β-Guaiene cC15H24204.1878161.1333 (100); 105.0709 (43.6); 204.1878 (36.1)
1919.44Cedr-9-ene bC15H24204.1878119.0863 (100); 93.0702 (64.2); 105.0707 (46.10)
2020.1U-3C15H24204.1878119.0864 (100); 93.0703 (90.5); 91.0544 (70.3)
2120.56U-4C15H24204.1878119.0868 (100); 93.0706 (81.1); 91.0544 (50.3)
2221.23Agaruspirol cC15H26O222.1984161.1336 (100); 204.1890 (98.1); 189.1658 (84.3)
2321.43ar-Turmerone bC15H20O216.1514119.0861 (100); 83.0494 (91.6); 216.1524 (49.3)
2421.6Turmerone bC15H22O218.1671105.0705 (100); 83.0499 (86.8); 120.0940 (59.0)
2522.47Curlone bC15H22O218.1671120.0937 (100); 83.0499 (27.5); 105.0705 (25.0)
2622.81U-5C15H24O2236.1787180.1146 (100); 167.1069 (70.7); 109.0656 (35.6)
2723.74U-6C15H24O22361791180.1147 (100); 167.1079 (71.3); 109.0653 (33.4)
I.S.-234.93Methyl nonadecanoate (IS)C20H40O2312.302874.0361 (100); 87.0444 (87.5); 312.2987 (86.9)
# indicates the retention time of the compounds eluted using a DB-5 MS capillary column; and represent metabolites verified using authentic reference compounds and chemical ionization mode, respectively; The compounds indicated by a, b, and c were identified with probabilities of 90%, 80%, and 70%, respectively; § m/z, relative intensity to base peak (% bp) shown in parenthesis. U-1 to U-6 refer to unidentified compounds 1 to 6, respectively.
Terpenoids are the major phytochemicals in hexane extracts of Curcuma. Among the classes of terpenoids, monoterpenoids (C10), sesquiterpenoids (C15) and diterpenoids (C20) were detected in this study. The levels of these terpenoids in both C. longa and C. aromatica did not show clear differences between locations. However, we found clear differences in the levels of these terpenoids between C. longa and C. aromatica. Despite these distinct differences, unique patterns derived from classes of terpenoids were not observed. Based on these results, some classes of terpenoids, including C10, C15 and C20, were strongly affected by species variations. Previous studies reported that the levels of constituents of essential oils (non-polar extract) vary between Curcuma species [42], which is in agreement with our report.
Figure 2. Representative GC/TOF MS chromatographic profiles of non-polar metabolites from a hexane extract of Curcuma species: 1, Eucalyptol; 2, Terpinolene; 3, Bergamol; 4, δ-Elemene; 5, β-Elemene; 6, U-1; 7, β-Caryophyllene; 8, (Z)-β-Farnesene; 9, β-Cedrene; 10, α-Caryophyllene; 11, α-Curcumene; 12, Isoledene; 13, Germacrene D; 14, U-2; 15, β-Bisabolene; 16, β-Sesquiphellandrene; 17, α-Patchoulene; 18, β-Guaiene; 19, Cedr-9-ene; 20, U-3; 21, U-4; 22, Agaruspirol; 23, ar-Turmerone; 24, Turmerone; 25, Curlone; 26, U-5; 27, U-6; The labeled chemicals were identified with p-values less than 0.05 and VIP values greater than 0.9. U-1 to U-6 refer to unidentified compounds 1 to 6, respectively.
Molecules 19 09535 g002

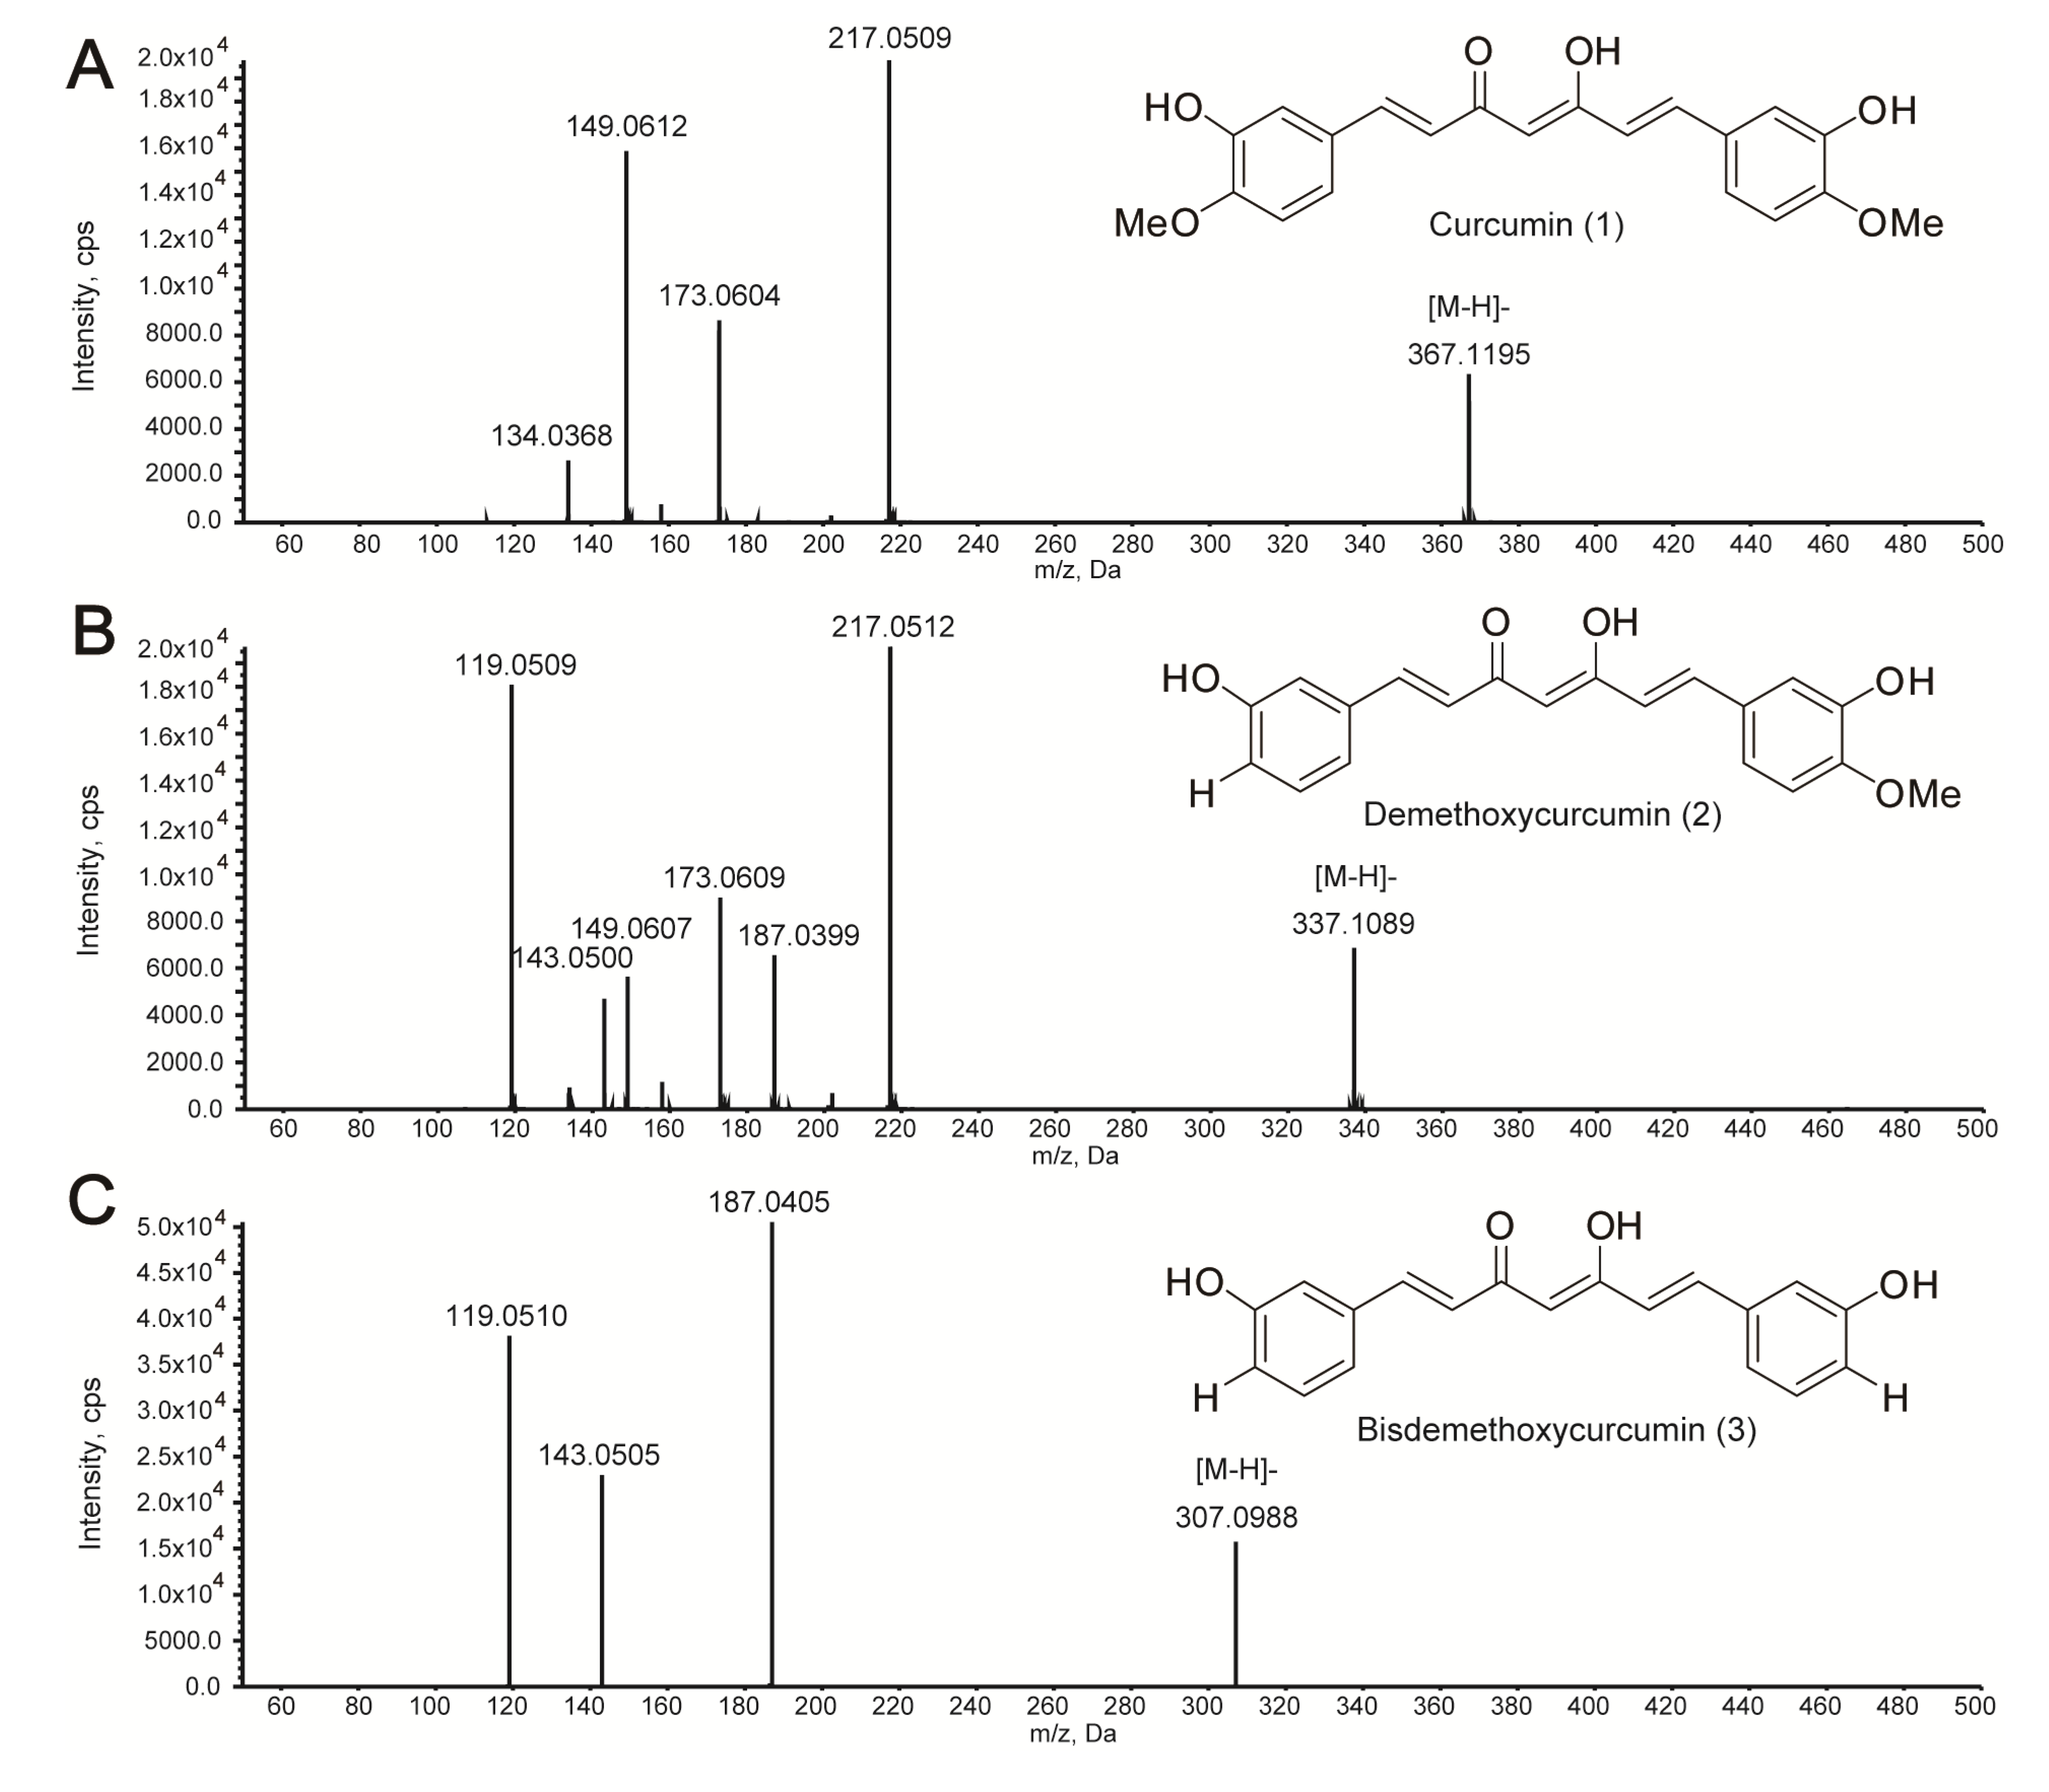
2.2. Quantitative Analysis of Curcuminoids in Curcuma Species Using UPLC/Q-TOF MS

The high-resolution multiple reaction monitoring-like (MRMHR) workflow was used to selectively quantify curcuminoids within complex mixtures as it approaches an MRM-type experiment, providing a high-resolution full fragment ion spectra. This is termed MRMHR because of the added high-resolution mass spectrometry (HRMS) selectivity of the product ion. After acquisition, high-resolution extracted ion chromatograms (XICs) of several fragment ions were generated and integrated in a similar fashion to the processing of triple-quadrupole MRM data. When using the HRMS-MRM scan (aka MRMHR) for small molecule quantitation, no MS method development is required [43].
Curcuminoids, including curcumin (1), demethoxycurcumin (2), and bisdemethoxycurcumin (3), are the major diarylheptanoid compounds present in Curcuma species, and many studies have attempted to identify and quantify these compounds [21,23,44]. Despite the relatively low sensitivity of (−)ESI compared to (+)ESI, negative mode (−)ESI-MS was effective in terms of identifying diarylheptanoids from turmeric. Diarylheptanoids can be detected by (−)ESI-MS because of the presence of phenolic hydroxyl groups, which enables these compounds to be easily ionized in (−)ESI mode [41]. The precursor ions of curcuminoids were detected as [M − H] at m/z 367.1195 for curcumin, 337.1089 for demethoxycurcumin, and 307.0988 for bisdemethoxycurcumin (Figure 4).
Figure 3. Metabolites detected in non-polar extracts of C. aromatica (A) and C. longa (B) at higher concentrations based on the t-test (p < 0.05) using GC/TOF MS. CA and CL indicate C. aromatica and C. longa, respectively. Error bars indicate ± standard errors. *, **, and *** represent p < 0.05, p < 0.01, and p < 0.001, respectively, as determined by Welch’s t-test. U-1 to U-6 refer to unidentified compounds 1 to 6, respectively.
Molecules 19 09535 g003
Quantification was performed using an external calibration curve with an internal standard, DSS (25 ng/mL), for instrument/analyst error correction. The relative response was calculated by dividing the area of each analyte by the area of the internal standard. Calibration curves, with concentrations ranging from 1.25 to 500 ng/mL, were generated using a combined standards solution (Table 2). The linear ranges used depended on the curcuminoid concentration in Curcuma extracts. Regression coefficients for calibration curves were at least 0.994 within this concentration range. The limit of quantification (LOQ) for curcuminoids was 0.5 ng/mL, which was also the lowest concentration in the calibration curve for demethoxycurcumin and bisdemethoxycurcumin.
Figure 4. Spectra of curcuminoid compounds: (A) curcumin (1); (B) demethoxycurcumin (2); (C) bisdemethoxycurcumin (3).
Molecules 19 09535 g004
The concentrations of curcuminoids in Curcuma extract, measured as described previously, are shown in Table 2. Of the curcuminoids, the curcumin concentration was highest in Curcuma extracts, while that of bisdemethoxycurcumin was lowest. The bisdemethoxycurcumin concentration in all Curcuma extracts was below the limit of quantification. Additionally, the demethoxycurcumin concentration in C. aromatica was uniformly higher than that in C. longa. This is not in agreement with a previous study in which the curcuminoid content of C. longa was higher than that of C. aromatica [45]. However, Curcuma species show variation in the contents of curcuminoids in rhizomes between varieties, locations, source, and cultivation conditions [24,46]. Because of this sensitivity to environmental variability, the curcuminoid contents of the Curcuma species used in this study may differ from previous reports. This result may be unique to Curcuma species grown in South Korea.
Table 2. Calibration parameters and curcuminoid concentrations in Curcuma extracts.
SamplesCalibration ParametersC. aromatica Grown in Jeju-doC. aromatica Grown in Jin-doC. longa Grown in Jeju-doC. longa Grown in Jin-do
Linear Range (ng/mL)R2a LOQ (ng/mL)Mean ± SE (μg/mg)b BQL (n)Mean ± SE (μg/mg)BQL (n)Mean ± SE (μg/mg)BQL(n)Mean ± SE (μg/mg)BQL (n)
Curcumin (1)25–5000.99890.51350.49 ± 72.660239.24 ± 192.8602591.43 ± 275.5401240.38 ± 167.190
Demethoxycurcumin (2)0.5–1250.99990.5276.60 ± 37.330451.60 ± 26.79015.49 ± 5.52543.56 ± 0.009
Bisdemethoxycurcumin (3)0.5–50.99440.5-10-10-10-10
a LOQ: limit of quantification; b BQL: below the quantification limit.
The presence of curcuminoids in Curcuma extracts is an important determinant of bioactivity because curcuminoids, especially curcumin, possess a wide range of pharmacological activities. Although C. longa has ~10-fold more curcumin than C. aromatica [47], the total curcuminoid concentration differed only slightly between the two species in this study. A marked difference was observed between plants grown at different locations in terms of the curcumin concentration, the major compound in curcuminoids. Therefore, the curcuminoid content is affected by geographical region and species, although secondary metabolites are not affected by the growth environment.

3. Experimental Section

3.1. Chemicals and Reagents

Aceronitrile, hexane, and methanol (HPLC grade) were purchased from Burdick & Jackson (Muskegon, MI, USA). Distilled water was filtered using a Milli-Q Reagent Water System (Millipore, Billerica, MA, USA). Curcumin (96.4%), demethoxycurcumin (91.8%) and bisdemethoxycurcumin (91.8%) were obtained from Chromadex Inc. (Santa Ana, CA, USA). 2,5-Dimethylphenol, methyl nonadecanoic acid, sodium sulfate, and terpinolene were purchased from Sigma-Aldrich (St. Louis, MO, USA).

3.2. Plant Material

The rhizomes of Curcuma aromatica and Curcuma longa were obtained from the Jeju-do and Jin-do provinces of South Korea; 10 samples per subset were used to show significant differences between individuals. These 40 samples were cultivated under identical growth conditions in different regions from May to October 2010, and harvested from each region at the same time by the Korea Institute of Oriental Medicine. The rhizomes of Curcuma were chopped into small pieces, air-dried, and ground into powder. All dried samples were stored at −80 °C until required for GC- and LC-MS analysis.
The Curcuma species were identified morphologically based on the “Classification and Identification Committee of the Korea Institute of Oriental Medicine”, which is composed of nine experts in the fields of plant taxonomy, botany, pharmacognosy and herbalogy, and were confirmed by genomic profiling. Voucher specimens of plant materials were assigned the following accession numbers (C. aromatica-Jin-do KIOM201001003214-3216, C. aromatica-Jeju-do KIOM201001003311-3313, C. longa-Jin-do KIOM201001003217-3220, C. longa-Jeju-do KIOM201001003316-3319) and were preserved in the Herbarium of the Korea Institute of Oriental Medicine.

3.3. Procedures for Preparation of Sample Solution

3.3.1. Procedures for Preparation of Sample Solution for GC/TOF MS Analysis

To extract non-polar metabolites, dried Curcuma rhizomes (50 mg) and internal standard solutions (500 μL) were transferred into 8-mL glass vials. Internal standard solutions were composed of methyl nonadecanoic acid (1 mg/mL) and 2,5-dimethylphenol (1 mg/mL) in hexane. After addition of methanol-water (2 mL, 1:1, v/v), the sample was vortexed for 1 min and sonicated for 20 min at 40 °C. To extract volatile metabolites, the non-polar solvent n-hexane (2 mL) was added and vortexed twice for 1 min each. The combined extracts were then placed at room temperature for 20 min, with the two phases separated by centrifugation at 2499 ×g for 5 min at 25 °C. The supernatant (non-polar phase) was transferred into a new glass vial and the remaining water was removed using anhydrous sodium sulfate. A micropipette, whose tip was fitted with a small piece of cotton, was used to filter out dust particles and impurities from the aliquot. A portion of the extract (100 μL) was diluted with n-hexane (100 μL) and transferred to a 2-mL GC vial with an infused insert.

3.3.2. Procedures for Preparation of Sample Solution for UPLC/Q-TOF MS Analysis

Frozen Curcuma rhizome (100 mg) and sodium 2,2-dimethyl-2-silapentane-5-sulfonate (10 µL, 0.5 mg/mL) in methanol-water (1:1, v/v) (internal standard) were transferred to a 8-mL glass vial and methanol-water (1 mL, 1:1, v/v) was added. The sample was then mixed for 1 min, sonicated for 20 min at 40 °C, and centrifuged at 2499 ×g for 15 min at 25 °C. To remove any particles from the samples, crude supernatant was filtered using a 0.22-µm PTTE syringe filter (Millipore); the corresponding rhizome extracts (5 µL) were then individually diluted with methanol-water (995 μL, 1:1, v/v) and transferred to an autosampler vial.

3.4. Instrumental Analysis

3.4.1. Instrumental Analysis of Non-Polar Extracts by GC/TOF MS

GC/TOF MS analysis was conducted using a 7890A gas chromatograph (Agilent Technologies, Palo Alto, CA, USA) equipped with a GCT premier TOF mass spectrometer (Waters, Manchester, UK). The DB-5 MS capillary column (30 m × 0.25-mm i.d., 0.25-µm film thickness, 5% diphenyl-95% dimethylsiloxane phase) was obtained from J&W Scientific (Folsom, CA, USA). The GC oven temperature began at 60 °C for 2 min and then increased to 100 °C at a rate of 20 °C/min and then to 220 °C at a rate of 4 °C/min. The final temperature of the program (300 °C) was attained at a rate of 25 °C/min and maintained for 5 min. Samples (1 µL) with a split ratio of 1:5 were injected. Helium was used as carrier gas at a constant flow rate of 1 mL/min. The temperature of the GC injector port and MS interface were set to 250 °C and 280 °C, respectively. MS acquisition conditions used were an electron impact (EI) ionization of 70 eV, a detector voltage of 2300 V, an inter-scan delay of 0.05 s, a scan time of 0.15 s, and a mass range of 50–800 atomic mass units (amu) at 5 spectra/s.
The GC/TOF MS raw data were analyzed using the MarkerLynx Applications Manager version 4.1 (Waters) for mass spectral peak identification and quantification with the following parameters: retention-time range, 5–36 min; mass range 50–600 Da; mass tolerance, 0.05; noise elimination level, 10.00; RT tolerance, 0.05 min. The internal standard (methyl nonadecanoic acid) was used for data normalization [19] and peak retention time alignment. The resulting matrix contains peak index (retention time-m/z pairs), sample names (observations), and ion intensity information (variables). The matrix was further reduced by removing any peaks with missing values (ion intensity = 0) in more than 80% of all samples and combining peaks within an RT window of 0.1 min. The ion peaks generated using the internal standard were also removed. Compounds were identified by comparing mass spectra with the National Institute of Standards and Technology mass spectral library (National Institute of Standards and Technology (NIST) MS search 2.0).
The resulting GC/TOF MS data matrices were imported into SIMCA-P version 12.0 (Umetrics, Umeå, Sweden) for chemometric analyses. Prior to multivariate analysis, all imported data sets were scaled using the unit variance (UV) scaling method, where each variable was divided by the standard deviation of the column values and centered, which provides base weight to the GC/TOF MS data set. Principal components analysis (PCA) was used to classify individual compounds within several reference groups. Partial least-squares discriminant analysis (PLS-DA) was used for multivariate pattern recognition analysis and supervised pattern recognition methods to examine intrinsic variation within the data set. The fit of the model to the data was described by R2 and Q2 values (where R2 describes the goodness of fit and Q2 indicates predictability).
Welch’s t-test was performed using Microsoft Office Excel 2007 (Microsoft Corporation, Alberquerque, NM, USA) to determine whether differences in metabolite levels among samples were significant. The differences were tested to a 95% probability level (p < 0.05). For multiple comparisons, Bonferroni’s corrections were applied and false discovery rates (FDRs) were computed from the overall p-values.

3.4.2. Instrumental Analysis of Curcuminoids by UPLC/Q-TOF MS

Three curcuminoids (curcumin (1), demethoxycurcumin (2), and bisdemethoxycurcumin (3)) were analyzed using UPLC/Q-TOF MS. Separation of analytes was performed using a UPLC system (Acquity UPLC system; Waters) equipped with a ethylene bridged hybrid (BEH) C18 column that was 100 × 2.1 mm with a 1.7-µm particle size (Waters). The column temperature was set to 40 °C and the auto-sampler was maintained at 10 °C. The end sample (10 µL) was injected using the full-loop method. The mobile phase consisted of HPLC-grade water with 0.1% formic acid (A) and acetonitrile with 0.1% formic acid (B), and was eluted at 0.45 mL/min. The initial composition of mobile phase B was held at 5% for 1 min and increased to 95% after 6 min. To equilibrate the separation system, the mobile phase composition was reset to 5% for 3 min.
This UPLC system was connected to a triple TOF 5600 MS/MS system (AB Sciex, Framingham, MA, USA) equipped with an electrospray DuoSpray ion source (AB Sciex) operating in negative ion mode. The total ion chromatogram was acquired using the following operating parameters: a capillary voltage of −4500 V, a nebulizer pressure of 50 psi, a drying gas pressure of 50 psi, a curtain gas pressure of 30 psi, a source temperature of 500 °C, a declustering potential of −70 eV, and a collision energy of −10 eV. To obtain reliable results, specific values of collision energy (CE) were used. The CE for curcumin (1), demethoxycurcumin (2), bisdemethoxycurcumin (3), and the internal standard (DSS) were set at −20, −20, −18, and −30 eV, respectively, with an accumulation time of 0.1 s. Mass spectra were acquired from m/z 50 to m/z 500 for 10 min. Accurate mass measurements of each peak were obtained using an automated calibrant delivery system (CDS) with 0.2 mL/min of a negative APCI calibrating solution (AB Sciex) containing several internal reference masses (m/z 145, m/z 265, m/z 278, m/z 353, m/z 404, m/z 441, m/z 617, and m/z 793).
Stock solutions containing curcuminoids (curcumin (1), demethoxycurcumin (2), and bisdemethoxycurcumin (3)) and an internal standard (DSS) of varying concentrations were used to construct calibration curves. Each concentration of the mixed standard solution was injected in duplicate, and a calibration curve was constructed by plotting the peak area/internal standard peak ratio versus the concentration of each analyte using the MultiQuent™ software, version 2.1 (AB Sciex, Framingham, MA, USA).

4. Conclusions

In summary, we conducted metabolite profiling of two Curcuma species using GC and LC-MS to examine differences between species and geographical location. The use of GC and LC-MS allows for analysis of both terpenoids and curcuminoids in Curcuma extracts. GC/TOF MS coupled with multivariate analysis showed that terpenoids are important markers for characterizing the two Curcuma species. Target metabolite profiling of curcuminoids using UPLC/Q-TOF MS showed that the content of curcuminoids within plants are affected by geographical region as well as species. Significant differences in terpenoids and curcuminoids indicate that different Curcuma species or Curcuma grown in different locations may exhibit different biological properties. In addition, our study suggests that metabolite profiling, combined with GC and LC-MS, is a useful tool for analysis of the chemical composition of Curcuma species grown at different locations.

Supplementary Materials

VIP value, p-value, and q-value of 63 significantly different features between C. longa and C. aromatica obtained from the GC/TOF MS spectra (Table S1). Supplementary materials can be accessed at: https://www.mdpi.com/1420-3049/19/7/9535/s1.

Acknowledgments

This work was supported by the Korea Basic Science Institute (T3473B) and the Korea Institute of Oriental Medicine (K14410, K14411, and K13020).

Author Contributions

Jueun Lee and Youngae conducted the experiments and data analysis. Jeoung-Hwa Shin conducted the data generation and interpretation. Ho Kyoung Kim and Byeong Cheol Moon collected plant materials and confirmed species. Geum-Sook Hwang and Do Hyun Ryu designed the study and wrote the manuscript.

Conflicts of Interest

The authors declare no conflict of interest.

References

  1. Wilson, B.; Abraham, G.; Manju, V.S.; Mathew, M.; Vimala, B.; Sundaresan, S.; Nambisan, B. Antimicrobial activity of Curcuma zedoaria and Curcuma malabarica tubers. J. Ethnopharmacol. 2005, 99, 147–151. [Google Scholar] [CrossRef]
  2. Lantz, R.C.; Chen, G.J.; Solyom, A.M.; Jolad, S.D.; Timmermann, B.N. The effect of turmeric extracts on inflammatory mediator production. Pytomedicine 2005, 12, 445–452. [Google Scholar] [CrossRef]
  3. Miquel, J.; Bernd, A.; Sempere, J.M.; Dı́az-Alperi, J.; Ramı́rez, A. The curcuma antioxidants: Pharmacological effects and prospects for future clinical use. A review. Arch. Gerontol. Geriatr. 2002, 34, 37–46. [Google Scholar] [CrossRef]
  4. Jayaprakasha, G.K.; Rao, L.J.; Sakariah, K.K. Antioxidant activities of curcumin, demethoxycurcumin and bisdemethoxycurcumin. Food Chem. 2006, 98, 720–724. [Google Scholar] [CrossRef]
  5. Tiyaboonchai, W.; Tungpradit, W.; Plianbangchang, P. Formulation and characterization of curcuminoids loaded solid lipid nanoparticles. Int. J. Pharm. 2007, 337, 299–306. [Google Scholar] [CrossRef]
  6. Lage, H.; Duarte, N.; Coburger, C.; Hilgeroth, A.; Ferreira, M.J.U. Antitumor activity of terpenoids against classical and atypical multidrug resistant cancer cells. Phytomedicine 2010, 17, 441–448. [Google Scholar] [CrossRef]
  7. Tolstikova, T.G.; Sorokina, I.V.; Tolstikov, G.A.; Tolstikov, A.G.; Flekhter, O.B. Biological activity and pharmacological prospects of lupane terpenoids: I. Natural lupane derivatives. Russ. J. Bioorg. Chem. 2006, 32, 37–49. [Google Scholar] [CrossRef]
  8. Ulubelen, A. Cardioactive and antibacterial terpenoids from some Salvia species. Phytochemistry 2003, 64, 395–399. [Google Scholar] [CrossRef]
  9. Dunn, W.B.; Bailey, N.J.C.; Johnson, H.E. Measuring the metabolome: Current analytical technologies. Analyst 2005, 130, 606–625. [Google Scholar] [CrossRef]
  10. Dettmer, K.; Aronov, P.A.; Hammock, B.D. Mass spectrometry-based metabolomics. Mass Spec. Rev. 2007, 26, 51–78. [Google Scholar] [CrossRef]
  11. Jung, Y.; Ahn, Y.G.; Kim, H.K.; Moon, B.C.; Lee, A.Y.; Ryu, D.H.; Hwang, G.S. Characterization of dandelion species using 1H NMR- and GC-MS-based metabolite profiling. Analyst 2011, 136, 4222–4231. [Google Scholar] [CrossRef]
  12. Grata, E.; Boccard, J.; Guillarme, D.; Glauser, G.; Carrupt, P.A.; Farmer, E.E.; Wolfender, J.L.; Rudaz, S. UPLC-TOF-MS for plant metabolomics: A sequential approach for wound marker analysis in Arabidopsis thaliana. J. Chromatogr. B Anal. Technol. Biomed. Life Sci. 2008, 871, 261–270. [Google Scholar] [CrossRef]
  13. Kim, E.J.; Kwon, J.; Park, S.H.; Park, C.; Seo, Y.B.; Shin, H.K.; Kim, H.K.; Lee, K.S.; Choi, S.Y.; Ryu, D.H.; et al. Metabolite profiling of Angelica gigas from different geographical origins using 1H NMR and UPLC-MS analyses. J. Agric. Food Chem. 2011, 59, 8806–8815. [Google Scholar] [CrossRef]
  14. Raven, P.H.; Evert, R.F.; Eichhorm, S.E. Biology of Plants, 6th ed.; Freeman: New York, NY, USA, 1999; pp. 32–37. [Google Scholar]
  15. Sumner, L.W.; Mendes, P.; Dixon, R.A. Plant metabolomics: Large-scale phytochemistry in the functional genomics era. Phytochemistry 2003, 62, 817–836. [Google Scholar] [CrossRef]
  16. Lei, Z.; Huhman, D.; Sumner, L.W. Mass spectrometry strategies in metabolomics. J. Biol. Chem. 2011, 268, 25435–25442. [Google Scholar]
  17. Halket, J.M.; Waterman, D.; Przyborowska, A.M.; Patel, R.K.P.; Fraser, P.D.; Bramley, P.M. Chemical derivatization and mass spectral libraries in metabolic profiling by GC/MS and LC/MS/MS. J. Exp. Bot. 2005, 56, 219–243. [Google Scholar]
  18. Apbona, V.; Iglesias, D.J.; Talon, M.; Gomez-Cadenas, A. Plant phenotype demarcation using nontargeted LC-MS and GC-MS metabolite profiling. J. Agric. Food Chem. 2009, 57, 7338–7347. [Google Scholar]
  19. t’Kindt, R.; Morreel, K.; Deforce, D.; Boerjan, W.; Bocxlaer, J.V. Joint GC–MS and LC–MS platforms for comprehensive plant metabolomics: Repeatability and sample pre-treatment. J. Chromatogr. B Anal. Technol. Biomed. Life Sci. 2009, 877, 3572–3580. [Google Scholar] [CrossRef]
  20. Jung, Y.; Lee, J.; Kim, H.K.; Moon, B.C.; Ji, Y.; Ryu, D.H.; Hwang, G.S. Metabolite profiling of Curcuma species grown in different regions using 1H NMR spectroscopy and multivariate analysis. Analyst 2012, 137, 5597–5606. [Google Scholar] [CrossRef]
  21. Herebian, D.; Choi, J.H.; Abd El-Aty, A.M.; Shim, J.H.; Spiteller, M. Metabolite analysis in Curcuma domestica using various GC-MS and LC-MS separation and detection techniques. Biomed. Chromatogr. 2009, 23, 951–965. [Google Scholar] [CrossRef]
  22. He, X.G.; Lin, L.Z.; Lian, L.Z.; Lindenmaier, M. Liquid chromatography electrospray mass spectrometric analysis of curcuminoids and sesquiterpenoids in turmeric (Curcuma longa). J. Chromatogr. A 1998, 818, 127–132. [Google Scholar] [CrossRef]
  23. Jiang, H.; Somogyi, A.; Jacobsen, N.E.; Timmermann, B.N.; Gang, D.R. Analysis of curcuminoids by positive and negative electrospray ionization and tandem mass spectrometry. Rapid Commun. Mass Spectrom. 2006, 20, 1001–1012. [Google Scholar] [CrossRef]
  24. Jayaprakasha, G.K.; Rao, L.J.M.; Sakariah, K.K. Improved HPLC method for the determination of curcumin, demethoxycurcumin, and bisdemethoxycurcumin. J. Agric. Food Chem. 2002, 50, 3668–3672. [Google Scholar] [CrossRef]
  25. Yan, J.; Chen, G.; Tong, S.; Feng, Y.; Sheng, L.; Lou, J. Preparative isolation and purification of germacrone and curdione from the essential oil of the rhizomes of Curcuma wenyujin by high-speed counter-current chromatography. J. Chromatogr. A 2005, 1070, 207–210. [Google Scholar] [CrossRef]
  26. Devaraj, S.; Esfahani, A.S.; Ismail, S.; Ramanathan, S.; Yam, M.F. Evaluation of the antinociceptive activity and acute oral toxicity of standardized ethanolic extract of the rhizome of Curcuma xanthorrhiza Roxb. Molecules 2010, 15, 2925–2934. [Google Scholar] [CrossRef]
  27. Raina, V.K.; Srivastava, S.K. Rhizome and leaf oil composition of Curcuma longa from the lower Himalayan region of northern India. J. Essent. Oil Res. 2005, 17, 556–559. [Google Scholar] [CrossRef]
  28. Meckes, M.; Calzada, F. Terpenoids isolated from Psidium guajava hexane extract with depressant activity on central nervous system. Phytother. Res. 1996, 10, 600–603. [Google Scholar] [CrossRef]
  29. Fraenkel, G.S. The raison d’être of secondary plant substances. Science 1959, 129, 1466–1470. [Google Scholar]
  30. Pichersky, E.; Gang, D.R. Genetics and biochemistry of secondary metabolites in plants: An evolutionary perspective. Trends Plant Sci. 2000, 5, 439–445. [Google Scholar] [CrossRef]
  31. Brenes-Arguedas, T.; Coley, P.D. Phenotypic variation and spatial structure of secondary chemistry in a natural population of a tropical tree species. OIKOS 2005, 108, 410–420. [Google Scholar] [CrossRef]
  32. Tsai, S.Y.; Huang, S.J.; Chyau, C.C.; Tsai, C.H.; Weng, C.C.; Mau, J.L. Composition and antioxidant properties of essential oils from Curcuma rhizome. Asian J. Arts Sci. 2011, 2, 57–66. [Google Scholar]
  33. Ritwiz, S.B.; Kusha, S.B.; Ranjeet, D.; Ganesh, N. Curcuma longa leaves exhibits a potential antioxidant, antibacterial and immunomodulating properties. Int. J. Phytomed. 2011, 3, 270–278. [Google Scholar]
  34. Bergdahl, M.; Bergdahl, J. Burning mouth syndrome: Prevalence and associated factors. J. Oral Pathol. Med. 1999, 28, 350–354. [Google Scholar] [CrossRef]
  35. Peana, A.T.; D’Aquila, P.S.; Panin, F.; Serra, G.; Pippia, P.; Moretti, M.D.L. Anti-inflammatory activity of linalool and linalyl acetate constituents of essential oils. Phytomedicine 2002, 9, 721–726. [Google Scholar] [CrossRef]
  36. Bosak, T.; Losick, R.M.; Pearson, A. A polycyclic terpenoid that alleviates oxidative stress. Proc. Natl. Acad. Sci. USA 2008, 105, 6725–6729. [Google Scholar]
  37. Singh, G.; Kapoor, I.P.S.; Singh, P.; de Heluani, C.S.; de Lampasona, M.P.; Catalan, C.A.N. Comparative study of chemical composition and antioxidant activity of fresh and dry rhizomes of turmeric (Curcuma longa Linn.). Food Chem. Toxicol. 2010, 48, 1026–1031. [Google Scholar] [CrossRef]
  38. Singh, S.; Sankar, B.; Rajesh, S.; Sahoo, K.; Subudhi, E.; Nayak, S. Chemical composition of turmeric oil (Curcuma longa L. cv. Roma) and its antimicrobial activity against eye infecting pathogens. J. Essent. Oil Res. 2011, 23, 11–18. [Google Scholar]
  39. De Abreu Gonzaga, W.; Weber, A.D.; Giacomelli, S.R.; Simionatto, E.; Dalcol, I.I.; Dessoy, E.C.; Morel, A.F. Composition and antibacterial activity of the essential oils from Zanthoxylum rhoifolium. Planta Med. 2003, 69, 773–775. [Google Scholar]
  40. El-Baroty, G.S.; El-Baky, H.H.A.; Farag, R.S.; Saleh, M.A. Characterization of antioxidant and antimicrobial compounds of cinnamon and ginger essential oils. Afr. J. Biochem. Res. 2010, 4, 167–174. [Google Scholar]
  41. Prakash, P.; Misra, A.; Surin, W.R.; Jain, M.; Bhatta, R.S.; Pal, R.; Raj, K.; Barthwal, M.K.; Dikshit, M. Anti-platelet effects of Curcuma oil in experimental models of myocardial ischemia-reperfusion and thrombosis. Thromb. Res. 2011, 127, 111–118. [Google Scholar]
  42. Sukari, M.A.; Wah, T.S.; Saad, S.M.; Rashid, N.Y.; Rahmani, M.; Lajis, N.H.; Hin, T.Y. Bioactive sesquiterpenes from Curcuma ochrorhiza and Curcuma heyneana. Nat. Prod. Res. 2014, 24, 838–845. [Google Scholar]
  43. Ramanathan, R.; Jemal, M.; Ramagiri, S.; Xia, Y.Q.; Humpreys, W.G.; Olah, T.; Korfmacher, W.A. It is time for a paradigm shift in drug discovery bioanalysis: From SRM to HRMS. J. Mass Spectrom. 2011, 46, 595–601. [Google Scholar]
  44. Jiang, H.; Timmermann, B.N.; Gang, D.R. Use of liquid chromatography–electrospray ionization tandem mass spectrometry to identify diarylheptanoids in turmeric (Curcuma longa L.) rhizome. J. Chromatogr. A 2006, 1111, 21–31. [Google Scholar] [CrossRef]
  45. Hayakawa, H.; Kobayashi, T.; Minaniya, Y.; Ito, K.; Miyasaki, A.; Fukuda, T.; Yamamoto, Y. Development of a molecular marker to identify a candidate line of turmeric (Curcuma longa L.) with a high curcumin content. Am. J. Plant Sci. 2011, 2, 15–26. [Google Scholar]
  46. Sasikumar, B. Genetic resources of Curcuma: Diversity, characterization and utilization. Plant Genet. Resour. 2005, 3, 230–251. [Google Scholar]
  47. Hou, X.-L.; Hayashi-Nakamura, E.; Takatani-Nakase, T.; Tanaka, K.; Takahashi, K.; Komatsu, K.; Takahashi, K. Curdione plays an important role in the inhibitory effect of Curcuma aromatica on CYP3A4 in Caco-2 cells. Evid. Based Complement. Alternat. Med. 2011, 2011. [Google Scholar] [CrossRef]
  • Sample Availability: Not available.

