Article

Synthesis, Fluorescence Properties, and Antiproliferative Potential of Several 3-Oxo-3H-benzo[f]chromene-2-carboxylic Acid Derivatives

State Key Laboratory Cultivation Base for the Chemistry and Molecular Engineering of Medicinal Resources, School of Chemistry & Pharmacy, Guangxi Normal University, Yucai Road 15, Guilin 541004, China
*
Author to whom correspondence should be addressed.
These authors contributed equally to this work.
Molecules 2015, 20(10), 18565-18584; https://doi.org/10.3390/molecules201018565
Submission received: 1 August 2015 / Revised: 3 October 2015 / Accepted: 7 October 2015 / Published: 13 October 2015
(This article belongs to the Section Bioorganic Chemistry)

Abstract

:
In this study, two series of 3-oxo-3H-benzo[f]chromene-2-carboxylic acid derivatives (compounds 5ai and 6ag) were synthesized. Their in vitro proliferation inhibitory activities against the A549 and NCI-H460 human non-small cell lung cancer (NSCLC) cell lines were evaluated. Their photophysical properties were measured. Among these target compounds, 5e exhibited the strongest antiproliferative activity by inducing apoptosis, arresting cell cycle, and elevating intracellular reactive oxygen species (ROS) level, suggesting that it may be a potent antitumor agent. In addition, compound 6g with very low cytotoxicity, demonstrated excellent fluorescence properties, which could be used as an effective fluorescence probe for biological imaging.

Graphical Abstract

1. Introduction

Coumarin (1,2-benzopyrone or 2H-1-benzopyran-2-one) and its derivatives, best-known as oxygen-containing heterocyclic compounds, are widely distributed in Nature and many exhibit diverse biological and interesting pharmacological activities. The numerous therapeutic applications of coumarin compounds include anti-coagulant effects [1], antitumor therapy [2,3,4,5], anti-HIV treatment [6,7], central nervous system stimulants and protective agents [8,9], antibacterial and anti-inflammatory drugs [10,11,12]. It has been found that the coumarin nucleus plays an important role as a valuable molecular template for the development of different structural analogues with improved pharmacological profiles. The different substituent groups connected with the coumarin nucleus strongly influence the biological activity of the resulting derivatives [13]. More importantly, the excellent fluorescent properties of coumarin compounds offer additional development value and they are used in many areas, such as fluorescent brighteners, fluorescent probes to monitor complex biological events, electroluminescent devices, photochemotherapy, etc. [14,15,16].
Recently we focused on anti-tumor activity screening and fluorescent performance of some coumarin-based compounds. In this report, two series of 3-oxo-3H-benzo[f]chromene-2-carboxylic acid derivatives including its amide (compounds 5ai) and ester (compounds 6ag) were efficiently synthesized (Scheme 1). Their biological activity and photophysical properties were evaluated. It was found that compound 5e exhibited the strongest in vitro proliferation inhibitory activity against the A549 and NCI-H460 cell lines, suggesting that it may be a potent antitumor agent. In addition, compound 6g with very low cytotoxicity demonstrated excellent fluorescence properties, which could be exploited for biological and biomedical imaging.
Scheme 1. Synthetic route to the target compounds 3-oxo-3H-benzo[f]chromene-2-carboxylic acid derivatives 5ai and 6ag. Reagents and conditions: (a) Meldrum’s acid (2), ethanol, pyridine, 80 °C, 4 h; (b) SOCl2, 1,2-dichloroethane, 60–70 °C, 4 h; (c) R1-NH2, triethylamine, CH2Cl2, room temperature (r.t.), 10–30 min; (d) R2-OH, triethylamine, CH2Cl2, r.t., 10–30 min.
Molecules 20 18565 g008

2. Results and Discussion
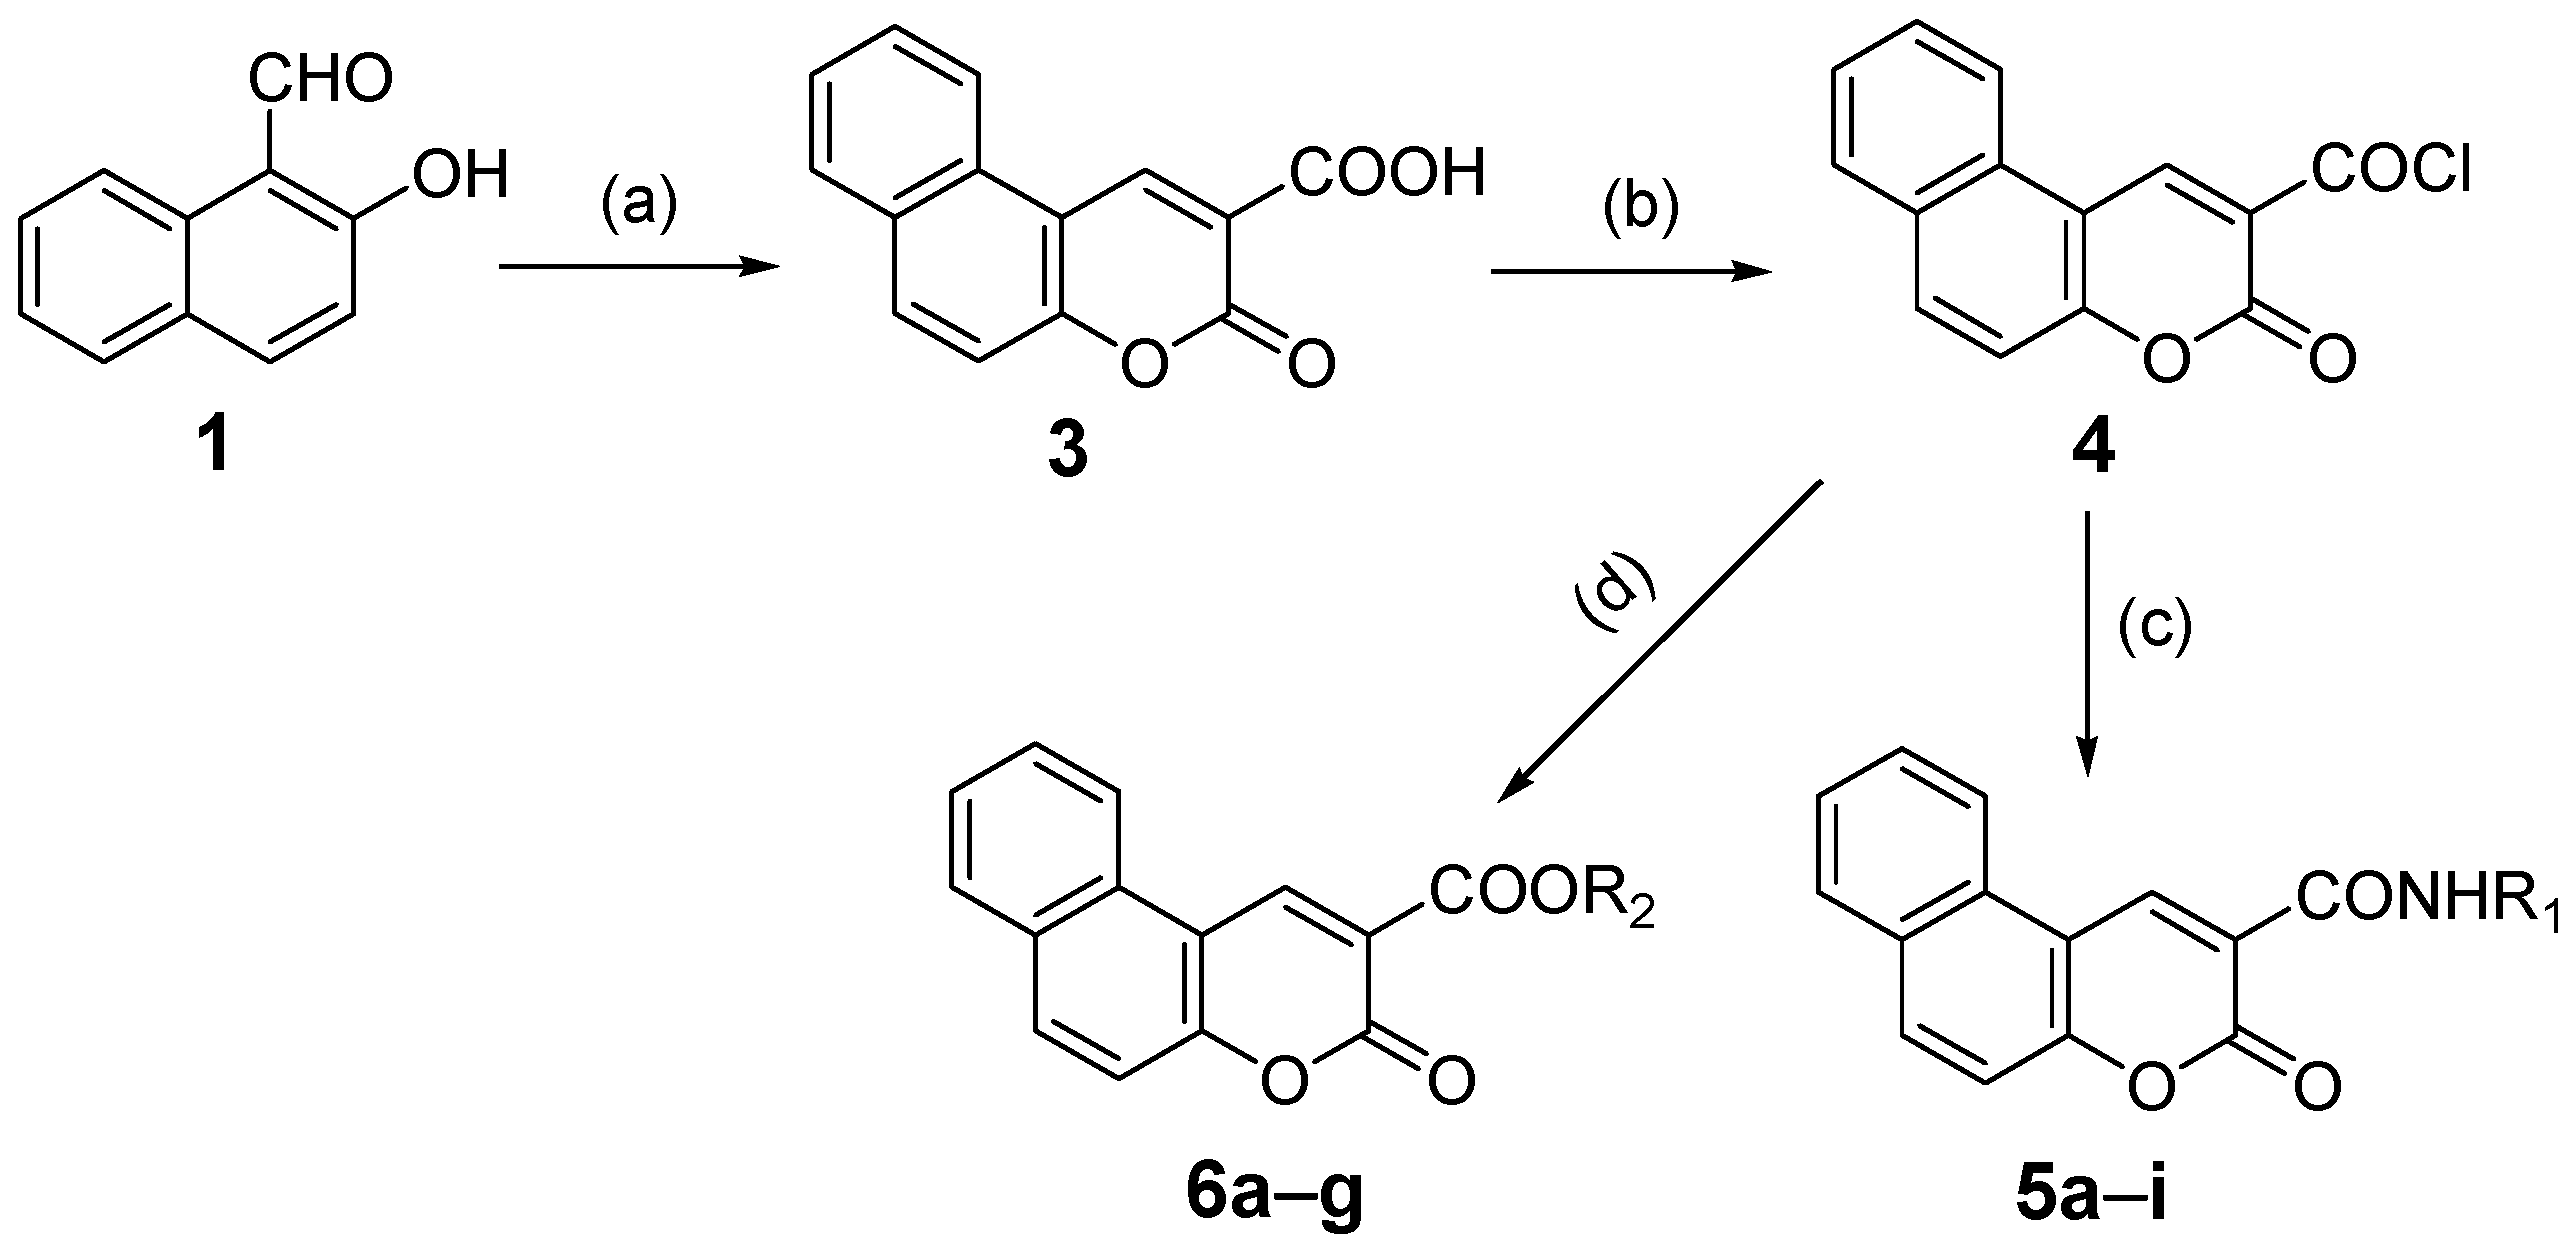
2.1. Chemistry

The synthetic route to the target 3-oxo-3H-benzo[f]chromene-2-carboxylic acid derivatives 5ai and 6ag is depicted in Scheme 1. Based on the method reported previously [17], we successfully prepared the key intermediate 3-oxo-3H-benzo[f]chromene-2-carboxylic acid (3) via Knoevenagel condensation of 2-hydroxy-1-naphthaldehyde (1) with Meldrum’s acid (2). For the first step, cheap ethanol was selected as the solvent and pyridine as a catalyst. It was noted that an excess of Meldrum’s acid should be avoided because it could react with 3 [18]. Then 3-oxo-3H-benzo[f]chromene-2-carbonyl chloride (4) was obtained by chlorination in the presence of thionyl chloride. Compound 4 is easily hydrolyzed and converted back into the previous carboxylic acid 3 if it is exposed to the air for a long time, therefore 4 was used directly in the next step without further purification. Finally, different amines and alcohols were reacted with 4 to afford the target compounds 5ai and 6ag (Scheme 1). This method is convenient, efficient and can be used for constructing coumarin-based compound libraries; moreover, the byproducts are easy to remove, and the intermediate 3 is obtained in high yield and purity.
Scheme 2. Proposed mechanism of the pyridine-catalyzed Knoevenagel condensation for synthesizing 3-oxo-3H-benzo[f]chromene-2-carboxylic acid (3).
Molecules 20 18565 g009
After the target compounds were successfully prepared, the reaction mechanism for synthesizing the key intermediate 3-oxo-3H-benzo[f]chromene-2-carboxylic acid (3) was examined. As shown in Scheme 2, Meldrum’s acid (2), namely 2,2-dimethyl-1,3-dioxane-4,6-dione, is easily enolized and usually used as a good nucleophile in many reactions when malonate ester is ineffective [19]. In the presence of pyridine, Meldrum’s acid (2) is deprotonated to afford its enolate I which can be converted to the corresponding ketone form. Then the produced carbanion attacks the 2-hydroxy-1-naphthaldehyde substrate 1, and the intermediate II is obtained. However, II is prone to protonate, then lose a water molecule, and the olefine ketone III is produced [18,20]; meanwhile, the catalyst pyridine restores its initial state. Subsequently, an intramolecular nucleophilic addition occurs because the carbonyl carbon of III is susceptible to attack by the hydroxyl group, which gives the hemiacetal IV. The strain of the rightmost lactone ring combined with instability of the hemiacetal structure forces the loss of an acetone molecule, and the intermediate V is thus obtained [19,21]. However, because the hydroxyl group is directly linked with a carbocation, V is also unstable and easily loses a proton, which is captured by the carboxylate anion to form the carboxyl group and 3-oxo-3H-benzo[f]chromene-2-carboxylic acid (3) is obtained. Of course, with regard to the conversion from V to 3, there may be another path where the proton of the carboxyl group comes from a water molecule which was generated previously, rather than the hydroxyl group of V. From the above analysis, many proton-binding agents can be used as catalysts in the Knoevenagel condensation. Besides pyridine, maybe other bases, such as piperidine, piperidinium acetate, piperazine, and ammonium acetate are also appropriate [20,22].

2.2. In Vitro Biological Activity

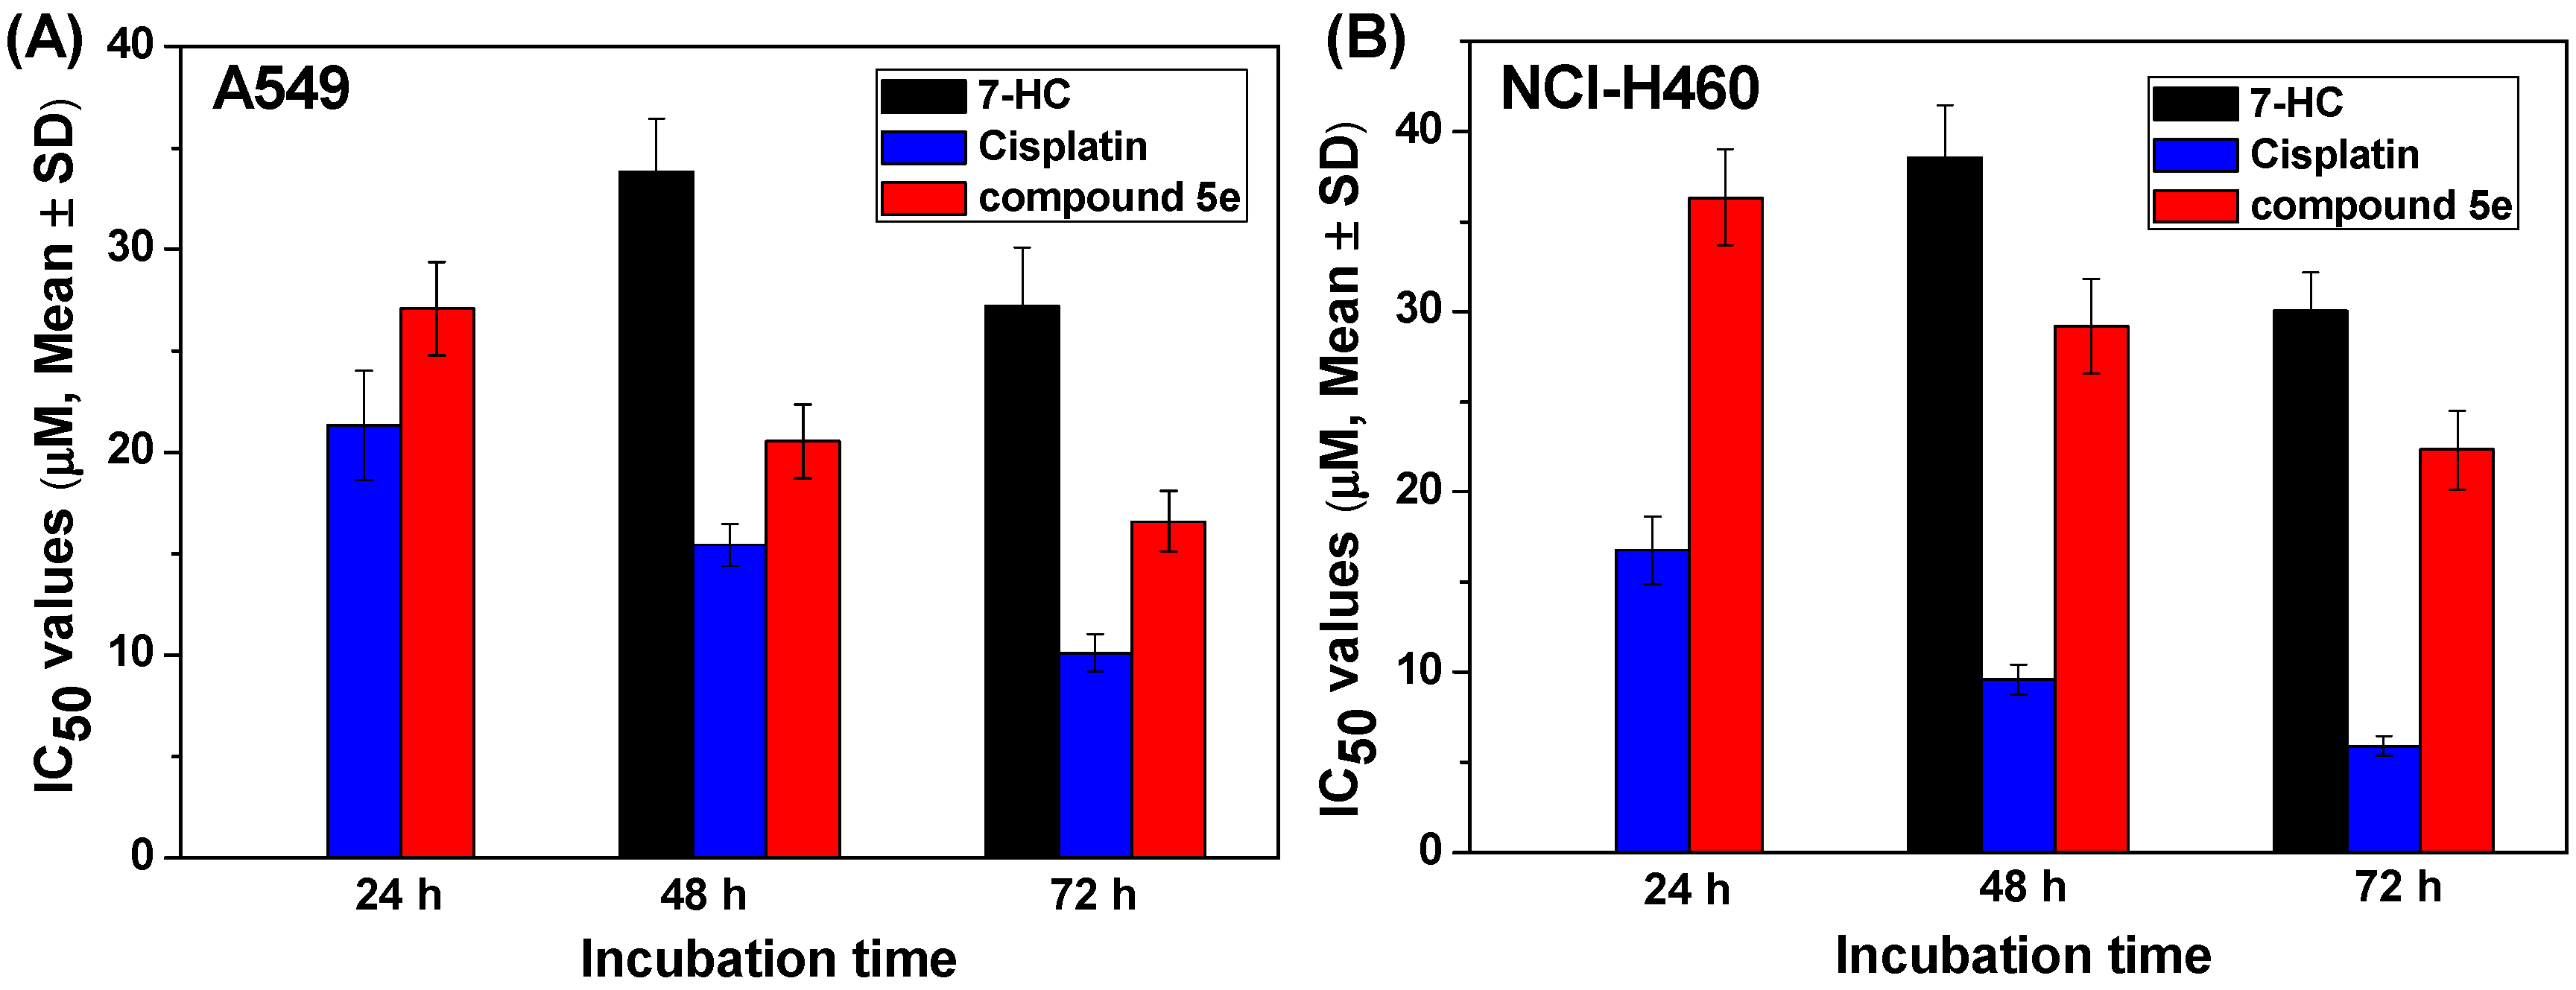
2.2.1. Antiproliferative Activities of the Target Compounds against A549 and NCI-H460 Cells in Vitro

The in vitro proliferation inhibitory activity of the prepared compounds 5ai and 6ag was evaluated against two NSCLC cell lines including A549 and NCI-H460; 7-hydroxycoumarin (7-HC) and cisplatin were selected as dual positive reference drugs. The NSCLC cell lines were treated with the target compounds (final concentrations: 0, 5, 10, 20, 30, 40, 60 μM), and viable cells were measured by an MTT (3-(4,5-dimethylthiahiazol-2-y1)-2,5-diphenyltetrazolium bromide) assay. As shown in Table 1, most of the target compounds exhibited very low antiproliferative activities; especially, the IC50 values (IC50 represented the concentration at which cell growth was inhibited by 50%) of 3-oxo-3H-benzo[f]chromene-2-carboxylic acid esters 6ag were over 60 μM. To our delight, among the synthesized compounds, 5e displayed the best activities with IC50 values of 20.53 ± 1.84 for A549 and 29.19 ± 2.61 for NCI-H460 cells, respectively. After the co-incubation of A549 cells with 10, 20, and 30 μM compounds 5e for 48 h, the inhibition rates were 22.55% ± 1.97%, 52.59% ± 2.79% and 63.72% ± 3.09%, respectively. The decline of IC50 values with the prolonged incubation time is shown in Figure 1. At the same concentration, the proliferation inhibitory activity of 5e was superior to 7-HC, even though neither of them are comparable with cisplatin which has been extensively used to treat patients with NSCLC within the last several decades [23,24,25]. The above results suggest that compound 5e can induce a dose- and time-dependent proliferation inhibition of A549 and NCI-H460 cells.
Figure 1. Antiproliferative effects of compound 5e on NSCLC cell lines. (A) A549 and (B) NCI-H460 cells were treated with 7-HC, cisplatin, and 5e for the indicated time (24, 48, and 72 h), respectively. After treatment, cell viability was measured by MTT assay, then inhibition rate and IC50 values were obtained. In the figure, the antiproliferative activity data of 7-HC after the incubation with A549 and NCI-H460 cell lines for 24 h were omitted because the IC50 values were over 60 μM under this condition.
Molecules 20 18565 g001
Table 1. In vitro antiproliferative activities of 3-oxo-3H-benzo[f]chromene-2-carboxylic acid derivatives against A549 and NCI-H460 cell lines. Molecules 20 18565 i001
CompoundRIC50 ± SD (μM) a,b
A549NCI-H460
5a Molecules 20 18565 i002>6046.41 ± 4.22
5b Molecules 20 18565 i003>60>60
5c Molecules 20 18565 i004>60>60
5d Molecules 20 18565 i00538.71 ± 3.6244.39 ± 2.98
5e Molecules 20 18565 i00620.53 ± 1.8429.19 ± 2.61
5f Molecules 20 18565 i00729.72 ± 3.85>60
5g Molecules 20 18565 i008>60>60
5h Molecules 20 18565 i009>60>60
5i Molecules 20 18565 i010>60>60
6a Molecules 20 18565 i011>60>60
6b Molecules 20 18565 i012>60>60
6c Molecules 20 18565 i013>60>60
6d Molecules 20 18565 i014>60>60
6e Molecules 20 18565 i015>60>60
6f Molecules 20 18565 i016>60>60
6g Molecules 20 18565 i017>60>60
7-HC33.82 ± 2.6238.55 ± 2.91
Cisplatin15.42 ± 1.069.61 ± 0.83
a A549 and NCI-H460 cells were treated with the target compounds for 48 h. Results are expressed as means ± SD (standard deviation) of four independent experiments; b Compounds with IC50 values >60 μM are considered to be inactive.

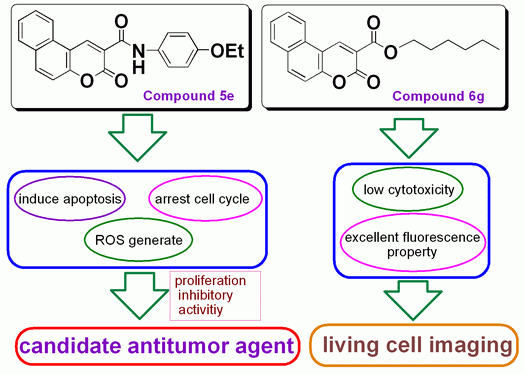
2.2.2. Apoptosis Induced by Compound 5e

To investigate whether the proliferation inhibitory activity of compound 5e was associated with induced apoptosis, Annexin V-FITC/propidium iodide (Annexin V/PI) dual staining method was used. As shown in Table 2 and Figure 2, after A549 cells were treated with compound 5e for 48 h, the population of apoptotic cells (early plus late apoptotic cells, Q2 + Q3 quadrants) increased significantly. Compared with 7-HC, 5e had more potent capability to induce apoptosis at the same concentration (20 µM). If the incubation time was extended to 72 h, the population of apoptotic cells was increased from 7.22% ± 0.52% for the control group to 10.9% ± 2.1% at 10 µM, then to 19.1% ± 1.4% at 20 μM for 5e (Table 2). Therefore, compound 5e can induce apoptosis of A549 cells in a concentration- and time-dependent manner; induced apoptosis is responsible for the antiproliferative activity of compound 5e against A549 cells.
Figure 2. Effects of compound 5e on the induction of apoptosis in A549 cells after the co-incubation for 72 h. The population of apoptotic cells was determined by flow cytometry. The experiment was repeated thrice. Here only representative flow cytometric graphs are shown.
Molecules 20 18565 g002
Table 2. Quantitative apoptosis assay of A549 using Annexin-V/PI dual staining method a.
GroupConc. b (µM)48 h Incubation72 h Incubation
Viable Cells (Q1, %)Apoptotic Cells (Q2 + Q3, %)Necrotic Cells (Q4, %)Q1 (%)Q2 + Q3 (%)Q4 (%)
Control094.7 ± 2.64.72 ± 0.410.62 ± 0.1991.8 ± 3.37.22 ± 0.520.97 ± 0.13
7-HC2085.7 ± 2.811.3 ± 1.4 **3.04 ± 0.2981.1 ± 2.414.2 ± 1.9 *4.71 ± 0.49
Compd. 5e1091.4 ± 3.16.51 ± 1.312.04 ± 0.3185.3 ± 2.910.9 ± 2.13.77 ± 0.31
Compd. 5e2080.7 ± 2.513.9 ± 2.2 **5.41 ± 0.6273.9 ± 2.719.1 ± 1.4 **6.98 ± 0.42
a A549 cells were treated with the indicated concentrations of compound 5e for 48 and 72 h, respectively; subsequently the cells were stained with Annexin V-FITC and PI. The percentage of viable cells, apoptotic cells and necrotic cells is expressed as the means ± SD from three independent experiments; b Conc. is the abbreviation of concentration; * p < 0.05; ** p < 0.01 vs. the percentage of apoptotic cells of the control.

2.2.3. Cell Cycle Analysis

Cell cycle distribution was examined to determine whether compound 5e inhibited the proliferation of A549 cells through cell cycle arrest. The cells were co-incubated with 5e and 7-HC for 48 and 72 h, respectively. Compound 5e treatment increased the population of cells in the G0/G1 phase in a concentration- and time-dependent manner. This was accompanied by a decrease in the population of cells in S and G2/M phases, compared with the control. As shown in Table 3 and Figure 3, the population of A549 cells in the G0/G1 phase was increased from 70.71% ± 2.79% (control) to 80.52% ± 2.29% at 20 μM, then to 85.51% ± 2.03% at 30 μM for 5e; meanwhile, apoptotic cell rate was elevated with increased dose, which was consistent with the above results of induced apoptosis. These data indicate that, besides induced apoptosis, cell cycle arrest in the G0/G1 stage is also an important factor by which compound 5e exerts its inhibitory effects on A549 cells.
Figure 3. Effects of compound 5e on A549 cell cycle progression. A549 cells were treated with 5e for 72 h and analyzed by flow cytometry. The experiment was repeated thrice. Here only representative flow cytometric graphs are shown.
Molecules 20 18565 g003
Table 3. Effects of compound 5e on cell cycle progression in A549 cells a.
GroupConc. (µM)G0/G1 Phase (%)S Phase (%)G2/M Phase (%)
Control070.71 ± 2.7916.79 ± 1.3712.50 ± 1.41
7-HC2079.83 ± 2.39 *8.38 ± 0.4411.79 ± 1.69
Compd. 5e1072.62 ± 2.6715.77 ± 0.8411.60 ± 1.31
Compd. 5e2080.52 ± 2.29 *13.14 ± 1.016.31 ± 0.62
Compd. 5e3085.51 ± 2.03 *8.82 ± 0.915.67 ± 0.43
a A549 cells were treated with compound 5e or 7-HC for 72 h, then DNA content was analyzed through PI staining. Flow cytometry data were analyzed using the ModFit software. The results are presented as the means ± SD of three independent experiments; * p < 0.05 vs. the percentage of cells in G0/G1 phase of the control.

2.2.4. Induced ROS Generation by Compound 5e

The intracellular ROS levels were measured before and after treatment with compound 5e. As shown in Figure 4A, exposure to over 20 μM of 5e caused a marked increase in fluorescence intensity of 2′,7′-dichlorofluorescein (DCF), which indicated the production of ROS in the mitochondria of A549 cells. Intracellular fluorescence intensity was further quantitatively analyzed using a luminescence spectrometer. The mean fluorescence intensities increased by 30.9%, 49.1%, and 66.1% after treatment with 20, 30, and 40 μM compound 5e, respectively. Similar results were obtained for 7-HC. The relative fluorescence intensity (% of control) was shown in Figure 4B after the cells were co-incubated with 5e for 48 h. ROS overproduction is implicated in mediation of apoptosis and has been described as an early event [26]. Elevated intracellular ROS levels indicate that the balance between ROS generation and elimination is disrupted, which eventually results in cell apoptosis. Therefore, mitochondrial ROS overproduction and malfunction are responsible for compound 5e-induced apoptosis.
Figure 4. Effects of compound 5e on the intracellular ROS level in A549 cells. (A) ROS level analysis using flow cytometry; (B) Quantitative analysis of relative fluorescence intensity (% of control) using a luminescence spectrometer. A549 cells were treated with 5e for 48 h and stained with 2′,7′-dichlorodihydrofluorescein diacetate (DCFH-DA) before monitoring ROS level. Notes of Figure 4B, 1#: Control; 2#: 7-HC (20 µM); 3#: 5e (10 µM); 4#: 5e (20 µM); 5#: 5e (30 µM); 6#: 5e (40 µM). Each bar represents the mean ± SD of three independent experiments; * p < 0.05 vs. control.
Molecules 20 18565 g004

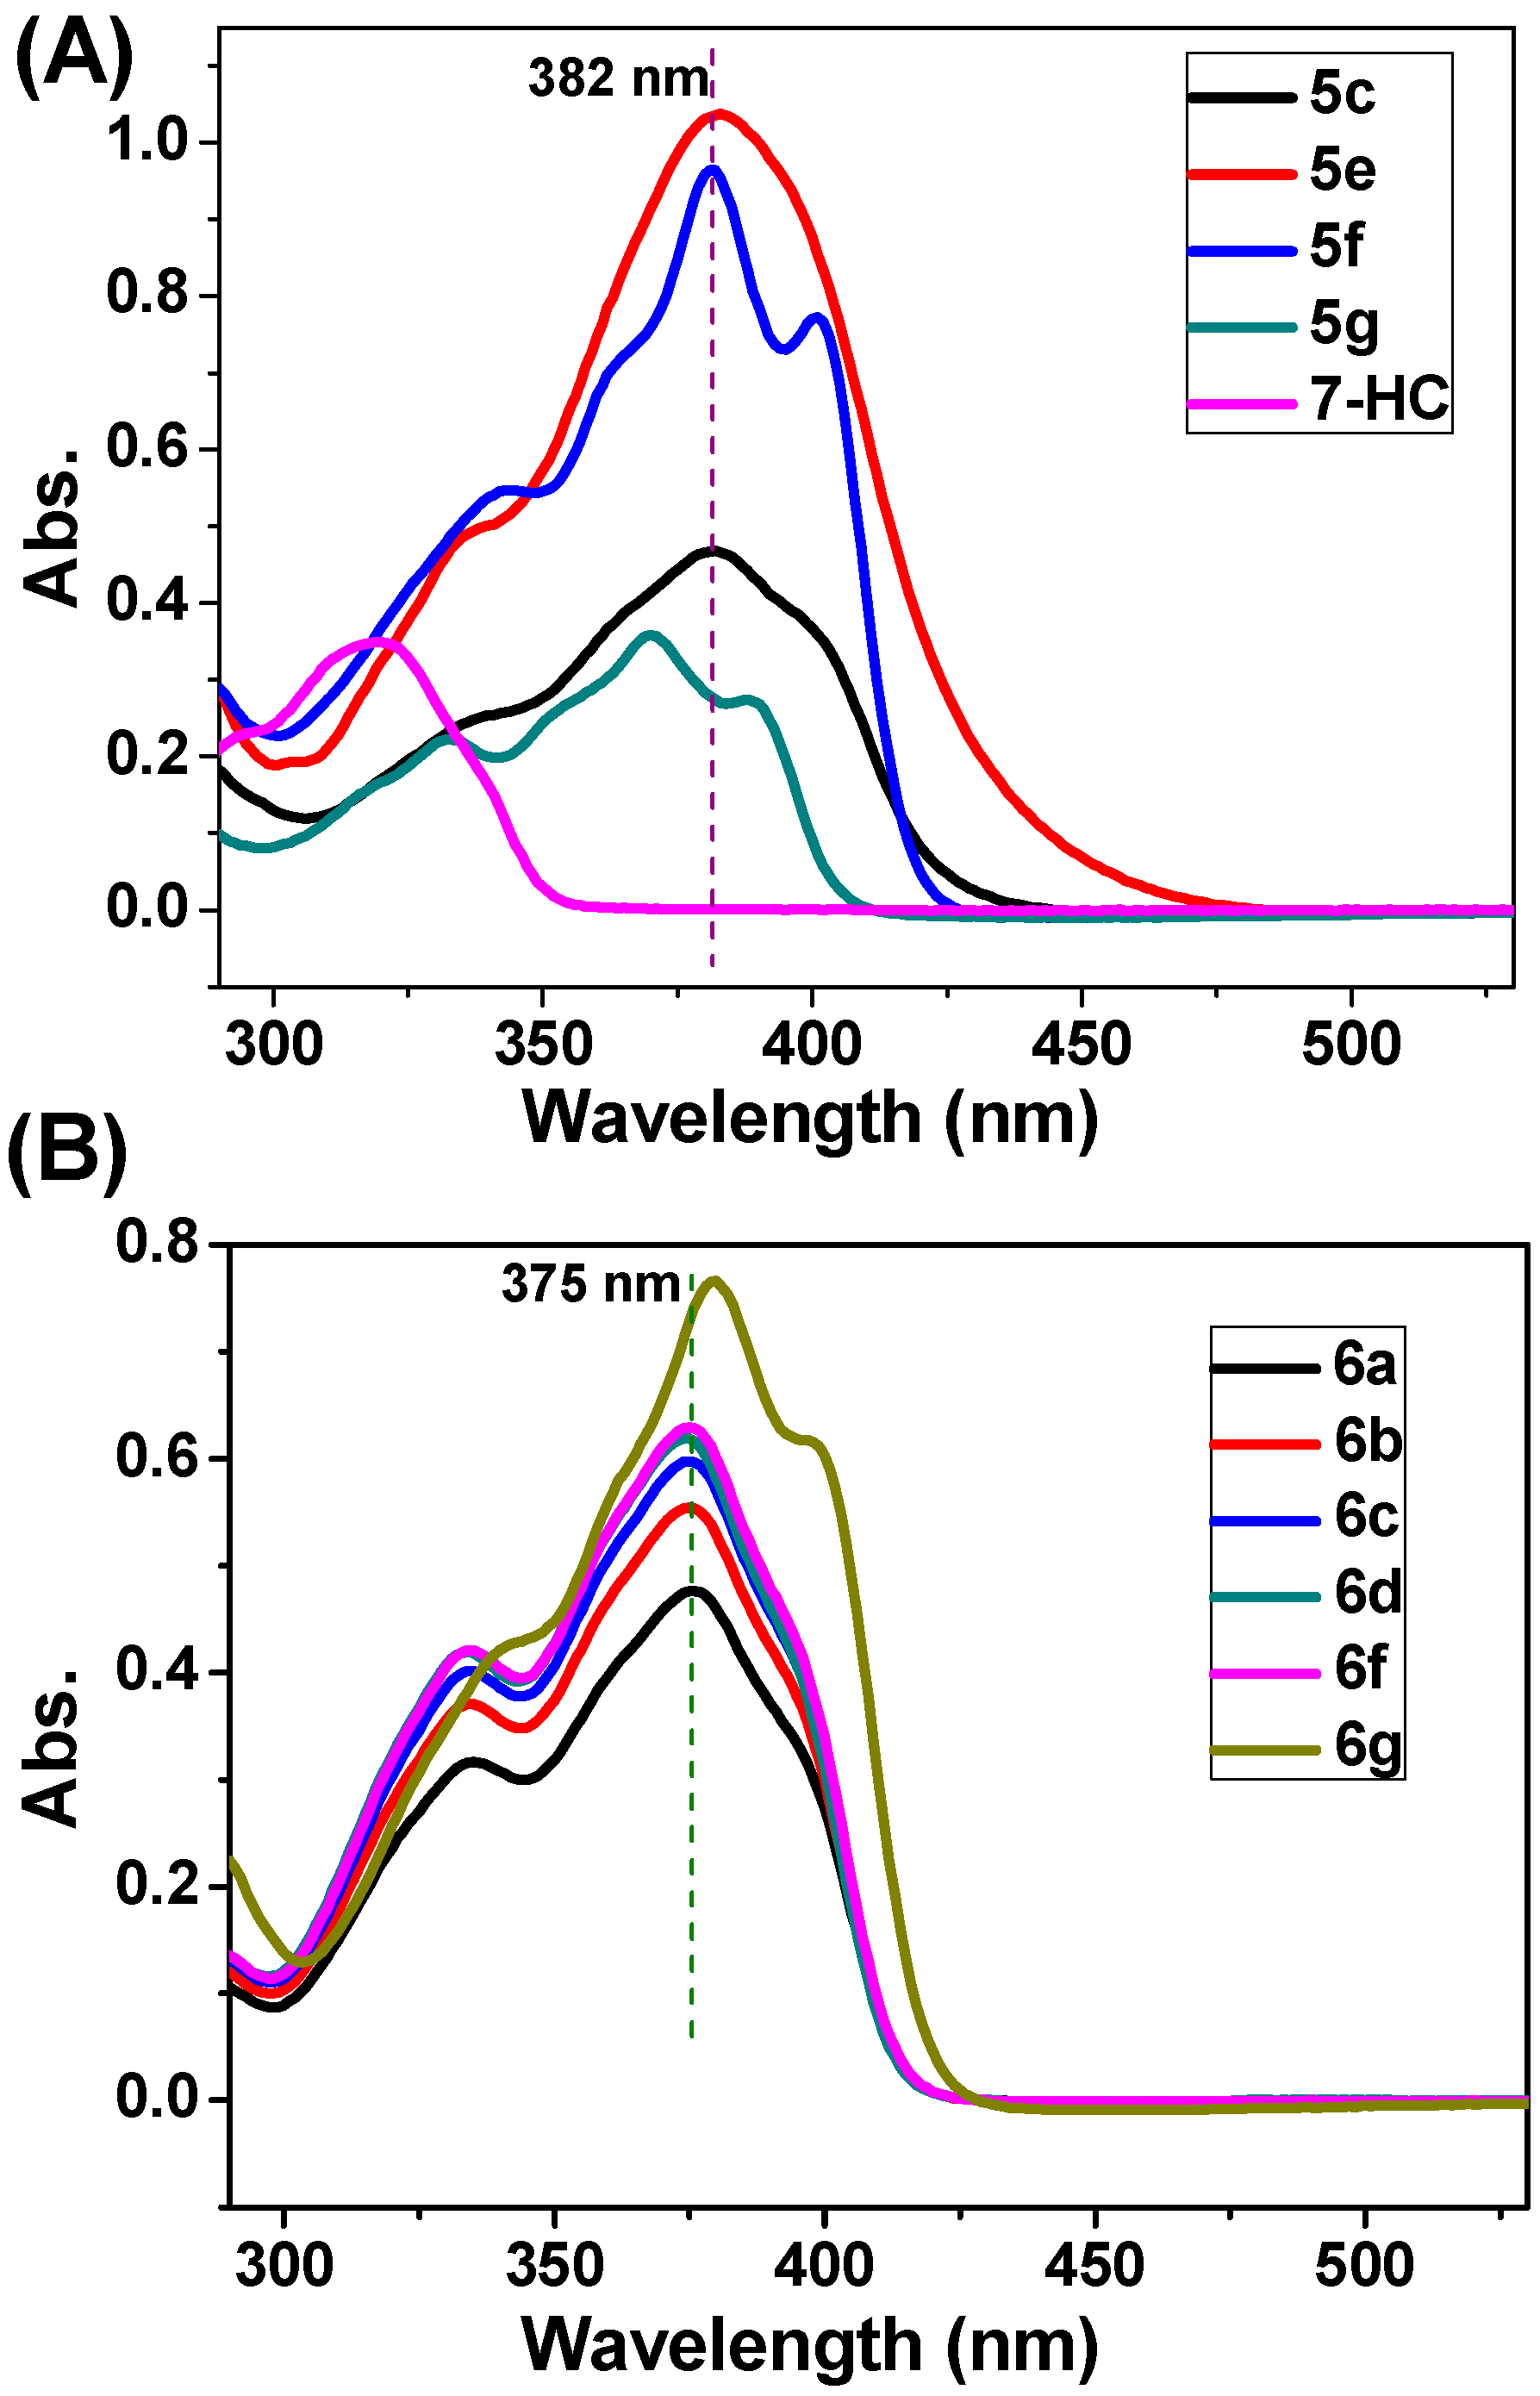
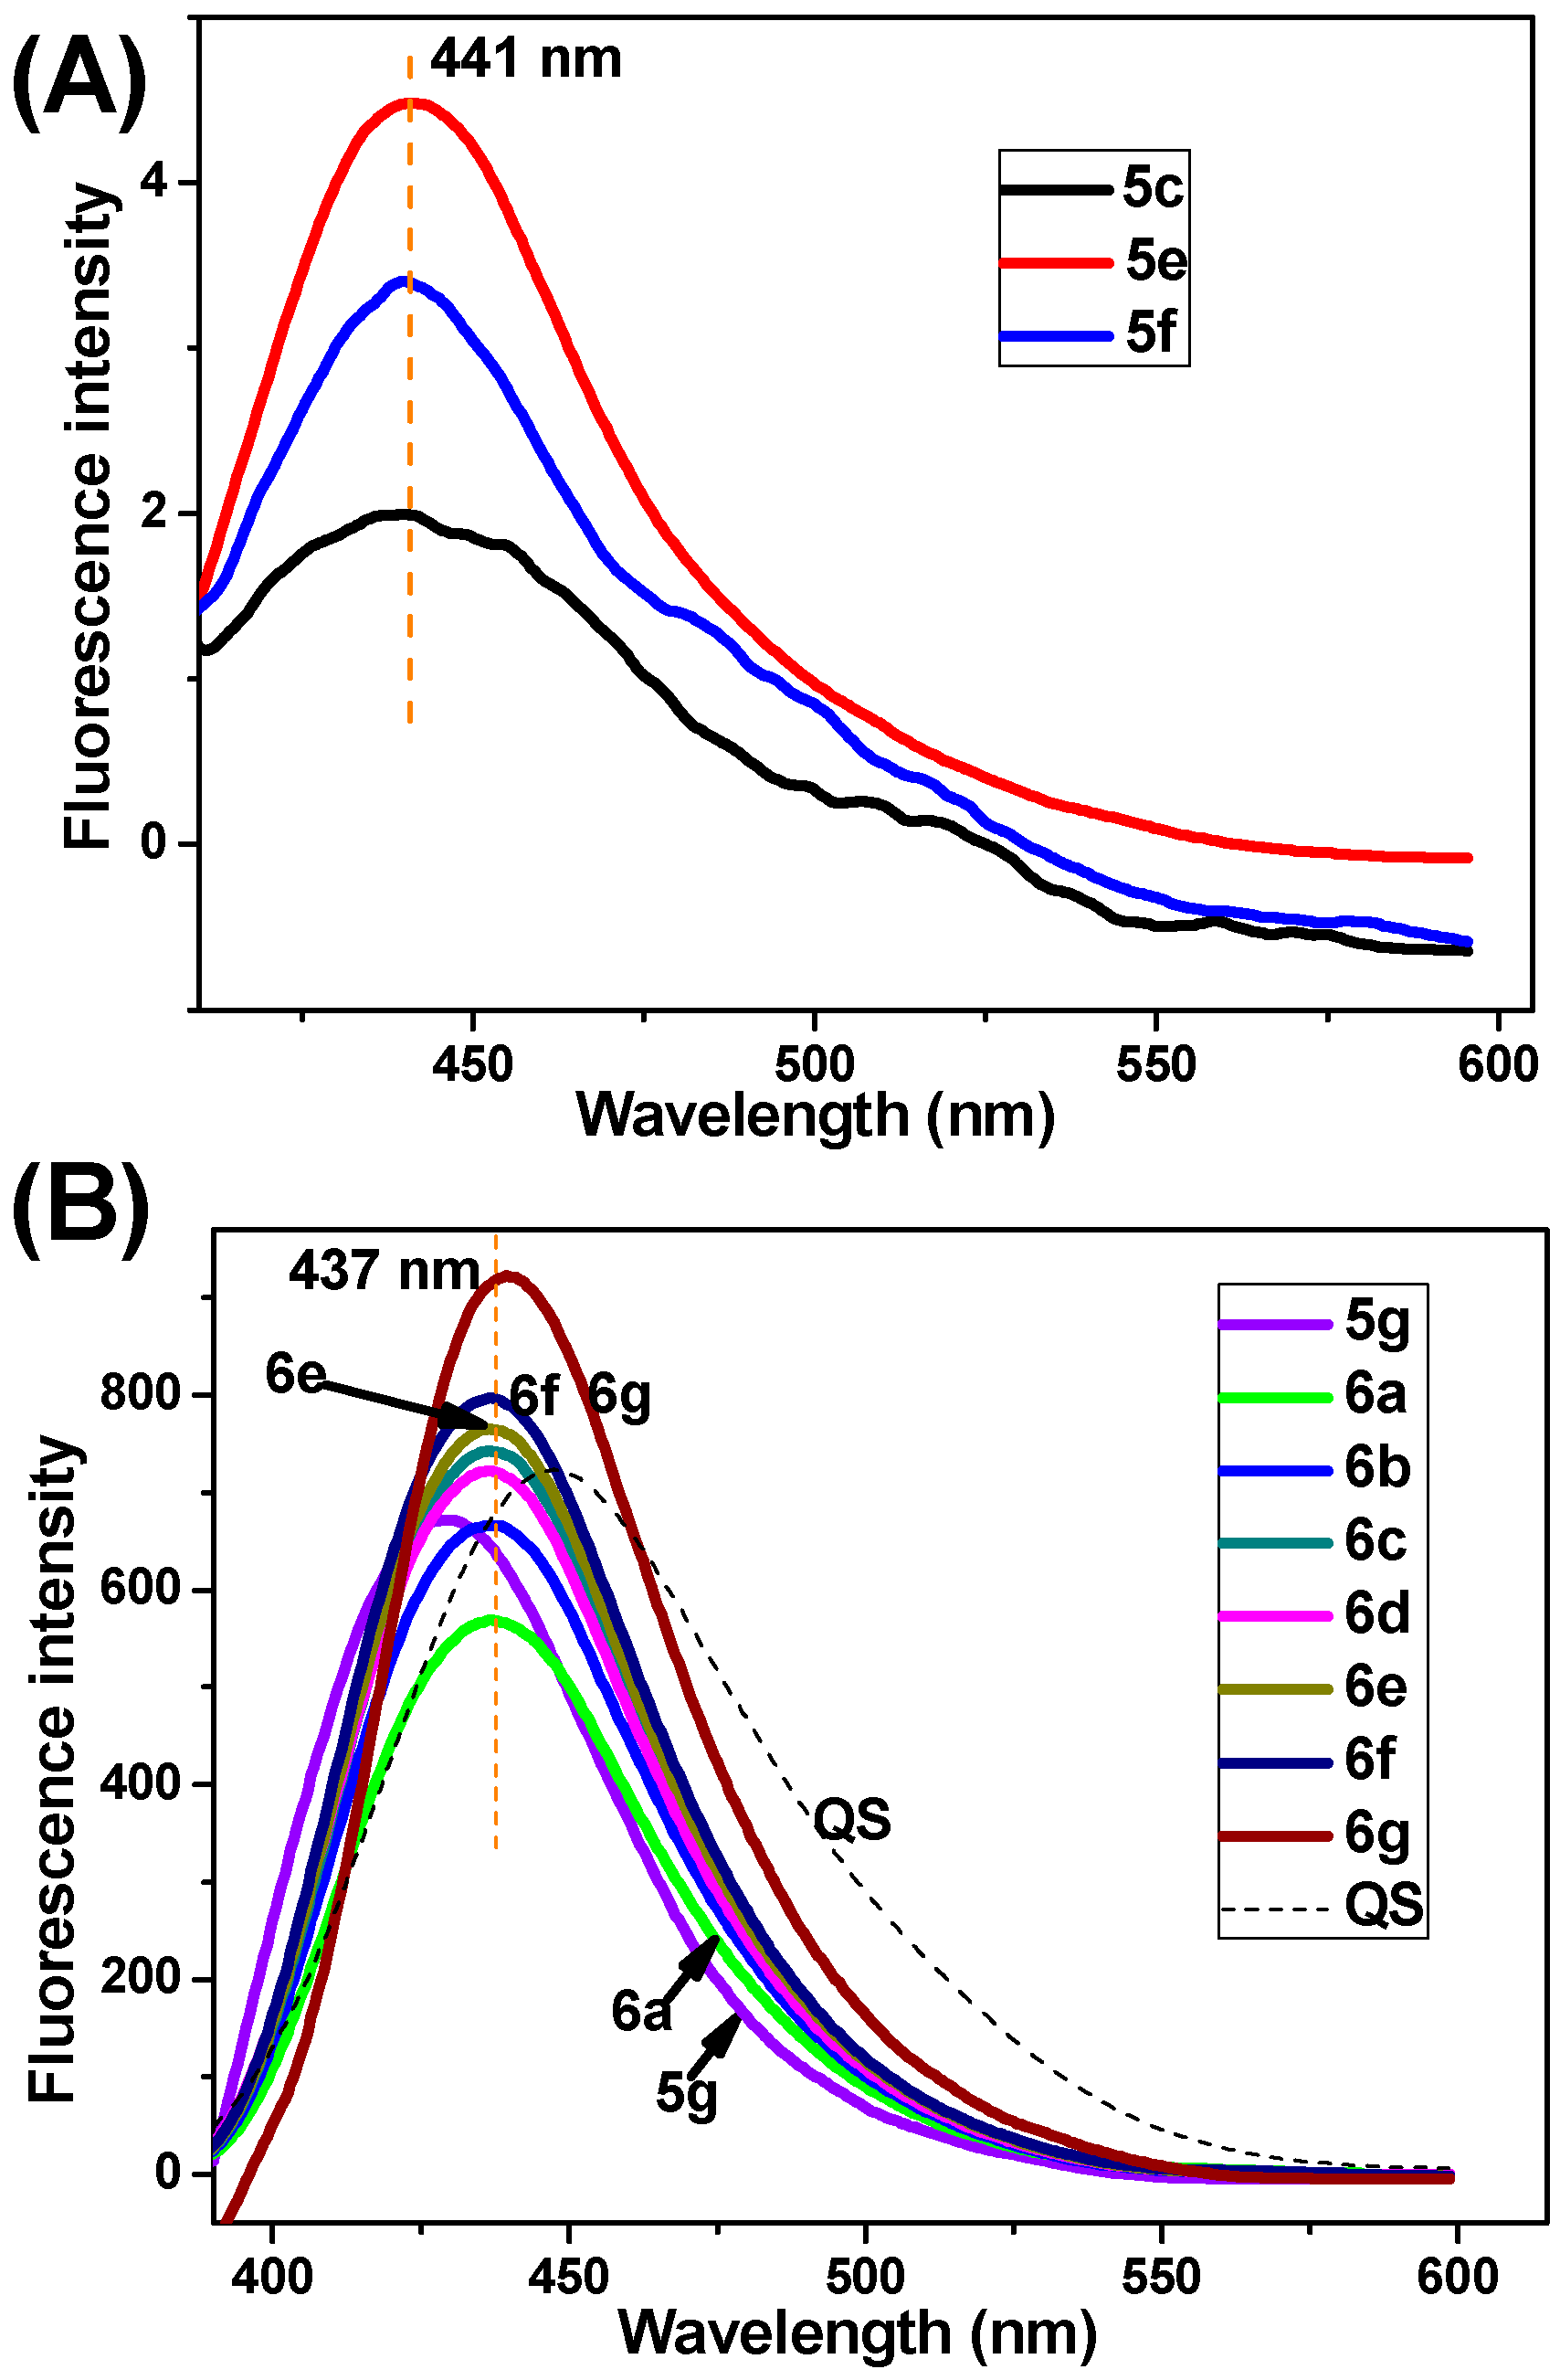
2.3. Absorption Spectra, Fluorescence Spectra, and Living Cell Imaging

Fluorescence bioimaging provides a facile and less cell-damaging means of visualizing analytes of biological interest in living cells. From the viewpoint of the potential application of the synthesized 3-oxo-3H-benzo[f]chromene-2-carboxylic acid derivatives in biological imaging, we investigated these compounds’ photophysical performance. Firstly, the ultraviolet-visible (UV-Vis) absorption spectra of several representative compounds were recorded in 1,2-dichloroethane solution (final concentration: 50 μM). As shown in Figure 5, these compounds have a nearly identical absorption band ranging from 360 to 410 nm. The fluorescence spectra in the excitation of 360 nm were recorded at the concentration of 5 μM (Figure 6). The compounds 5g and 6ag produce a strong blue emission band in the range of 430–445 nm, in comparison with 7-HC which has very weak fluorescence emission at 396 nm. At the same concentration (e.g., 5 μM), the fluorescence intensities of 3-oxo-3H-benzo[f]chromene-2-carboxylic acid esters 6ag are sequentially elevated with the increase in the chain length of the terminal alkyl groups (Figure 6B). Their fluorescence quantum yields (Φf) in the solution state were determined using the standard procedures, with quinine sulphate (QS) dissolved in 0.1 M sulphuric acid as a reference standard (Φf = 0.54) [27]. The UV-Vis and fluorescence data including the absorption (λabs) and fluorescence (λem) maximal values, Stokes shift (νabs − νem), and Φf are summarized in Table 4. Compared with 7-HC, a remarkable red shift phenomenon in absorption and emission spectra of compounds 5g and 6ag was observed. The above eight compounds display good Φf in the range of 0.44–0.66, which is superior to compounds 5af, 5h, 5i, and 7-HC with very low Φf (<0.1). Compound 6g has the highest Φf of 0.66. It is quite interesting that, as far as 3-oxo-3H-benzo[f]chromene-2-carboxylic acid esters are concerned, the Φf regularly increase with the prolongation of aliphatic chain, which is coincide with the changing trend of fluorescence intensity. Moreover, the Φf value of n-propyl ester is higher than i-propyl ester, suggesting that linear chain alkyl group may lead to the increase of Φf, compared with branched chain alkyl group if their carbon atoms in the alcoholic portion are equal.
Figure 5. The absorption spectra of several representative compounds. (A) Compounds 5c, 5e, 5f, 5g, 7-HC; (B) Compounds 6a, 6b, 6c, 6d, 6f, 6g. The above compounds (final concentration: 50 μM) were dissolved in 1,2-dichloroethane.
Molecules 20 18565 g005
Figure 6. The emission spectra of several representative compounds. (A) Compounds 5c, 5e, 5f; (B) Compounds 5g, 6a, 6b, 6c, 6d, 6e, 6f, 6g. The above compounds (final concentration: 5 μM) were dissolved in 1,2-dichloroethane (λex = 360 nm).
Molecules 20 18565 g006
Table 4. Optical data of several representative compounds.
EntryCompoundλabs, nm aλem, nm aStokes Shift bΦf
15c3834423485 cm−159 nm<0.1
25e3834413433 cm−158 nm<0.1
35f3814403519 cm−159 nm<0.1
45g3704343986 cm−164 nm0.49
56a3754373783 cm−162 nm0.44
66b3754373783 cm−162 nm0.51
76c3754373783 cm−162 nm0.58
86d3754373783 cm−162 nm0.52
96e3754373783 cm−162 nm0.60
106f3754373783 cm−162 nm0.62
116g3804413640 cm−161 nm0.66
127-HC3193966095 cm−171 nm<0.1
13QS c3484456264 cm−197 nm0.54
a Here refers to the λabs and λem values where the UV-Vis absorption and fluorescence intensity are maximum, respectively; b Stokes shifts are listed in units of both inverse centimeters and nanometers; c QS dissolved in 0.1 M sulphuric acid is selected as a reference standard to calculate the Φf of the synthesized target compounds.
After this, the application of the synthesized target compounds for living cell imaging was investigated. 7-HC, 5e, 5g, and 6g were selected as representative examples. Compounds 5g and 6g, dissolved in 1,2-dichloroethane and exposed to visible light, exhibited conspicuous blue fluorescence. However, almost no fluorescence was observed for 7-HC and 5e under the same conditions (Figure 7A). The former two emitted very strong fluorescence once they were exposed to ultraviolet light for a few seconds (Figure 7B). Living cells images were monitored with a confocal laser scanning microscope (CLSM) after treatment with the above compounds (Figure 7C–E). Emissions of 430–450 nm were collected when a laser at 360 nm was used as excitation. The cytoplasmic was selectively dyed (blue) by 5g and 6g; the nucleus was undyed (clear). Moreover, at the same concentration of 20 μM, intracellular fluorescence intensities: 6g > 5g > 7-HC. The cells stained with 7-HC released very weak fluorescence maybe due to its very low Φf, which was consistent with the previous report [28]. Photophysical studies reveal that at least compounds 5g and 6g with very low cytotoxicity are potential fluorescent probes for biological imaging in living cells.
Figure 7. Fluorescence and living cell imaging of representative compounds. (A) Color responses to visible light; (B) Fluorescence responses after excitation at 365 nm using an UV lamp; (CE) CLSM images after A549 cells were treated with 20 μM of 7-HC, 5g, and 6g for 30 min, respectively.
Molecules 20 18565 g007

3. Experimental Section

3.1. Chemistry

3.1.1. Material and Reagents

Proton nuclear magnetic resonance (1H-NMR) and 13C-NMR spectra were recorded in CDCl3 (or DMSO-d6) on a Bruker Avance 500 MHz NMR spectrometer at 500 and 125 MHz, respectively; chemical shifts were reported in parts per million using tetramethylsilane as an internal standard and were given in δ units. Uncorrected melting points were determined on an electrothermal melting point apparatus. High-resolution mass spectra (HRMS) were recorded on a New ultrafleXtreme MALDI TOF/TOF mass spectrometer (Bruker Daltonics Inc., Billerica, MA, USA). Column chromatography was performed on silica gel (300–400 mesh). Analytical TLC was carried out on E. Merck 0.25 mm silica gel 60 F-254 precoated plates with detection by UV light. Unless otherwise noted, all solvents and reagents were commercially available and used without further purification.

3.1.2. Synthesis of 3-Oxo-3H-benzo[f]chromene-2-carboxylic Acid (3)

The synthesis of 3-oxo-3H-benzo[f]chromene-2-carboxylic acid (3) was described elsewhere [17], but is summarized here for convenience. Briefly, ethanol (85 mL), Meldrum’s acid (6.5 g, 45 mmol), 2-hydroxy-1-naphthaldehyde (7.75 g, 45 mmol), and a catalytic amount of pyridine (0.5 mL) were in sequence added into a 100 mL flask. The mixture was stirred at 80 °C for 4 h. After cooling to room temperature, the mixture was poured into an ice-water bath and recrystallized. The crude was washed with ethanol repeatedly and dried in vacuo to afford the desired product 3-oxo-3H-benzo[f]chromene-2-carboxylic acid (3) as a yellow solid (Yield: 93.1%). M.p.: 235.1–236.5 °C (Lit. 234–236 °C [29]). 1H-NMR (DMSO-d6): δ 9.34 (s, 1H), 8.57 (d, J = 8.4 Hz, 1H), 8.29 (d, J = 9.0 Hz, 1H), 8.06 (d, J = 8.0 Hz, 1H), 7.78–7.73 (m, 1H), 7.64 (t, J = 7.2 Hz, 1H), 7.57 (d, J = 9.0 Hz, 1H). 13C-NMR (DMSO-d6): δ 164.78, 157.24, 155.49, 144.18, 136.30, 130.27, 129.50, 129.45, 126.88, 122.77, 117.68, 116.94, 112.55. ESI-HRMS (m/z): calcd. for C14H8O4 [M − H]: 239.03443; found: 239.03429.

3.1.3. General Procedures for the Preparation of 3-Oxo-3H-benzo[f]chromene-2-amides 5ai and 3-Oxo-3H-benzo[f]chromene-2-carboxylic Acid Esters 6ag

First of all, 3-oxo-3H-benzo[f]chromene-2-carbonyl chloride (4) was synthesized by the reaction of 3-oxo-3H-benzo[f]chromene-2-carboxylic acid (3, 2.40 g, 10 mmol) with thionyl chloride (2.2 mL, 30 mmol) in dry 1,2-dichloroethane (20 mL) at 60–70 °C for 4 h. After the removal of excess unreacted thionyl chloride under reduced pressure, the intermediate 4 was obtained and used directly in the next step without further purification. This intermediate 4 (1.29 g, 5 mmol) dissolved in dry dichloromethane (15 mL) was dropwise added to a mixture of a primary amine (6 mmol) and a catalytic amount of triethylamine (0.1 mL). The reaction mixture was stirred at room temperature for 10–30 min before the solvent was removed. The crude was purified by flash silica gel column chromatography to afford the final product 5ai. Compounds 6ag were also synthesized using the similar procedures, the only difference being that the primary amines described above were replaced by different aliphatic alcohols.
N-(3,5-Dimethylphenyl)-3-oxo-3H-benzo[f]chromene-2-carboxamide (5a). Yield: 74.4%; m.p.: 277.1–279.2 °C. 1H-NMR (CDCl3): δ 9.82 (s, 1H), 8.50 (d, J = 8.3 Hz, 1H), 8.18 (d, J = 9.1 Hz, 1H), 7.99 (d, J = 7.9 Hz, 1H), 7.82 (t, J = 7.7 Hz, 1H), 7.69 (t, J = 7.6 Hz, 1H), 7.58 (d, J = 8.9 Hz, 1H), 7.45 (s, 2H), 6.85 (s, 1H), 2.38 (s, 6H). 13C-NMR (CDCl3): δ 161.89, 159.64, 155.04, 144.35, 138.79, 137.59, 136.17, 130.46, 129.54, 129.36, 129.21, 126.91, 126.59, 121.98, 118.32, 117.19, 116.34, 113.54, 21.45. ESI-HRMS (m/z): calcd. for C22H17NO3 [M + Na]+: 366.11061; found: 366.10929.
N-(2,6-Diethylphenyl)-3-oxo-3H-benzo[f]chromene-2-carboxamide (5b). Yield: 35.4%; m.p.: 190.3–193.5 °C. 1H-NMR (CDCl3): δ 9.82 (s, 1H), 8.50 (d, J = 8.3 Hz, 1H), 8.18 (d, J = 9.0 Hz, 1H), 7.99 (d, J = 8.0 Hz, 1H), 7.82–7.78 (m, 1H), 7.68 (m, 1H), 7.59 (d, J = 9.1 Hz, 1H), 7.30 (dd, J = 12.4, 5.3 Hz, 1H), 7.22 (d, J = 7.6 Hz, 2H), 2.71 (q, J = 7.6 Hz, 4H), 1.26 (t, J = 7.6 Hz, 6H). 13C-NMR (CDCl3): δ 162.10, 160.85, 155.15, 144.79, 141.22, 136.17, 132.66, 130.45, 129.56, 129.28, 129.17, 128.01, 126.90, 126.42, 122.16, 116.89, 116.36, 113.47, 25.15, 14.52. ESI-HRMS (m/z): calcd. for C24H21NO3 [M + Na]+: 394.14191; found: 394.14231.
N-(4-(Tert-butyl)phenyl)-3-oxo-3H-benzo[f]chromene-2-carboxamide (5c). Yield: 22.7%; m.p.: 180.2–181.9 °C. 1H-NMR (CDCl3): δ 9.79 (s, 1H), 8.49 (d, J = 8.4 Hz, 1H), 8.16 (d, J = 9.0 Hz, 1H), 7.97 (d, J = 8.1 Hz, 1H), 7.84–7.77 (m, 1H), 7.69–7.63 (m, 1H), 7.56 (d, J = 9.0 Hz, 1H), 7.48–7.43 (m, 2H), 7.25–7.19 (m, 1H), 6.71–6.64 (m, 1H), 1.38 (s, 9H). 13C-NMR (CDCl3): δ 161.87, 159.58, 154.98, 147.80, 144.26, 143.70, 141.48, 136.09, 135.18, 130.43, 129.24, 126.89, 125.99, 122.02, 120.30, 117.14, 116.32, 114.98, 113.51, 34.49, 33.93, 31.40. ESI-HRMS (m/z): calcd. for C24H21NO3 [M + Na]+: 394.14191; found: 394.14090.
N-(4-Methoxyphenyl)-3-oxo-3H-benzo[f]chromene-2-carboxamide (5d). Yield: 61.2%; m.p.: 259.3–261.8 °C (Lit. 259–261 °C [30]). 1H-NMR (CDCl3): δ 9.82 (s, 1H), 8.51 (d, J = 8.4 Hz, 1H), 8.18 (d, J = 9.0 Hz, 1H), 7.99 (d, J = 8.1 Hz, 1H), 7.82 (t, J = 7.7 Hz, 1H), 7.73 (d, J = 8.9 Hz, 2H), 7.68 (t, J = 7.5 Hz, 1H), 7.58 (d, J = 9.0 Hz, 1H), 6.97 (d, J = 8.9 Hz, 2H), 3.86 (s, 3H). 13C-NMR (CDCl3): δ 161.93, 156.70, 154.98, 144.19, 136.08, 131.01, 130.47, 129.53, 129.30, 129.18, 126.89, 122.09, 122.04, 117.18, 116.34, 114.23, 113.56, 55.51. ESI-HRMS (m/z): calcd. for C21H15NO4 [M + Na]+: 368.08988; found: 368.08763.
N-(4-Ethoxyphenyl)-3-oxo-3H-benzo[f]chromene-2-carboxamide (5e). Yield: 80.3%; m.p.: 205.1–206.6 °C. 1H-NMR (CDCl3): δ 9.82 (s, 1H), 8.51 (d, J = 8.4 Hz, 1H), 8.17 (d, J = 9.0 Hz, 1H), 7.99 (d, J = 8.1 Hz, 1H), 7.82 (t, J = 7.2 Hz, 1H), 7.77–7.62 (m, 3H), 7.58 (d, J = 9.0 Hz, 1H), 7.04–6.82 (m, 2H), 4.08 (d, J = 7.0 Hz, 2H), 1.46 (s, 3H). 13C-NMR (CDCl3): δ 161.94, 159.45, 156.10, 154.99, 144.17, 136.06, 130.91, 130.48, 129.55, 129.31, 129.19, 126.89, 122.08, 117.22, 116.36, 114.85, 113.58, 63.72, 14.88. ESI-HRMS (m/z): calcd. for C22H17NO4 [M + H]+: 360.12358; found: 360.12223.
3-Oxo-N-(4-(trifluoromethyl)phenyl)-3H-benzo[f]chromene-2-carboxamide (5f). Yield: 73.9%; m.p.: 231.3–233.9 °C. 1H-NMR (CDCl3): δ 9.81 (s, 1H), 8.49 (d, J = 8.3 Hz, 1H), 8.16 (d, J = 9.0 Hz, 1H), 7.98 (d, J = 8.0 Hz, 1H), 7.81 (t, J = 7.7 Hz, 1H), 7.67 (t, J = 7.6 Hz, 1H), 7.57 (d, J = 8.9 Hz, 1H), 7.44 (s, 2H), 7.27 (s, 1H), 6.84 (s, 1H). 13C-NMR (CDCl3): δ 161.97, 160.16, 155.29, 145.02, 140.81, 136.69, 130.50, 129.54, 129.53, 129.50, 129.30, 127.08, 126.36, 126.34, 121.98, 120.23, 116.55, 116.34, 113.50. ESI-HRMS (m/z): calcd. for C21H12F3NO3 [M − H]: 382.06910; found: 382.06886.
3-Oxo-N-propyl-3H-benzo[f]chromene-2-carboxamide (5g). Yield: 88.1%; m.p.: 182.3–184.9 °C. 1H-NMR (CDCl3): δ 9.70 (s, 1H), 8.47 (d, J = 8.4 Hz, 1H), 8.13 (d, J = 9.0 Hz, 1H), 7.96 (d, J = 8.1 Hz, 1H), 7.79 (t, J = 7.5 Hz, 1H), 7.68–7.61 (m, 1H), 7.53 (d, J = 9.0 Hz, 1H), 3.50 (dd, J = 13.0, 7.0 Hz, 2H), 1.77–1.68 (m, 2H), 1.05 (t, J = 13.5 Hz, 3H). 13C-NMR (CDCl3): δ 161.86, 161.60, 154.83, 143.80, 135.70, 130.39, 129.56, 129.13, 126.75, 122.04, 117.08, 116.33, 113.38, 41.67, 22.74, 11.56. ESI-HRMS (m/z): calcd. for C17H15NO3 [M + Na]+: 304.09496; found: 304.09352.
N-Cyclohexyl-3-oxo-3H-benzo[f]chromene-2-carboxamide (5h). The process for the synthesis of compound 5h was described previously [31]. Yield: 89.1%; m.p.: 178.6–180.2 °C. 1H-NMR (CDCl3): δ 9.72 (s, 1H), 8.49 (d, J = 8.4 Hz, 1H), 8.14 (d, J = 9.0 Hz, 1H), 7.97 (d, J = 8.1 Hz, 1H), 7.83–7.77 (m, 1H), 7.69–7.63 (m, 1H), 7.54 (d, J = 9.0 Hz, 1H), 4.12–4.01 (m, 1H), 2.04 (m, 2H), 1.84–1.77 (m, 2H), 1.70–1.55 (m, 2H), 1.52–1.35 (m, 2H), 1.32–1.19 (m, 2H). 13C-NMR (CDCl3): δ 161.60, 160.83, 154.81, 143.76, 135.64, 130.40, 129.58, 129.14, 129.11, 126.73, 122.08, 117.29, 116.36, 113.43, 48.61, 32.80, 29.72, 25.62, 24.70. ESI-HRMS (m/z): calcd. for C20H19NO3 [M + H]+: 322.14432; found: 322.14298.
(Z)-N-(Octadec-9-en-1-yl)-3-oxo-3H-benzo[f]chromene-2-carboxamide (5i). Yield: 60.9%; m.p.: 79.1–81.8 °C. 1H-NMR (CDCl3): δ 9.62 (s, 1H), 8.40 (d, J = 8.5 Hz, 1H), 8.08 (d, J = 9.0 Hz, 1H), 7.91 (d, J = 8.1 Hz, 1H), 7.74 (dd, J = 11.3, 4.1 Hz, 1H), 7.61 (t, J = 7.5 Hz, 1H), 7.47 (d, J = 9.0 Hz, 1H), 5.44–5.30 (m, 2H), 3.51 (dd, J = 13.1, 7.0 Hz, 2H), 2.02 (d, J = 4.7 Hz, 4H), 1.72–1.62 (m, 2H), 1.38–1.19 (m, 22H), 0.88 (t, J = 6.9 Hz, 3H). 13C-NMR (CDCl3): δ 161.73, 161.49, 154.73, 143.59, 135.60, 130.31, 129.88, 129.82, 129.08, 126.70, 121.96, 117.01, 116.26, 113.28, 40.00, 31.91, 29.78, 29.76, 29.70, 29.53, 29.45, 29.33, 29.26, 27.22, 27.07, 22.69, 14.13. ESI-HRMS (m/z): calcd. for C32H43NO3 [M − H]: 488.31647; found: 488.31728.
Methyl 3-oxo-3H-benzo[f]chromene-2-carboxylate (6a). Yield: 92.1%; m.p.: 161.6–163.2 °C (Lit. 162–163 °C [32]). 1H-NMR (CDCl3): δ 9.39 (s, 1H), 8.35 (d, J = 8.3 Hz, 1H), 8.12 (d, J = 9.0 Hz, 1H), 7.94 (d, J = 8.1 Hz, 1H), 7.76 (m, 1H), 7.63 (m, 1H), 7.48 (d, J = 9.1 Hz, 1H), 4.02 (s, 3H). 13C-NMR (CDCl3): δ 164.24, 156.96, 156.12, 145.16, 136.36, 130.23, 129.45, 129.29, 129.21, 126.63, 121.53, 116.68, 116.03, 112.36, 53.05. ESI-HRMS (m/z): calcd. for C15H10O4 [M + Na]+: 277.04768; found: 277.04710.
Ethyl 3-oxo-3H-benzo[f]chromene-2-carboxylate (6b). Yield: 93.1%; m.p.: 116.6–118.1 °C (Lit. 118–119 °C [32]). 1H-NMR (CDCl3): δ 9.30 (s, 1H), 8.31 (d, J = 8.2 Hz, 1H), 8.10 (d, J = 9.0 Hz, 1H), 7.94 (d, J = 8.1 Hz, 1H), 7.76 (m, 1H), 7.63 (t, J = 7.5 Hz, 1H), 7.46 (m, 1H), 4.50 (d, J = 7.1 Hz, 2H), 1.48 (s, 3H). 13C-NMR (CDCl3): δ 163.56, 156.89, 155.94, 144.49, 136.14, 130.17, 129.38, 129.26, 129.13, 126.58, 121.47, 116.64, 116.40, 112.26, 62.09, 14.35. ESI-HRMS (m/z): calcd. for C16H12O4 [M + Na]+: 291.06333; found: 291.06174.
n-Propyl 3-oxo-3H-benzo[f]chromene-2-carboxylate (6c). Yield: 88.5%; m.p.: 85.2–86.9 °C (Lit. 86–88 °C [33]). 1H-NMR (CDCl3): δ 9.26 (s, 1H), 8.27 (d, J = 8.4 Hz, 1H), 8.07 (d, J = 9.0 Hz, 1H), 7.92 (d, J = 8.1 Hz, 1H), 7.74 (t, J = 7.7 Hz, 1H), 7.60 (t, J = 7.5 Hz, 1H), 7.43 (d, J = 9.0 Hz, 1H), 4.37 (t, J = 6.8 Hz, 2H), 1.86 (m, 2H), 1.08 (t, J = 7.4 Hz, 3H). 13C-NMR (CDCl3): δ 163.66, 156.83, 155.93, 144.37, 136.09, 130.15, 129.37, 129.26, 129.13, 126.57, 121.43, 116.64, 116.47, 112.24, 67.56, 22.07, 10.51. ESI-HRMS (m/z): calcd. for C17H14O4 [M + Na]+: 305.07898; found: 305.07756.
Isopropyl 3-oxo-3H-benzo[f]chromene-2-carboxylate (6d). Yield: 85.2%; m.p.: 95.2–97.9 °C. 1H-NMR (CDCl3): δ 9.23 (s, 1H), 8.29 (d, J = 8.4 Hz, 1H), 8.07 (d, J = 9.0 Hz, 1H), 7.92 (d, J = 8.1 Hz, 1H), 7.76–7.72 (m, 1H), 7.62–7.58 (m, 1H), 7.44 (d, J = 9.0 Hz, 1H), 5.32 (m, 1H), 1.44 (d, J = 6.3 Hz, 6H). 13C-NMR (CDCl3): δ 162.97, 156.88, 155.85, 143.96, 135.97, 130.17, 129.33, 129.26, 129.07, 126.54, 121.47, 116.89, 116.69, 112.25, 69.81, 29.72, 21.91. ESI-HRMS (m/z): calcd. for C17H14O4 [M + Na]+: 305.07898; found: 305.07824.
n-Butyl 3-oxo-3H-benzo[f]chromene-2-carboxylate (6e). Yield: 83.1%; m.p.: 60.1–62.6 °C (Lit. 60–62 °C [33]). 1H-NMR (CDCl3): δ 9.27 (s, 1H), 8.28 (d, J = 8.3 Hz, 1H), 8.08 (d, J = 9.0 Hz, 1H), 7.92 (d, J = 8.1 Hz, 1H), 7.74 (m, 1H), 7.60 (m, 1H), 7.44 (d, J = 9.0 Hz, 1H), 4.41 (t, J = 6.8 Hz, 2H), 1.94–1.77 (m, 2H), 1.54–1.47 (m, 2H), 1.03 (t, J = 7.4 Hz, 3H). 13C-NMR (CDCl3): δ 163.71, 156.86, 155.96, 144.42, 136.11, 130.18, 129.40, 129.27, 129.13, 126.57, 121.46, 116.68, 116.52, 112.28, 65.93, 30.70, 19.23, 13.82. ESI-HRMS (m/z): calcd. for C18H16O4 [M + Na]+: 319.09463; found: 319.09340.
Tert-pentyl-3-oxo-3H-benzo[f]chromene-2-carboxylate (6f). Yield: 83.6%; m.p.: 49.4–51.8 °C. 1H-NMR (CDCl3): δ 9.32 (s, 1H), 8.32 (d, J = 8.4 Hz, 1H), 8.11 (d, J = 9.0 Hz, 1H), 7.95 (d, J = 8.1 Hz, 1H), 7.77 (m, 1H), 7.66–7.61 (m, 1H), 7.48 (d, J = 9.0 Hz, 1H), 1.56–1.42 (m, 6H), 1.40 (m, 2H), 0.92 (t, J = 7.1 Hz, 3H). 13C-NMR (CDCl3): δ 164.35, 156.87, 151.96, 141.45, 136.11, 132.38, 129.21, 127.12, 121.34, 119.67, 117.18, 114.52, 107.49, 72.22, 36.81, 25.28, 8.73. ESI-HRMS (m/z): calcd. for C19H18O4 [M + Na]+: 333.11028; found: 333.11101.
n-Hexyl 3-oxo-3H-benzo[f]chromene-2-carboxylate (6g). Yield: 88.4%; m.p.: 44.3–46.7 °C. 1H-NMR (CDCl3): δ 9.09 (s, 1H), 8.15 (d, J = 8.5 Hz, 1H), 7.99 (d, J = 9.0 Hz, 1H), 7.85 (d, J = 8.1 Hz, 1H), 7.68 (t, J = 8.2 Hz, 1H), 7.58–7.53 (m, 1H), 7.35–7.30 (m, 1H), 4.37 (t, J = 6.9 Hz, 2H), 1.82–1.74 (m, 2H), 1.47–1.29 (m, 6H), 0.92–0.87 (m, 3H). 13C-NMR (CDCl3): δ 163.49, 156.67, 155.73, 144.07, 135.97, 130.00, 129.19, 129.09, 126.52, 121.27, 116.48, 116.26, 112.04, 66.13, 31.44, 28.59, 25.60, 22.55, 14.04. ESI-HRMS (m/z): calcd. for C20H20O4 [M + Na]+: 347.12593; found: 347.12554.

3.2. Biological Activity

3.2.1. Cell Antiproliferative Activity Assay

The proliferation inhibitory activities of the synthesized target compounds 5ai and 6ag were evaluated using NSCLC cell lines (A549 and NCI-H460) by the MTT method in vitro with 7-HC and cisplatin as positive reference drugs. A549 and NCI-H460 cell lines were purchased from American Type Culture Collection (Rockville, MD, USA). Both cell lines were cultured in Dulbecco’s modified Eagle medium, 10% fetal bovine serum, 100 μg/mL penicillin, and 100 μg/mL streptomycin in humidified air at 37 °C. After the cells were seeded in 96-well culture plates and co-incubated with the compounds for different time, 20 μL of MTT solution (5 mg/mL) was added to each well and incubated for another 4 h at 37 °C. The formazan precipitate was dissolved in 100 μL DMSO and the absorbance at 495 nm of each well was measured using a microplate reader. All assays were conducted with four parallel samples. IC50 values were obtained by nonlinear regression using Origin software (version 8.0).

3.2.2. Apoptosis Detection by Flow Cytometry

The extent of apoptosis was measured quantitatively by Annexin V binding assay [34]. Briefly, A549 cells in 60 mm dishes were treated with the indicated concentrations of compound 5e or positive reference 7-HC at 37 °C. The cells floating in the supernatant were combined with the adherent fraction, washed with phosphate buffered saline (PBS) thrice, and incubated with Annexin V-FITC and PI for 15 min at 37 °C in the dark according to the manufacturer’s instructions (BD Biosciences, San Jose, CA, USA). The samples were immediately analyzed using a FACSCalibur flow cytometry system. The percentages of viable (Annexin V−/PI−), early apoptotic (Annexin V+/PI−), late apoptotic (Annexin V+/PI+), and necrotic (Annexin V−/PI+) cells were determined using FlowJo software (Tree Star, Inc., Ashland, OR, USA). For each sample, 1 × 10⁴ cells were collected. All experiments were performed in triplicate.

3.2.3. Cell Cycle Distribution Analysis

Cell-cycle analysis was carried out by flow cytometry, as previously described [35]. In brief, after treatment with compound 5e for different time, A549 cells were washed with PBS, fixed with 70% cold ethanol, and stored at −20 °C overnight. Fixed cells were washed with PBS again and sequentially incubated with RNase A (50 μg/mL) for 30 min and PI (50 μg/mL) for 15 min in the dark. The distribution of the cell cycle was determined by flow cytometry. The data were analyzed using ModFit software (Becton Dickinson, San Jose, CA, USA). All assays were conducted with three parallel samples, and 1 × 10⁴ cells were collected for each sample.

3.2.4. Determination of Intracellular ROS Production

The DCFH-DA assay was used to determine the intracellular ROS level [36]. After treatment with compound 5e, A549 cells were trypsinized, washed with PBS, and incubated with DCFH-DA at a final concentration of 10 μM for additional 20 min at 37 °C. The fluorescence intensity of the cell suspensions was measured using flow cytometry. For each sample, 1 × 10⁴ cells were collected. All experiments were performed in triplicate.
A fluorescence spectrometer was used for quantitative evaluation of intracellular ROS level changes [37]. After A549 cells were treated with compound 5e, harvested and washed with PBS, the fluorescence intensity was detected using a Perkin Elmer LS55 spectrofluorimeter (PerkinElmer, Inc., Waltham, MA, USA). The results are expressed as the relative ROS level with the untreated cells. All experiments were performed in triplicate.

3.3. UV-Vis Absorption and Fluorescence Experiments

The UV-Vis spectra were recorded on an Agilent Cary 60 (Agilent Technologies, Santa Clara, CA, USA) spectrometer. The fluorescence emission was measured using the above spectrofluorimeter (see Section 3.2.4). The fluorescence quantum yield of QS in 0.1 M sulphuric acid solution was used as a reference standard. The following equation was used to calculate the fluorescence quantum yield of the target compounds:
Φs = Φr I s A r n s 2 I r A s n r 2
where Φ is the fluorescence quantum yield. I stands for the integrated area under the emission curves. The subscripts s and r stand for sample and reference, respectively. A is the absorbance at a particular excitation wavelength; n is the refractive index of the medium. For living cell imaging, A549 cells were seeded on 35 mm glass-bottomed dishes at a density of 1 × 10⁵ cells/dish in culture medium and incubated overnight. The cells were treated with 10 and 20 μM of 7-HC, 5g, and 6g, respectively. After washing twice with PBS, the cells were immediately observed under a CLSM (Carl Zeiss LSM710, Oberkochen, Germany) using the excitation channel (λex = 360 nm).

3.4. Data Analysis

Except where mentioned, data were presented as means ± SD. One-way analysis of variance test was performed on the data to assess the impact of the variables on the results (n = 3 or more). A p value of ≤0.05 was considered to be statistically significant.

4. Conclusions

In summary, two series of 3-oxo-3H-benzo[f]chromene-2-carboxylic acid derivatives were successfully prepared by a simple and convenient method. Among all the target compounds, 5e showed the strongest proliferation inhibitory activity. In vitro pharmacological analysis demonstrated that compound 5e exerted its activity against A549 cell line by inducing apoptosis and intracellular ROS generation, arresting cell cycle at the G0/G1 phase, suggesting it may be a promising lead for antitumor drug discovery in the future. Photophysical studies revealed that compound 6g exhibited very low cytotoxicity and superior fluorescence properties, implying it may be a potential candidate for biological imaging.

Supplementary Materials

Supplementary materials include the following items: (1) 1H-NMR spectra of the compounds 5e, 5g, and 6g; (2) 13C-NMR spectrum of the compound 5g; (3) HRMS spectra of the compounds 5e and 6g. These data can be accessed at: https://www.mdpi.com/1420-3049/20/10/18565/s1.

Acknowledgments

This work was supported by the National Natural Science Foundation of China (No. 21364002, 21262006, 21462007, 81260472, 201502028, and 81260472), National Basic Research Program of China (2012CB723501), IRT1225, Guangxi Natural Science Foundation of China (No. 2013GXNSFBA019200, 2013GXNSFGA019001, and 2012GXNSFDA053007), State Key Laboratory Cultivation Base for the Chemistry and Molecular Engineering of Medicinal Resources (No. CMEMR2012-A01 and CMEMR2013-C03), Guangxi Education Department Common Project (No. 2013YB025), Guangxi Pharmaceutical Industry Talent Small Highland Project (No. 1313 and 1105), and Guangxi Normal University Key Project (No. 2011ZD006).

Author Contributions

The synthesis was done by Xiao-Bo Fu, Xian-Fu Wang, and Jia-Nian Chen. The biological activity and fluorescence analyses were finished by De-Wen Wu and Ting Li, Xing-Can Shen and Jiang-Ke Qin contributed reagents/materials/analysis tools. All of the authors contributed equally to the preparation of the manuscript.

Conflicts of Interest

The authors declare no conflict of interest.

References

  1. Monti, M.; Pinotti, M.; Appendino, G.; Dallocchio, F.; Bellini, T.; Antognoni, F.; Poli, F.; Bernardi, F. Characterization of anti-coagulant properties of prenylated coumarin ferulenol. Biochim. Biophys. Acta 2007, 1770, 1437–1440. [Google Scholar] [CrossRef] [PubMed]
  2. Bhattacharyya, S.S.; Paul, S.; Mandal, S.K.; Banerjee, A.; Boujedaini, N.; Khuda-Bukhsh, A.R. A synthetic coumarin (4-methyl-7-hydroxycoumarin) has anti-cancer potentials against DMBA-induced skin cancer in mice. Eur. J. Pharmacol. 2009, 614, 128–136. [Google Scholar] [CrossRef] [PubMed]
  3. Musa, M.A.; Cooperwood, J.S.; Khan, M.O. A review of coumarin derivatives in pharmacotherapy of breast cancer. Curr. Med. Chem. 2008, 15, 2664–2679. [Google Scholar] [CrossRef] [PubMed]
  4. Peng, X.M.; Damu, G.L.; Zhou, C. Current developments of coumarin compounds in medicinal chemistry. Curr. Pharm. Des. 2013, 19, 3884–3930. [Google Scholar] [CrossRef] [PubMed]
  5. Zhang, W.; Li, Z.; Zhou, M.; Wu, F.; Hou, X.; Luo, H.; Liu, H.; Han, X.; Yan, G.; Ding, Z.; et al. Synthesis and biological evaluation of 4-(1,2,3-triazol-1-yl)coumarin derivatives as potential antitumor agents. Bioorg. Med. Chem. Lett. 2014, 24, 799–807. [Google Scholar] [CrossRef] [PubMed]
  6. Kudo, E.; Taura, M.; Matsuda, K.; Shimamoto, M.; Kariya, R.; Goto, H.; Hattori, S.; Kimura, S.; Okada, S. Inhibition of HIV-1 replication by a tricyclic coumarin GUT-70 in acutely and chronically infected cells. Bioorg. Med. Chem. Lett. 2013, 23, 606–609. [Google Scholar] [CrossRef] [PubMed]
  7. Yu, D.; Suzuki, M.; Xie, L.; Morris-Natschke, S.L.; Lee, K.H. Recent progress in the development of coumarin derivatives as potent anti-HIV agents. Med. Res. Rev. 2003, 23, 322–345. [Google Scholar] [PubMed]
  8. Chen, X.; Pi, R.; Zou, Y.; Liu, M.; Ma, X.; Jiang, Y.; Mao, X.; Hu, X. Attenuation of experimental autoimmune encephalomyelitis in C57 BL/6 mice by osthole, a natural coumarin. Eur. J. Pharmacol. 2010, 629, 40–46. [Google Scholar] [CrossRef] [PubMed]
  9. Subramaniam, S.R.; Ellis, E.M. Neuroprotective effects of umbelliferone and esculetin in a mouse model of Parkinson’s disease. J. Neurosci. Res. 2013, 91, 453–461. [Google Scholar] [CrossRef] [PubMed]
  10. Basanagouda, M.; Shivashankar, K.; Kulkarni, M.V.; Rasal, V.P.; Patel, H.; Mutha, S.S.; Mohite, A.A. Synthesis and antimicrobial studies on novel sulfonamides containing 4-azidomethyl coumarin. Eur. J. Med. Chem. 2010, 45, 1151–1157. [Google Scholar] [CrossRef] [PubMed]
  11. El-Haggar, R.; Al-Wabli, R.I. Anti-inflammatory screening and molecular modeling of some novel coumarin derivatives. Molecules 2015, 20, 5374–5391. [Google Scholar] [CrossRef] [PubMed]
  12. Aggarwal, R.; Kumar, S.; Kaushik, P.; Kaushik, D.; Gupta, G.K. Synthesis and pharmacological evaluation of some novel 2-(5-hydroxy-5-trifluoromethyl-4,5-dihydropyrazol-1-yl)-4-(coumarin-3-yl)thiazoles. Eur. J. Med. Chem. 2013, 62, 508–514. [Google Scholar] [CrossRef] [PubMed]
  13. Riveiro, M.E.; Kimpe, D.N.; Moglioni, A.; Vázquez, R.; Monczor, F.; Shayo, C.; Davio, C. Coumarins: Old compounds with novel promising therapeutic perspectives. Curr. Med. Chem. 2010, 17, 1325–1338. [Google Scholar] [CrossRef] [PubMed]
  14. Rong, L.; Liu, L.H.; Chen, S.; Cheng, H.; Chen, C.S.; Li, Z.Y.; Qin, S.Y.; Zhang, X.Z. A coumarin derivative as a fluorogenic glycoproteomic probe for biological imaging. Chem. Commun. 2014, 50, 667–669. [Google Scholar] [CrossRef] [PubMed]
  15. Zou, Q.; Fang, Y.; Zhao, Y.; Zhao, H.; Wang, Y.; Gu, Y.; Wu, F. Synthesis and in vitro photocytotoxicity of coumarin derivatives for one- and two-photon excited photodynamic therapy. J. Med. Chem. 2013, 56, 5288–5294. [Google Scholar] [CrossRef] [PubMed]
  16. Long, L.; Zhou, L.; Wang, L.; Meng, S.; Gong, A.; Du, F.; Zhang, C. A coumarin-based fluorescent probe for biological thiols and its application for living cell imaging. Org. Biomol. Chem. 2013, 11, 8214–8220. [Google Scholar] [CrossRef]
  17. Xiao, J.M.; Feng, L.; Zhou, L.S.; Gao, H.Z.; Zhang, Y.L.; Yang, K.W. Novel fluorescent cephalosporins: Synthesis, antimicrobial activity and photodynamic inactivation of antibiotic resistant bacteria. Eur. J. Med. Chem. 2013, 59, 150–159. [Google Scholar] [CrossRef]
  18. Song, A.; Wang, X.; Lam, K.S. A convenient synthesis of coumarin-3-carboxylic acids via Knoevenagel condensation of Meldrum’s acid with ortho-hydroxyaryl aldehydes or ketones. Tetrahedron Lett. 2003, 44, 1755–1758. [Google Scholar] [CrossRef]
  19. Gao, W.T.; Hou, W.D.; Zheng, M.R.; Tang, L.J. Clean and convenient one-pot synthesis of 4-hydroxycoumarin and 4-hydroxy-2-quinolinone derivatives. Synth. Commun. 2010, 40, 732–738. [Google Scholar] [CrossRef]
  20. Scott, J.L.; Raston, C.L. Solvent-free synthesis of 3-carboxycoumarins. Green Chem. 2000, 2, 245–247. [Google Scholar] [CrossRef]
  21. Bahador, K.; Mahnaz, F.; Saeed, K. Rapid Synthesis of novel and known coumarin-3-carboxylic acids using stannous chloride dihydrate under solvent-free conditions. Helv. Chim. Acta 2012, 95, 455–460. [Google Scholar]
  22. Garino, C.; Tomita, T.; Pietrancosta, N.; Laras, Y.; Rosas, R.; Herbette, G.; Maigret, B.; Quéléver, G.; Iwatsubo, T.; Kraus, J.L. Naphthyl and coumarinyl biarylpiperazine derivatives as highly potent human β-secretase inhibitors. Design, synthesis, and enzymatic BACE-1 and cell assays. J. Med. Chem. 2006, 49, 4275–4285. [Google Scholar] [CrossRef] [PubMed]
  23. Schiller, J.H.; Harrington, D.; Belani, C.P.; Langer, C.; Sandler, A.; Krook, J.; Zhu, J.; Johnson, D.H.; Eastern Cooperative Oncology Group. Comparison of four chemotherapy regimens for advanced non-small-cell lung cancer. N. Engl. J. Med. 2002, 346, 92–98. [Google Scholar] [CrossRef] [PubMed]
  24. Cai, Y.; Yan, X.; Zhang, G.; Zhao, W.; Jiao, S. The predictive value of ERCC1 and p53 for the effect of panobinostat and cisplatin combination treatment in NSCLC. Oncotarget 2015, 6, 18997–19005. [Google Scholar] [CrossRef] [PubMed]
  25. Sorensen, S.F.; Carus, A.; Meldgaard, P. Intravenous or oral administration of vinorelbine in adjuvant chemotherapy with cisplatin and vinorelbine for resected NSCLC. Lung Cancer 2015, 88, 167–173. [Google Scholar] [CrossRef] [PubMed]
  26. Dhaheri, A.Y.; Attoub, S.; Ramadan, G.; Arafat, K.; Bajbouj, K.; Karuvantevida, N.; AbuQamar, S.; Eid, A.; Iratni, R. Carnosol induces ROS-mediated beclin1-independent autophagy and apoptosis in triple negative breast cancer. PLoS ONE 2014, 9. [Google Scholar] [CrossRef]
  27. Ahipa, T.N.; Adhikari, A.V. New cyanopyridone based luminescent liquid crystalline materials: Synthesis and characterization. Photochem. Photobiol. Sci. 2014, 13, 1496–1508. [Google Scholar]
  28. Nizomov, N.; Kholov, A.U.; Ishchenko, A.A.; Ishchenko, V.V.; Khilya, V.P. Electronic structure and spectral fluorescence properties of umbelliferone and herniarin. J. Appl. Spectrosc. 2007, 74, 626–634. [Google Scholar]
  29. Irvine, M.W.; Costa, B.M.; Volianskis, A.; Fang, G.; Ceolin, L.; Collingridge, G.L.; Monaghan, D.T.; Jane, D.E. Coumarin-3-carboxylic acid derivatives as potentiators and inhibitors of recombinant and native N-methyl-d-aspartate receptors. Neurochem. Int. 2012, 61, 593–600. [Google Scholar]
  30. Ukhov, S.V.; Syropyatov, B.Y.; Novikova, V.V.; Balabash, V.A.; Shustov, A.S.; Odegova, T.F. Synthesis and biological activity of substituted 2-iminobenzo[f]coumarin-3-carboxylic acid amides. Pharm. Chem. J. 2011, 45, 228–230. [Google Scholar]
  31. El-Sharief, A.M.S.; Bedair, A.H.; Aly, F.M.; Mourad, A.E.; El-Agrody, A.M. Some reactions with 3-carbethoxy-5,6-benzocoumarin and related compounds. Egypt. J. Chem. 1983, 25, 41–51. [Google Scholar]
  32. He, X.W.; Shang, Y.J.; Zhou, Y.; Yu, Z.Y.; Han, G.; Jin, W.J.; Chen, J.J. Synthesis of coumarin-3-carboxylic esters via FeCl3-catalyzed multicomponent reaction of salicylaldehydes, Meldrum’s acid and alcohols. Tetrahedron 2015, 71, 863–868. [Google Scholar] [CrossRef]
  33. Wang, Z.X.; Peng, M.S.; Song, X.P.; Wang, F. Study on synthesis and fluorescent properties of alkyl benzocoumarin-3-carboxylates. J. Anhui Agric. Sci. 2011, 39, 6314–6315, 6344. [Google Scholar]
  34. Wang, H.M.; Zhang, L.; Liu, J.; Yang, Z.L.; Zhao, H.Y.; Yang, Y.; Shen, D.; Lu, K.; Fan, Z.C.; Yao, Q.W.; et al. Synthesis and anti-cancer activity evaluation of novel prenylated and geranylated chalcone natural products and their analogs. Eur. J. Med. Chem. 2015, 92, 439–448. [Google Scholar] [CrossRef] [PubMed]
  35. Song, Y.; Xin, Z.; Wan, Y.; Li, J.; Ye, B.; Xue, X. Synthesis and anticancer activity of some novel indolo[3,2-b]andrographolide derivatives as apoptosis-inducing agents. Eur. J. Med. Chem. 2015, 90, 695–706. [Google Scholar] [CrossRef] [PubMed]
  36. Rastogi, R.P.; Singh, S.P.; Häder, D.P.; Sinha, R.P. Detection of reactive oxygen species (ROS) by the oxidant-sensing probe 2′,7′-dichlorodihydrofluorescein diacetate in the cyanobacterium Anabaena variabilis PCC 7937. Biochem. Biophys. Res. Commun. 2010, 397, 603–607. [Google Scholar] [CrossRef] [PubMed]
  37. Sarma, M.D.; Ghosh, R.; Patra, A.; Hazra, B. Synthesis of novel aminoquinonoid analogues of diospyrin and evaluation of their inhibitory activity against murine and human cancer cells. Eur. J. Med. Chem. 2008, 43, 1878–1888. [Google Scholar] [CrossRef] [PubMed]
  • Sample Availability: Samples of the compounds 5e, 5g, and 6g are available from the authors.

