
Qualitative and Quantitative Analysis of the Major Constituents in Shexiang Tongxin Dropping Pill by HPLC-Q-TOF-MS/MS and UPLC-QqQ-MS/MS

 ,
,
Abstract
:1. Introduction
2. Results and Discussion
2.1. Optimization of HPLC Conditions
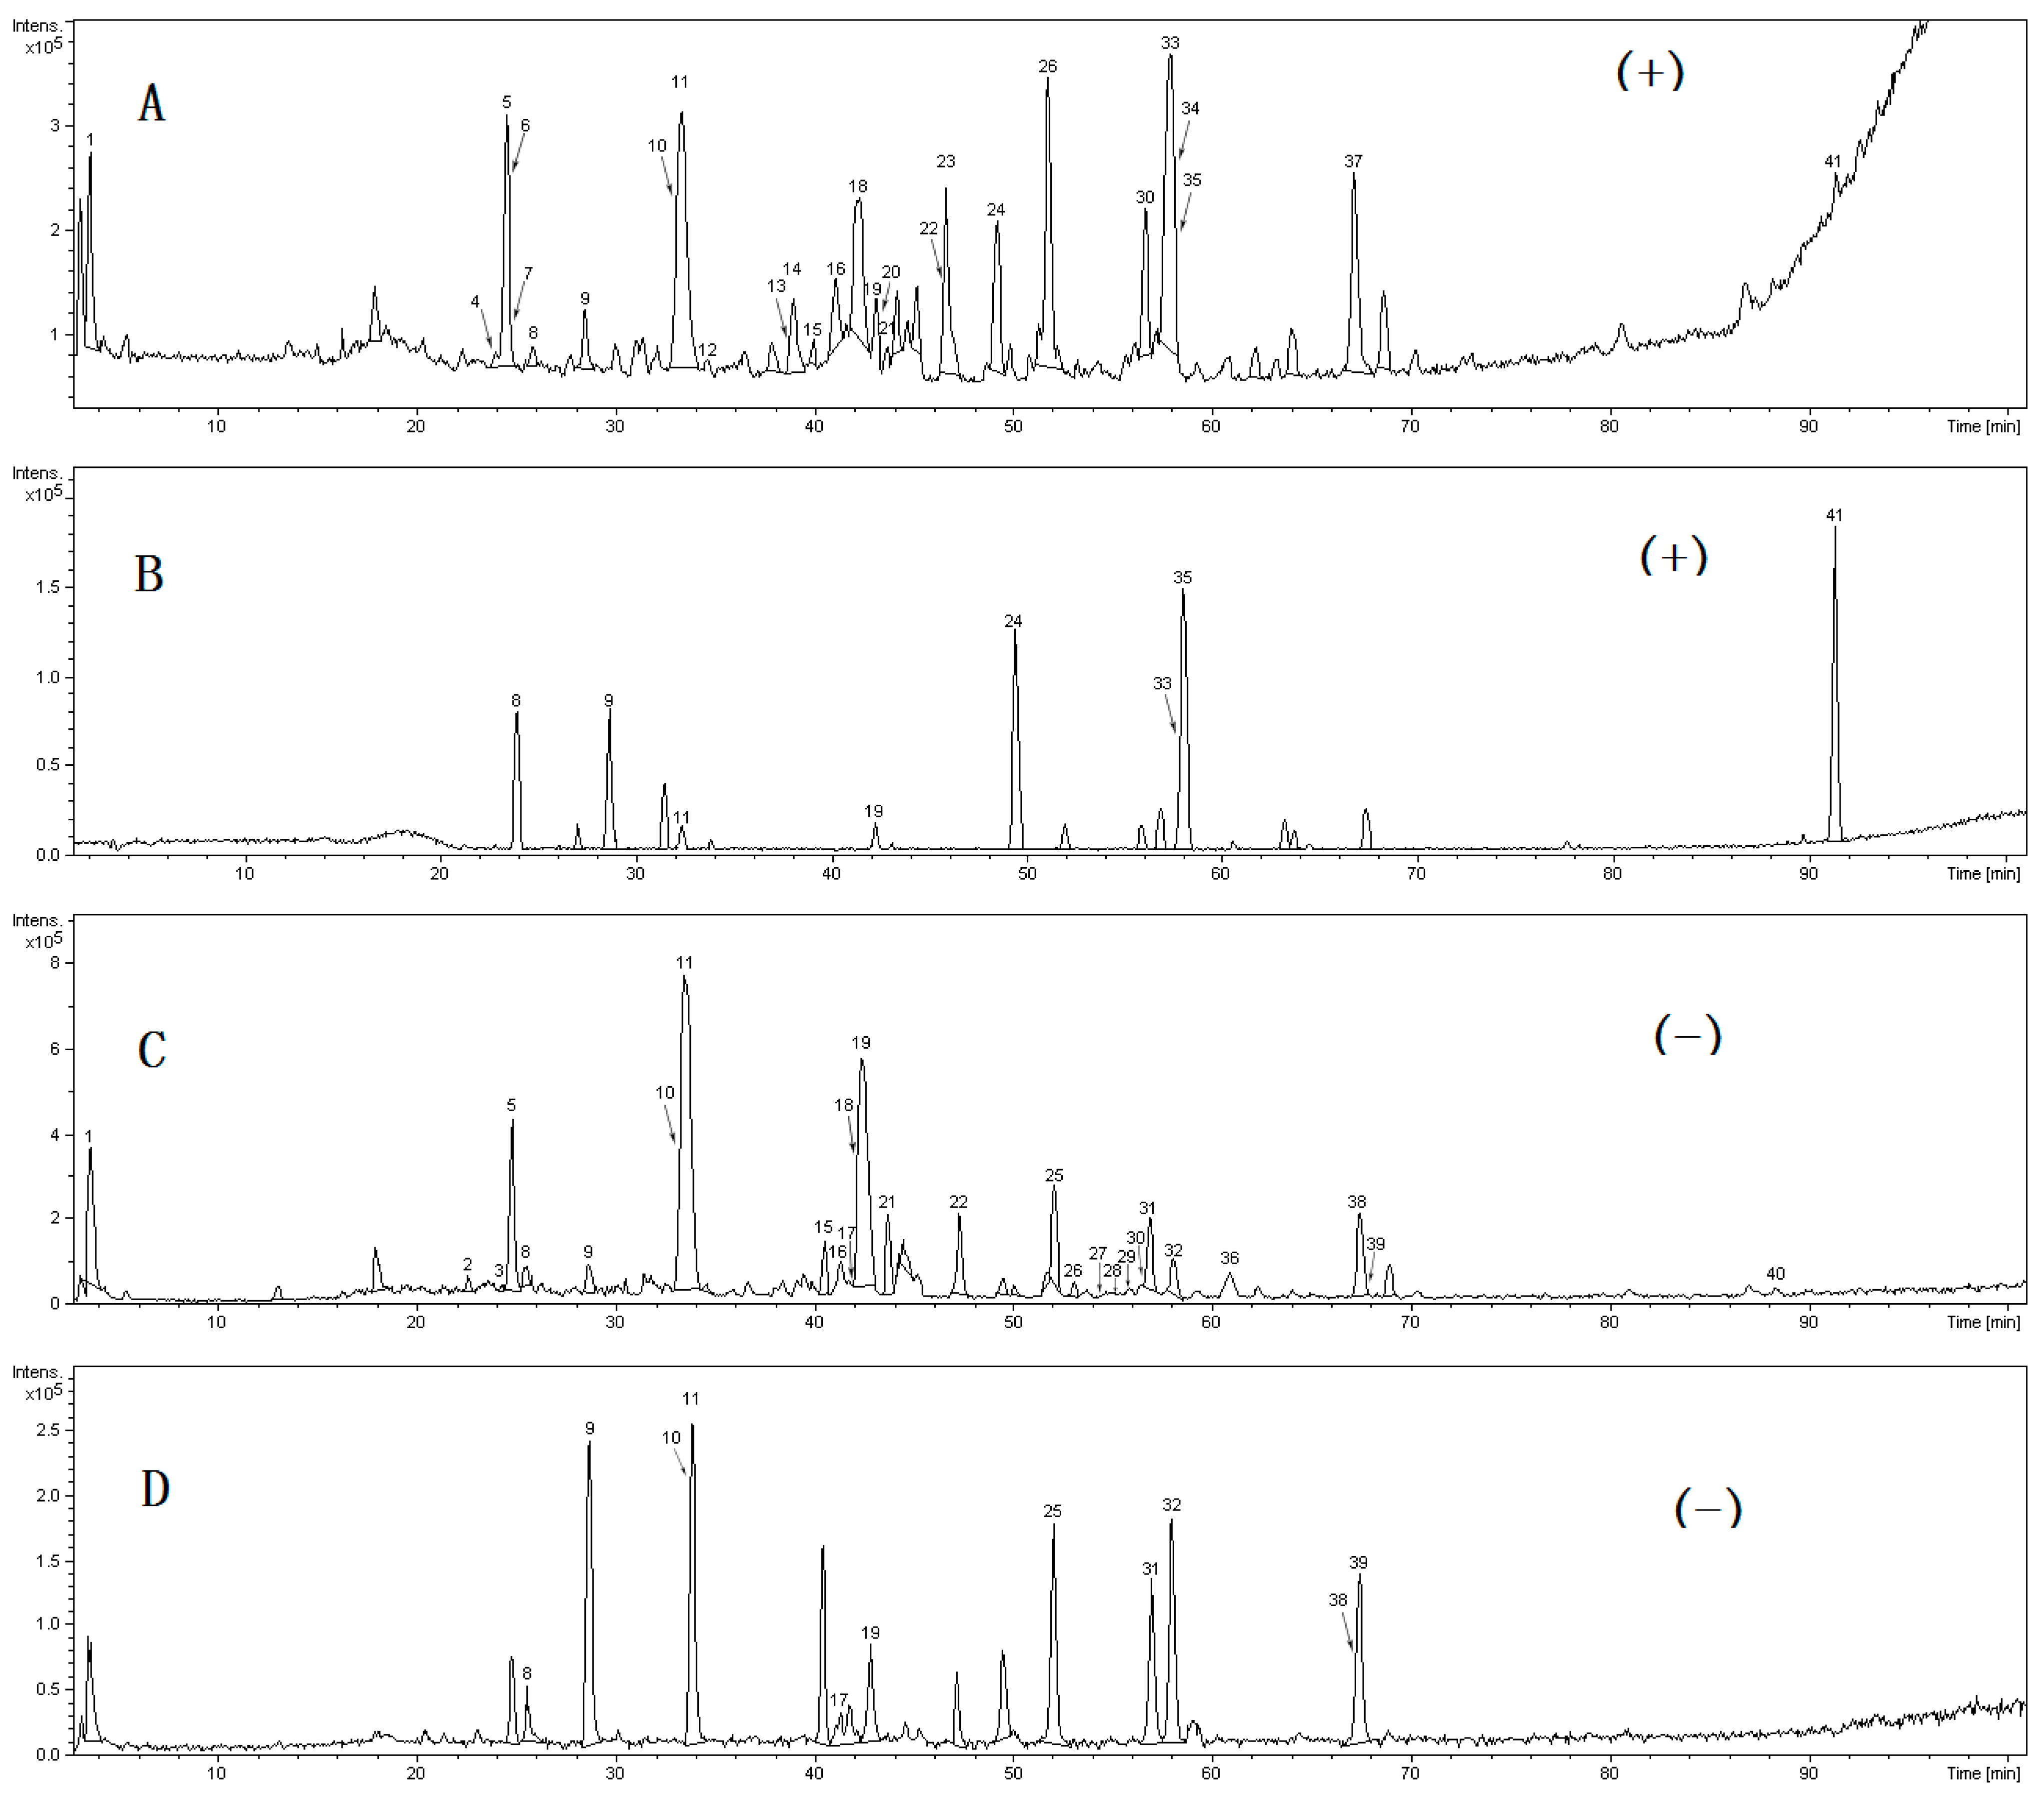
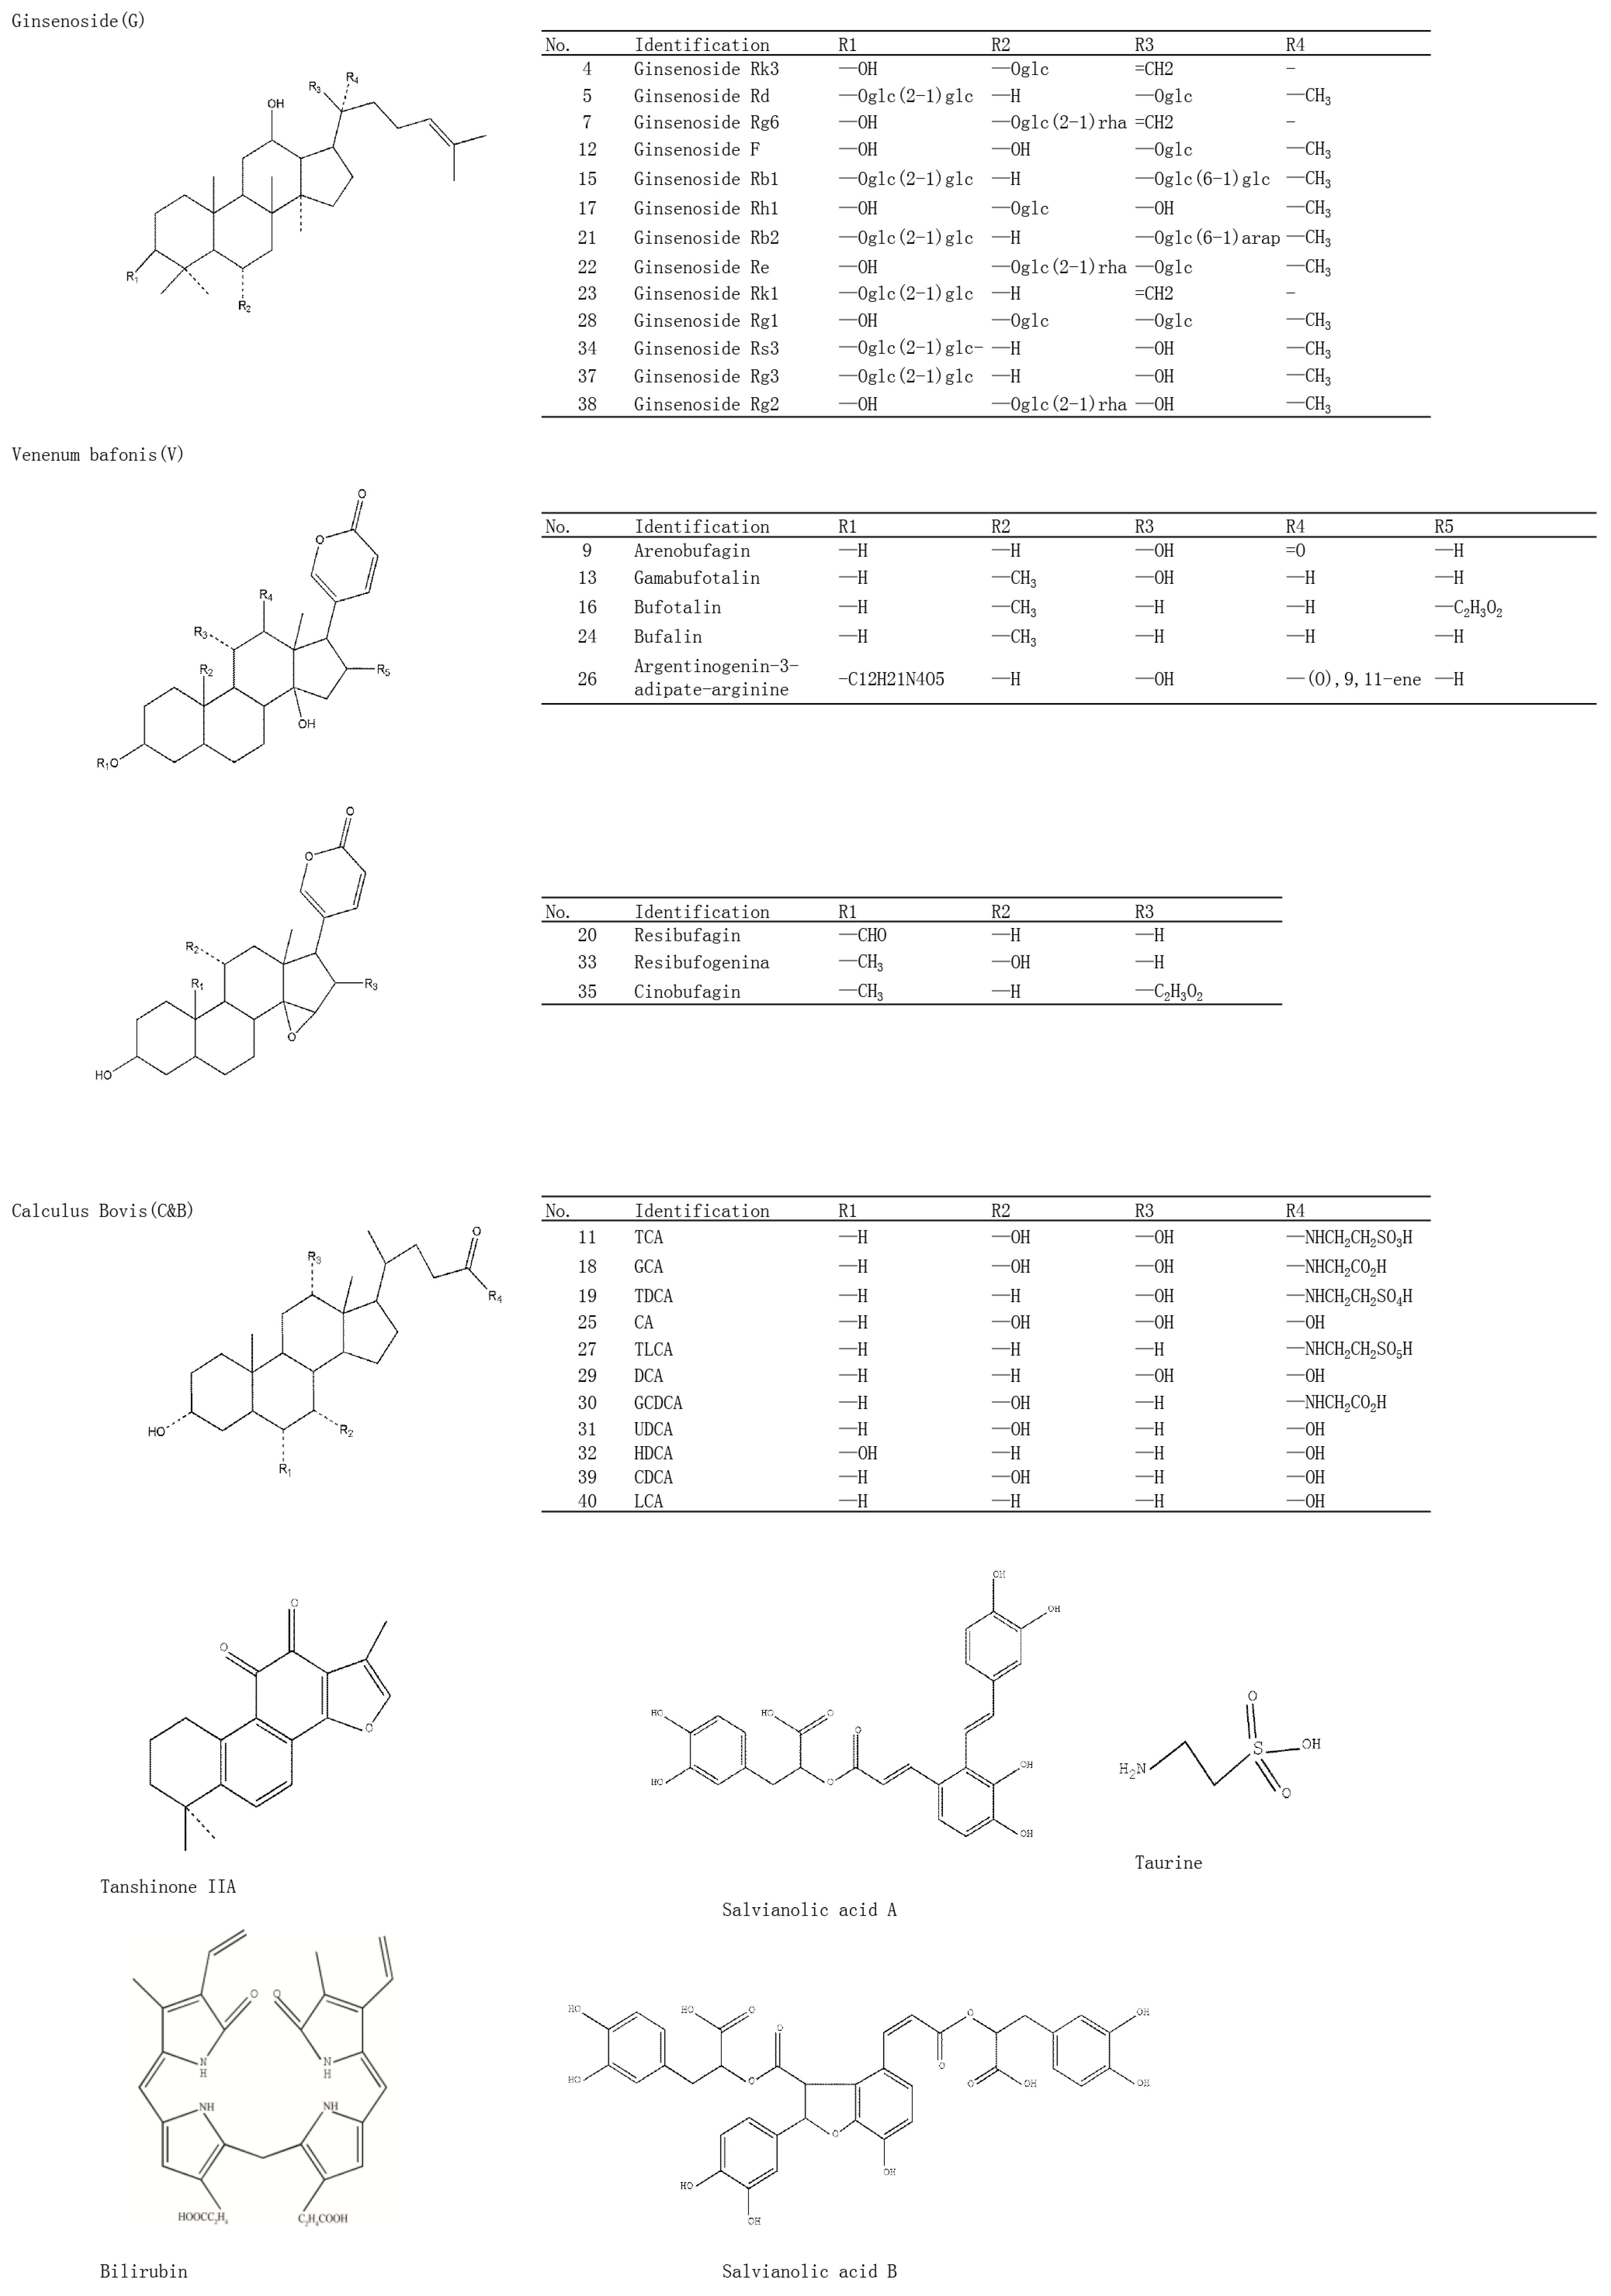
2.2. HPLC-Q-TOF-MS/MS Qualitative Analysis of Chemical Constituents in STP

| No. | Source | Identification | Rt (min) | Formula | Negative Ion (m/z) | |||
|---|---|---|---|---|---|---|---|---|
| [M − H]− | Quasi-Molecular Ion | Error (ppm) | MSMS (m/z) | |||||
| 1 | C & B | Taurine | 3.7 | C2H7NO3S | 124.0063 | 124.0065 | 2 | |
| 2 | R | Salvianolic acid A | 23.8 | C26H22O10 | 493.1129 | 493.1133 | 1 | |
| 3 | C & B | Bilirubin | 24.2 | C33H35N4O6 | 583.2551 | 583.2518 | 6 | 583.2518, 469.3944,356.4968, 243.8168 |
| 4 | G | Ginsenoside Rk3 | NA | C36H60O8 | 619.4204 | NA | ||
| 5 | G | Ginsenoside Rd | 24.9 | C48H82O18 | 945.5417 | 945.5405 | 1 | |
| 6 | R | Tanshinaldehyde | NA | C19H16O4 | 307.0965 | NA | ||
| 7 | G | Ginsenoside Rg6 | NA | C42H70O12 | 765.4784 | NA | ||
| 8 a | R | Salvianolic acid B | 25.5 | C36H30O16 | 717.1450 | 717.1454 | 0 | 717.1454, 537.0995, 527.9935, 493.1069, 339.0521, 321.0405, 295.0633 |
| 9 a | V | Arenobufagin | 28.7 | C24H32O6 | 415.2115 | 415.2115 | 0 | 415.2115, 397.2063, 371.2165, 353.2112, 277.1492, 196.5435, 151.0702 |
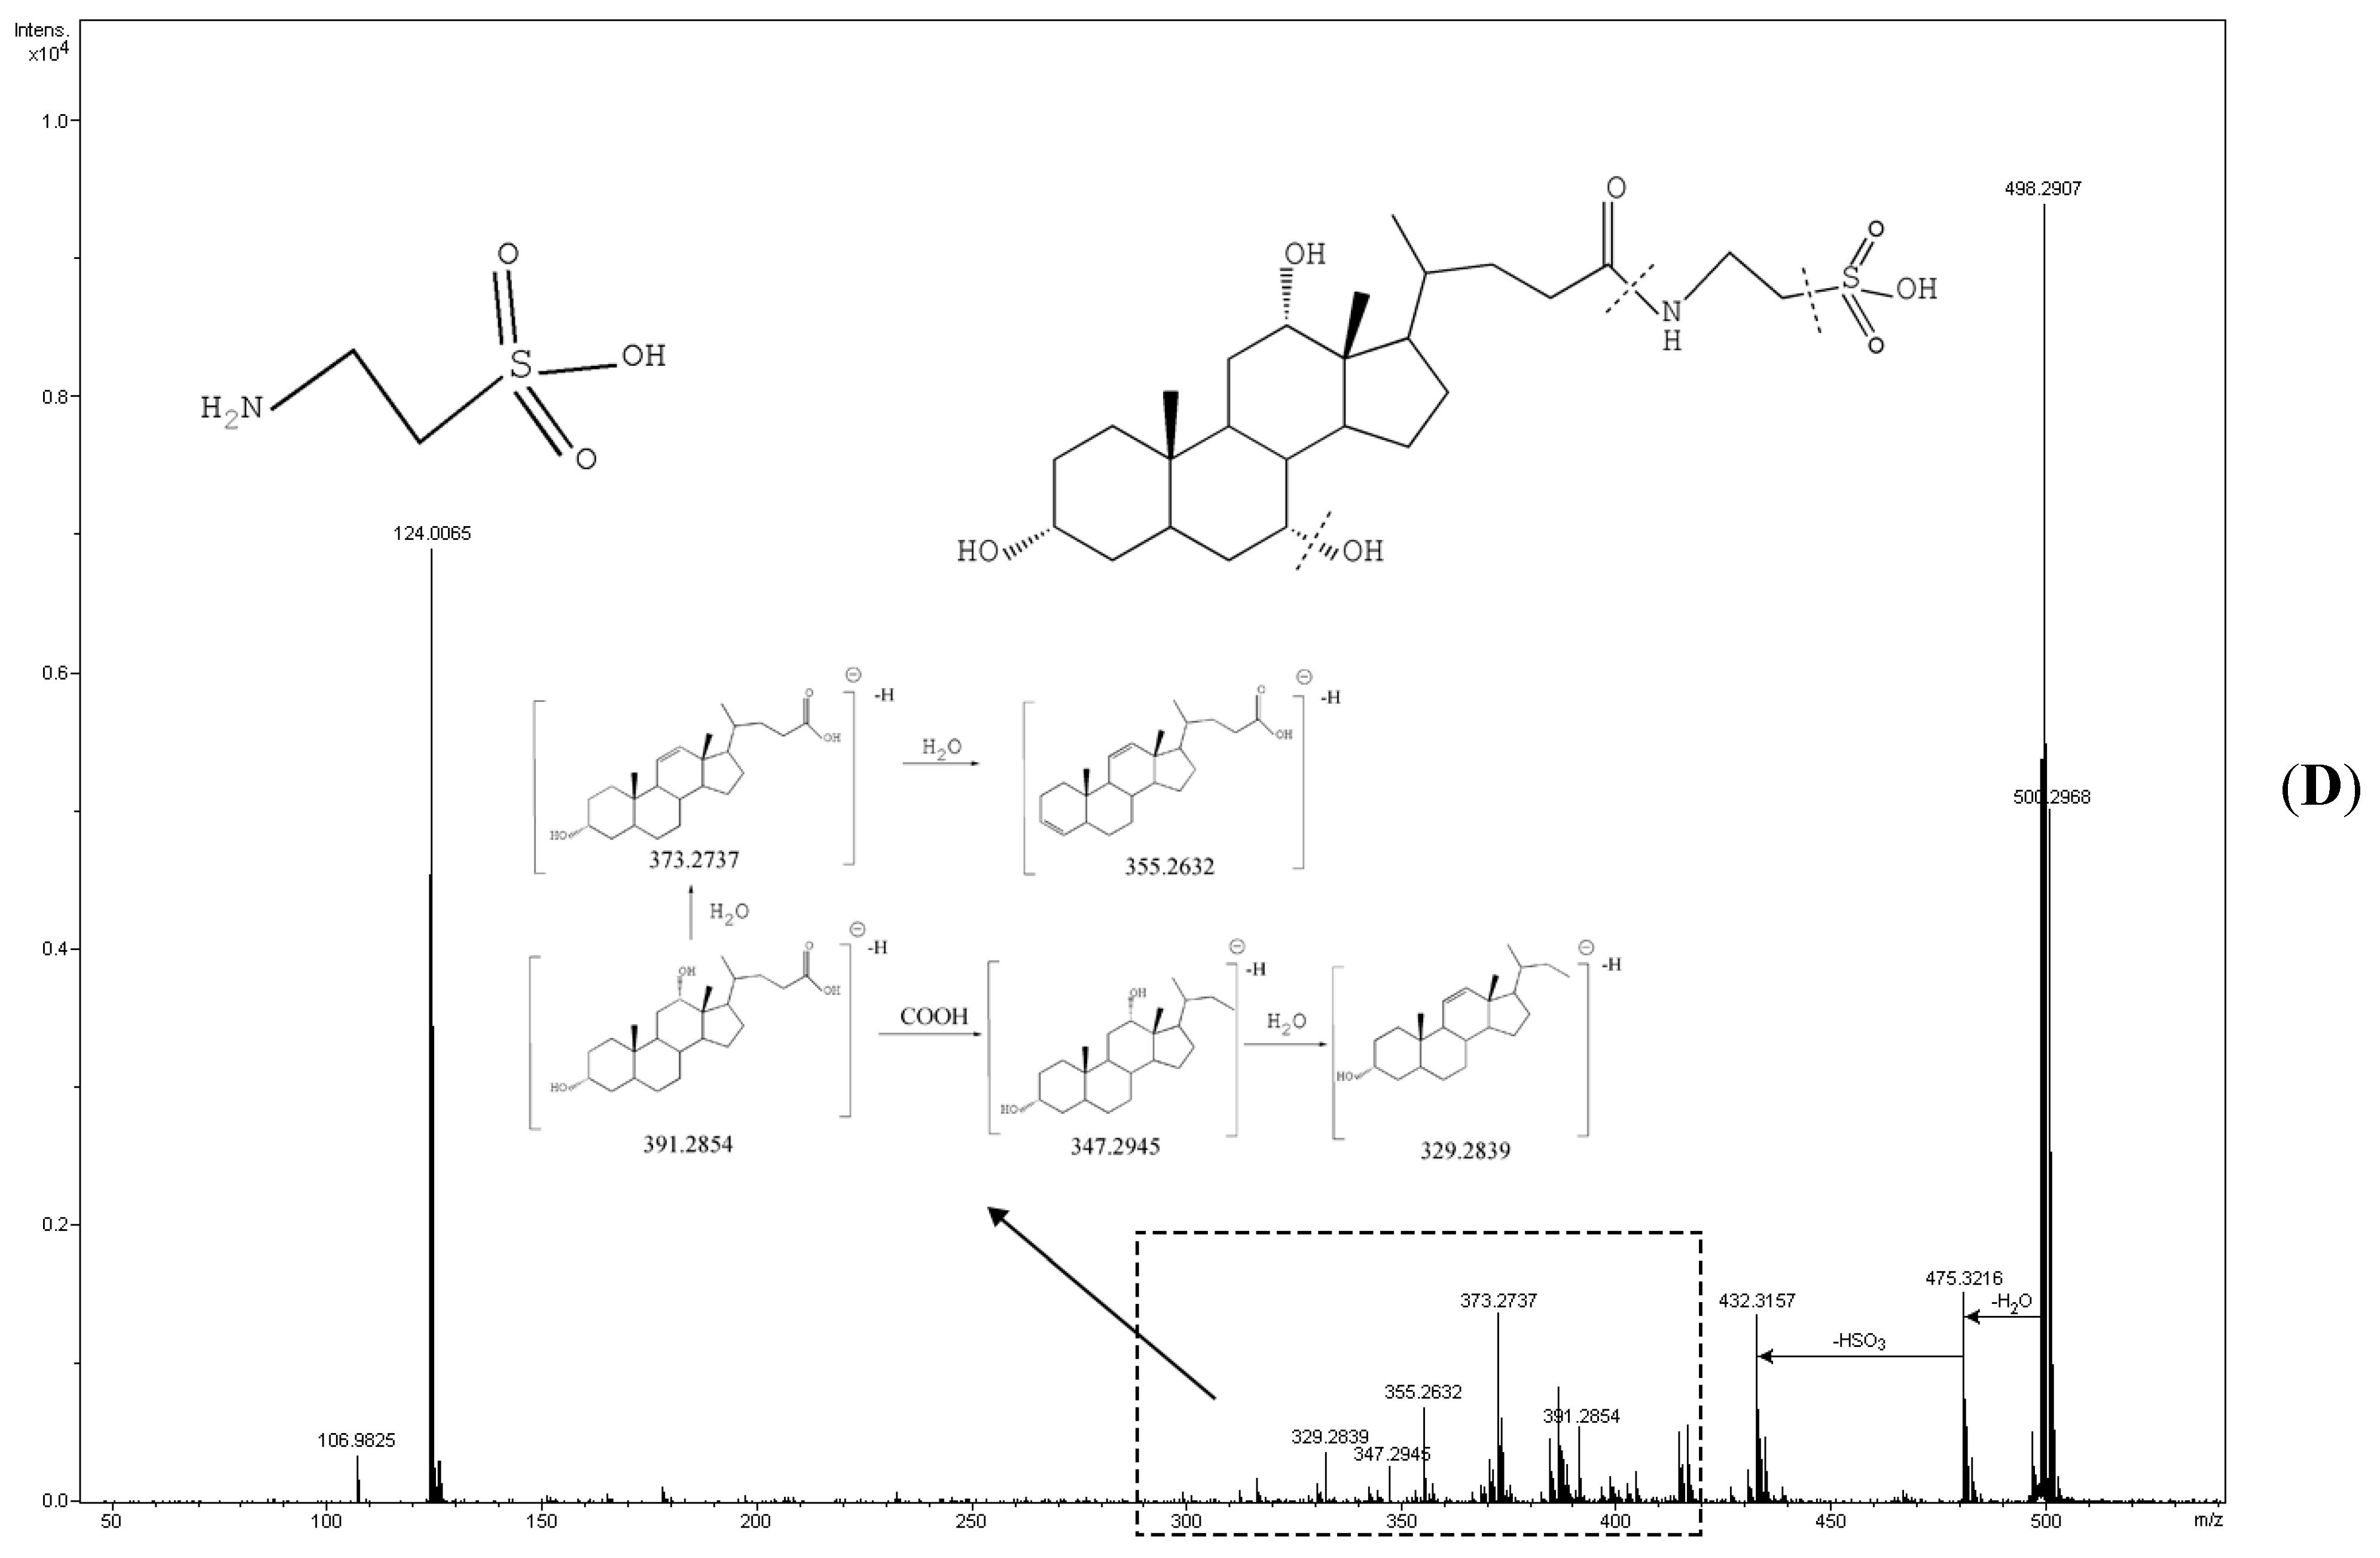
| 10 a | C & B | TDCANa | 33.8 | C26H44NNaO6S | 498.2884 | 498.2885 | 0 | 498.2907, 475.3216, 458.8943, 391.5463 |
| 11 a | C & B | TCA | 33.8 | C26H44NO7S | 514.2833 | 514.2856 | 4 | 514.2856, 496.2486, 482.3441, 124.1263 |
| 12 | G | Ginsenoside Rf | NA | C35H76O19 | 799.4897 | NA | ||
| 13 | V | Gamabufotalin | NA | C24H34O5 | 401.2323 | NA | ||
| 14 | G | Notoginsenoside R2 | NA | C41H70O13 | 769.4733 | NA | ||
| 15 | G | Ginsenoside Rb1 | 40.5 | C54H92O23 | 1107.5946 | 1107.5927 | 2 | 1107.5927, 945.5389, 783.4901, 765.4580, 621.4343, 553.2887, 472.2575, 459.3803, 323.0972, 263.0742, 221.0678, 179.0538, 179.0538, 161.0395, 143.0272, 131.0323, 125.0221, 119.0351, 113.0260, 101.0208 |
| 16 | V | Bufotalin | 41.1 | C26H36O6 | 443.2428 | 443.2452 | 5 | 443.2452, 407.2732, 380.9754, 375.2916, 256.8133, 203.8251, 167.9242, 138.0325 |
| 17 a | G | Ginsenoside Rh1 | 41.8 | C37H64O11 | 683.4403 | 683.4384 | 3 | 683.4384, 637.4330, 475.3704, 179.0470, 161.0398 |
| 18 | C & B | GCA | 42.6 | C26H43NO6 | 464.3007 | 464.3015 | 2 | |
| 19 a | C & B | TDCA | 42.8 | C26H45NO6S | 498.2884 | 498.2907 | 5 | 498.2907, 464.2945, 451.3111, 391.1261, 321.1686, 201.2573 |
| 20 | V | Resibufagin | NA | C24H30O5 | 397.2010 | NA | ||
| 21 | G | Ginsenoside Rb2 | 43.7 | C53H90O22 | 1077.5840 | 1077.5795 | 4 | 1077.5795, 945.5318, 915.1144, 783.0026, 765.1212, 621.3652, 311.9821, 293.6514, 191.8123, 149.1853 |
| 22 | G | Ginsenoside Re | 47.2 | C48H82O18 | 945.5417 | 945.5433 | 2 | 945.5433, 880.9436, 799.2672, 765.1661, 637.2542, 475.2767, 218.9817 |
| 23 | G | Ginsenoside Rk1 | NA | C42H70O12 | 765.4784 | NA | ||
| 24 a | V | Bufalin | NA | C24H34O4 | 385.2373 | NA | ||
| 25 a | C & B | CA | 52.1 | C24H40O5 | 407.2792 | 407.2811 | 5 | 407.2811, 389.2677, 363.2526, 325.6244, 289.2744, 233.8977, 215.3690, 205.9169 |
| 26 | V | Argentinogenin-3-lutarate-arginine | 53.6 | C38H58N408 | 697.4171 | 697.4121 | 7 | 697.4121, 651.4153, 535.5406, 489.3649, 179.0546 |
| 27 | C & B | TLCA | 55.0 | C22H44NO10 | 482.2960 | 482.2918 | 9 | |
| 28 | G | Ginsenoside Rg1 | 55.3 | C43H72O14 | 811.4838 | 811.4813 | 3 | 811.4813, 775.8988, 765.4577, 619.3911, 421.2024, 391.2774 |
| 29 | C & B | DCA | 55.8 | C24H40O4 | 391.2843 | 391.2854 | 3 | |
| 30 | C & B | GCDGA | 56.2 | C26H43NO5 | 448.3058 | 448.3065 | 2 | 448.3065, 409.2741, 391.2853, 389.2658, 365.3004 |
| 31 a | C & B | UDCA | 56.8 | C24H40O4 | 391.2843 | 391.2848 | 1 | 409.2741, 391.2739, 373.8139, 354.4757, 152.9965 |
| 32 a | C & B | HDCA | 57.4 | C24H40O4 | 391.2843 | 391.2851 | 2 | 409.2741, 391.2853, 389.2658, 118.1248 |
| 33 a | V | Resibufogenin | NA | C24H32O4 | 383.2217 | NA | ||
| 34 | G | Ginsenoside Rs3 | NA | C44H74O14 | 825.4995 | NA | ||
| 35 a | V | Cinobufagin | NA | C26H34O6 | 441.2272 | NA | ||
| 36 | G | Chikusetsusaponin Iva | 61.6 | C42H66O14 | 793.4374 | 793.4330 | 6 | 793.4330, 598.6542, 481.7612, 524.4589 |
| 37 | G | Ginsenoside 20S-Rg3 | NA | C42H72O13 | 783.4889 | NA | ||
| 38 a | G | ginsenoside Rg2 | 68.9 | C42H72O13 | 783.4889 | 783.4873 | 2 | 783.4873, 765.1686, 617.0004, 409.2952, 391.2852, 313.1097 |
| 39 a | C & B | CDCA | 68.9 | C24H40O4 | 391.2843 | 391.2853 | 3 | 391.2739, 345.4757, 329.1213, 97.0589 |
| 40 | C & B | LCA | 89.4 | C24H40O3 | 375.2894 | 375.2888 | 2 | |
| 41 a | R | Tanshinone IIA | NA | C19H18O3 | 293.1172 | NA | ||
| No. | Source | Identification | Rt (min) | Formula | Positive Ion (m/z) | |||
| [M + H]+ | Quasi-Molecular Ion | Error (ppm) | MSMS (m/z) | |||||
| 1 | C & B | Taurine | 3.7 | C2H7NO3S | 126.0219 | 126.0222 | 2 | 126.0222, 115.3256, 108.8434, 97.2221, 91.7216 |
| 2 | R | Salvianolic acid A | NA | C26H22O10 | 495.1286 | NA | ||
| 3 | C & B | Bilirubin | NA | C33H35N4O6 | 584.2629 | NA | ||
| 4 | G | Ginsenoside Rk3 | 24.5 | C36H60O8 | 621.4361 | 621.4362 | 0 | |
| 5 | G | Ginsenoside Rd | 24.6 | C48H82O18 | 947.5574 | 947.5501 | 8 | |
| 6 | R | Tanshinaldehyde | 24.6 | C19H16O4 | 309.1121 | 309.1147 | 8 | |
| 7 | G | Ginsenoside Rg6 | 24.6 | C42H70O12 | 767.4940 | 767.4931 | 1 | |
| 8 a | R | Salvianolic acid B | 25.8 | C36H30O16 | 719.1607 | 719.1613 | 1 | 719.1613, 323.0496, 295.0572, 181.0460 |
| 9 a | V | Arenobufagin | 28.4 | C24H32O6 | 417.2272 | 417.2273 | 0 | 417.2273, 399.2188, 362.7495, 223.1056 |
| 10 a | C & B | TDCANa | 33.2 | C26H44NNaO6S | 500.4245 | NA | ||
| 11 a | C & B | TCA | 33.5 | C26H44NO7S | 516.2990 | 516.2984 | 1 | |
| 12 | G | Ginsenoside Rf | 34.0 | C35H76O19 | 801.5054 | 801.5075 | 3 | |
| 13 | V | Gamabufotalin | 38.9 | C24H34O5 | 403.2251 | 403.2267 | 4 | 403.2267, 385.9531, 367.1296, 349.4632, 331.8123 |
| 14 | G | Notoginsenoside R2 | 39.0 | C41H70O13 | 771.4889 | 771.4861 | 4 | |
| 15 | G | Ginsenoside Rb1 | 39.9 | C54H92O23 | 1109.6102 | 1109.6030 | 6 | 1109.6030, 935.5613, 878.7854, 646.6751, 443.3798, 407.3652, 325.1114, 217.1888, 163.0566, 145.0507, 127.0384, 85.0294 |
| 16 | V | Bufotalin | 41.1 | C26H36O6 | 445.2585 | 445.2585 | 0 | |
| 17 a | G | Ginsenoside Rh1 | NA | C37H64O11 | 685.4521 | NA | ||
| 18 | C & B | GCA | 42.3 | C26H43NO6 | 466.3163 | 466.3132 | 7 | 466.3132, 337.2523, 319.2353, 295.2026, 288.1602, 213.1621, 209.1339, 201.1658 |
| 19 a | C & B | TDCA | 42.8 | C26H45NO6S | 500.3040 | 500.3042 | 0 | |
| 20 | V | Resibufagin | 42.8 | C24H30O5 | 399.2166 | 399.2158 | 2 | 399.2158, 387.2519, 297.7655, 223.1439, 211.1011, 145.0999, 131.0982, 179.0841, 105.0709, 91.0525 |
| 21 | G | Ginsenoside Rb2 | 43.1 | C53H90O22 | 1079.5997 | 1079.5942 | 5 | |
| 22 | G | Ginsenoside Re | 46.5 | C48H82O18 | 947.5574 | 947.5510 | 7 | |
| 23 | G | Ginsenoside Rk1 | 46.6 | C42H70O12 | 767.4940 | 767.4931 | 1 | |
| 24 a | V | Bufalin | 49.1 | C24H34O4 | 387.253 | 387.2527 | 1 | 387.2527, 370.9842, 352.9666, 340.2608, 255.2028 |
| 25 a | C & B | CA | NA | C24H40O5 | 409.2949 | NA | ||
| 26 | V | Argentinogenin-3-lutarate-arginine | 53.2 | C38H58N408 | 699.4327 | 699.4299 | 4 | 699.4299, 681.4053, 598.7017, 582.3791, 331.2027, 278.1446, 250.1590, 175.1200, 157.1072 |
| 27 | C & B | TLCA | NA | C22H44NO10 | 483.3038 | NA | ||
| 28 | G | Ginsenoside Rg1 | NA | C43H72O14 | 813.4995 | NA | ||
| 29 | C & B | DCA | NA | C24H40O4 | 393.3000 | NA | ||
| 30 | C & B | GCDGA | 56.1 | C26H43NO5 | 450.3214 | 450.3204 | 2 | 450.3204, 415.3174, 321.2607, 278.7283, 215.1679, 175.1452, 161.1349, 147.1140, 107.0885 |
| 31 a | C & B | UDCA | NA | C24H40O4 | 393.3000 | NA | ||
| 32 a | C & B | HDCA | NA | C24H40O4 | 393.3000 | NA | ||
| 33 a | V | Resibufogenin | 57.7 | C24H32O4 | 385.2373 | 385.2369 | 1 | 385.2369, 367.2214, 350.2243, 341.2244, 332.2025 |
| 34 | G | Ginsenoside Rs3 | 57.8 | C44H74O14 | 827.5151 | 827.5165 | 2 | |
| 35 a | V | Cinobufagin | 57.9 | C26H34O6 | 443.2428 | 443.2425 | 1 | 443.2425, 401.2288, 385.2322, 367.2210, 349.2129, 187.1473, 151.0382 |
| 36 | G | Chikusetsusaponin Iva | NA | C42H66O14 | 795.4525 | NA | ||
| 37 | G | Ginsenoside 20S-Rg3 | 68.6 | C42H72O13 | 785.5046 | 785.5063 | 2 | 785.5063, 621.6871, 357.2785, 339.2647, 321.2458, 275.2027, 221.1526, 161.1345 |
| 38 a | G | ginsenoside Rg2 | NA | C42H72O13 | 785.5046 | NA | ||
| 39 a | C & B | CDCA | NA | C24H40O4 | 393.3000 | NA | ||
| 40 | C & B | LCA | NA | C24H40O3 | 377.3050 | NA | ||
| 41 a | R | Tanshinone IIA | 92.3 | C19H18O3 | 295.1269 | 295.1266 | 0 | 295.1266, 280.4501, 277.1173, 266.0878, 262.0933, 249.1212, 235.0725, 225.1178, 221.1251, 207.0771 |


2.2.1. Compounds from Ginseng
2.2.2. Compounds from Salvia miltiorrhiza


2.2.3. Compounds from Toad Skin Secretion (Venenum bufonis)
2.2.4. Compounds from Calculus bovis and Bear Gall
2.3. UPLC-QqQ-MS/MS Quantitative Analysis of Chemical Constituents from STP

2.4. Method Validation
2.4.1. Linearity and Detection Limit
| Compound | Linear | Linear Range (μg/mL) | r | LOQ (μg/mL) | LOD (μg/mL) |
|---|---|---|---|---|---|
| Taurine | y = 0.0707x − 0.0005 | 10.03–0.40 | 0.9999 | 0.1300 | 0.0390 |
| Ginsenoside Rg1 | y = 0.0574x − 0.0102 | 7.51–0.75 | 0.9998 | 0.6000 | 0.1800 |
| Arenobufagin | y = 0.3438x − 0.0003 | 5.02–0.40 | 0.9996 | 0.0300 | 0.0090 |
| TDCA | y = 0.0125x − 0.0061 | 25.28–3.75. | 0.9992 | 1.7000 | 0.5100 |
| TCA | y = 0.0525x − 0.0094 | 10.53–0.75 | 0.9996 | 0.6000 | 0.1800 |
| Bufalin | y = 1.1663x + 0.0624 | 4.01–0.40 | 0.9999 | 0.0032 | 0.0010 |
| CA | y = 0.0909x − 0.0211 | 10.07–1.01 | 0.9998 | 0.7800 | 0.2340 |
| Cinobufagin | y = 0.1767x + 0.0523 | 5.02–0.75 | 0.9998 | 0.0003 | 0.0010 |
| Resibufogenin | y = 0.9504x − 0.0596 | 4.01–0.50 | 0.9993 | 0.2100 | 0.0630 |
| Ginsenoside Rg3 | y = 0.048x + 0.0256 | 2.01–0.01 | 0.9994 | 0.0041 | 0.0012 |
| CDCA | y = 0.2824x − 0.0241 | 5.01–0.75 | 0.9993 | 0.2900 | 0.0870 |
| DCA | y = 0.2049x + 0.0145 | 4.01–0.40 | 0.9990 | 0.0050 | 0.0015 |
| Tanshinone IIA | y = 34.5600x − 0.0030 | 0.05–0.01 | 0.9995 | 0.0042 | 0.0013 |
2.4.2. Precision, Repeatability, Stability and Recovery
| Analyte | Repeatability | Precision RSD% | Stability | ||
|---|---|---|---|---|---|
| Content (mg/g) ± SD | RSD% n = 6 | Intra-Day n = 6 | Inter-Day n = 9 | RSD% n = 6 | |
| Taurine | 35.2978 ± 0.7821 | 2.22 | 2.35 | 2.42 | 2.71 |
| Ginsenoside RG1 | 8.7050 ± 0.2457 | 2.82 | 4.69 | 4.30 | 3.24 |
| Arenobufagin | 10.9163 ± 0.2826 | 2.59 | 3.13 | 3.95 | 4.33 |
| TDCA | 43.8546 ± 1.8145 | 4.14 | 3.96 | 3.08 | 2.47 |
| TCA | 29.7562 ± 1.3109 | 4.41 | 4.17 | 3.34 | 3.55 |
| Bufalin | 6.9432 ± 0.2124 | 3.06 | 3.88 | 4.20 | 3.40 |
| CA | 33.6313 ± 0.8419 | 2.50 | 3.52 | 3.58 | 2.58 |
| Cinobufagin | 19.1693 ± 0.4315 | 2.25 | 2.71 | 2.63 | 3.91 |
| Resibufogenin | 8.1053 ± 0.1211 | 1.49 | 2.88 | 3.00 | 3.00 |
| Ginsenoside RG3 | 8.5907 ± 0.2642 | 3.08 | 2.63 | 2.60 | 2.25 |
| CDCA | 14.7924 ± 0.5840 | 3.95 | 4.79 | 3.46 | 2.12 |
| DCA | 5.7912 ± 0.1679 | 2.90 | 2.01 | 2.37 | 2.24 |
| Tanshinone IIA | 0.0208 ± 0.0007 | 3.54 | 4.00 | 4.55 | 4.88 |
| Analyte | Original (μg) | Added (μg) | Detected (μg) (±SD n = 3) | Recovery (%) (±SD n = 9) | RSD (%) |
|---|---|---|---|---|---|
| Taurine | 1764.89 | 2000.00 | 3734.82 ± 73.55 | 99.20 ± 3.00 | 3.02 |
| 1500.00 | 3263.21 ± 55.01 | ||||
| 1000.00 | 2756.97 ± 27.37 | ||||
| Ginsenoside RG1 | 435.25 | 500.00 | 934.19 ± 22.09 | 98.86 ± 3.77 | 3.82 |
| 400.00 | 826.68 ± 12.69 | ||||
| 300.00 | 732.04 ± 14.85 | ||||
| Arenobufagin | 545.82 | 900.00 | 1422.16 ± 4.83 | 99.28 ± 3.49 | 3.52 |
| 600.00 | 1156.98 ± 26.84 | ||||
| 300.00 | 841.64 ± 10.52 | ||||
| TDCA | 2192.73 | 3000.00 | 5115.89 ± 43.01 | 98.64 ± 2.96 | 3.00 |
| 2000.00 | 4195.34 ± 57.22 | ||||
| 1000.00 | 3176.37 ± 43.66 | ||||
| TCA | 1487.81 | 2000.00 | 3435.51 ± 54.39 | 99.26 ± 3.31 | 3.34 |
| 1500.00 | 2994.86 ± 70.89 | ||||
| 1000.00 | 2487.12 ± 24.57 | ||||
| Bufalin | 347.16 | 500.00 | 843.70 ± 24.18 | 99.00 ± 4.18 | 4.23 |
| 400.00 | 744.40 ± 18.15 | ||||
| 300.00 | 642.24 ± 15.03 | ||||
| CA | 1681.57 | 2000.00 | 3682.31 ± 57.38 | 99.20 ± 3.09 | 3.11 |
| 1500.00 | 3149.48 ± 52.01 | ||||
| 1000.00 | 2678.33 ± 37.17 | ||||
| Cinobufagin | 958.47 | 1500.00 | 2428.88 ± 47.17 | 98.64 ± 3.38 | 3.00 |
| 1000.00 | 1963.89 ± 36.52 | ||||
| 500.00 | 1434.10 ± 3.47 | ||||
| Resibufogenin | 405.27 | 500.00 | 896.21 ± 13.03 | 98.24 ± 3.20 | 3.25 |
| 400.00 | 795.04 ± 12.45 | ||||
| 300.00 | 702.54 ± 14.18 | ||||
| Ginsenoside RG3 | 429.54 | 500.00 | 928.54 ± 19.34 | 99.63 ± 3.55 | 3.56 |
| 400.00 | 825.86 ± 17.65 | ||||
| 300.00 | 729.51 ± 11.68 | ||||
| CDCA | 739.62 | 1500.00 | 2222.5 ± 54.47 | 98.67 ± 2.97 | 3.01 |
| 750.00 | 1475.11 ± 17.65 | ||||
| 500.00 | 1234.91 ± 19.78 | ||||
| DCA | 289.56 | 600.00 | 888.35 ± 23.94 | 99.38 ± 3.23 | 3.25 |
| 300.00 | 584.70 ± 11.05 | ||||
| 150.00 | 439.51 ± 4.75 | ||||
| Tanshinone IIA | 1.04 | 2.00 | 3.01 ± 0.09 | 101.02 ± 4.53 | 4.48 |
| 1.00 | 2.05 ± 0.05 | ||||
| 0.50 | 1.56 ± 0.03 |
2.5. Sample Analysis
| Lot No. Compounds (mg/g) | Sample 1 | Sample 2 | Sample 3 | Sample 4 | Sample 5 | Sample 6 | Sample 7 | Sample 8 |
|---|---|---|---|---|---|---|---|---|
| Taurine | 13.8735 | 10.0161 | 15.1052 | 14.4826 | 13.6382 | 35.2978 | 24.4059 | 17.9399 |
| Ginsenoside RG1 | 10.4003 | 4.7917 | 6.0041 | 5.4945 | 8.1709 | 8.7050 | 10.5062 | 9.8985 |
| Arenobufagin | 6.5724 | 3.2283 | 3.9044 | 6.4789 | 4.8138 | 10.9163 | 7.2296 | 14.0551 |
| TDCA | 43.2012 | 73.8723 | 52.7846 | 76.3674 | 96.1933 | 43.8546 | 78.2465 | 32.8261 |
| TCA | 21.2145 | 21.3171 | 33.0645 | 44.2204 | 52.5620 | 29.7562 | 47.4044 | 21.5164 |
| Bufalin | 4.3781 | 5.2646 | 2.7532 | 4.9919 | 3.4709 | 6.9432 | 5.4234 | 7.1698 |
| CA | 13.2086 | 25.3780 | 15.5592 | 15.1331 | 16.1522 | 33.6313 | 23.6953 | 23.8216 |
| Cinobufagin | 10.3166 | 6.1709 | 6.9125 | 11.3476 | 9.3716 | 19.1693 | 13.6489 | 15.7044 |
| Resibufogenin | 5.0181 | 3.0739 | 3.1118 | 5.4689 | 4.1013 | 8.1053 | 6.3188 | 7.4538 |
| Ginsenoside RG3 | 17.1353 | 3.2188 | 8.0643 | 8.0672 | 13.4715 | 8.5907 | 13.3079 | 6.4563 |
| CDCA | 3.7939 | 4.6744 | 10.4556 | 6.6600 | 8.0945 | 14.7924 | 11.2672 | 5.8183 |
| DCA | 5.5619 | 3.6310 | 2.2421 | 5.1843 | 6.1205 | 5.7912 | 10.0939 | 9.4447 |
| Tanshinone IIA | 0.0026 | 0.0028 | 0.0207 | 0.0031 | 0.0134 | 0.0208 | 0.0239 | 0.0154 |
3. Experimental Section
3.1. Materials and Reagents
3.2. Preparation of Standard and Sample Solutions
3.3. Qualitative and Quantitative Analysis Conditions
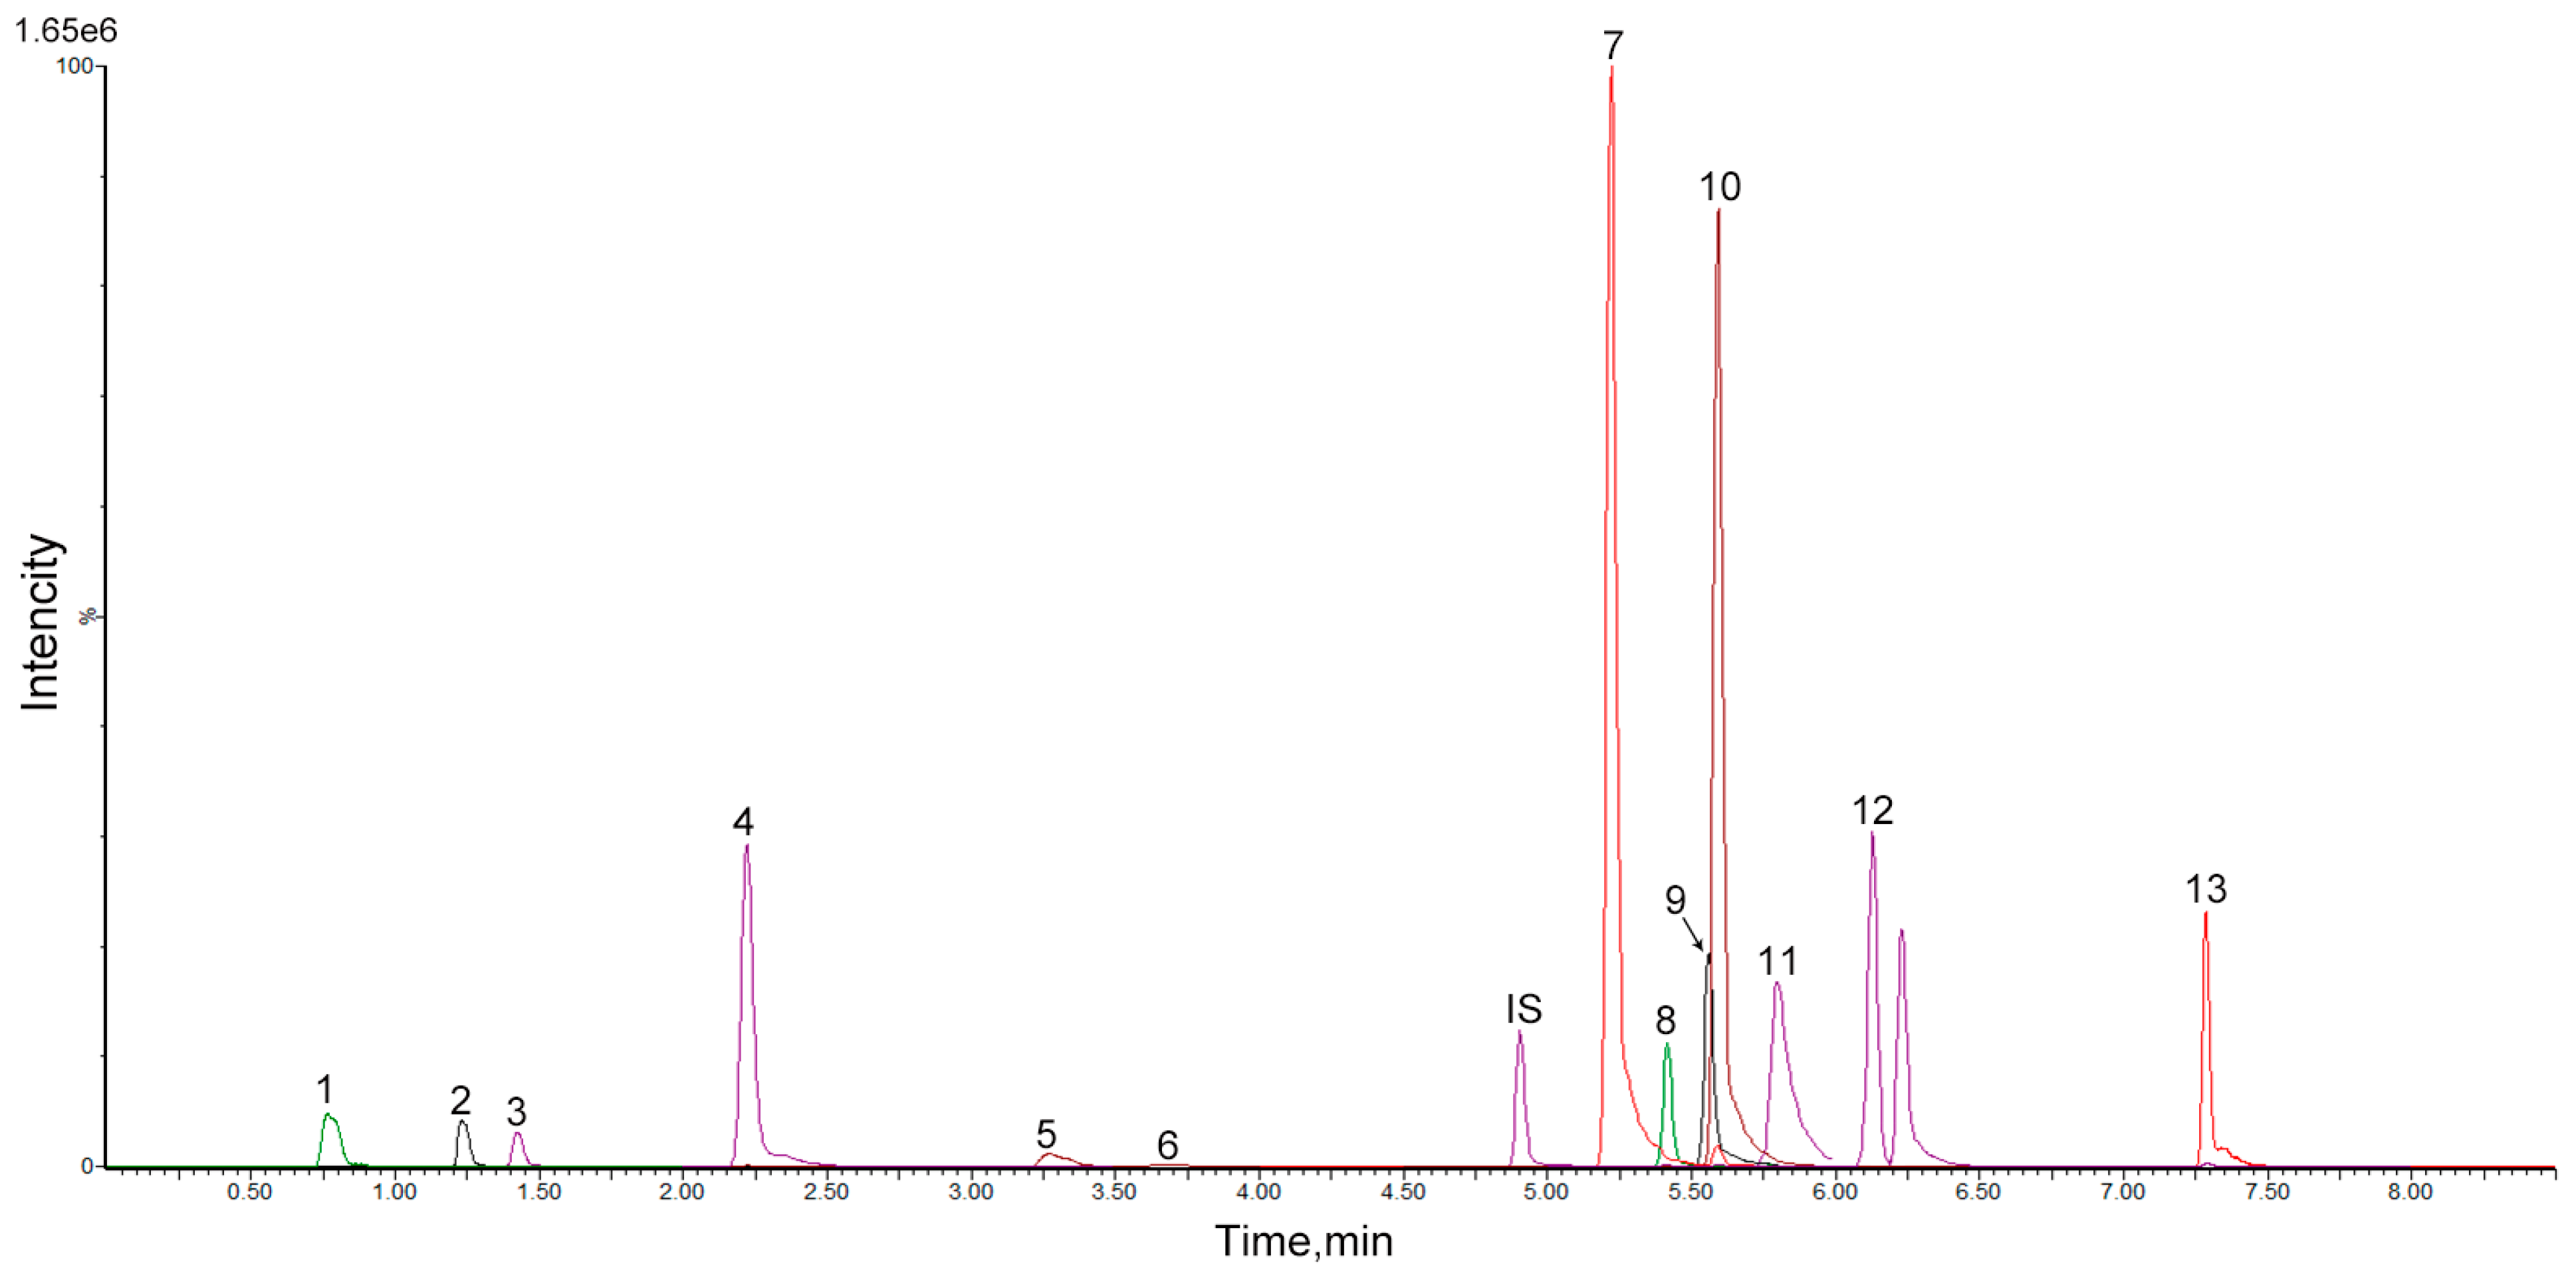
3.3.1. HPLC Method for Qualitative Analysis
3.3.2. Q-TOF Method for Qualitative Analysis
3.3.3. UPLC-MS Method for Quantitative Analysis
| Compounds | Rt (min) | Precursor Ion (m/z) | Daughter Ion (m/z) | Con Voltage (V) | Collision Energy (eV) |
|---|---|---|---|---|---|
| Taurine | 0.82 | 126.00 | 108.20 | 22 | 14 |
| Ginsenoside Rg1 | 1.25 | 823.30 | 643.50 | 80 | 40 |
| Arenobufagin | 2.23 | 417.20 | 399.10 | 45 | 30 |
| TDCA | 3.39 | 522.28 | 486.61 | 50 | 25 |
| TCA | 3.41 | 538.00 | 538.00 | 60 | 2 |
| Astragaloside | 4.91 | 807.00 | 807.00 | 80 | 30 |
| Bufalin | 5.22 | 387.30 | 351.20 | 35 | 22 |
| CA | 5.41 | 391.30 | 355.30 | 0 | 20 |
| Cinobufagin | 5.56 | 443.50 | 365.20 | 60 | 20 |
| Resibufogenin | 5.59 | 385.30 | 367.20 | 35 | 18 |
| Ginsenoside Rg3 | 5.75 | 807.00 | 365.00 | 90 | 5 |
| CDCA | 6.13 | 357.60 | 161.20 | 40 | 20 |
| DCA | 6.23 | 357.60 | 161.20 | 40 | 20 |
| Tanshinone IIA | 7.28 | 295.10 | 277.00 | 40 | 20 |
3.4. Validation of Quantitative Method
3.4.1. Calibration Curve, LOD, and LOQ
3.4.2. Precision, Stability, Repeatability, and Recovery
4. Conclusions
Supplementary Materials
Acknowledgments
Author Contributions
Conflicts of Interest
References
- Chernetsova, E.S.; Crawford, E.A.; Shikov, A.N.; Pozharitskaya, O.N.; Makarov, V.G.; Morlock, G.E. ID-CUBE direct analysis in real time high-resolution mass spectrometry and its capabilities in the identification of phenolic components from the green leaves of Bergenia crassifolia L. Rapid Commun. Mass Spectrom. 2012, 26, 1329–1337. [Google Scholar] [CrossRef] [PubMed]
- Wang, B.; Zhang, Y.-B.; Li, G.-Q.; Guan, H.-S.; Tong, G.-Z. Fingerprint chromatogram analysis of Radix Glehniae by LC coupled with hierarchical clustering analysis. Chromatographia 2009, 70, 811–816. [Google Scholar] [CrossRef]
- Wang, R.; Luo, J.; Kong, L. Screening of radical scavengers in Scutellaria baicalensis using HPLC with diode array and chemiluminescence detection. J. Sep. Sci. 2012, 35, 2223–2227. [Google Scholar] [CrossRef] [PubMed]
- Zhang, Q.; Hong, B.; Zheng, L.; Wang, X.; Cai, D. Matrix solid-phase dispersion extraction followed by HPLC-diode array detection method for the determination of major constituents in a traditional Chinese medicine Folium isatidis (Da-qing-ye). J. Sep. Sci. 2012, 35, 2453–2459. [Google Scholar] [CrossRef] [PubMed]
- Gautam, K.; Kumar, P.; Poonia, S. Larvicidal activity and GC-MS analysis of flavonoids of Vitex negundo and Andrographis paniculata against two vector mosquitoes Anopheles stephensi and Aedes aegypti. J. Vector Borne Dis. 2013, 50, 171–178. [Google Scholar] [PubMed]
- Liakopoulou-Kyriakides, M.; Kyriakidis, D. Croscus sativus-biological active constitutents. Stud. Nat. Prod. Chem. 2002, 26, 293–312. [Google Scholar]
- Shen, L.; Cong, W.-J.; Lin, X.; Hong, Y.-L.; Hu, R.-W.; Feng, Y.; Xu, D.-S.; Ruan, K.-F. Characterization using LC/MS of the absorption compounds and metabolites in rat plasma after oral administration of a single or mixed decoction of Shaoyao and Gancao. Chem. Pharm. Bull. 2012, 60, 712–721. [Google Scholar] [CrossRef] [PubMed]
- Wang, D.; Liang, J.; Yang, W.; Hou, J.; Yang, M.; Da, J.; Wang, Y.; Jiang, B.; Liu, X.; Wu, W. HPLC/qTOF-MS-oriented characteristic components data set and chemometric analysis for the holistic quality control of complex TCM preparations: Niuhuang Shangqing pill as an example. J. Pharm. Biomed. Anal. 2014, 89, 130–141. [Google Scholar] [CrossRef] [PubMed]
- Pfister, S.; Meyer, P.; Steck, A.; Pfander, H. Isolation and structure elucidation of carotenoid-glycosyl esters in gardenia fruits (Gardenia jasminoides Ellis) and saffron (Crocus sativus Linne). J. Agric. Food Chem. 1996, 44, 2612–2615. [Google Scholar] [CrossRef]
- Wang, Y.; He, S.; Cheng, X.; Lu, Y.; Zou, Y.; Zhang, Q. UPLC-Q-TOF-MS/MS fingerprinting of Traditional Chinese Formula SiJunZiTang. J. Pharm. Biomed. Anal. 2013, 80, 24–33. [Google Scholar] [CrossRef] [PubMed]
- Yin, Q.; Wang, P.; Zhang, A.; Sun, H.; Wu, X.; Wang, X. Ultra-performance LC-ESI/quadrupole-TOF MS for rapid analysis of chemical constituents of Shaoyao-Gancao decoction. J. Sep. Sci. 2013, 36, 1238–1246. [Google Scholar] [CrossRef] [PubMed]
- Zhong, X.; Guo, J.; Wang, L.; Luo, D.; Bei, W.; Chen, Y.; Yan, K.; Peng, J. Analysis of the constituents in rat serum after oral administration of Fufang Zhenzhu Tiaozhi capsule by UPLC-Q-TOF-MS/MS. Chromatographia 2012, 75, 111–129. [Google Scholar] [CrossRef] [PubMed]
- Zhang, H.; Xu, D.; Yang, L. The Protective Function of Shexiang on Endothelial Injury Induced by Angiotensin II Osmotic Pump in the Rat. Chin. J. Clin. Med. 2009, 16, 669–672. [Google Scholar]
- Ning, H. The analysis of Shexiang Tongxin dropping pill on treating coronary heart disease angina pectoris curative effect. Chin. J. Geriatr. Care 2012, 10, 46. [Google Scholar]
- Wu, H.; Høiby, N.; Yang, L.; Givskov, M.; Song, Z. Effects of Radix Ginseng on microbial infections: A narrative review. J. Tradit. Chin. Med. 2014, 34, 227–233. [Google Scholar] [CrossRef]
- Lai, C.; Li, S.; Yu, H.; Wan, J.; Kan, K.; Wang, Y. A rapid HPLC–ESI-MS/MS for qualitative and quantitative analysis of saponins in “XUESETONG” injection. J. Pharm. Biomed. Anal. 2006, 40, 669–678. [Google Scholar] [CrossRef] [PubMed]
- Sui, W. Clinical observation of Shexiang Tongxin dropping pill in treating senile unstable agina pectoris. Chin. Community Dr. 2011, 9, 177–178. [Google Scholar]
- Wang, X.; Sun, W.; Sun, H.; Lv, H.; Wu, Z.; Wang, P.; Liu, L.; Cao, H. Analysis of the constituents in the rat plasma after oral administration of Yin Chen Hao Tang by UPLC/Q-TOF-MS/MS. J. Pharm. Biomed. Anal. 2008, 46, 477–490. [Google Scholar] [CrossRef] [PubMed]
- Zhang, J.; Xu, X.; Wang, W. Shexiang Tongxin dropping pill Evaluate the Efficacy of the Treatment of Unstable Angina. Chin. J. Integr. Med. Cardio-/Cerebrovasc. Dis. 2011, 9, 917–918. [Google Scholar]
- Xu, S.; Yang, L.; Zeng, X.; Zhang, M.; Wang, Z. Characterization of compounds in the Chinese herbal drug Mu-Dan-Pi by liquid chromatography coupled to electrospray ionization mass spectrometry. Rapid Commun. Mass Spectrom. 2006, 20, 3275–3288. [Google Scholar] [CrossRef] [PubMed]
- Zhang, H.-Y.; Hu, P.; Luo, G.-A.; Liang, Q.-L.; Wang, Y.-L.; Yan, S.-K.; Wang, Y.-M. Screening and identification of multi-component in Qingkailing injection using combination of liquid chromatography/time-of-flight mass spectrometry and liquid chromatography/ion trap mass spectrometry. Anal. Chim. Acta 2006, 577, 190–200. [Google Scholar] [CrossRef] [PubMed]
- Lee, H.-J.; Koung, F.-P.; Kwon, K.-R.; Kang, D.-I.; Cohen, L.; Yang, P.-Y.; Yoo, H.-S. Comparative analysis of the bufonis venenum by using TLC, HPLC, and LC-MS for different extraction methods. J. Pharmacopunct. 2012, 15, 52–65. [Google Scholar] [CrossRef] [PubMed]
- Hu, Y.; Yu, Z.; Yang, Z.J.; Zhu, G.; Fong, W. Comprehensive chemical analysis of Venenum bufonis by using liquid chromatography/electrospray ionization tandem mass spectrometry. J. Pharm. Biomed. Anal. 2011, 56, 210–220. [Google Scholar] [PubMed]
- Shellie, R.A.; Marriott, P.J.; Huie, C.W. Comprehensive two-dimensional gas chromatography (GC× GC) and GC× GC-quadrupole MS analysis of Asian and American ginseng. J. Sep. Sci. 2003, 26, 1185–1192. [Google Scholar] [CrossRef]
- Wan, J.-Y.; Liu, P.; Wang, H.-Y.; Qi, L.-W.; Wang, C.-Z.; Li, P.; Yuan, C.-S. Biotransformation and metabolic profile of American ginseng saponins with human intestinal microflora by liquid chromatography quadrupole time-of-flight mass spectrometry. J. Chromatogr. A 2013, 1286, 83–92. [Google Scholar] [CrossRef] [PubMed]
- Wang, C.-Z.; Kim, K.E.; Du, G.-J.; Qi, L.-W.; Wen, X.-D.; Li, P.; Bauer, B.A.; Bissonnette, M.B.; Musch, M.W.; Chang, E.B. Ultra-performance liquid chromatography and time-of-flight mass spectrometry analysis of ginsenoside metabolites in human plasma. Am. J. Chin. Med. 2011, 39, 1161–1171. [Google Scholar] [PubMed]
- Wen, X.-D.; Yang, J.; Ma, R.-H.; Gao, W.; Qi, L.-W.; Li, P.; Bauer, B.A.; Du, G.-J.; Zhang, Z.; Somogyi, J. Analysis of Panax notoginseng metabolites in rat bile by liquid chromatography–quadrupole time-of-flight mass spectrometry with microdialysis sampling. J. Chromatogr. B 2012, 895, 162–168. [Google Scholar] [CrossRef] [PubMed]
- Peng, C.; Tian, J.; Lv, M.; Huang, Y.; Tian, Y.; Zhang, Z. Development and Validation of a Sensitive LC-MS-MS Method for the Simultaneous Determination of Multicomponent Contents in Artificial Calculus bovis. J. Chromatogr. Sci. 2014, 52, 128–136. [Google Scholar] [CrossRef] [PubMed]
- García-Reyes, J.F.; Hernando, M.D.; Molina-Díaz, A.; Fernández-Alba, A.R. Comprehensive screening of target, non-target and unknown pesticides in food by LC-TOF-MS. TrAC Trends Anal. Chem. 2007, 26, 828–841. [Google Scholar] [CrossRef]
- Jiang, P.; Dou, S.; Liu, L.; Zhang, W.; Chen, Z.; Xu, R.; Ding, J.; Liu, R. Identification of multiple constituents in the TCM-formula Shexiang Baoxin pill by LC coupled with DAD-ESI-MS-MS. Chromatographia 2009, 70, 133–142. [Google Scholar] [CrossRef]
- Díaz, R.; Ibáñez, M.; Sancho, J.V.; Hernández, F. Target and non-target screening strategies for organic contaminants, residues and illicit substances in food, environmental and human biological samples by UHPLC-QTOF-MS. Anal. Methods 2012, 4, 196–209. [Google Scholar] [CrossRef]
- Hernández, F.; Sancho, J.; Ibáñez, M.; Grimalt, S. Investigation of pesticide metabolites in food and water by LC-TOF-MS. TrAC Trends Anal. Chem. 2008, 27, 862–872. [Google Scholar] [CrossRef]
- Yan, Y.; Chai, C.-Z.; Wang, D.-W.; Yue, X.-Y.; Zhu, D.-N.; Yu, B.-Y. HPLC-DAD-Q-TOF-MS/MS analysis and HPLC quantitation of chemical constituents in traditional Chinese medicinal formula Ge-Gen Decoction. J. Pharm. Biomed. Anal. 2013, 80, 192–202. [Google Scholar] [CrossRef] [PubMed]
- Rodriguez-Aller, M.; Gurny, R.; Veuthey, J.-L.; Guillarme, D. Coupling ultra high-pressure liquid chromatography with mass spectrometry: Constraints and possible applications. J. Chromatogr. A 2013, 1292, 2–18. [Google Scholar] [CrossRef] [PubMed]
- Huang, M.; Zhang, Y.; Xu, S.; Xu, W.; Chu, K.; Xu, W.; Zhao, H.; Lu, J. Identification and quantification of phenolic compounds in Vitex negundo L. var. cannabifolia (Siebold et Zucc.) Hand.-Mazz. using liquid chromatography combined with quadrupole time-of-flight and triple quadrupole mass spectrometers. J. Pharm. Biomed. Anal. 2015, 108, 11–20. [Google Scholar] [CrossRef] [PubMed]
- Schymanski, E.L.; Singer, H.P.; Slobodnik, J.; Ipolyi, I.M.; Oswald, P.; Krauss, M.; Schulze, T.; Haglund, P.; Letzel, T.; Grosse, S.; et al. Non-target screening with high-resolution mass spectrometry: Critical review using a collaborative trial on water analysis. Anal. Bioanal. Chem. 2015, 407, 6237–6255. [Google Scholar] [CrossRef] [PubMed]
- Wu, Z.-F.; Wang, Y.-Q.; Wan, N.; Ke, G.; Yue, P.-F.; Chen, H.; Zhan, J.-J.; Yang, M. Structural Stabilities and Transformation Mechanism of Rhynchophylline and Isorhynchophylline by Ultra Performance Liquid Chromatography/Time-of-Flight Mass Spectrometry (UPLC/Q-TOF-MS). Molecules 2015, 20, 14849–14859. [Google Scholar] [CrossRef] [PubMed]
- Fraser, K.; Harrison, S.J.; Lane, G.A.; Otter, D.E.; Hemar, Y.; Quek, S.-Y.; Rasmussen, S. Non-targeted analysis of tea by hydrophilic interaction liquid chromatography and high resolution mass spectrometry. Food Chem. 2012, 134, 1616–1623. [Google Scholar] [CrossRef] [PubMed]
- Guibal, R.; Lissalde, S.; Charriau, A.; Poulier, G.; Mazzella, N.; Guibaud, G. Coupling passive sampling and time of flight mass spectrometry for a better estimation of polar pesticide freshwater contamination: Simultaneous target quantification and screening analysis. J. Chromatogr. A 2015, 1387, 75–85. [Google Scholar] [CrossRef] [PubMed]
- Yang, Y.; Wang, H.-J.; Yang, J.; Brantner, A.H.; Lower-Nedza, A.D.; Si, N.; Song, J.-F.; Bai, B.; Zhao, H.-Y.; Bian, B.-L. Chemical profiling and quantification of Chinese medicinal formula Huang-Lian-Jie-Du decoction, a systematic quality control strategy using ultra high performance liquid chromatography combined with hybrid quadrupole-orbitrap and triple quadrupole mass spectrometers. J. Chromatogr. A 2013, 1321, 88–99. [Google Scholar] [PubMed]
- Xu, W.; Huang, M.; Li, H.; Chen, X.; Zhang, Y.; Liu, J.; Xu, W.; Chu, K.; Chen, L. Chemical profiling and quantification of Gua-Lou-Gui-Zhi decoction by high performance liquid chromatography/quadrupole-time-of-flight mass spectrometry and ultra-performance liquid chromatography/triple quadrupole mass spectrometry. J. Chromatogr. B 2015, 986, 69–84. [Google Scholar] [CrossRef] [PubMed]
- Tomczyk, M.; Gudej, J.; Sochacki, M. Flavonoids from Ficaria verna Huds. Z. Naturforschung C 2002, 57, 440–444. [Google Scholar] [CrossRef]
- Huang, M.; Xu, S.; Xu, W.; Chen, D.; Chu, K.; Xu, W.; Peng, J.; Lu, J. Qualitative and quantitative analysis of the major constituents in Jin-Mu-Gan-Mao tablet by high-performance liquid chromatography with diode-array detection and quadrupole time-of-flight tandem mass spectrometry. J. Sep. Sci. 2014, 37, 3497–3508. [Google Scholar] [CrossRef] [PubMed]
- Zedda, M.; Zwiener, C. Is nontarget screening of emerging contaminants by LC-HRMS successful? A plea for compound libraries and computer tools. Anal. Bioanal. Chem. 2012, 403, 2493–2502. [Google Scholar] [CrossRef] [PubMed]
- Sample Availability: Samples of the compounds (1) taurine, (2) ginsenoside Rg1, (3) arenobufagin, (4) TDCA, (5) TCA, (6) bufalin, (7) CA, (8) cinobufagin, (9) resibufogenin, (10) ginsenoside Rg3, (11) CDCA, (12) DCA, (13) tanshinone IIA are available from the authors.
© 2015 by the authors. Licensee MDPI, Basel, Switzerland. This article is an open access article distributed under the terms and conditions of the Creative Commons Attribution license ( http://creativecommons.org/licenses/by/4.0/).
Share and Cite
Chen, D.; Lin, S.; Xu, W.; Huang, M.; Chu, J.; Xiao, F.; Lin, J.; Peng, J. Qualitative and Quantitative Analysis of the Major Constituents in Shexiang Tongxin Dropping Pill by HPLC-Q-TOF-MS/MS and UPLC-QqQ-MS/MS. Molecules 2015, 20, 18597-18619. https://doi.org/10.3390/molecules201018597
Chen D, Lin S, Xu W, Huang M, Chu J, Xiao F, Lin J, Peng J. Qualitative and Quantitative Analysis of the Major Constituents in Shexiang Tongxin Dropping Pill by HPLC-Q-TOF-MS/MS and UPLC-QqQ-MS/MS. Molecules. 2015; 20(10):18597-18619. https://doi.org/10.3390/molecules201018597
Chicago/Turabian StyleChen, Daxin, Shan Lin, Wen Xu, Mingqing Huang, Jianfeng Chu, Fei Xiao, Jiumao Lin, and Jun Peng. 2015. "Qualitative and Quantitative Analysis of the Major Constituents in Shexiang Tongxin Dropping Pill by HPLC-Q-TOF-MS/MS and UPLC-QqQ-MS/MS" Molecules 20, no. 10: 18597-18619. https://doi.org/10.3390/molecules201018597