Article

Variation in Phenolics, Flavanoids, Antioxidant and Tyrosinase Inhibitory Activity of Peach Blossoms at Different Developmental Stages

Zhengzhou Fruit Research Institute, Chinese Academy of Agricultural Sciences, Zhengzhou 450009, China
*
Author to whom correspondence should be addressed.
Molecules 2015, 20(11), 20460-20472; https://doi.org/10.3390/molecules201119709
Submission received: 30 September 2015 / Revised: 2 November 2015 / Accepted: 9 November 2015 / Published: 18 November 2015
(This article belongs to the Section Natural Products Chemistry)

Abstract

:
Peach blossoms were harvested and classified into six developmental stages: (I) bud emerging stage; (II) middle bud stage; (III) large bud stage; (IV) initial-flowering stage; (V) full-flowering stage; and (VI) end-flowering stage. The contents of total phenolics, flavanoids, individual phenolic compounds as well as antioxidant and tyrosinase inhibitory activity of peach blossoms at different developmental stages were investigated. The total phenolic contents varied from 149.80 to 74.80 mg chlorogenic acid equivalents/g dry weight (DW), and the total flavanoid contents ranged from 93.03 to 44.06 mg rutin equivalents/g DW. Both the contents of total phenolics and flavanoids decreased during blossom development. Chlorogenic acid was the predominant component, accounting for 62.08%–71.09% of the total amount of identified phenolic compounds in peach blossom. The antioxidant capacities determined by different assays and tyrosinase inhibitory activity also showed descending patterns during blossom development. Significant correlations were observed between antioxidant capacities with contents of total phenolics and total flavanoids as well as chlorogenic acid, cinnamic acid and kaempferol-3-O-galactoside, while the tyrosinase inhibitory activity had lower correlations with total phenolics and total flavanoids as well as chlorogenic acid, quercetin-3-O-rhamnoside, kaempferol-3-O-galactoside and cinnamic acid. The antioxidant activities of peach blossom seemed to be more dependent on the phenolic compounds than tyrosinase inhibitory activity.

1. Introduction

Free radicals and other reactive oxygen species are intermediate metabolites in many biochemical reactions of living organisms with high reactivity. They can react with cellular components such as lipids, proteins, polypeptides, nucleic acids, saccharides and organic acids, and thereby cause cell damage [1,2,3]. Oxidative damage has been associated with the development of various diseases and degenerative processes in ageing [4,5], and consumption of foods or plant extracts rich in antioxidant phytochemicals is believed to be able to reduce the deleterious effects of oxidative stress [5,6,7,8]. Among the sources of these natural antioxidants, fruits, vegetables and herbs are well documented due to their high contents of ascorbic acid, phenolics, carotenoids and potent antioxidant capacity [9,10,11].
Tyrosinase (EC1.14.18.1) is a key enzyme in melanin biosynthesis. It catalyzes the hydroxylation of monophenols to o-diphenols (monophenolase activity) and the subsequent oxidation of o-diphenols to corresponding o-quinones (diphenolase activity) [12]. These o-quinones then polymerize spontaneously to form brown pigments of high molecular weight (melanins), which is responsible for pigmentation and the color patterns of mammalian skin and hair [13,14]. However, excessive accumulation of epidermal pigmentation may cause several dermatological diseases or hyperpigmentation disorders, such as melanomas, melasma, freckles and age spots [14]. Furthermore, tyrosinase is also responsible for the enzymatic browning of plant tissue, resulting in unfavorable color change and decrease in nutritional value of plant-derived foods [15,16]. Therefore, tyrosinase inhibitors may play an important role in cosmetic and medicinal products as well as agricultural and food industry [17,18,19]. A large number of tyrosinase inhibitors from natural sources have been identified and characterized, in which the phenolic compounds are the largest groups [17,18,19,20,21]. Furthermore, many plant materials, such as herbs, gingers, pomegranate peel, mango seed kernel, green tea seed, oriental cherry, mulberry twigs and root bark have been investigated for their tyrosinase inhibitory activity and several studies have ascribed it to their phenolic compounds [22,23,24,25,26,27,28,29].
Peach (Prunus persica) originated in China and is now cultivated all over the world. The peach fruit is nutritious and rich in antioxidant phytochemicals [30,31]. The peach blossoms have long been used in traditional Chinese medicine to lighten skin, dispel blood stasis and eliminate facial melasma, freckles and age spots. Usually, the dried peach blossoms are consumed as tea or wine and believed to be beneficial for human health. Previous studies revealed that the peach blossom extracts rich in phenolic compounds have potent antoxidant and tyrosinase inhibitory activities [32,33,34]. However, biosynthesis of these bioactive phytochemicals in plant tissues is a highly ordered process and varies during the developmental periods, and the substantial differences in biological activities may occur as well [35,36]. Therefore, determination of the contents of bioactive phytochemicals as well as corresponding bioactivities in plant tissues at different developmental stages is essential for optimizing harvesting time to obtain maximum natural production with higher bioactivities. The present work aims to investigate the changes of phenolics, flavanoids, antioxidant and tyrosinase inhibitory activities of peach blossoms at different development stages. Since different antioxidants may act through different mechanisms, and the mechanism involved in a particular test system depends on the composition, pH and redox potentials of the system [37,38], no single method for antioxidant evaluation can provide full understanding about the antioxidant effects of foods and other materials. For this reason, various methods for antioxidant evaluation, including Photochem assay, DPPH (1,1-diphenyl-2-picrylhydrazyl) assay and hydroxyl radical assay were used in this study.

2. Results and Discussion

2.1. Total Phenolics and Flavanoids

The freshly-harvested peach blossoms were classified into six groups according to their botanical characteristics [39]: (I) bud emerging stage; (II) middle bud stage; (III) large bud stage; (IV) initial-flowering stage; (V) full-flowering stage; and (VI) end-flowering stage. After removing receptacles, sepals, pistils and stamens, the petals were dried in the shade at room temperature until ready for use.
The total phenolic and flavanoid contents of peach blossoms at different developmental stages were measured by using a Folin–Ciocalteu assay [40] and NaNO2–Al(NO3)3–NaOH test system [41], respectively. As shown in Figure 1, the total phenolic and flavanoid contents of peach blossoms declined during development. Especially at bud emerging stage (I) to initial-flowering stage (IV), the contents of total phenolics and flavanoids decreased dramatically from 149.80 and 88.13 mg/g dry weight (DW) to 96.03 and 52.40 mg/g DW, respectively. After initial-flowering stage (IV), the decreasing tendency alleviated, and the total phenolic and flavanoid contents of peach blossoms at full-flowering stage (V) and end-flowering stage (VI) had no significant difference. Meanwhile, the average weight per blossom increased quickly before initial-flowering stage (IV), while the blossoms of full-flowering stage (V) only showed a slightly higher average weight than that of initial-flowering stage (IV). Furthermore, the average weight of blossoms at end-flowering stage (VI) showed a dramatic decrease as compared with that of full-flowering stage (V). Due to the change of average weight of peach blossoms, the amounts of total phenolics and flavanoids calculated as mg/blossom showed an increase pattern during development from bud emerging stage (I) to initial-flowering stage (IV), and then declined at full-flowering stage (V) and end-flowering stage (VI). The total amounts of phenolics and flavanoids of blossoms at initial-flowering stage (IV) were increased by 2.05 and 1.83 fold compared to those of bud emerging stage (I). Therefore, the initial-flowering stage (IV) might be the optimal harvesting time to obtain maximum phenolics and flavanoids production for peach blossom.
Many researchers have observed the decrease of total phenolic and/or flavanoid contents of other plant tissues during development [42,43,44,45]. These might mainly be due to the rapid growth of plant tissues in the early period, leading to a dilution effect of phenolic compounds. In the late period, the plant tissue grows slowly, while the oxidation and transformation of phenolic compounds may be accelerated due to the senescence of plant tissue. In our previous research, we had reported a negative correlation between polyphenols content and fruit weight during apple fruit development, suggesting that the increase of fruit weight in early period may be one of the main reasons of the decline of phenolic content during fruit development [45]. Wei et al. [46] also found the decline of some active components in leaves of pigeon pea during vegetative growth and ascribed it to the rapid growth of plant during that period.
Figure 1. Total phenolic and flavanoid contents of peach blossoms at different developmental stages.
Molecules 20 19709 g001

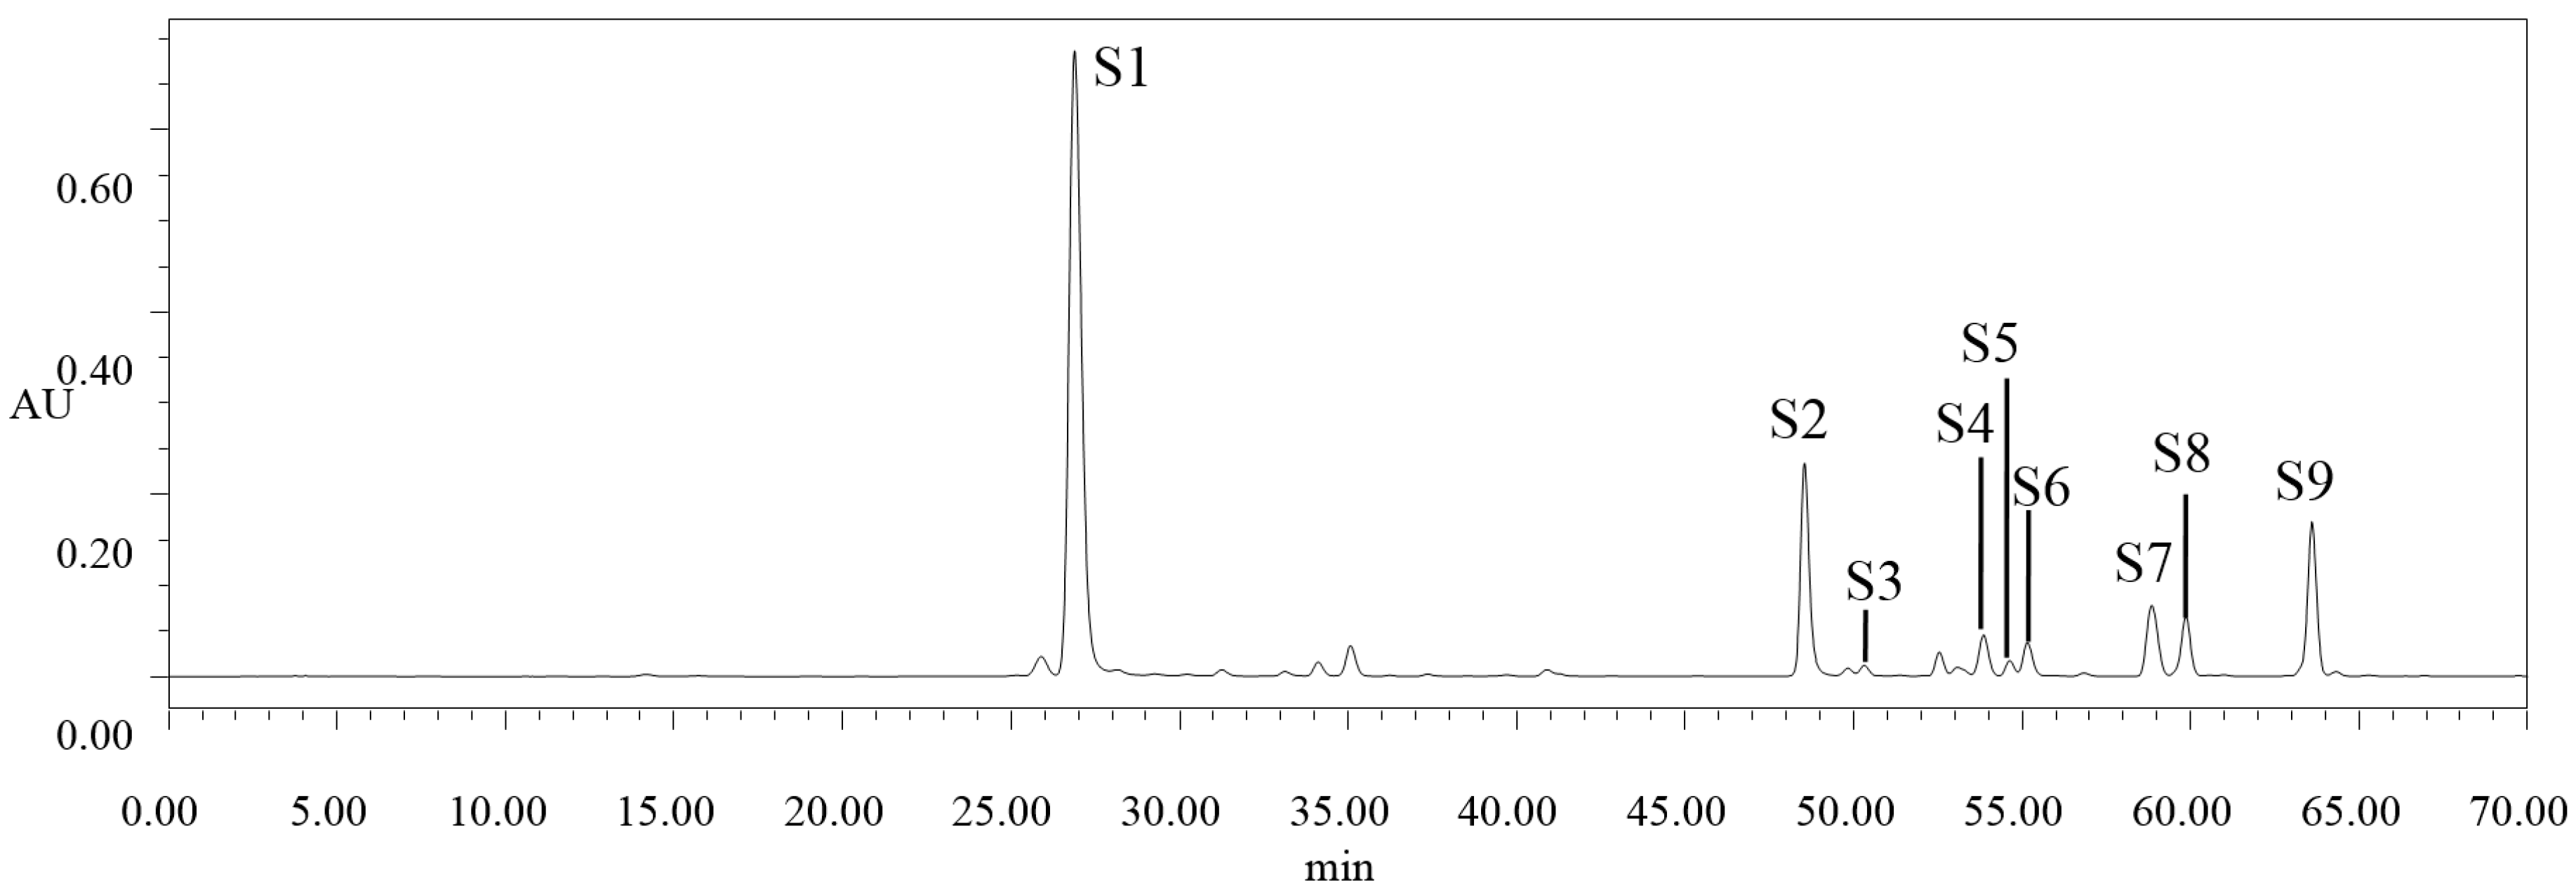
2.2. High Performance Liquid Chromatography (HPLC) Analysis of Selected Phenolic Compounds

Phenolic composition of peach blossom extract was analyzed by using a 1525 HPLC system coupled with a 2996 Photodiode Array Detector (Waters Corp., Wilford, MA, USA). By comparing the retention time and UV spectra with those of phenolic standards, chlorogenic acid (S1), quercetin-3-O-rhamnoside (S3), kaempferol-3-O-galactoside (S4), quercetin-3-O-galactoside (S5), kaempferol-4-O-glucoside (S6), and cinnamic acid (S8) were identified from the peach blossom extract (Figure 2). Several “unknown” compounds were also presented in the chromatogram. For example, the compound noted as “S2” had similar UV spectra to chlorogenic acid, and “S7” and “S9” had similar UV spectra to kaempferol-4-O-glucoside. However, they were not confirmed due to the absence of corresponding standards with the same retention time and UV spectra. Therefore, some other analytical technologies or phenolic standards are needed for elucidating the phenolic composition of peach blossom extract in further studies. Among them, chlorogenic acid was the predominant component in peach blossom extract, which accounted for 62.08%–71.09% of the total amount of identified phenolic compounds (Table 1). During blossom development, the content of chlorogenic acid decreased continuously with a variation of 57.92% from bud emerging stage (I) to end-flowering stage (VI), which was consistent with the change of total phenolic and flavanoid contents. The content of cinnamic acid also showed a similar change during blossom development. For quercetin-3-O-rhamnoside, kaempferol-3-O-galactoside, quercetin-3-O-galactoside and kaempferol-4-O-glucoside, only small differences were observed among different developmental stages of blossoms, and the changes were diverse for each compound during blossom development. For example, the content of quercetin-3-O-rhamnoside showed an obvious decrease till after initial-flowering stage (IV), while the content of kaempferol-4-O-glucoside increased significantly at end-flowering stage (VI). Furthermore, no significant change was found in content of quercetin-3-O-galactoside during the blossom development.
Figure 2. Typical HPLC chromatogram of peach blossom extract at 280 nm. S1: chlorogenic acid; S2: unknown; S3: quercetin-3-O-rhamnoside; S4: kaempferol-3-O-galactoside; S5: quercetin-3-O-galactoside; S6: kaempferol-4-O-glucoside; S7: unknown; S8: cinnamic acid; and S9: unknown.
Molecules 20 19709 g002
Table 1. Contents of individual phenolic compounds in peach blossoms at different developmental stages (mg/g dry weight).
Developmental StageIIIIIIIVVVI
Chlorogenic acid72.87 ± 3.41 a59.58 ± 3.67 b44.21 ± 1.79 c37.32 ± 2.30 d32.53 ± 2.85 de30.67 ± 3.13 e
Quercetin-3-O-rhamnoside3.72 ± 0.30 ab4.00 ± 0.18 a4.00 ± 0.26 a3.76 ± 0.14 ab3.36 ± 0.26 bc3.07 ± 0.21 c
Kaempferol-3-O-galactoside9.96 ± 0.43 a10.08 ± 0.52 a8.45 ± 0.35 b7.50 ± 0.46 c6.52 ± 0.29 d7.05 ± 0.23 cd
Quercetin-3-O-galactoside0.80 ± 0.05 a0.89 ± 0.05 a0.86 ± 0.02 a0.83 ± 0.04 a0.81 ± 0.03 a0.84 ± 0.03 a
Kaempferol-4-O-glucoside5.57 ± 0.22 b5.86 ± 0.19 b5.62 ± 0.31 b5.61 ± 0.28 b5.99 ± 0.17 b6.96 ± 0.33 a
Cinnamic acid1.48 ± 0.10 a1.39 ± 0.06 a1.13 ± 0.03 b0.98 ± 0.03 b0.82 ± 0.05 c0.82 ± 0.02 c
Different superscripts between rows represent significant differences between samples (p < 0.05).

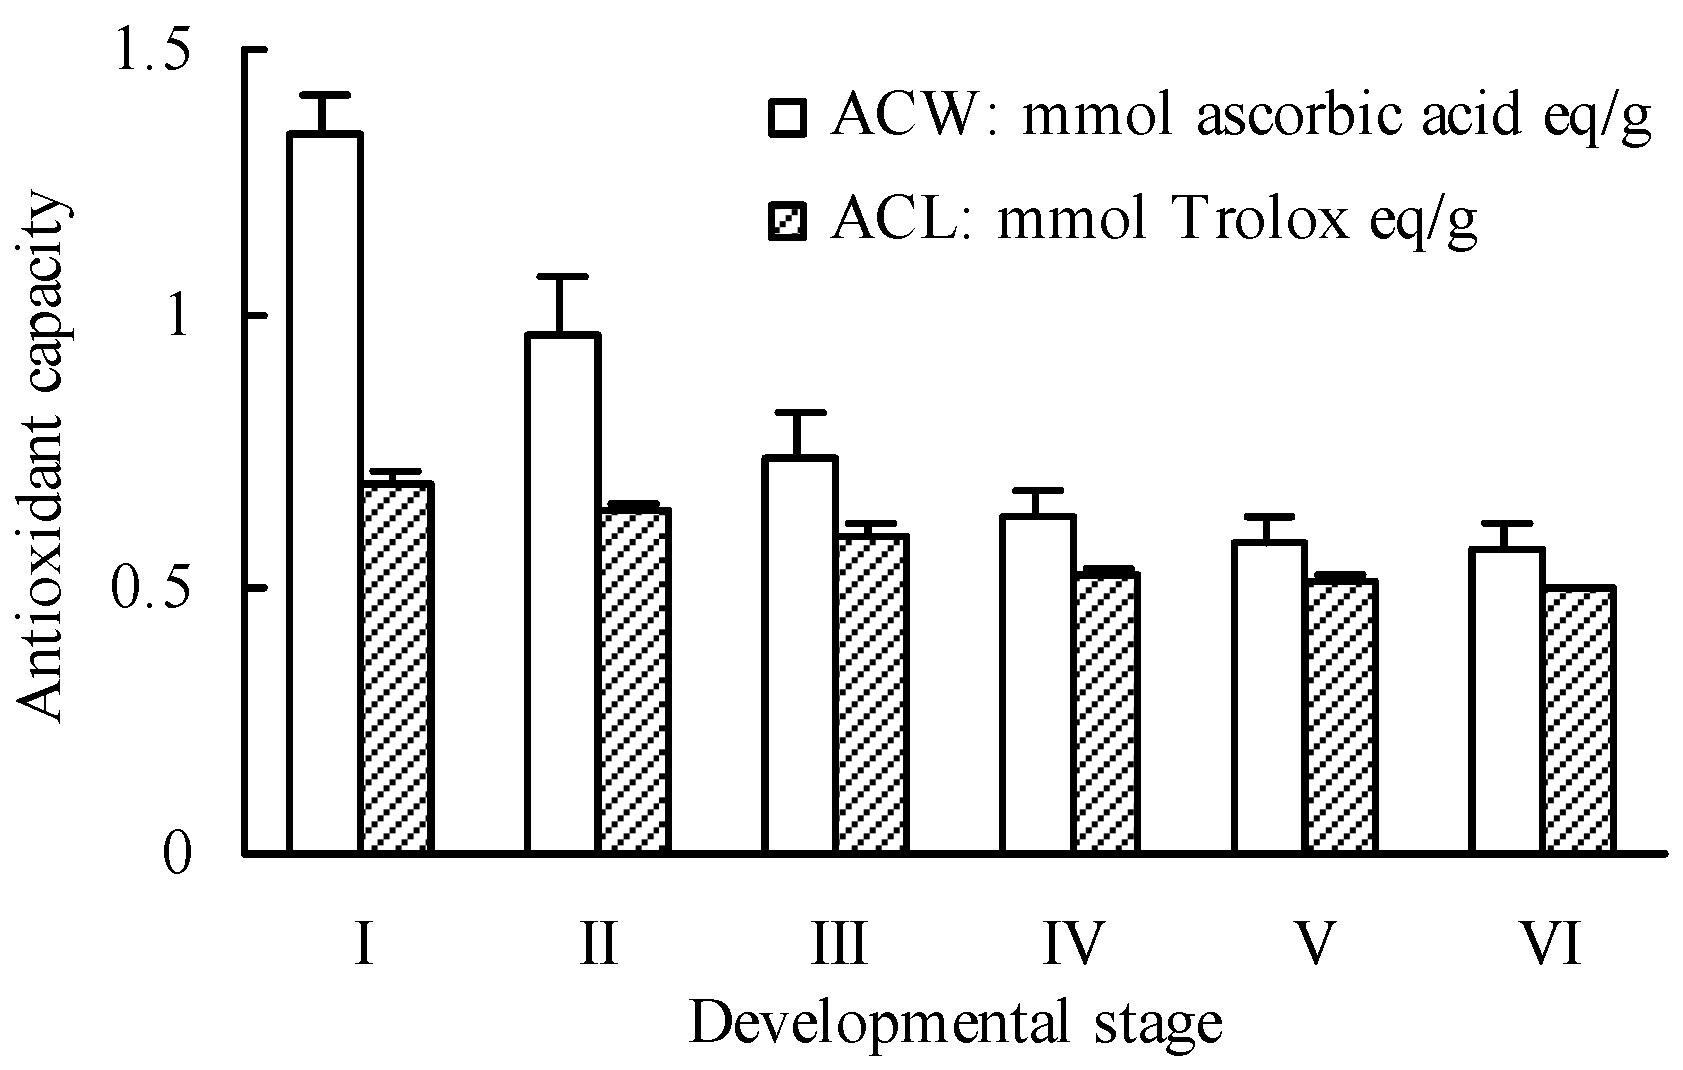
2.3. Antioxidant Activity

2.3.1. Scavenging Capacity towards Superoxide Anion Radicals

The superoxide anion radical scavenging capacities of peach blossoms at different developmental stages were evaluated using a photochemiluminescence assay that was conducted with the PHOTOCHEM® device (Analytik Jena AG, Jena, Germany) [47]. As shown in Figure 3, all of the peach blossoms at different developmental stages exhibited strong scavenging capacities towards superoxide anion radicals in both ACW (Antioxidative Capacity in Water-soluble substances) and ACL (Antioxidative Capacity in Lipid-soluble substances) systems. During blossom development from bud emerging stage (I) to end-flowering stage (VI), the superoxide anion radical scavenging capacity showed a descending pattern with a decrease of 57.52% for water-soluble antioxidant capacity and 28.13% for lipid-soluble antioxidant capacity. Since the two different protocols of ACW and ACL were used to evaluated the antioxidant capacity of the water-soluble and lipid-soluble components, respectively [47,48], the difference in changes of ACW and ACL value indicated that the content of total water-soluble antioxidant components in peach blossoms decreased more greatly than that of lipid-soluble antioxidant components during development.
Besco et al. [48] investigated the antioxidant capacities of baobab and several fruits rich in vitamin C using the same method as the present research. The ACW value of baobab, kiwi, orange, bilberry, and strawberry were 1.2–386.0 (depending on the plant part), 0.73, 17.0, 1.95, and 1.72 μmol AA/g, and the ACL value were 1.0–508.0 (depending on the plant part), 0.27, 0.29, 2.00, and 0.36, respectively. Even if the relative water contents of samples are considered, the ACW and ACL values of peach blossoms are still much higher than the above results. This indicates that the peach blossoms have a potent antioxidant activity and may play an important role in preventing human health from oxidative press.
Figure 3. Scavenging effects towards superoxide anion radicals of peach blossoms at different developmental stages. ACW: Antioxidative Capacity in Water-soluble substances; ACL: Antioxidative Capacity in Lipid-soluble substances.
Molecules 20 19709 g003

2.3.2. Scavenging Capacity towards Hydroxyl Radicals

As shown in Figure 4, the hydroxyl radical scavenging effects showed a dose-dependent pattern for each developmental stage of peach blossoms. There were no significant differences among different developmental stages at lower sample concentration, but the differences became greater with the increase of concentration. At concentration of 240 mg/L, the scavenging percentage of blossoms at bud emerging stage (I) was higher by 57.90% than that of end-flowering stage (VI), while it was only 19.80% at concentration of 30 mg/L. On the whole, the scavenging capacity towards hydroxyl radicals of peach blossoms decreased during the development of blossoms. The blossom of bud emerging stage (I) had the strongest scavenging capacity towards hydroxyl radicals with an IC50 of 85.41 mg/L, and that of end-flowering stage (VI) was the poorest with an IC50 of 243.84 mg/L.
Figure 4. Scavenging effects towards hydroxyl radicals of peach blossoms at different developmental stages.
Molecules 20 19709 g004

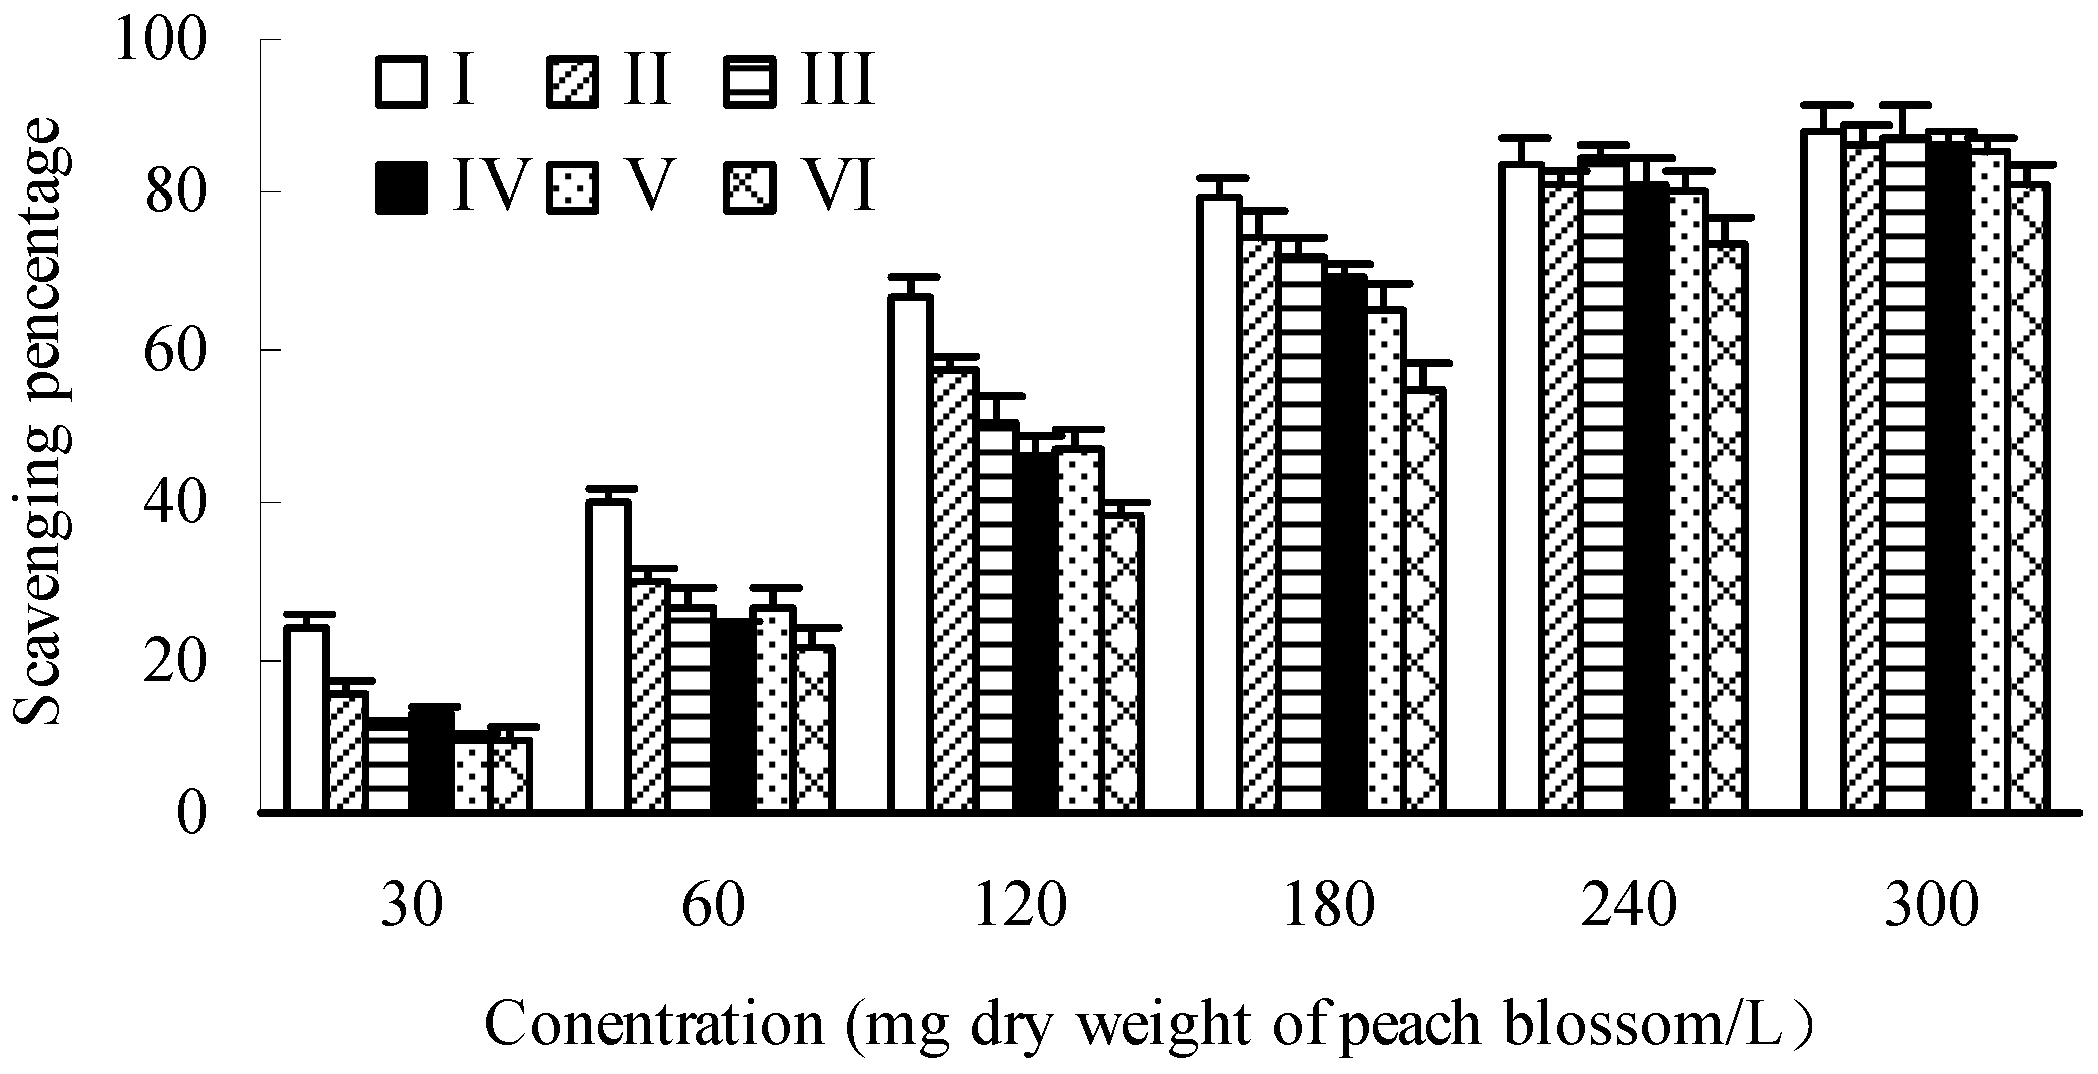
2.3.3. Scavenging Capacity towards DPPH Radicals

Differing from hydroxyl radical assay, the differences of DPPH (1,1-diphenyl-2-picrylhydrazyl) radical scavenging capacities among different developmental stages at lower sample concentration were more significant than those of higher sample concentration (Figure 5). At concentration of 30 mg/L, the scavenging percentage of blossoms at bud emerging stage (I) was higher by 148.62% than that of end-flowering stage (VI), while it was only 13.37% at concentration of 240 mg/L. Moreover, the DPPH radical scavenging effects also showed a dose-dependent pattern and decreased during the development of blossoms, with a variation of IC50 from 82.00 mg/L at bud emerging stage (I) to 162.16 mg/L at end-flowering stage (VI).
As compared with hydroxyl radical assay, the scavenging capacity towards DPPH radicals of peach blossoms was stronger. Zhang et al. [49] determined the antioxidant capacity of pomegranate flower petal and obtained an IC50 of 344.35 and 107.78 mg/L for DPPH and hydroxyl radical assay, respectively, indicating that the pomegranate flower petal extract could scavenging hydroxyl radical more efficiently. This difference may be ascribed to the difference of composition of test samples, and thereby the reaction process as well as the mechanism involved may also differ from each other.
Figure 5. Scavenging effects towards DPPH (1,1-diphenyl-2-picrylhydrazyl) radicals of peach blossoms at different developmental stages.
Molecules 20 19709 g005

2.4. Tyrosinase Inhibitory Activity

Tyrosinase inhibitory activity of peach blossom was also influenced by developmental period. As shown in Figure 6, the inhibitory effects varied among different developmental stages at each concentration, showing a descending tendency with the development of blossoms. Especially at the end period, a sharp decrease was observed from full-flowering stage (V) to end-flowering stage (VI). Furthermore, the tyrosinase inhibitory activity of peach blossom was also dependent on concentration, and the IC50 for bud emerging stage (I) to end-flowering stage (VI) were 59.52, 67.08, 71.96 82.68, 92.44, and 158.68 mg/L, respectively.
Many flowers have been investigated for their tyrosinase inhibitory activity. For example, Jo et al. [50] reported the tyrosinase inhibitory activity of magnolia flower extract with an IC50 of 3343.58 mg/L and Vallisuta et al. [51] demonstrated that marigold flower ethanol extract possessed tyrosinase inhibitory activity with an IC50 of 1078 mg/L. Mango seed kernel and tea seed pericarp extract were also reported for their tyrosinase inhibitory activity with an IC50 of 98.63 and 735.58 mg/L, respectively [27,52]. The present research suggests that peach blossom extract be a potent tyrosinase inhibitor and of interest for cosmetic development.
Figure 6. Tyrosinase inhibitory effects of peach blossoms at different developmental stages.
Molecules 20 19709 g006

2.5. Correlation Analysis

Based on ACW, ACL, or IC50 value, correlation analysis was performed between the total phenolic, flavanoid, individual phenolic contents and antioxidant, tyrosinase inhibitory activity of peach blossoms at different developmental stages. As shown in Table 2, significant correlations were observed between antioxidant capacities determined by different assays with contents of total phenolics and total flavanoids as well as chlorogenic acid, cinnamic acid and kaempferol-3-O-galactoside (p < 0.01). Many studies have documented the correlation between phenolics and antioxidant capacity [53,54,55,56,57], the antioxidant activity of chlorogenic acid, cinnamic acid, kaempferol derivates and quercetin derivates were also reported [58,59,60]. The results of present research were partly in agreement with the previous results. However, quercetin-3-O-rhamnoside, quercetin-3-O-galactoside, and kaempferol-4-O-glucoside, did not show a good correlation with the antioxidant activities in this research. This may mainly be due to their low contents in the peach blossoms as compared to chlorogenic acid.
The tyrosinase inhibitory activity of peach blossom also showed positive correlations with the contents of total phenolics and total flavanoids as well as chlorogenic acid, quercetin-3-O-rhamnoside, kaempferol-3-O-galactoside and cinnamic acid (r = 0.6995~0.8648). However, the correlations were relatively lower as compared to those of antioxidant activities. Other researchers also reported the low positive correlation of phenolics and flavonoids with tyrosinase inhibitory activity [61,62]. This indicates that the antioxidant activities of peach blossom may be more dependent on the phenolic compounds than tyrosinase inhibitory activity.
Interestingly, the tyrosinase inhibitory activity was significantly correlated with DPPH scavenging capacity (p < 0.01) and hydroxyl radical scavenging capacity (p < 0.05). Masuda et al. [63] had reported that seashore plant species with strong antioxidant capacity also had strong tyrosinase inhibition activity, which was similar to our results. It was suggested that the antioxidant activity might be one of the important mechanisms for tyrosinase inhibitory activity.
Table 2. Correlations between total phenolic, total flavanoid, and individual phenolic contents and antioxidant and tyrosinase inhibitory activity.
ACWACLHRDPPHTI
Total phenolics0.9795 **0.9875 **0.9593 **0.9372 **0.7242
Total flavanoids0.9775 **0.9845 **0.9608 **0.9302 **0.7124
Chlorogenic acid0.9856 **0.9795 **0.9496 **0.9285 **0.6995
Quercetin-3-O-rhamnoside0.45250.66020.8037 *0.70630.8648 *
Kaempferol-3-O-galactoside0.8825 **0.9510 **0.9585 **0.8369 *0.6570
Quercetin-3-O-galactoside−0.12360.11760.2104−0.06400.0501
Kaempferol-4-O-glucoside−0.4788−0.5769−0.7043−0.7862 *−0.9560 **
Cinnamic acid0.9333 **0.9802 **0.9851 **0.9136 **0.7379
TI0.62820.74270.8368 *0.9001 **
DPPH0.9011 **0.9355 **0.9435 **
HR0.8899 **0.9652 **
ACL0.9509 **
ACW: antioxidant capacity in water-soluble substances; ACL: antioxidant capacity in lipid-soluble substances; HR: hydroxyl radical scavenging capacity. DPPH: DPPH radical scavenging capacity; TI: tyrosinase inhibitory activity. * indicated significant correlation at p < 0.05, ** indicated significant correlation at p < 0.01.

3. Experimental Section

3.1. Materials

The peach blossoms were harvested from trees grown in National Fruit Tree Germplasm Repository in Zhengzhou Fruit Research Institute, Chinese Academy of Agricultural Sciences, China. The freshly-harvested blossoms were classified into six groups according to their botanical characteristics [39]: (I) bud emerging stage: buds initially emerged from scaly bracts, a small part of petals displayed from the top of buds; (II) middle bud stage: buds swelled constantly, half petals of the bud displayed; (III) large bud stage: the displayed petals accounted for 80 percent of the bud; (IV) initial-flowering stage: the outer petals began to open; (V) full-flowering stage: petals opened completely with observable pistils and stamens; and (VI) end-flowering stage: fully matured petals began to fall. Then, the receptacles, sepals, pistils and stamens were removed and the petals were dried in the shade at room temperature.

3.2. Preparation of Peach Blossom Extracts

The dried petals of peach blossoms were ground to fine powder to pass through a 60-mesh sieve. In total, 0.5 g of the powder was extracted with 50 mL of 50% ethanol at 25 °C for 6 h. Then, the extracts were filtered to yield ethanolic extracts of peach blossoms. These ethanolic extracts were used for the determination of total phenolics, flavanoids, antioxidant and tyrosinase inhibitory activity.

3.3. Determination of Total Phenolic Content

Folin–Ciocalteu reagent was used to determine the total phenolic content according to the method described by Singleton et al. [40]. The absorbance was measured at 760 nm with a UV/Vis Spectrometer and chlorogenic acid was used as standard phenolic compound for the calibration curve. Total phenolic contents of peach blossoms were expressed as milligram of chlorogenic acid equivalents (CAE) per gram dry weight of peach blossoms (mg CAE/g DW).

3.4. Determination of Total Flavonoid Content

A colorimetric method with NaNO2–Al(NO3)3–NaOH test system was used to estimate the total flavonoid content as described by Yang et al. [41]. The absorbance was measured at 510 nm with a UV/Vis Spectrometer and rutin was used as standard flavonoid compound for the calibration curve. Total flavonoid contents of peach blossoms were expressed as milligram of rutin equivalents (RE) per gram dry weight of peach blossoms (mg RE/g DW).

3.5. High Performance Liquid Chromatography (HPLC) Analysis of Selected Phenolic Compounds

Phenolic composition of peach blossom extract was analyzed by using a 1525 HPLC system coupled with a 2996 Photodiode Array Detector (Waters Corp., Wilford, MA, USA). The separation was performed on a Waters Symmetry C18 column (4.6 × 150 mm, 5 µm) at 30 °C with a gradient elution of mobile phase consisting of methanol (solvent A) and deionized water of pH 2.6 adjusted with phosphoric acid (solvent B). The flow rate of solvent was 0.6 mL/min, and the gradient elution program was as follows: 0 min 15% A, 15 min 25% A, 25 min 25% A, 65 min 75% A, 70 min 15% A. Peaks were monitored at 280 nm with a scanning range from 210 to 400 nm, and the phenolic compounds in peach blossom extract were identified by comparing the retention time and UV spectra with those of phenolic standards. Quantitative analysis of identified phenolic compounds was conducted by using external calibration curves, and the contents of the individual phenolic compounds were expressed as milligram per gram dry weight of peach blossoms (mg/g DW).

3.6. Photochem Assay

A photochemiluminescence assay was conducted with the PHOTOCHEM® device (Analytik Jena AG, Jena, Germany) as described by Pegg et al. [47]. Superoxide anion radicals were generated by optical excitation of luminol (5-amino-2,3-dihydro-l,4-phthalazinedione), and the water-soluble and lipid-soluble antioxidant capacity of peach blossom extract was measured by using ACW (Antioxidative Capacity in Water-soluble substances) and ACL (Antioxidative Capacity in Lipid-soluble substances) kits, respectively. Results were calculated through the ascorbic acid calibration curve for water-soluble antioxidant capacity or Trolox (a synthetic vitamin E) calibration curve for lipid-soluble antioxidant capacity and expressed as mmol equivalents per gram dry weight of peach blossoms (mmol ascorbic acid eq/g DW or mmol Trolox eq/g DW).

3.7. DPPH Assay

Scavenging capacity towards DPPH (1,1-diphenyl-2-picrylhydrazyl) radicals was assayed according to the method described by Maisuthisakul and Gordon [29] with slight modifications. Briefly, 1.0 mL of 0.2 mmol/L of DPPH ethanol solution was added to 2.0 mL of peach blossom extracts at various concentrations or negative control (1:1 ethanol–water). The mixture was shaken vigorously and incubated at 25 °C in the dark for 30 min. Then the absorbance was measured at 517 nm with a spectrophotometer. Lower absorbance of the reaction mixture indicates higher free radical scavenging activity. The DPPH radical scavenging capacity (%) was calculated by using the following equation:
Scavenging percentage = [A0 – (A1 – A2) ] × 100/A0
where A0 is the absorbance of the negative control without peach blossom extract, A1 is the absorbance in the presence of peach blossom extract and DPPH, and A2 is the absorbance of peach blossom extract without DPPH.

3.8. Hydroxyl Radical Assay

Scavenging capacity towards hydroxyl radicals was measured according to the method described by Smirnoff and Cumbes [64] with slight modifications. The reaction mixture contained 0.5 mL of 5.5 mmol/L FeSO4, 0.5 mL of 6.5 mmol/L EDTA, 0.5 mL of 10 mmol/L sodium salicylate, 0.5 mL of 12 mmol/L hydrogen peroxide, 3.0 mL of 50 mmol/L phosphate buffer (pH 7.4) and 0.5 mL of samples. After incubation for 30 min at 37 °C, the absorbance of the mixture was measured at 510 nm with a spectrophotometer. The scavenging percentage was calculated as follows:
Scavenging percentage = [A0 – (A1 – A2)] × 100/A0
where A0 is the absorbance of control without peach blossom extract, A1 is the absorbance in the presence of peach blossom extract and sodium salicylate, and A2 is the absorbance of peach blossom extract without sodium salicylate.

3.9. Tyrosinase Inhibition Assay

Tyrosinase inhibitory activity was determined by using a commercially available mushroom tyrosinase with L-DOPA (L-3,4-dihydroxyphenylalanine) as substrate according to the method described by Hsu et al. [65] with slight modifications. Each 4 mL of reaction mixture contained 1.5 mmol/L L-DOPA, 21 U of mushroom tyrosinase, 50 mmol/L phosphate buffer (pH 6.8), and peach blossom extracts at various concentrations. The reaction was performed at 30 °C and monitored by measuring the absorbance at 475 nm for 3 min. The tyrosinase inhibitory activity was calculated according to the following equation:
Tyrosinase inhibition percentage = [(AB) – (CD)] × 100/(AB)
where A is the absorbance of the control in the presence of L-DOPA and tyrosinase, B is the absorbance of L-DOPA, C is the absorbance of the sample in the presence of peach blossom extract, L-DOPA and tyrosinase, and D is the absorbance of sample control in the presence of peach blossom extract and L-DOPA.

3.10. Statistical Analysis

Statistical analysis was performed with IBM SPSS Statistics 19 (IBM-SPSS Inc, Armonk, NY, USA). The data are presented as mean ± SD for triplicate.

4. Conclusions

The total phenolic and flavanoid contents of peach blossoms declined during development with a variation from 149.80 mg CAE/g DW and 88.13 mg RE/g DW to 74.80 mg CAE/g DW and 44.06 mg RE/g DW, respectively. Meanwhile, the average weight per blossom increased quickly before initial-flowering stage (IV), leading to an increase of total amounts of phenolics and flavanoids per blossom up to initial-flowering stage (IV). Thus, the initial-flowering stage (IV) might be the optimal harvesting time to obtain maximum phenolics and flavanoids production for peach blossom.
Six phenolic compounds were identified and quantified, and chlorogenic acid was the predominant component in peach blossom extract, accounting for 62.08%–71.09% of the total amount of identified phenolic compounds. It decreased continuously with a variation of 57.92% from bud emerging stage (I) to end-flowering stage (VI), which was consistent with the change of total phenolic and flavanoid contents. The content of cinnamic acid also showed a similar change during blossom development. However, for quercetin-3-O-rhamnoside, kaempferol-3-O-galactoside, quercetin-3-O-galactoside and kaempferol-4-O-glucoside, only small differences were observed among different developmental stages of blossoms, and the changes were diverse for each compound during blossom development.
The antioxidant capacities determined by different assays and tyrosinase inhibitory activity also showed descending patterns during blossom development. Significant correlations were observed between antioxidant capacities determined by different assays with contents of total phenolics and total flavanoids as well as chlorogenic acid, cinnamic acid and kaempferol-3-O-galactoside, while the tyrosinase inhibitory activity of peach blossom had lower correlations with total phenolics and total flavanoids as well as chlorogenic acid, quercetin-3-O-rhamnoside, kaempferol-3-O-galactoside and cinnamic acid. The antioxidant activities of peach blossom seemed to be more dependent on the phenolic compounds than tyrosinase inhibitory activity.

Acknowledgments

This work was supported by Fundamental and Frontier technology research Research Project of Henan Province (142300410046) and the Agricultural Science and Technology Innovation Program (ASTIP) of CAAS (CAAS-ASTIP-2015-ZFRI).

Author Contributions

Z.-G.J. and J.-C.L. designed the experiments. J.-C.L., W.-B.Y., C.-L.Z. and H.L. performed the experiments. Z.-G.J., J.-C.L. and W.-B.Y. analyzed the data. J.-C.L., W.-B.Y. and Z.-Z.L. contributed reagents, materials, and analytical tools. Z.-G.J. and J.-C.L. composed the paper.

Conflicts of Interest

The authors declare no conflict of interest.

References

  1. Kohen, R.; Nyska, A. Oxidation of biological systems: Oxidative stress phenomena, antioxidants, redox reactions, and methods for their quantification. Toxicol. Pathol. 2002, 30, 620–650. [Google Scholar] [CrossRef] [PubMed]
  2. Valko, M.; Leibfritz, D.; Moncol, J.; Cronin, M.T.; Mazur, M.; Telser, J. Free radicals and antioxidants in normal physiological functions and human disease. Int. J. Biochem. Cell. Biol. 2007, 39, 44–84. [Google Scholar] [CrossRef] [PubMed]
  3. Comporti, M. Three models of free radical-induced cell injury. Chem. Biol. Interact. 1989, 72, 1–56. [Google Scholar] [CrossRef]
  4. Liochev, S.I. Reactive oxygen species and the free radical theory of aging. Free Radical Biol. Med. 2013, 60, 1–4. [Google Scholar] [CrossRef] [PubMed]
  5. Aruoma, O.I. Free radicals, oxidative stress, and antioxidants in human health and disease. J. Am. Oil Chem. Soc. 1998, 75, 199–212. [Google Scholar] [CrossRef]
  6. Gordon, M.H. Dietary antioxidants in disease prevention. Nat. Prod. Rep. 1996, 13, 265–273. [Google Scholar] [CrossRef] [PubMed]
  7. Lee, J.; Koo, N.; Min, D.B. Reactive oxygen species, aging, and antioxidative nutraceuticals. Compr. Rev. Food Sci. Food Saf. 2004, 3, 21–33. [Google Scholar] [CrossRef]
  8. Gordon, M.H. Significance of dietary antioxidants for health. Int. J. Mol. Sci. 2012, 13, 173–179. [Google Scholar] [CrossRef] [PubMed]
  9. Wang, S.; Melnyk, J.P.; Tsao, R.; Marcone, M.F. How natural dietary antioxidants in fruits, vegetables and legumes promote vascular health. Food Res. Int. 2011, 44, 14–22. [Google Scholar] [CrossRef]
  10. Fiedor, J.; Burda, K. Potential role of carotenoids as antioxidants in human health and disease. Nutrients 2014, 6, 466–488. [Google Scholar] [CrossRef] [PubMed]
  11. Pandey, K.D.; Rizvi, S.I. Plant polyphenols as dietary antioxidants in human health and disease. Oxid. Med. Cell Longev. 2009, 2, 270–278. [Google Scholar] [CrossRef] [PubMed]
  12. Sanchez-Ferrer, A.; Rodrıguez-Lopez, J.N.; Garcia-Canovas, F.; Garcia-Carmona, F. Tyrosinase: A comprehensive review of its mechanism. Biochim. Biophys. Acta 1995, 1247, 1–11. [Google Scholar] [CrossRef]
  13. Hearing, V.J.; Tsukamoto, K. Enzymatic control of pigmentation in mammals. FASEB J. 1991, 5, 2902–2909. [Google Scholar] [PubMed]
  14. Costin, G.E.; Hearing, V.J. Human skin pigmentation: Melanocytes modulate skin color in response to stress. FASEB J. 2007, 21, 4976–4994. [Google Scholar] [CrossRef] [PubMed]
  15. Friedman, M. Food browning and its prevention: An overview. J. Agric. Food Chem. 1996, 44, 631–653. [Google Scholar] [CrossRef]
  16. Martinez, M.V.; Whitaker, J.R. The biochemistry and control of enzymatic browning. Trends Food Sci. Technol. 1995, 6, 195–200. [Google Scholar] [CrossRef]
  17. Loizzo, M.R.; Tundis, R.; Menichini, F. Natural and synthetic tyrosinase inhibitors as antibrowning agents. Compr. Rev. Food Sci. Food Saf. 2012, 11, 378–398. [Google Scholar] [CrossRef]
  18. Kim, Y.-J.; Uyama, H. Tyrosinase inhibitors from natural and synthetic sources: Structure, inhibition mechanism and perspective for the future. Cell. Mol. Life Sci. 2005, 62, 1707–1723. [Google Scholar] [CrossRef] [PubMed]
  19. Parvez, S.; Kang, M.; Chung, H.-S.; Bae, H. Naturally occurring tyrosinase inhibitors: Mechanism and applications in skin health, cosmetics and agriculture industries. Phytother. Res. 2007, 21, 805–816. [Google Scholar] [CrossRef] [PubMed]
  20. Chang, T.-S. An updated review of tyrosinase inhibitors. Int. J. Mol. Sci. 2009, 10, 2440–2475. [Google Scholar] [CrossRef] [PubMed]
  21. Orhan, I.E.; Khan, M.T.H. Flavonoid derivatives as potent tyrosinase inhibitors—A survey of recent findings between 2008 and 2013. Curr. Top. Med. Chem. 2014, 14, 1486–1493. [Google Scholar] [CrossRef] [PubMed]
  22. Lee, K.T.; Kim, B.J.; Kim, J.H.; Heo, M.Y.; Kim, H.P. Biological screening of 100 plant extracts for cosmetic use (I): Inhibitory activities of tyrosinase and DOPA auto-oxidation. Int. J. Cosmet. Sci. 1997, 19, 291–298. [Google Scholar] [CrossRef] [PubMed]
  23. Dung, N.T.; Bajpai, V.K.; Rahman, A.; Yoon, J.I.; Kang, S.C. Phenolic contents, antioxidant and tyrosinase inhibitory activities of Lonicera japonica Thumb. J. Food Biochem. 2011, 35, 148–160. [Google Scholar] [CrossRef]
  24. Chan, E.W.C.; Lim, Y.Y.; Wong, L.F.; Lianto, F.S.; Wong, S.K.; Lim, K.K.; Joe, C.E.; Lim, T.Y. Antioxidant and tyrosinase inhibition properties of leaves and rhizomes of ginger species. Food Chem. 2008, 109, 477–483. [Google Scholar] [CrossRef]
  25. Chang, L.W.; Juang, L.J.; Wang, B.S.; Wang, M.Y.; Tai, H.M.; Hung, W.J.; Chen, Y.J.; Huang, M.H. Antioxidant and antityrosinase activity of mulberry (Morus alba L.) twigs and root bark. Food Chem. Toxicol. 2011, 49, 785–790. [Google Scholar] [CrossRef] [PubMed]
  26. Yoshimura, M.; Watanabe, Y.; Kasai, K.; Yamakoshi, J.; Koga, T. Inhibitory effect of an ellagic acid-rich pomegranate extract on tyrosinase activity and ultraviolet-induced pigmentation. Biosci. Biotechnol. Biochem. 2005, 69, 2368–2373. [Google Scholar] [CrossRef] [PubMed]
  27. Jo, Y.-H.; Yuk, H.-G.; Lee, J.-H.; Kim, J.-W.; Kim, R.; Lee, S.-C. Antioxidant, tyrosinase inhibitory, and acetylcholinesterase inhibitory activities of green tea (Camellia sinensis L.) seed and its pericarp. Food Sci. Biotechnol. 2012, 21, 761–768. [Google Scholar] [CrossRef]
  28. Park, J.W.; Yuk, H.G.; Lee, S.C. Antioxidant and tyrosinase inhibitory activities of different parts of oriental cherry (Prunus serrulata var. spontanea). Food Sci. Biotechnol. 2012, 21, 339–343. [Google Scholar] [CrossRef]
  29. Maisuthisakul, P.; Gordon, M.H. Antioxidant and tyrosinase inhibitory activity of mango seed kernel by product. Food Chem. 2009, 117, 332–341. [Google Scholar] [CrossRef]
  30. Reig, G.; Iglesias, I.; Gatius, F.; Alegre, S. Antioxidant capacity, quality, and anthocyanin and nutrient contents of several peach cultivars [Prunus persica (L.) Batsch] grown in spain. J. Agric. Food Chem. 2013, 61, 6344–6357. [Google Scholar] [CrossRef] [PubMed]
  31. Gil, M.I.; Tomás-Barberán, F.A.; Hess-Pierce, B.; Kader, A.A. Antioxidant capacities, phenolic compounds, carotenoids, and vitamin C contents of nectarine, peach, and plum cultivars from California. J. Agric. Food Chem. 2002, 50, 4976–4982. [Google Scholar] [CrossRef] [PubMed]
  32. Li, C.; Wang, M.-H. Antioxidant activity of peach blossom extracts. J. Korean Soc. Appl. Biol. Chem. 2011, 54, 46–53. [Google Scholar] [CrossRef]
  33. Liu, J.C.; Zhang, C.L.; Lv, Z.Z.; Liu, H.; Jiao, Z.G. Extraction of total phenolics and flavanoids from peach blossoms and their antioxidant activity. J. Food Saf. Quality 2013, 4, 1750–1756. [Google Scholar]
  34. Liu, J.C.; Zhang, Q.L.; Jiao, Z.G.; Zhang, C.L.; Lv, Z.Z.; Liu, H.; Wang, S.X. Inhibitory effect of peach flower extract on tyrosinase and its kinetics analysis. J. Fruit Sci. 2014, 31, 836–841. [Google Scholar]
  35. Schmitzer, V.; Mikulic-Petkovsek, M.; Stampar, F. Sepal phenolic profile during Helleborus niger flower development. J. Plant Physiol. 2013, 170, 1407–1415. [Google Scholar] [CrossRef] [PubMed]
  36. Shao, Y.; Xu, F.; Sun, X.; Bao, J.; Beta, T. Phenolic acids, anthocyanins, and antioxidant capacity in rice (Oryza sativa L.) grains at four stages of development after flowering. Food Chem. 2014, 143, 90–96. [Google Scholar] [CrossRef] [PubMed]
  37. Apak, R.; Gorinstein, S.; Böhm, V.; Schaich, K.M.; Özyüre, M.; Güçlü, K. Methods of measurement and evaluation of natural antioxidant capacity/activity (IUPAC technical report). Pure Appl. Chem. 2013, 85, 957–998. [Google Scholar] [CrossRef]
  38. Niki, E. Assessment of antioxidant capacity in vitro and in vivo. Free Radical Biol. Med. 2010, 49, 503–515. [Google Scholar] [CrossRef] [PubMed]
  39. Zhu, L.F.; Li, S.Y.; Zheng, Y.M.; Dong, L. The substitute substrate for soilless culture of potted ornamental peach. Hunan Agric. Sci. 2012, 7, 119–121, 125. [Google Scholar]
  40. Singleton, V.L.; Orthofer, R.; Lamuela-Raventos, R.M. Analysis of total phenols and other oxidation substrates and antioxidants by means of Folin-Ciocalteu reagent. Method. Enzymol. 1999, 299, 152–178. [Google Scholar]
  41. Yang, L.; Cao, Y.L.; Jiang, J.G.; Lin, Q.S.; Chen, J.; Zhu, L. Response surface optimization of ultrasound-assisted flavonoids extraction from the flower of Citrus aurantium L. var. amara. Engl. J. Sep. Sci. 2010, 33, 1349–1355. [Google Scholar] [PubMed]
  42. Towler, M.J.; Weathers, P.J. Variations in key artemisinic and other metabolites throughout plant development in Artemisia annua L. for potential therapeutic use. Ind. Crop. Prod. 2015, 67, 185–191. [Google Scholar] [CrossRef] [PubMed]
  43. Kulkarni, A.P.; Aradhya, S.M. Chemical changes and antioxidant activity in pomegranate arils during fruit development. Food Chem. 2005, 93, 319–324. [Google Scholar] [CrossRef]
  44. Shi, G.A.; Guo, X.F.; Fan, B.Y.; Bao, M.Z. Changes of antioxidative activity during florescence and flower senescence of peonies petal. Acta Hort. Sin. 2009, 36, 1685–1690. [Google Scholar]
  45. Wang, S.X.; Liu, J.C.; Jiao, Z.G.; Zhang, S.N.; Yang, L. Changes of polyphenols during fruit development in apples. J. Fruit Sci. 2003, 20, 427–431. [Google Scholar]
  46. Wei, Z.-F.; Jin, S.; Luo, M.; Pan, Y.-Z.; Li, T.-T.; Qi, X.-L.; Efferth, T.; Fu, Y.-J.; Zu, Y.-G. Variation in contents of main active components and antioxidant activity in leaves of different pigeon pea cultivars during growth. J. Agric. Food Chem. 2013, 61, 10002–10009. [Google Scholar] [CrossRef] [PubMed]
  47. Pegg, R.B.; Amarowicz, R.; Naczk, M.; Shahidi, F. PHOTOCHEM® for determination of antioxidant capacity of plant extracts. ACS Sym. Ser. 2007, 956, 140–158. [Google Scholar]
  48. Besco, E.; Braccioli, E.; Vertuan, S.; Ziosi, P.; Brazzo, F.; Bruni, R.; Sacchetti, G.; Manfredini, S. The use of photochemiluminescence for the measurement of the integral antioxidant capacity of baobab products. Food Chem. 2007, 102, 1352–1356. [Google Scholar] [CrossRef]
  49. Zhang, L.; Yang, X.; Zhang, Y.; Wang, L.; Zhang, R. In vitro antioxidant properties of different parts of pomegranate flowers. Food Bioprod. Process. 2011, 89, 234–240. [Google Scholar] [CrossRef]
  50. Jo, Y.-H.; Seo, G.-U.; Yuk, H.-G.; Lee, S.-C. Antioxidant and tyrosinase inhibitory activities of methanol extracts from Magnolia denudata and Magnolia denudata var. purpurascens flowers. Food Res. Int. 2012, 47, 197–200. [Google Scholar] [CrossRef]
  51. Vallisuta, O.; Nukoolkarn, V.; Mitrevej, A.; Sarisuta, N.; Leelapornpisid, P.; Phrutivorapongkul, A.; Sinchaipanid, N. In vitro studies on the cytotoxicity, and elastase and tyrosinase inhibitory activities of marigold (Tagetes erecta L.) flower extracts. Exp. Ther. Med. 2014, 7, 246–250. [Google Scholar] [PubMed]
  52. Nithitanakool, S.; Pithayanukul, P.; Bavovada, R.; Saparpakorn, P. Molecular docking studies and anti-tyrosinase activity of thai mango seed kernel extract. Molecules 2009, 14, 257–265. [Google Scholar] [CrossRef] [PubMed]
  53. Zhang, W.; Zhao, X.; Sun, C.; Li, X.; Chen, K. Phenolic composition from different loquat (Eriobotrya japonica Lindl.) cultivars grown in China and their antioxidant properties. Molecules 2015, 20, 542–555. [Google Scholar] [CrossRef] [PubMed]
  54. Abbasi, A.M.; Guo, X.; Fu, X.; Zhou, L.; Chen, Y.; Zhu, Y.; Yan, H.; Liu, R.H. Comparative assessment of phenolic content and in vitro antioxidant capacity in the pulp and peel of mango cultivars. Int. J. Mol. Sci. 2015, 16, 13507–13527. [Google Scholar] [CrossRef] [PubMed]
  55. Liu, H.; Cao, J.; Jiang, W. Evaluation and comparison of vitamin C, phenolic compounds, antioxidant properties and metal chelating activity of pulp and peel from selected peach cultivars. LWT-Food Sci. Technol. 2015, 63, 1042–1048. [Google Scholar] [CrossRef]
  56. Xiong, L.N.; Yang, J.J.; Jiang, Y.R.; Lu, B.Y.; Hu, Y.Z.; Zhou, F.; Mao, S.Q.; Shen, C.X. Phenolic compounds and antioxidant capacities of 10 common edible flowers from China. J. Food Sci. 2014, 79, C517–C525. [Google Scholar] [CrossRef] [PubMed]
  57. Li, A.N.; Li, S.; Li, H.B.; Xu, D.P.; Xu, X.R.; Chen, F. Total phenolic contents and antioxidant capacities of 51 edible and wild flowers. J. Funct. Foods 2014, 6, 319–330. [Google Scholar] [CrossRef]
  58. Zhu, X.Y.; Lin, H.M.; Chen, X.; Xie, J.; Wang, P. Mechanochemical-assisted extraction and antioxidant activities of kaempferol glycosides from Camellia oleifera Abel. meal. J. Agric. Food Chem. 2011, 59, 3986–3993. [Google Scholar] [CrossRef] [PubMed]
  59. Tseye-Oidov, O.; Mkami, I.; Watanabe, J.; Tsushida, T.; Demberel, B.; Kimura, T.; Ide, T. Antioxidant capacities and total quercetin content of several species of polygonaceae in Mongolia. Food Sci. Technol. Res. 2010, 16, 169–174. [Google Scholar] [CrossRef]
  60. Sevgi, K.; Tepe, B.; Sarikurkcu, C. Antioxidant and DNA damage protection potentials of selected phenolic acids. Food Chem. Toxicol. 2015, 77, 12–21. [Google Scholar] [CrossRef] [PubMed]
  61. Oskoueian, E.; Abdullah, N.; Hendra, R.; Karimi, E. Bioactive compounds, antioxidant, xanthine oxidase inhibitory, tyrosinase inhibitory and anti-inflammatory activities of selected agro-industrial by-products. Int. J. Mol. Sci. 2011, 12, 8610–8625. [Google Scholar] [CrossRef] [PubMed]
  62. Wang, C.Y.; Ng, C.C.; Lin, H.T.; Shyu, Y.T. Free radical-scavenging and tyrosinase-inhibiting activities of extracts from sorghum distillery residue. J. Biosci. Bioeng. 2011, 111, 554–556. [Google Scholar] [CrossRef] [PubMed]
  63. Masuda, T.; Yamashita, D.; Takeda, Y.; Yonemori, S. Screening for tyrosinase inhibitors among extracts of seashore plants and identification of potent inhibitors from Garcinia subelliptica. Biosci. Biotechnol. Biochem. 2005, 69, 197–201. [Google Scholar] [CrossRef] [PubMed]
  64. Smirnoff, N.; Cumbes, Q.J. Hydroxyl radical scavenging activity of compatible solutes. Phytochemistry 1989, 28, 1057–1060. [Google Scholar] [CrossRef]
  65. Hsu, C.-K.; Chang, C.-T.; Lu, H.-Y.; Chung, Y.-C. Inhibitory effects of the water extracts of Lavendula sp. on mushroom tyrosinase activity. Food Chem. 2007, 105, 1099–1105. [Google Scholar] [CrossRef]
  • Sample Availability: Samples of the peach blossom are available from the authors.

