Article

A Sorghum MYB Transcription Factor Induces 3-Deoxyanthocyanidins and Enhances Resistance against Leaf Blights in Maize

1
Department of Plant Science, The Pennsylvania State University, University Park, PA 16802, USA
2
Intercollege Graduate Degree Program in Plant Biology, Pennsylvania State University, University Park, PA 16802, USA
3
Botany Department, Faculty of Science, Mansoura University, AlMansoura, 35516, Egypt
4
MU Informatics Institute, University of Missouri, Columbia, MO 65201, USA
*
Author to whom correspondence should be addressed.
These authors contributed equally to the work.
Molecules 2015, 20(2), 2388-2404; https://doi.org/10.3390/molecules20022388
Submission received: 14 October 2014 / Accepted: 22 January 2015 / Published: 30 January 2015
(This article belongs to the Special Issue Phytoalexins: Current Progress and Future Prospects)

Abstract

:
Sorghum responds to the ingress of the fungal pathogen Colletotrichum sublineolum through the biosynthesis of 3-deoxyanthocyanidin phytoalexins at the site of primary infection. Biosynthesis of 3-deoxyanthocyanidins in sorghum requires a MYB transcription factor encoded by yellow seed1 (y1), an orthologue of the maize gene pericarp color1 (p1). Maize lines with a functional p1 and flavonoid structural genes do not produce foliar 3-deoxyanthocyanidins in response to fungal ingress. To perform a comparative metabolic analysis of sorghum and maize 3-deoxyanthocyanidin biosynthetic pathways, we developed transgenic maize lines expressing the sorghum y1 gene. In maize, the y1 transgene phenocopied p1-regulated pigment accumulation in the pericarp and cob glumes. LC-MS profiling of fungus-challenged Y1-maize leaves showed induction of 3-deoxyanthocyanidins, specifically luteolinidin. Y1-maize plants also induced constitutive and higher levels of flavonoids in leaves. In response to Colletotrichum graminicola, Y1-maize showed a resistance response.

Graphical Abstract

1. Introduction

Maize (Zea mays L.) is an important cereal crop. In 2013, the total area planted under maize for all purposes in the United States amounted to 95.37 million acres, with about 87.67 million acres for grain production (U.S. Department of Agriculture, National Agricultural Statistics Service). In the field, maize plants frequently encounter a wide variety of pathogens. Anthracnose caused by Colletotrichum graminicola (Ces.) G. W. Wils. and southern corn leaf blight caused by Cochliobolus heterostrophus (Drechsler) are among the most serious fungal diseases that affect productivity.
Application of synthetic fungicides is among the strategies used to control fungal infections, but their cost and environmental impact are a concern for producers and consumers. To prevent further epidemics and reduce the need for synthetic chemicals, there is an ongoing search for crop germplasm with natural resistance [1]. Metabolic engineering of defense-related compounds has proven effective in enhancing plant performance against biotic stress [2,3]. This approach offers an opportunity to either transfer a complete defense-related metabolic pathway or activate a preexisting one by the transfer of genes between distant plant species [4,5].
In maize, the flavonoid pathway gives rise to many defense related compounds such as flavan-4-ols, 3-deoxyanthocyanidins, and C-glycosyl flavones (Figure 1). Flavan-4-ols are the precursors of the brick red phlobaphene pigments that accumulate in mature pericarp and cob glumes. Their biosynthesis requires a functional pericarp color1 (p1) gene, which encodes an R2R3 MYB transcription factor [6,7,8].
We have performed a comparative characterization of the flavonoid pathway in sorghum and maize [9]. These two species are genetically related and are suggested to have diverged from a common ancestor more than 16.5 million years ago [10,11]. The two genomes have a high degree of synteny and sequence similarity [12,13]. The co-linearity between their genomes may suggest a similarity between their metabolic pathways. In fact, sorghum has also been shown to accumulate phlobaphenes in the pericarp under the control of yellow seed1 (y1), an orthologue of maize pericarp color1 [14,15,16]. y1 and p1 activate the transcription of chalcone synthase (chs), chalcone isomerase (chi), and dihydroflavonol reductase (dfr) during biosynthesis of flavan-4-ols in sorghum and maize [7,9,17].
Regardless of the similarities mentioned above, the flavonoid pathways in sorghum and maize exhibit a number of differences. For example, in maize, phlobaphenes are obvious in the floral tissues, husk, and leaf sheath but not in the leaf, whereas in sorghum these compounds appear in all the above mentioned tissues and in the mature leaf [9]. The presence of phlobaphenes in sorghum leaves may indicate that the y1 promoter is active in this tissue. Another difference is the response of these two species to fungal challenges. Sorghum responds to anthracnose and other foliar fungi by the induction of red-brown 3-deoxyanthocyanidin phytoalexins [18]. However, there is no published report that leaves of maize lines carrying a similar set of functional flavonoid regulatory and structural genes synthesize detectable levels of 3-deoxyanthocyanidins either constitutively or induced in response to biotic or abiotic stresses. With the exclusion of chalcone synthase in maize, neither the flavonoid structural nor regulatory genes showed induction after fungal infection [19]. Silks of some maize lines have been reported to accumulate very low levels of luteolinidin under the control of p1 [20].
Figure 1. Schematic representation of the biosynthetic pathway of flavonoid compounds. Enzyme names are (gene names in parentheses): PAL, Phenylalanine ammonia lyase; C4H, Cinnamate-4-hydroxylase; 4CL, 4-coumarate: coenzymeA ligase; C3'H, p-coumarate 3'-hydroxlase; CHS (c2), Chalcone synthase; CHI (chi1), Chalcone isomerase, DFR (a1), Dihydroflavonol reductase; and F3'H, Flavonoid 3'-hydroxylase (pr1). Pathway modeled after [1,21,22,23,24].
Molecules 20 02388 g001
Sorghum 3-deoxyanthocyanidins include apigeninidin, luteolinidin, and their derivatives. Upon fungal challenge, these compounds accumulate around the primary infection sites and prevent further proliferation of the fungus within sorghum tissues [18,25]. These compounds have been shown to inhibit fungal germ tube growth and distort fungal structures. Their potent antifungal activity against Colletotrichum sublineolum, C. graminicola, and C. heterostrophus has been demonstrated [26]. 3-deoxyanthocyanidins have a structure similar to flavan-4-ols and their biosynthesis requires the activity of chs, chi, dfr, and f3'h. The induction of these genes requires a functional y1 gene because y1 mutants are deficient in 3-deoxyanthocyanidins and exhibit symptoms of anthracnose susceptibility [16]. The sequences of y1 and p1 genes have a high level of similarity (92%) in the coding region but very poor similarity in the non-coding regions [9].
We developed transgenic plants to investigate the heterologous expression of sorghum y1 in maize and to test if y1 can induce anthracnose resistance in maize. Our results demonstrate that the y1 transgenes are active in maize tissues. Biochemical analyses established that y1 successfully drives the maize–flavonoid pathway towards production of flavan-4-ols and 3-deoxyanthocyanidins. Transgenic Y1-maize plants were resistant to both C. heterostrophus and C. graminicola; this interaction is the result of the induction of 3-deoxyanthocyanidins.

2. Results and Discussion

2.1. y1 Transgenes Phenocopy p1 Pigmentation Patterns in Maize

Transgenic maize lines expressing a sorghum y1 gene (pY1::Y1) (Figure 2A) exhibited distinct patterns of pericarp and cob glume pigmentation. Three ear pigmentation patterns from independent, representative transformation events and a negative segregant are shown (Figure 2B). The pericarp and cob glume pigmentation patterns described here are based on the nomenclature of the maize p1 alleles [27]. Transgenic events were divided into four classes based on their ear phenotypes: Y1-rr (red pericarp, red cob glumes); Y1-pr (patterned pericarp, red cob glumes); Y1-wr (white pericarp, red cob glumes); and y1-ww (white pericarp, white cob glumes). Sibling maize plants were genotyped using y1 gene specific primers; those lacking the transgene and showing a susceptible response against BASTA herbicide exhibited a white pericarp and white cob glume phenotype (y1-ww). These negative segregants (NS) represented similar genetic background to Y1 transgenic events and thus were used as controls throughout this study.
Unlike the maize p1 gene, the sorghum y1 gene induced accumulation of phlobaphenes in the husk and tassel glumes of the three functional categories of transgenic events (Y1-maize). Apart from the accumulation of phlobaphenes in floral tissues, an orange pigment was also observed in the leaf midrib in Y1-maize. The mid-rib pigmentation appeared at the three-leaf stage of plant growth and persisted through the maturation of the plant. Additionally, the silk tissue of Y1-maize plants showed a rapid “silk-browning” phenotype at the cut ends or upon injury. The silk browning phenotype is thus under the control of the y1 transgene and is similar to the one produced by p1 and p2 genes in maize [28]. In Y1-maize, this phenotype is more intense compared to the one observed with the endogenous p1 alleles (see Figure 2B). These distinct phenotypes produced by Y1-maize were stably inherited across seven generations. To further confirm if y1 regulated phenotypes are the result of the activation of flavonoid structural genes in transgenic maize, expression of the y1 transcription factor and four marker genes was assayed: chalcone synthase (c2), chalcone isomerase (chi) dihydroflavonol reductase (a1), and flavonoid 3'-hydroxylase (pr1). Pericarp tissues of the Y1-rr and Y1-pr transgenic events showed induction of c2, a1, and pr1, and upregulation of chi flavonoid structural genes and the y1 transcription factor in Y1-maize while tissue obtained from their respective NS plants showed no detectable expression by RT-PCR (Figure 2C). Overall our phenotypic and gene expression data demonstrated that the sorghum y1 gene can target maize flavonoid structural genes and either induce or upregulate the flavonoid biosynthetic pathway in maize floral and vegetative tissues.
Figure 2. Characterization of y1 transgenes. (A) Structural features of the sorghum y1 gene. The gray box represents the upstream regulatory region. The bent arrow indicates the transcription start site. Solid boxes correspond to exons that are joined by angled lines representing introns. The restriction enzyme sites shown are: H, HindIII; K, KpnI; SL, SalI; SC, ScaI. Illustration not drawn to scale. (B) Sorghum y1 gene-induced pigmentation phenotypes in transgenic Y1-maize. Three y1 transgenic events representing Y1-rr, Y1-pr and Y1-wr were characterized for ear, husk, tassel glumes, leaf mid-rib, and silk browning phenotypes. Comparable controls included are: plants segregating for the absence of y1 transgene shown as negative segregant (NS) and native p1 expressing alleles P1-rr and P1-wr and HII (from A188 X B73), used for transformation. (C) Sorghum y1 gene induces flavonoid structural genes in Y1-maize. The expression of the y1 transgene and four flavonoid structural genes relative to the housekeeping gene glyceraldehyde phosphate dehydrogenase was assayed using RT-PCR. Expression was tested in the pericarp tissues of the Y1-rr and Y1-pr transgenes and their respective negative segregants (Y1-rr and Y1-pr). c2: chalcone synthase, chi: chalcone isomerase, a1: dihydroflavonol reductase, pr1: flavonoid 3'-hydroxylase, gapdh: glyceraldehyde phosphate dehydrogenase.
Molecules 20 02388 g002

2.2. y1 Regulates Accumulation of 3-Deoxyflavonoids (flavan-4-ols) in Maize

In sorghum, y1 has been shown to be required for the biosynthesis of flavan-4-ols or 3-deoxyflavonoid compounds that are precursors to the phlobaphenes [9]. To investigate the effect of y1 on the flavonoid pathway in maize, we assayed flavan-4-ol accumulation in the pericarp, cob glumes, silks, and leaves (see Figure S1). Spectral results indicated the presence of flavan-4-ols with an absorption maximum of 564 nm. Quantitative measurement of total flavonoids in the leaf showed significantly higher accumulation in Y1-rr and Y1-pr as compared to Y1-wr (p = 0.0039 and p = 0.0152, respectively) and the endogenous p1 alleles (p ≤ 0.01, Figure 3A). The high level of flavonoid compounds in the two y1 transgenes could be due to the accumulation of flavonoid pathway intermediates such as chalcone and naringenin or novel compounds produced by the activity of maize enzymes induced by an active y1.
Figure 3. Sorghum y1 gene induces accumulation of flavonoid compounds in transgenic maize leaves. Y1-rr, Y1-pr, and Y1-wr are independent transgenic events; NS, Negative segregant; P1-rr and P1-wr, maize lines carrying endogenous p1 alleles. Values shown are mean ± SE. (A) Total flavonoids expressed as catechin equivalents; (B) Flavan-4-ols expressed as absorbance at 550 nm.
Molecules 20 02388 g003
To further identify compounds regulated by the y1 gene, we surveyed the leaves of Y1-maize plants for the presence of flavonoid precursors that give rise to either phlobaphenes or anthocyanins. The acid-butanol extracts were boiled to differentiate between flavan-4-ols and flavan-3,4-diols. In maize, flavan-4-ols (3-deoxyflavonoids) give rise to flavylium cations that have a λmax of 564 nm and are heat labile, while flavylium cations obtained from the flavan-3,4-diol (3-hydroxyflavonoids)-derived compounds exhibit a λmax of 533 nm and are unaffected by boiling [21,29]. Our results revealed that the Y1-maize extracts exhibited a major peak at 564 nm, which disappeared upon boiling, confirming the presence of flavan-4-ols (See Supplemental Figure S1). Quantification of flavan-4-ols in leaf tissue revealed that Y1-rr and Y1-pr transgenic events had significantly higher levels of these compounds as compared to the endogenous p1 alleles and NS (p < 0.0001). Although Y1-wr transgenics accumulated significant levels of flavan-4-ols compared to the NS and P1-wr [B73] (p = 0.0178 and p = 0.0008 respectively), they did not significantly differ from the P1-rr allele (p = 0.1692) in this trait (Figure 3B).
Figure 4. Sorghum y1 gene enhances resistance against C. heterostrophus and C. graminicola in Y1-maize. (A) Detached leaf assay showing disease symptoms that developed 4 days post infection (dpi) when infected with C. heterostrophus. (i) Y1-rr; (ii) Y1-pr; (iii) Y1-wr; (iv) NS; (v) P1-wr; (vi) un-inoculated Y1-pr. Scale bar indicates 1 mm. (B) Quantification of the lesion area 4 dpi with C. heterostrophus. Values shown are the mean ± SE. (C) Symptoms that developed 11 dpi when whole plants were infected with C. graminicola. (D) Quantification of lesion area 11 dpi with C. graminicola. Values shown are the mean of 44 replicates ± SE. The x-axis in Figure 4A,C shows different genotypes used: Y1-rr, Y1-pr, Y1-wr; NS and P1-wr.
Molecules 20 02388 g004

2.3. Y1-Maize Exhibits Enhanced Resistance to C. heterostrophus and C. graminicola

In sorghum, a functional y1 gene is required for resistance against C. sublineolum [16]. To test the response of Y1-maize to fungal challenges, plants were infected with either C. heterostrophus or C. graminicola. We compared the response of Y1-maize plants to both NS and P1-wr. When infected with C. heterostrophus, the inoculated leaves of Y1-maize plants produced a reduced number of chlorotic lesions compared to the control genotypes (Figure 4A). In different Y1- maize events, the mean values of the infected area ranged from 4% to 16% (Figure 4B). In contrast, these lesions were spread over about 40% and 62% of the leaf area in NS and P1-wr genotypes, respectively. These results indicate that the disease severity was significantly reduced in Y1-maize plants compared to the control genotypes (p < 0.01). Similarly, when entire plants were infected with C. graminicola, we found that the two transgenic maize lines (Y1-rr and Y1-pr) were more resistant, with averages of only 24%–29% of the leaf covered in lesions compared to the NS and P1-wr, which had 34% and 83% lesion area, respectively (p < 0.05) (Figure 4C,D).

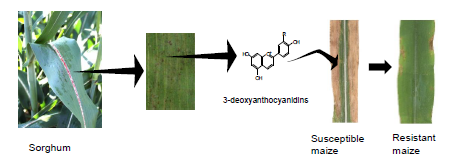
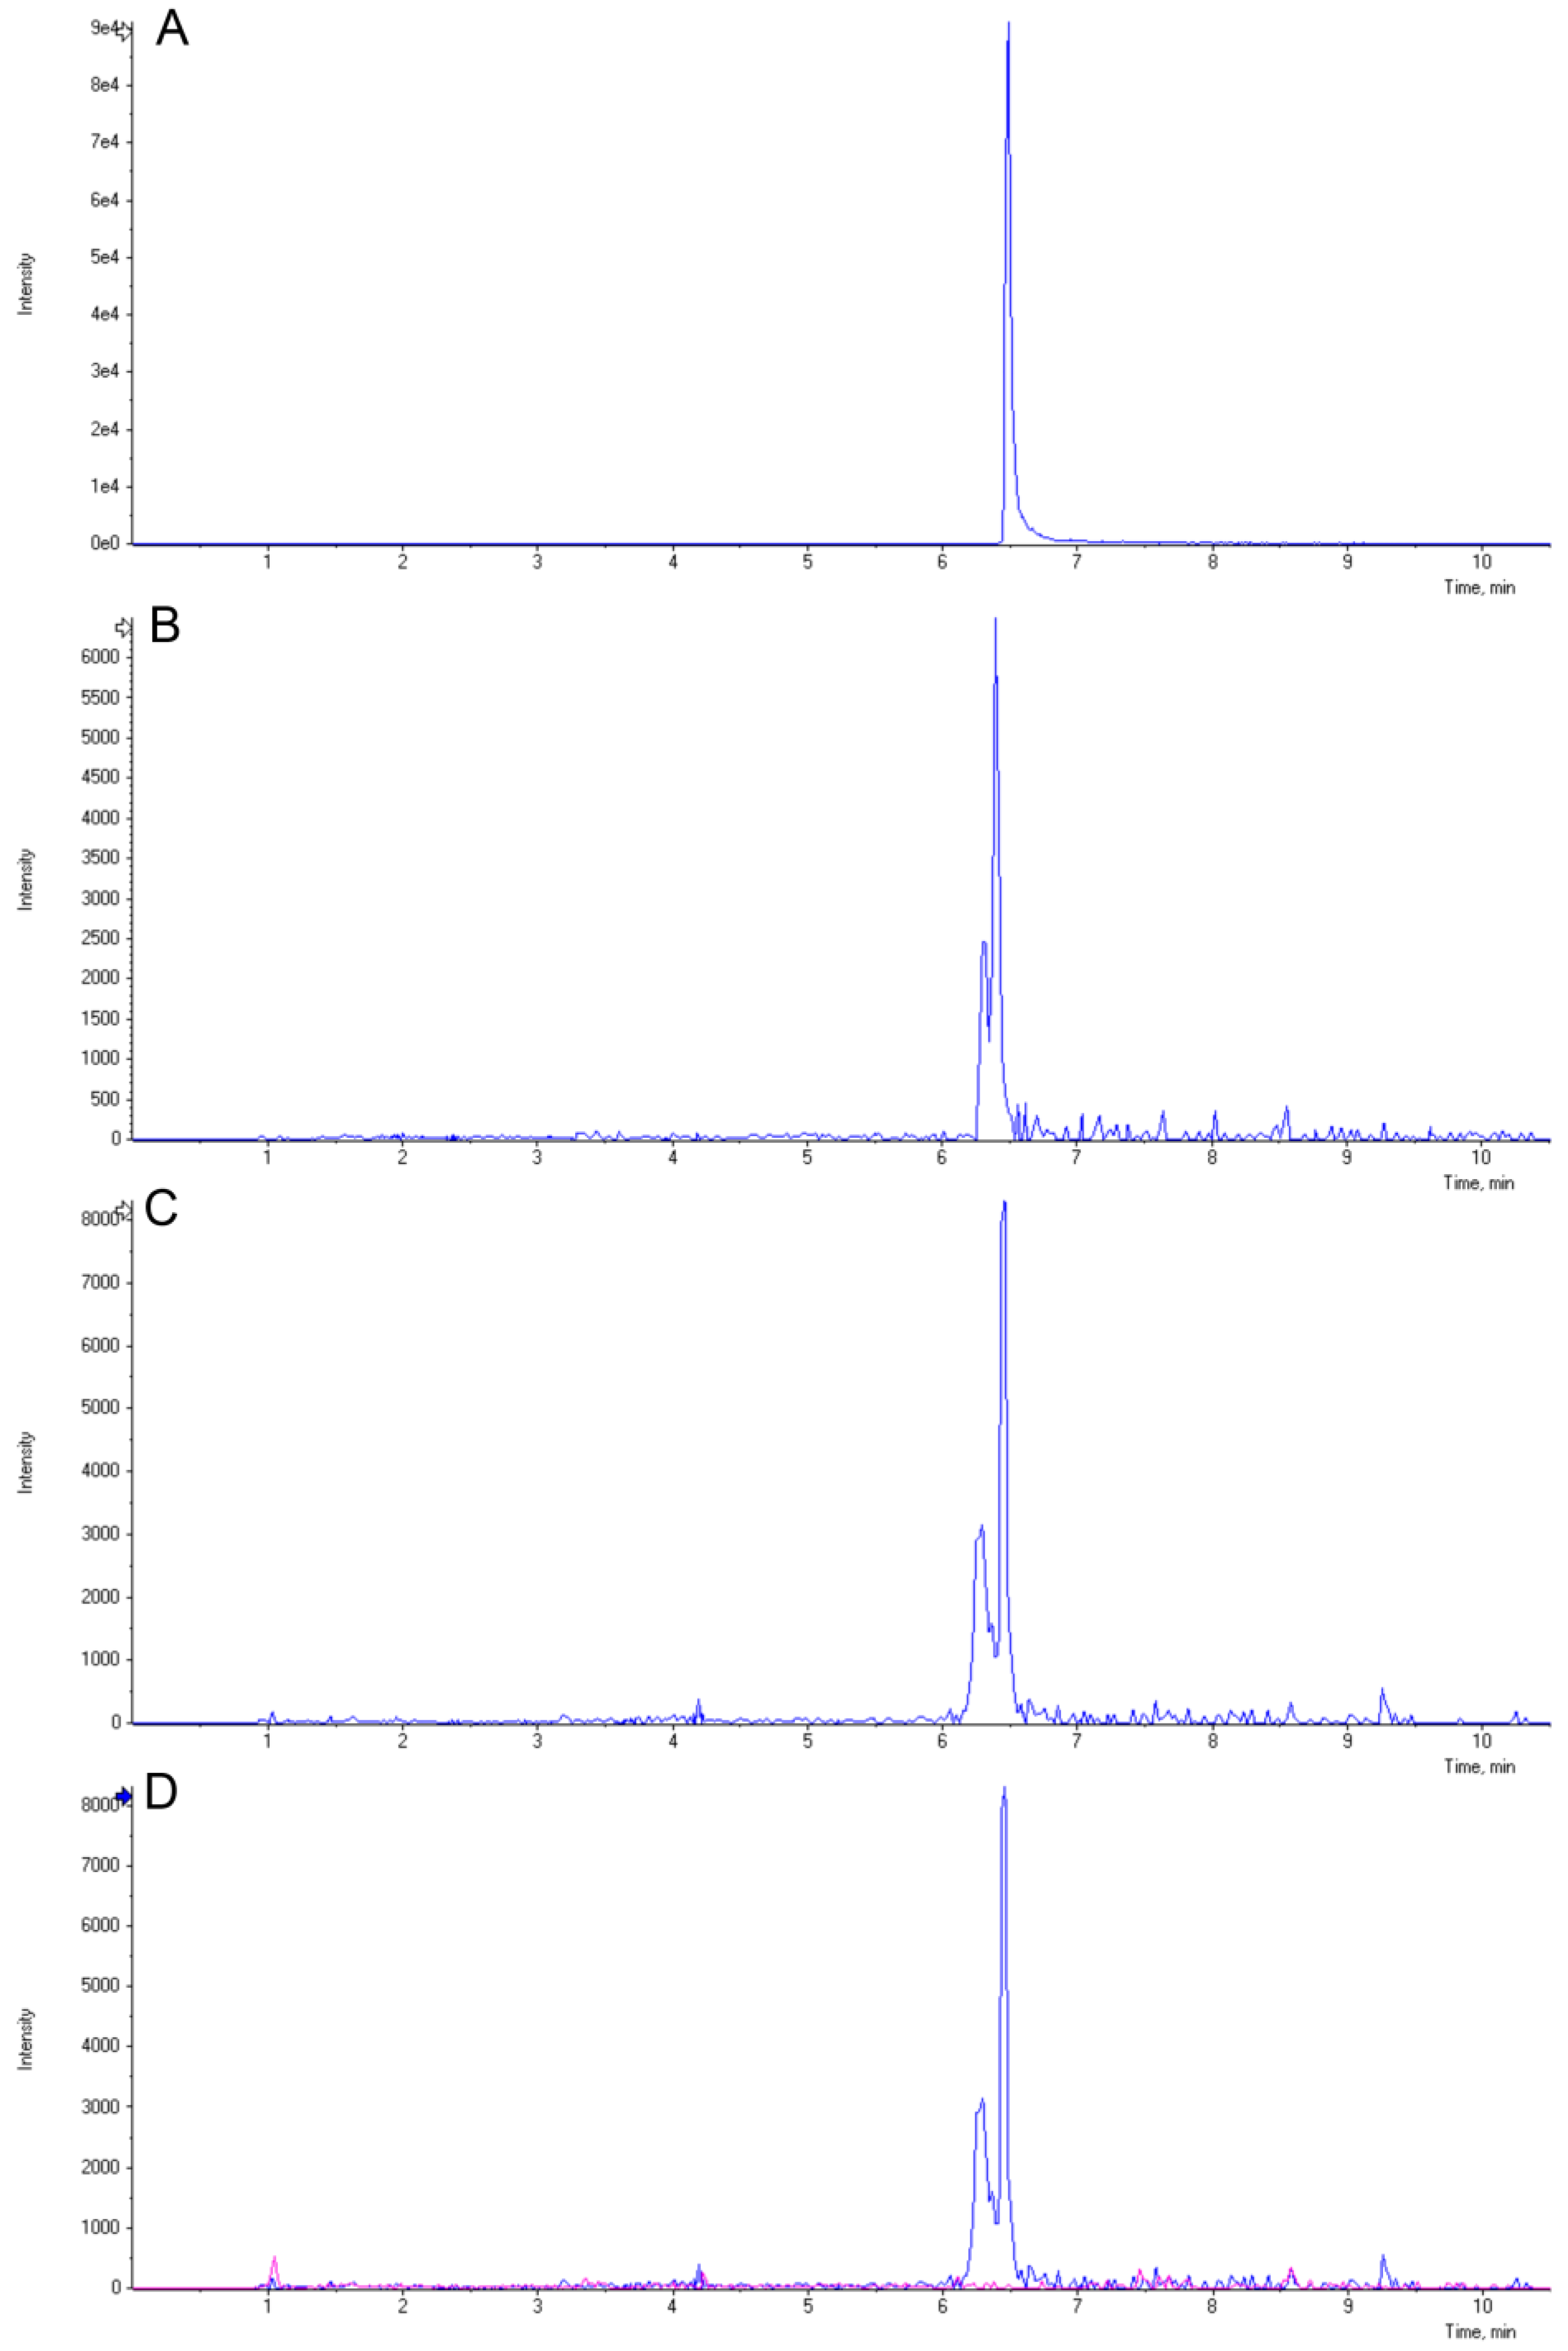
2.4. Induction of 3-Deoxyanthocyanidins during Y1-Maize–C. graminicola Interaction

Transgenic maize plants carrying the sorghum Y1 gene were shown to be more resistant to the foliar pathogens C. graminicola and C. heterostrophus relative to the NS. In sorghum, resistance to foliar pathogens is in part due to the induced biosynthesis of 3-deoxyanthocyanidins [16]. Similarly, the resistant phenotype relative to the NS may be due to the biosynthesis of these novel compounds driven by the Y1 gene in maize. Extracts obtained from infected leaves were analyzed using LC-MS to identify these compounds. The m/z ratios and elution times of peaks similar to those of apigeninidin and luteolinidin were scrutinized. Chromatograms obtained from the Y1 transgenes Y1-rr and Y1-pr indicated novel peaks eluting with a retention time and m/z ratio similar to luteolinidin (271.060) compared to the NS (Figure 5), though no peaks were indicative of apigeninidin.

2.5. Discussion

In the current study, the activity of the sorghum y1 gene was tested as a transgene in maize. First, our results established that, similar to P1, the Y1 protein is able to activate the same suite of known maize flavonoid genes, resulting in maize-like phlobaphene accumulation patterns in seed pericarp and cob glumes. In addition, the y1 gene also induced the biosynthesis of flavan-4-ols in maize leaves, a property that has not been reported for maize lines expressing P1-rr or P1-wr [27,30]. The presence of flavan-4-ols in these leaves suggests that y1 behaves in maize as it does in sorghum and actively interacts with the promoters of flavonoid genes to drive the pathway towards the production of these flavonoid compounds in the maize leaf. In Y1-maize, we observed phlobaphenes in the mature leaf tissue, which suggests that, like sorghum, the polymerization of flavan-4-ols to phlobaphenes can occur as also documented in the case of a maize mutant Unstable factor for orange1 (Ufo1) [31,32]. Thus, the absence of flavan-4-ols and phlobaphenes in maize leaves containing active endogenous p1 alleles could be due to poor activity of the p1 or the inability of P1 to activate transcription of flavonoid structural genes in leaves [27,28,30]. The biochemical analysis of the Y1-maize leaves revealed that Y1 induced significant accumulation of flavan-4-ols and flavonoids to levels that are not commonly found in maize lines. This further establishes that the y1 promoter is active in maize leaves.
The Y1-maize plants showed enhanced resistance against C. graminicola and C. heterostrophus. LC-MS profiling of induced flavonoids showed the presence of 3-deoxyanthocyanidin phytoalexins, specifically luteolinidin. In addition to luteolinidin, a second unknown small peak is observed in Y1-maize, which is absent from the NS profile. The improved disease resistance of Y1-maize plants is thus due to the induced 3-deoxyanthocyanidins as well as higher levels of pre-formed flavonoids, especially flavan-4-ols, which are known to contribute to plant defense [33]. Flavan-4-ols have also been suggested as putative precursors of 3-deoxyanthocyanidins [6,17,21,34,35,36,37]. Sorghum grains and leaves with higher levels of flavan-4-ols exhibited better resistance against mold compared to those that were deficient [38,39,40]. Flavan-4-ols include two main compounds—luteoforol and apiforol. Luteoforol has been demonstrated to have potent biocidal effects against many fungi and bacteria, including C. graminicola [41]. This antimicrobial activity might justify its presence in the epidermal cells of pericarp, silk, husk, and leaves. In fact, a mechanism describing the release of flavan-4-ols from their intracellular compartments to the sites of pathogen infection, similar to that of sorghum 3-deoxyanthocyanidins, has been proposed [18,25,41]. Although we were able to identify luteolinidin, we did not detect any apigeninidin, possibly due to a very active flavonoid 3′-hydroxylase, which converts apigeninidin to luteolinidin [23,42].
Figure 5. Induction of 3-deoxyanthocyanidins and their derivatives in Y1-maize. LC-MS chromatograms obtained from the luteolinidin standard (A), infected leaves of Y1-rr ((B,C) representing two biological replicates), and an overlay (D) of Y1-rr (sample B; blue trace) and NS (pink trace) are presented for comparison. The m/z values of the extracted chromatograms were similar to those of the luteolinidin standard (271.060).
Molecules 20 02388 g005
Induction of phenylpropanoids in maize cell suspensions after transformation with the p1 transgene has been reported [21,24,43]. These, along with our current results, demonstrate that p1 and y1 transgenes play similar regulatory roles in the phenylpropanoid pathway in maize. However, the basis of this mechanism is not yet clear. One possibility is that the R2R3 MYB protein products of p1 and y1 genes might interact directly with structural genes in the phenylpropanoid pathway to secure the efficient flow of intermediates between the phenylpropanoids and flavonoids. In fact, in BMS maize cells, the p1 transgene induced the expression of pal1, which controls the flow of the amino acid phenylalanine into the phenylpropanoid pathway [43]. Since y1 and p1 are known to regulate flavonoid biosynthesis downstream of chalcone, it is also possible that these transcription factors may interfere with feedback regulation controlling the activity of enzymes working in other branches of the phenylpropanoid pathway [21,32,44,45,46]. Thus future exploitation of y1, an R2R3 MYB regulatory gene, to produce desirable biopesticides is a viable strategy [2,47,48,49,50].

3. Experimental Section

3.1. Maize Genetic Stocks

Maize genetic stocks of inbred lines 4co 63 (p1-ww) and B73 (P1-wr) were obtained from Maize Genetic Coop Center, USDA, Urbana-Champaign, IL, USA. Genetics stocks carrying p1 alleles P1-rr 4B2, P1-ww-1112 and p-del2 were obtained from Thomas Peterson, Iowa State University, Ames, IA, USA.

3.2. Transgene Constructs

All plasmids used in this study were developed based on the pBluescript II vector (Stratagene, La Jolla, CA, USA). The plasmid pY1::Y1 contains 9164 bp of the y1 gene [AY860968 [16]], which includes the 2375 bp of the 5' regulatory region, 6946 bp sequence with three exons and two introns, and 820 bp of the 3′UTR. This plasmid was prepared by ligating the HindIII-KpnI DNA fragment of the Y1-rr gene into a pBluescript II vector.

3.3. Tissue Culture, Transformation, and Regeneration of Transgenic Maize Plants

We used maize HiII line as a transgene recipient because it carries a non-functional p1 allele. HiII was developed from a cross between A188 × B73 [51]. Immature zygotic embryos derived from the HiII maize [52] were used to develop friable embryogenic type II calli. Callus induction, maintenance, and transformation were carried out according to a previously described protocol at the Plant Transformation Facility at Iowa State University [53]. A plasmid carrying the BAR gene for Bialphos herbicide tolerance was co-bombarded, along with the pY1:Y1 construct. A total of 16 pY1:Y1 independent transformation events were generated from calli resistant to the herbicide Bialphos (BASTA™, AgrEvo, Wilimington, DE, USA). The selection for transgenic plants in T1 and subsequent generations was based on herbicide resistance as well as PCR analysis, using y1 specific gene primers. The transgenic plants were maintained in a hemizygous state by out-crossing with pollen from the inbred line 4Co63 that carries a p1-ww allele (null p1 allele). Progenies derived from such crosses always segregated in a 1:1 ratio, indicating stable expression patterns of the transgenic plants included in this study. All maize plants carrying pY1::Y1 transgenes exhibited normal growth and morphology when compared with the sibling negative segregant (NS) maize plants.

3.4. Expression Analysis of Genes Induced by y1

Total RNA was extracted from pericarp 18 days after pollination (dap) by RNAzolRT (Molecular Research Center Inc., Cincinnati, OH, USA) and used to synthesize first strand cDNA using the High-Capacity cDNA Reverse Transcription Kit (Applied Biosystems, Foster City, CA, USA). PCR using primers specific to flavonoid pathway genes was used to determine the expression of said genes: yellow seed 1 (y1): RT_PWREx_2F (5'-TCCGGTGCGGCAAGAG-3') and RT_PWREx_2R (5'-GGAGCTTGATGATGATGTCTTCTTC-3'); chalcone synthase (c2): CHSF (5'-TCGATCGGTCTCTCTGGTACAACGTA-3') and CHSR (5'-TACATCATGAGGCGGTTCACGGA-3'); chalcone isomerase (chi1): CHIF (5'-GTGCGGAATTTAACATGGCGTGC-3') and CHIR (5'-CGGCGCGAAAGTCTCTGGCTT-3'); flavonoid 3'-hydroxylase (pr1): 5F3H-F2 (5'-GAGCACGTGGCGTACAACTA-3') and ZMR4 (5'-AAACGTCTCCTTGATCACCGC-3'); dihydroflavonol reductase (a1): A1 (5'-CAATTCGTTGAACATGGAAGTAAG-3') and A2 (5'-CAATTCGTTGAACATGGAAGTAAG-3') and glyceraldehyde 3-phosphate dehydrogenase (gapdh): GAP1 (5'-AGGGTGGTGCCAAGAAGGTTG-3') and GAP2 (5'-GTAGCCCCACTCGTTGTCGTA-3').

3.5. Tissue Collection for Chemical Analyses

All tissues used for chemical analyses were collected at the specified time, flash frozen in liquid nitrogen and either lyophilized or stored at −80 °C. All analyses were performed on three independent sample replicates.

3.6. Quantification of Total Flavonoids and Flavan-4-ols

All biochemical analyses were carried out on the second leaf above the primary ear of greenhouse grown plants collected at the time of pollination. For total flavonoid quantification, ground tissue (20 mg) was washed three times in ether to remove waxes and chlorophyll pigments and then extracted three times under sonication in 70% acetone supplemented with 1 mM ascorbic acid. The supernatant was collected and acetone was evaporated using a speed vacuum drier. The extract was used for determination of total flavonoids [54]. The extracts were diluted with 1 M NaOH and the absorbance was recorded at 510 nm using a SpectraMAX 190 plate reader (Molecular Devices Corp., Sunnyvale, CA, USA). Total flavonoid content was expressed as mg catechin equivalent g−1 dry weight.
To quantify flavan-4-ols, 30 mg ground leaf tissue was washed in ether and suspended in 500 µL of HCl:butanol (3:7). The homogenate was incubated at 37 °C for 1 h, followed by centrifugation at 20,000 g for 10 min. The absorbance of the supernatant was recorded at 550 nm using an UV mini-1240 spectrophotometer (Shimadzu Scientific Instruments, Inc. Columbia, MD, USA). The flavan-4-ols were expressed as the relative concentration of flavylium ions [21].

3.7. Evaluation of Y1-Transgenic Plants for Resistance to Cochliobolus heterostrophus and Colletotrichum graminicola

Resistance to southern corn leaf blight caused by C. heterostrophus was evaluated using the detached leaf assay [55]. C. heterostrophus was grown on potato dextrose agar (PDA) under continuous light at room temperature for ten days. Conidia were collected in 0.001% Tween 20. The second leaf above the primary ear was collected 15 days after pollination (dap). Leaf discs were prepared from both sides of the midrib and those on the left side were used as controls. Discs with adaxial surface facing upward were placed on water agar (1% w/v) supplemented with 2 mg·L−1 kinetin. Whatman filter papers soaked in either a spore suspension of C. heterostrophus (105 spores·mL−1) or 0.001% Tween 20 for the control were placed on the leaf discs. Plates were incubated under illumination at 28 °C. The filter paper discs were removed after 24 h and plates were kept under the same conditions until collection. The disease phenotypes of the pY1:Y1 transgenic plants and control genotypes were recorded using a dissection microscope (Nikon SMZ1000) connected to a Nikon digital camera (DXM1200F). Disease severity was quantified as described below.
To test the role of y1 in resistance to anthracnose leaf blight, four- to six-week-old greenhouse-grown plants were inoculated and disease was quantified using C. graminicola as described previously [16].

3.8. Image Analysis for Evaluation of Disease Response

For quantitative analysis, images were processed by Automated Lesion Extraction using algorithms (PhenoPhyte) developed for a visual phenotype database [42]. This technique depends on differentiating the lesion pixels (foreground) from the healthy ones (background) and measuring the area of lesions. The percentage of the infected area was used to evaluate disease severity.

3.9. LC-MS Analysis of 3-Deoxyanthocyanidins

Flag leaves of field-grown plants were used to identify compounds induced in response to C. graminicola infection, using the detached leaf assay as described above and harvested for analysis 3 dpi. Infections were carried out in triplicate for each genotype, each of which consisted of three individual leaves. Tissue samples (~100 mg) were extracted in 2 mL of 2 N HCl by boiling for 40 min, then centrifuged at 20,000 g for 15 min. The resulting supernatant was extracted twice in 1 mL of isoamyl alcohol, which was evaporated to dryness and re-suspended in 250 µL of methanol supplemented with 0.1% HCl [56]. Extracts (5 µL) were separated by reverse phase HPLC using a Prominence 20 UFLCXR system (Shimadzu, Columbia, MD, USA) with a Waters BEH C18 column (100 × 2.1 mm, 1.7 µm particle size) and a 20 min aqueous/acetonitrile gradient, at a flow rate of 250 µL/min. Solvent A was water with 0.1% formic acid, and Solvent B was acetonitrile with 0.1% formic acid. The initial conditions were 97% A and 3% B, increasing to 45% B at 10 min and 75% B at 12 min, then held at 75% B until 17.5 min before returning to the initial conditions at 18 min. The eluate was delivered into the 5600 (QTOF) TripleTOF using a Duospray™ ion source (all AB Sciex, Framingham, MA, USA), samples were analyzed in positive ion mode, and the mass spectrometer was operated in IDA (Information Dependent Acquisition) mode with a 100 m survey scan from 50 to 1250 m/z, and up to 10 MS/MS product ion scans per duty cycle. The survey scan data was used to generate the extracted ion chromatographs with PeakView software package (AB Sciex, Framingham, MA, USA).

4. Conclusions

We engineered 3-deoxyanthocyanidin phytoalexins in maize by transforming it with a sorghum transcription factor, yellow seed 1 (y1). In maize, Y1 expression drives the biosynthesis of foliar flavonoid compounds, especially flavan-4-ols. Furthermore, fungal infection resulted in the induction of luteolinidin, which is a potent antifungal compound. We believe the preformed flavan-4-ols, in addition to the induced luteolinidin, contributed to increased resistance of the transgenic maize compared to the near-isogenic non-transgenic lines. The introduction of y1 is thus a viable strategy for introducing anthracnose resistance to maize lines carrying the downstream flavonoid pathway structural genes.

Supplementary Materials

Supplementary materials can be accessed at: https://www.mdpi.com/1420-3049/20/02/2388/s1.

Acknowledgments

We thank Scott Harkcom and Penn State Agronomy farm staff for assistance with field preparation and tending the summer crops, Scott Diloreto for greenhouse maintenance, German Sandoya for his advice for statistical analyses, Nur Suhada Abu Bakar for plant disease assays, Maurice Snook for HPLC analyses, and Kameron Wittmeyer for his critical review of the manuscript. Farag Ibraheem received a graduate fellowship from the Egyptian Government, and Qixian Tan was supported by a graduate assistantship from the Plant Science Department, Penn State University. This work was supported by a NIFA-AFRI competitive grant award 2011-67009-30017 and Hatch projects 4452 and 4430 to SC. LC-MS was performed with the support of the Metabolomics Core Facility at Penn State using 5600 (QTOF) TripleTOF instrumentation funded by a grant from NSF MRI 1126373.

Author Contributions

S.C., F.I., and I.G. designed the experiments; F.I., I.G., and Q.T. performed the experiments; C-R.S. analyzed the disease lesion data; F.I., I.G., C-R.S. and S.C. wrote the paper. All authors discussed, edited and approved the final manuscript.

Conflicts of Interest

The authors declare no conflicts of interest.

References

  1. Winkel-Shirley, B. Flavonoid biosynthesis. A colorful model for genetics, biochemistry, cell biology, and biotechnology. Plant Physiol. 2001, 126, 485–493. [Google Scholar] [CrossRef] [PubMed]
  2. Dixon, R.A.; Liu, C.; Jun, J.H. Metabolic engineering of anthocyanins and condensed tannins in plants. Curr. Opin. Biotechnol. 2013, 24, 329–335. [Google Scholar] [CrossRef] [PubMed]
  3. Verpoorte, R.; Memelink, J. Engineering secondary metabolite production in plants. Curr. Opin. Biotechnol. 2002, 13, 181–187. [Google Scholar] [CrossRef] [PubMed]
  4. Kristensen, C.; Morant, M.; Olsen, C.E.; Ekstrøm, C.T.; Galbraith, D.W.; Møller, B.L.; Bak, S. Metabolic engineering of dhurrin in transgenic arabidopsis plants with marginal inadvertent effects on the metabolome and transcriptome. Proc. Natl. Acad. Sci. USA 2005, 102, 1779–1784. [Google Scholar] [CrossRef] [PubMed]
  5. Tattersall, D.B.; Bak, S.; Jones, P.R.; Olsen, C.E.; Nielsen, J.K.; Hansen, M.L.; Høj, P.B.; Møller, B.L. Resistance to an herbivore through engineered cyanogenic glucoside synthesis. Science 2001, 293, 1826–1828. [Google Scholar] [CrossRef] [PubMed]
  6. Styles, E.D.; Ceska, O. Pericarp flavonoids in genetic strains of zea mays. Maydica 1989, 34, 227–237. [Google Scholar]
  7. Grotewold, E.; Drummond, B.J.; Bowen, B.; Peterson, T. The myb-homologous p gene controls phlobaphene pigmentation in maize floral organs by directly activating a flavonoid biosynthetic gene subset. Cell 1994, 76, 543–553. [Google Scholar] [CrossRef] [PubMed]
  8. Morohashi, K.; Casas, M.I.; Ferreyra, L.F.; Mejía-Guerra, M.K.; Pourcel, L.; Yilmaz, A.; Feller, A.; Carvalho, B.; Emiliani, J.; Rodriguez, E.; et al. A genome-wide regulatory framework identifies maize pericarp color1 controlled genes. Plant Cell 2012, 24, 2745–2764. [Google Scholar] [CrossRef] [PubMed]
  9. Boddu, J.; Jiang, C.H.; Sangar, V.; Olson, T.; Peterson, T.; Chopra, S. Comparative structural and functional characterization of sorghum and maize duplications containing orthologous myb transcription regulators of 3-deoxyflavonoid biosynthesis. Plant Mol. Biol. 2006, 60, 185–199. [Google Scholar] [CrossRef] [PubMed]
  10. Bennetzen, J.L.; Freeling, M. The unified grass genome: Synergy in synteny. Genome Res. 1997, 7, 301–306. [Google Scholar] [PubMed]
  11. Gaut, B.S.; le Thierry d’Ennequin, M.; Peek, A.S.; Sawkins, M.C. Maize as a model for the evolution of plant nuclear genomes. Proc. Natl. Acad. Sci. USA 2000, 97, 7008–7015. [Google Scholar] [CrossRef] [PubMed]
  12. Devos, K.M.; Gale, M. Genome relationships: The grass model in current research. Plant Cell 2000, 12, 637–646. [Google Scholar] [CrossRef] [PubMed]
  13. Melake-Berhan, A.; Hurber, S.H.; Butler, L.G.; Bennetzen, J.L. Structure and evolution of the genome of sorghum bicolor and zea mays. Theor. Appl. Genet. 1993, 86, 598–604. [Google Scholar] [CrossRef] [PubMed]
  14. Zanta, C.A.; Yang, X.; Axtell, J.D.; Bennetzen, J.L. The candystripe locus, y-cs, determines mutable pigmentation of the sorghum leaf, flower, and pericarp. J. Hered. 1994, 85, 23–29. [Google Scholar]
  15. Chopra, S.; Brendel, V.; Zhang, J.B.; Axtell, J.D.; Peterson, T. Molecular characterization of a mutable pigmentation phenotype and isolation of the first active transposable element from sorghum bicolor. Proc. Natl. Acad. Sci. USA 1999, 96, 15330–15335. [Google Scholar] [CrossRef] [PubMed]
  16. Ibraheem, F.; Gaffoor, I.; Chopra, S. Flavonoid phytoalexin dependent resistance to anthracnose leaf blight requires a functional yellow seed1 in sorghum bicolor. Genetics 2010, 184, 915–926. [Google Scholar] [CrossRef] [PubMed]
  17. Chopra, S.; Gevens, A.; Svabek, C.; Wood, K.V.; Peterson, T.; Nicholson, R.L. Excision of the candystripe1 transposon from a hyper-mutable y1-cs allele shows that the sorghum y1 gene controls the biosynthesis of both 3-deoxyanthocyanidin phytoalexins and phlobaphene pigments. Physiol. Mol. Plant Pathol. 2002, 60, 321–330. [Google Scholar] [CrossRef]
  18. Snyder, B.A.; Nicholson, R.L. Synthesis of phytoalexins in sorghum as a site-specific response to fungal ingress. Science 1990, 248, 1637–1639. [Google Scholar] [CrossRef] [PubMed]
  19. Hipskind, J.D.; Nicholson, R.L.; Goldsbrough, P.B. Isolation of a cdna encoding a novel leucine-rich repeat motif from Sorghum bicolor inoculated with fungi. Mol. Plant-Microbe Interact. 1996, 9, 819–825. [Google Scholar] [CrossRef] [PubMed]
  20. McMullen, M.D.; Snook, M.; Lee, E.A.; Byrne, P.F.; Kross, H.; Musket, T.A.; Houchins, K.; Coe, E.H., Jr. The biological basis of epistasis between quantitative trait loci for flavone and 3-deoxyanthocyanin synthesis in maize (Zea mays L.). Genome 2001, 44, 667–676. [Google Scholar] [CrossRef] [PubMed]
  21. Grotewold, E.; Chamberlin, M.; Snook, M.; Siame, B.; Butler, L.; Swenson, J.; Maddock, S.; Clair, G.S.; Bowen, B. Engineering secondary metabolism in maize cells by ectopic expression of transcription factors. Plant Cell 1998, 10, 721–740. [Google Scholar] [PubMed]
  22. McMullen, M.D.; Kross, H.; Snook, M.E.; Cortes-Cruz, M.; Houchins, K.E.; Musket, T.A.; Coe, E.H. Salmon silk genes contribute to the elucidation of the flavone pathway in maize (Zea mays L.). J. Hered. 2004, 95, 225–233. [Google Scholar] [CrossRef] [PubMed]
  23. Sharma, M.; Chai, C.; Morohashi, K.; Grotewold, E.; Snook, M.E.; Chopra, S. Expression of flavonoid 3′-hydroxylase is controlled by p1, the regulator of 3-deoxyflavonoid biosynthesis in maize. BMC Plant Biol. 2012, 12, 196. [Google Scholar] [CrossRef] [PubMed]
  24. Zhang, P.; Wang, Y.; Zhang, J.; Maddock, S.; Snook, M.; Peterson, T. A maize qtl for silk maysin levels contains duplicated myb-homologous genes which jointly regulate flavone biosynthesis. Plant Mol. Biol. 2003, 52, 1–15. [Google Scholar] [CrossRef] [PubMed]
  25. Nicholson, R.L.; Kollipara, S.S.; Vincent, J.R.; Lyons, P.C.; Cadena-Gomez, G. Phytoalexin synthesis by the sorghum mesocotyl in response to infection by pathogenic and nonpathogenic fungi. Proc. Natl. Acad. Sci. USA 1987, 84, 5520–5524. [Google Scholar] [CrossRef] [PubMed]
  26. Bate-Smith, E.C. Luteoforol (3',4,4',5,7-pentahydroxyflavan) in Sorghum vulgare L. Phytochemistry 1969, 8, 1803–1810. [Google Scholar] [CrossRef]
  27. Chopra, S.; Athma, P.; Peterson, T. Alleles of the maize p gene with distinct tissue specificities encode myb-homologous proteins with c-terminal replacements. Plant Cell 1996, 8, 1149–1158. [Google Scholar] [CrossRef] [PubMed]
  28. Zhang, P.; Chopra, S.; Peterson, T. A segmental gene duplication generated differentially expressed myb-homologous genes in maize. Plant Cell 2000, 12, 2311–2322. [Google Scholar] [CrossRef] [PubMed]
  29. Boddu, J.; Svabek, C.; Ibraheem, F.; Jones, A.D.; Chopra, S. Characterization of a deletion allele of a sorghum myb gene, yellow seed1 showing loss of 3-deoxyflavonoids. Plant Sci. 2005, 169, 542–552. [Google Scholar] [CrossRef]
  30. Cocciolone, S.M.; Nettleton, D.; Snook, M.; Peterson, T. Transformation of maize with the p1 transcription factor directs production of silk maysin, a corn earworm resistance factor, in concordance with a hierarchy of floral organ pigmentation. Plant Biotechnol. 2005, 3, 225–235. [Google Scholar] [CrossRef]
  31. Chopra, S.; Cocciolone, S.M.; Bushman, S.; Sangar, V.; McMullen, M.D.; Peterson, T. The maize unstable factor for orange1 is a dominant epigenetic modifier of a tissue specifically silent allele of pericarp color1. Genetics 2003, 163, 1135–1146. [Google Scholar] [PubMed]
  32. Robbins, M.L.; Roy, A.; Wang, P.-H.; Gaffoor, I.; Sekhon, R.S.; de O. Buanafina, M.M.; Rohila, J.S.; Chopra, S. Comparative proteomics analysis by DIGE and iTRAQ provides insight into the regulation of phenylpropanoids in maize. J. Proteomics 2013, 93, 254–275. [Google Scholar] [CrossRef] [PubMed]
  33. Hammerschmidt, R. Phenols and plant-pathogen interactions: The saga continues. Physiol. Mol. Plant Pathol. 2005, 66, 77–78. [Google Scholar] [CrossRef]
  34. Kambal, A.E.; Bate-Smith, E.C. A genetic and biochemical study on pericarp pigmentation between two cultivars of grain sorghum, sorghum bicolor. Heredity 1976, 37, 417–421. [Google Scholar] [CrossRef]
  35. Schutt, C.; Netzly, D. Effect of apiforol and apigeninidin on growth of selected fungi. J. Chem. Ecol. 1991, 17, 2261–2266. [Google Scholar] [CrossRef] [PubMed]
  36. Stich, K.; Forkmann, G. Biosynthesis of 3-deoxyanthocyanins with flower extracts from Sinningia cardinalis. Phytochemistry 1988, 27, 785–789. [Google Scholar] [CrossRef]
  37. Winefield, C.S.; Lewis, D.H.; Swinny, E.E.; Zhang, H.B.; Arathoon, H.S.; Fischer, T.C.; Halbwirth, H.; Stich, K.; Gosch, C.; Forkmann, G.; et al. Investigation of the biosynthesis of 3-deoxyanthocyanins in Sinningia cardinalis. Physiol. Plant. 2005, 124, 419–430. [Google Scholar] [CrossRef]
  38. Jambunathan, R.; Butler, L.G.; Bandyopadhyay, R.; Lewisk, N. Polyphenol concentration in grain leaf and callus of mold susceptible and mold resistant sorghum cultivars. J. Agric. Food Chem. 1986, 34, 425–420. [Google Scholar] [CrossRef]
  39. Jambunathan, R.; Kherdekar, M.S.; Bandyopadhyay, R. Flavan-4-ols concentration in mold-susceptible and mold resistant sorghum at different stages of grain development. J. Agric. Food Chem. 1990, 38, 545–548. [Google Scholar] [CrossRef]
  40. Menkir, A.; Ejeta, G.; Butler, L.; Melakeberhan, A. Physical and chemical kernel properties associated with resistance to grain mold in sorghum. Cereal Chem. 1996, 73, 613–617. [Google Scholar]
  41. Spinelli, F.; Speakman, J.B.; Rademacher, W.; Halbwirth, H.; Stich, K.; Costa, G. Luteoforol, a flavan 4-ol, is induced in pome fruits by prohexadione-calciumand shows phytoalexin-like properties against erwinia amylovora and other plant pathogens. Eur. J. Plant Pathol. 2005, 112, 133–142. [Google Scholar] [CrossRef]
  42. Boddu, J.; Svabek, C.; Sekhon, R.; Gevens, A.; Nicholson, R.L.; Jones, A.D.; Pedersen, J.F.; Gustine, D.L.; Chopra, S. Expression of a putative flavonoid 3'-hydroxylase in sorghum mesocotyls synthesizing 3-deoxyanthocyanidin phytoalexins. Physiol. Mol. Plant Pathol. 2004, 65, 101–113. [Google Scholar] [CrossRef]
  43. Bruce, W.; Folkerts, O.; Garnaat, C.; Crasta, O.; Roth, B.; Bowen, B. Expression profiling of the maize flavonoid pathway genes controlled by estradiol-inducible transcription factors crc and p. Plant Cell 2000, 12, 65–80. [Google Scholar] [CrossRef] [PubMed]
  44. Bushman, B.S.; Snookc, M.E.; Gerkeb, J.B.; Szalmaa, S.J.; Berhowd, M.A.; Houchinse, K.E.; McMullen, M.D. Two loci exert major effects on chlorogenic acid synthesis in maize. Crop Sci. 2002, 42, 1669–1678. [Google Scholar]
  45. Dixon, R.A.; Achnine, L.; Kota, P.; Liu, C.; Reddy, M.S.; Wang, L. The phenylpropanoid pathway and plant defence—A genomics perspective. Mol. Plant Pathol. 2002, 3, 371–390. [Google Scholar] [CrossRef] [PubMed]
  46. Blount, J.W.; Korth, K.L.; Masoud, S.A.; Rasmussen, S.; Lamb, C.; Dixon, R.A. Altering expression of cinnamic acid 4-hydroxylase in transgenic plants provides evidence for a feedback loop at the entry point into the phenylpropanoid pathway. Plant Physiol. 2000, 122, 107–116. [Google Scholar] [CrossRef] [PubMed]
  47. Jin, H.; Martin, C. Multifunctionality and diversity within the plant myb-gene family. Plant Mol. Biol. 1999, 41, 577–585. [Google Scholar] [CrossRef] [PubMed]
  48. Jirschitzka, J.; Mattern, D.J.; Gershenzon, J.; D’Auria, J.C. Learning from nature: New approaches to the metabolic engineering of plant defense pathways. Curr. Opin. Biotechnol. 2013, 24, 320–328. [Google Scholar] [CrossRef] [PubMed]
  49. Mengiste, T.; Chen, X.; Salmeron, J.; Dietrich, R. The Botrytis susceptible1 gene encodes an r2r3myb transcription factor protein that is required for biotic and abiotic stress responses in arabidopsis. Plant Cell 2003, 15, 2551–2565. [Google Scholar] [CrossRef] [PubMed]
  50. Stracke, R.; Werber, M.; Weisshaar, B. The r2r3-myb gene family in arabidopsis thaliana. Curr. Opin. Plant Biol. 2001, 4, 447–456. [Google Scholar] [CrossRef] [PubMed]
  51. Armstrong, C.L.; Romero-Severson, J.; Hodges, T.K. Improved tissue culture response of an elite maize inbred through backcross breeding, and identification of chromosomal regions important for regeneration by rflp analysis. Theor. Appl. Genet. 1992, 84, 755–762. [Google Scholar] [PubMed]
  52. Armstrong, C.L.; Green, C.E. Establishment and maintenance of friable, embryogenic maize callus and the involvement of l-proline. Planta 1985, 164, 207–214. [Google Scholar] [CrossRef] [PubMed]
  53. Frame, B.R.; Zhang, H.; Cocciolone, S.M.; Sidorenko, L.V.; Dietrich, C.R.; Pegg, S.E.; Zhen, S.; Schnable, P.S.; Wang, K. Production of transgenic maize from bombarded type ii callus: Effect of gold particle size and callus morphology on transformation efficiency. Vitr. Cell. Dev. Biol. 2000, 36, 21–29. [Google Scholar] [CrossRef]
  54. Wolfe, K.; Wu, X.Z.; Liu, R.H. Antioxidant activity of apple peels. J. Agric. Food Chem. 2003, 51, 609–614. [Google Scholar] [CrossRef] [PubMed]
  55. Coca, M.; Bortolotti, C.; Rufat, M.; Penas, G.; Eritja, R.; Tharreau, D.; del Pozo, A.M.; Messeguer, J.; San Segundo, B. Transgenic rice plants expressing the antifungal afp protein from Aspergillus giganteus show enhanced resistance to the rice blast fungus Magnaporthe grisea. Plant Mol. Biol. 2004, 54, 245–259. [Google Scholar] [CrossRef] [PubMed]
  56. Harborne, J.B. Phytochemical Methods. A Guide to Modern Techniques of Plant Analysis, 3rd ed.; Champman and Hall: New York, NY, USA, 1998. [Google Scholar]
  • Sample Availability: Not available.

