
Auto-Thermal Reforming Using Mixed Ion-Electronic Conducting Ceramic Membranes for a Small-Scale H2 Production Plant


Abstract
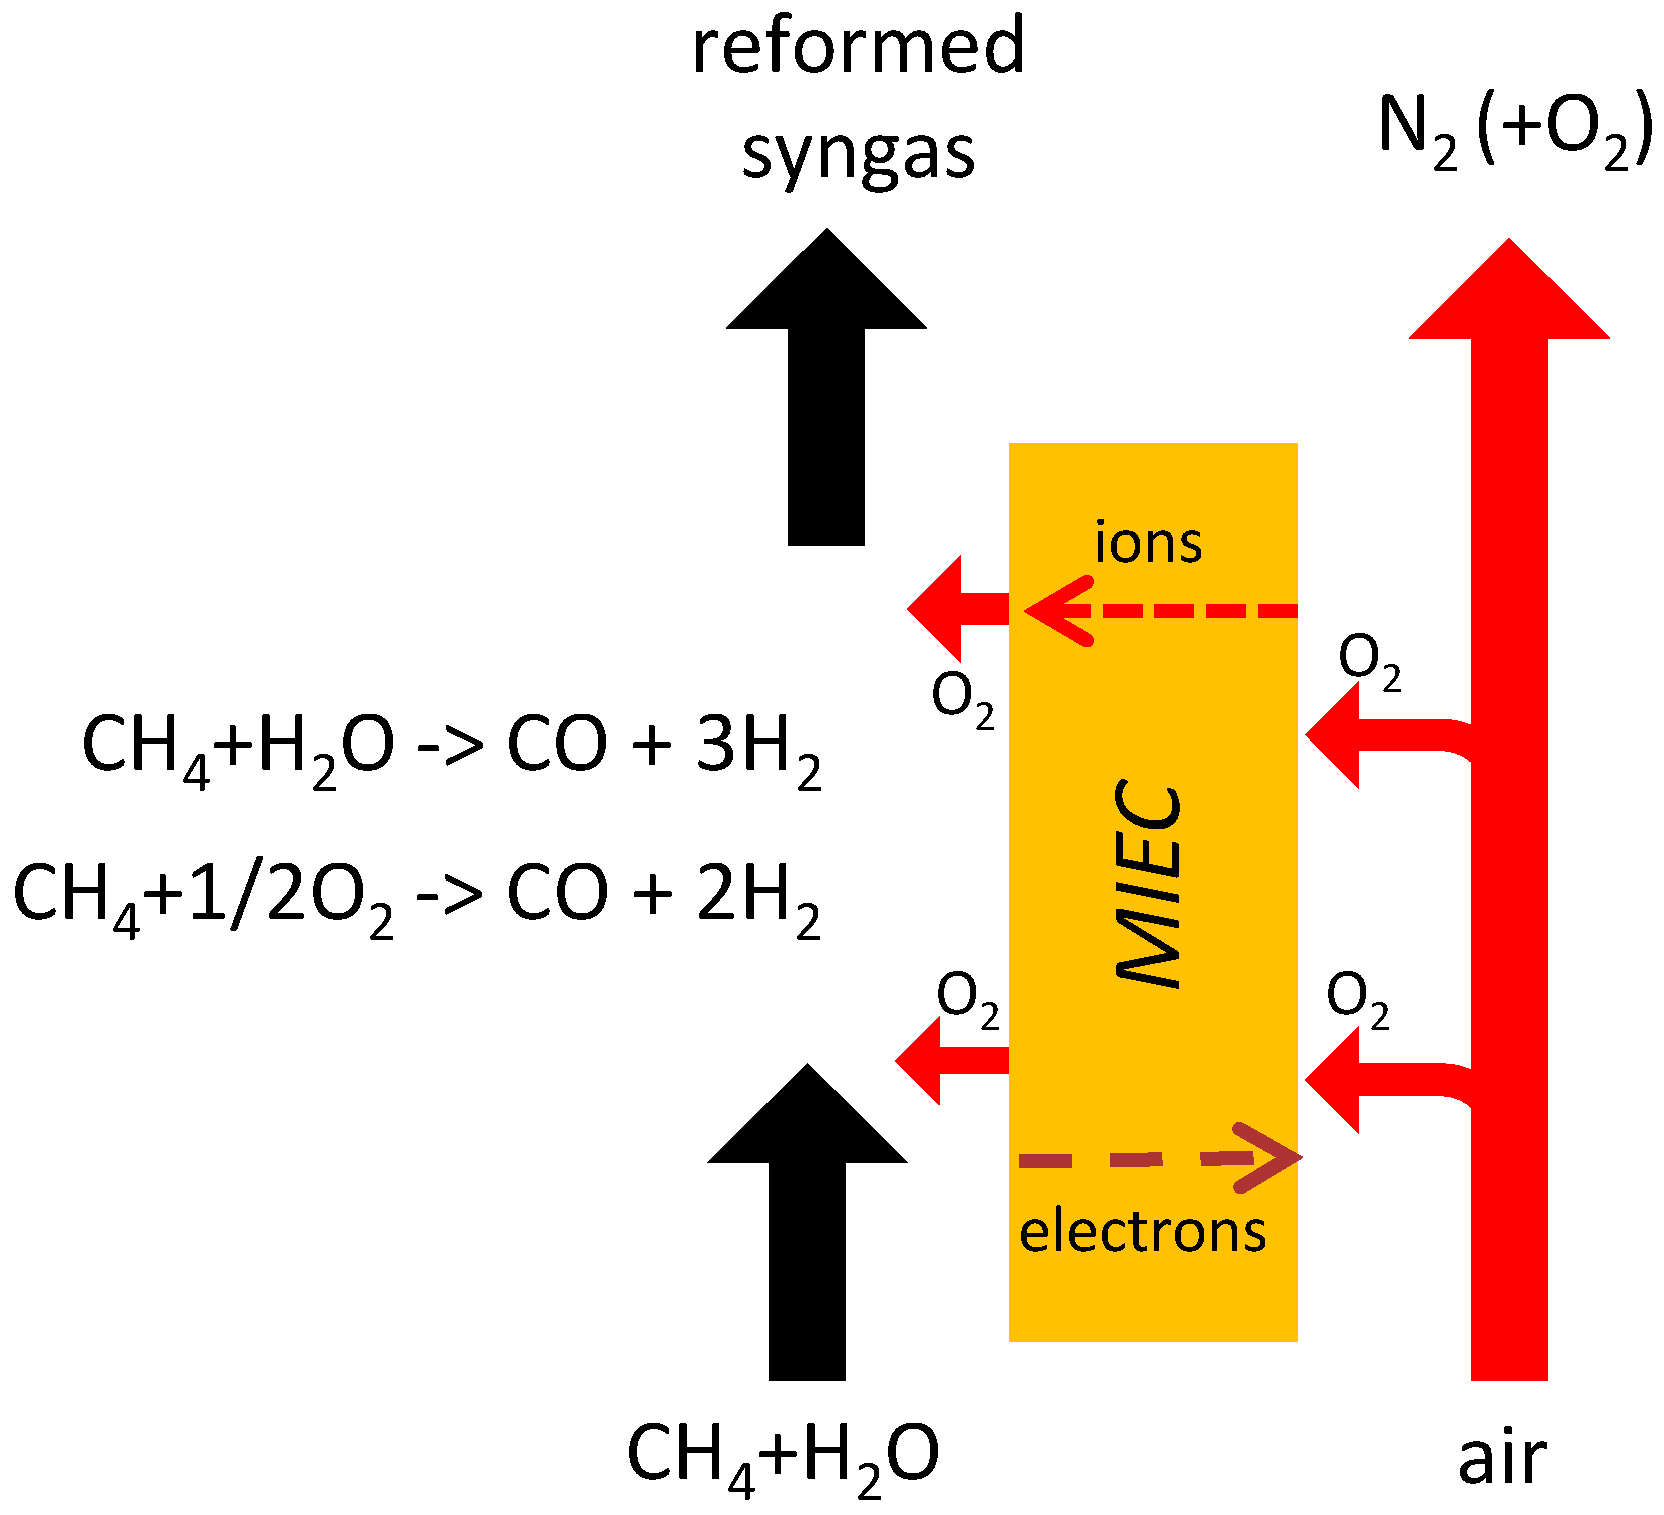
:1. Introduction

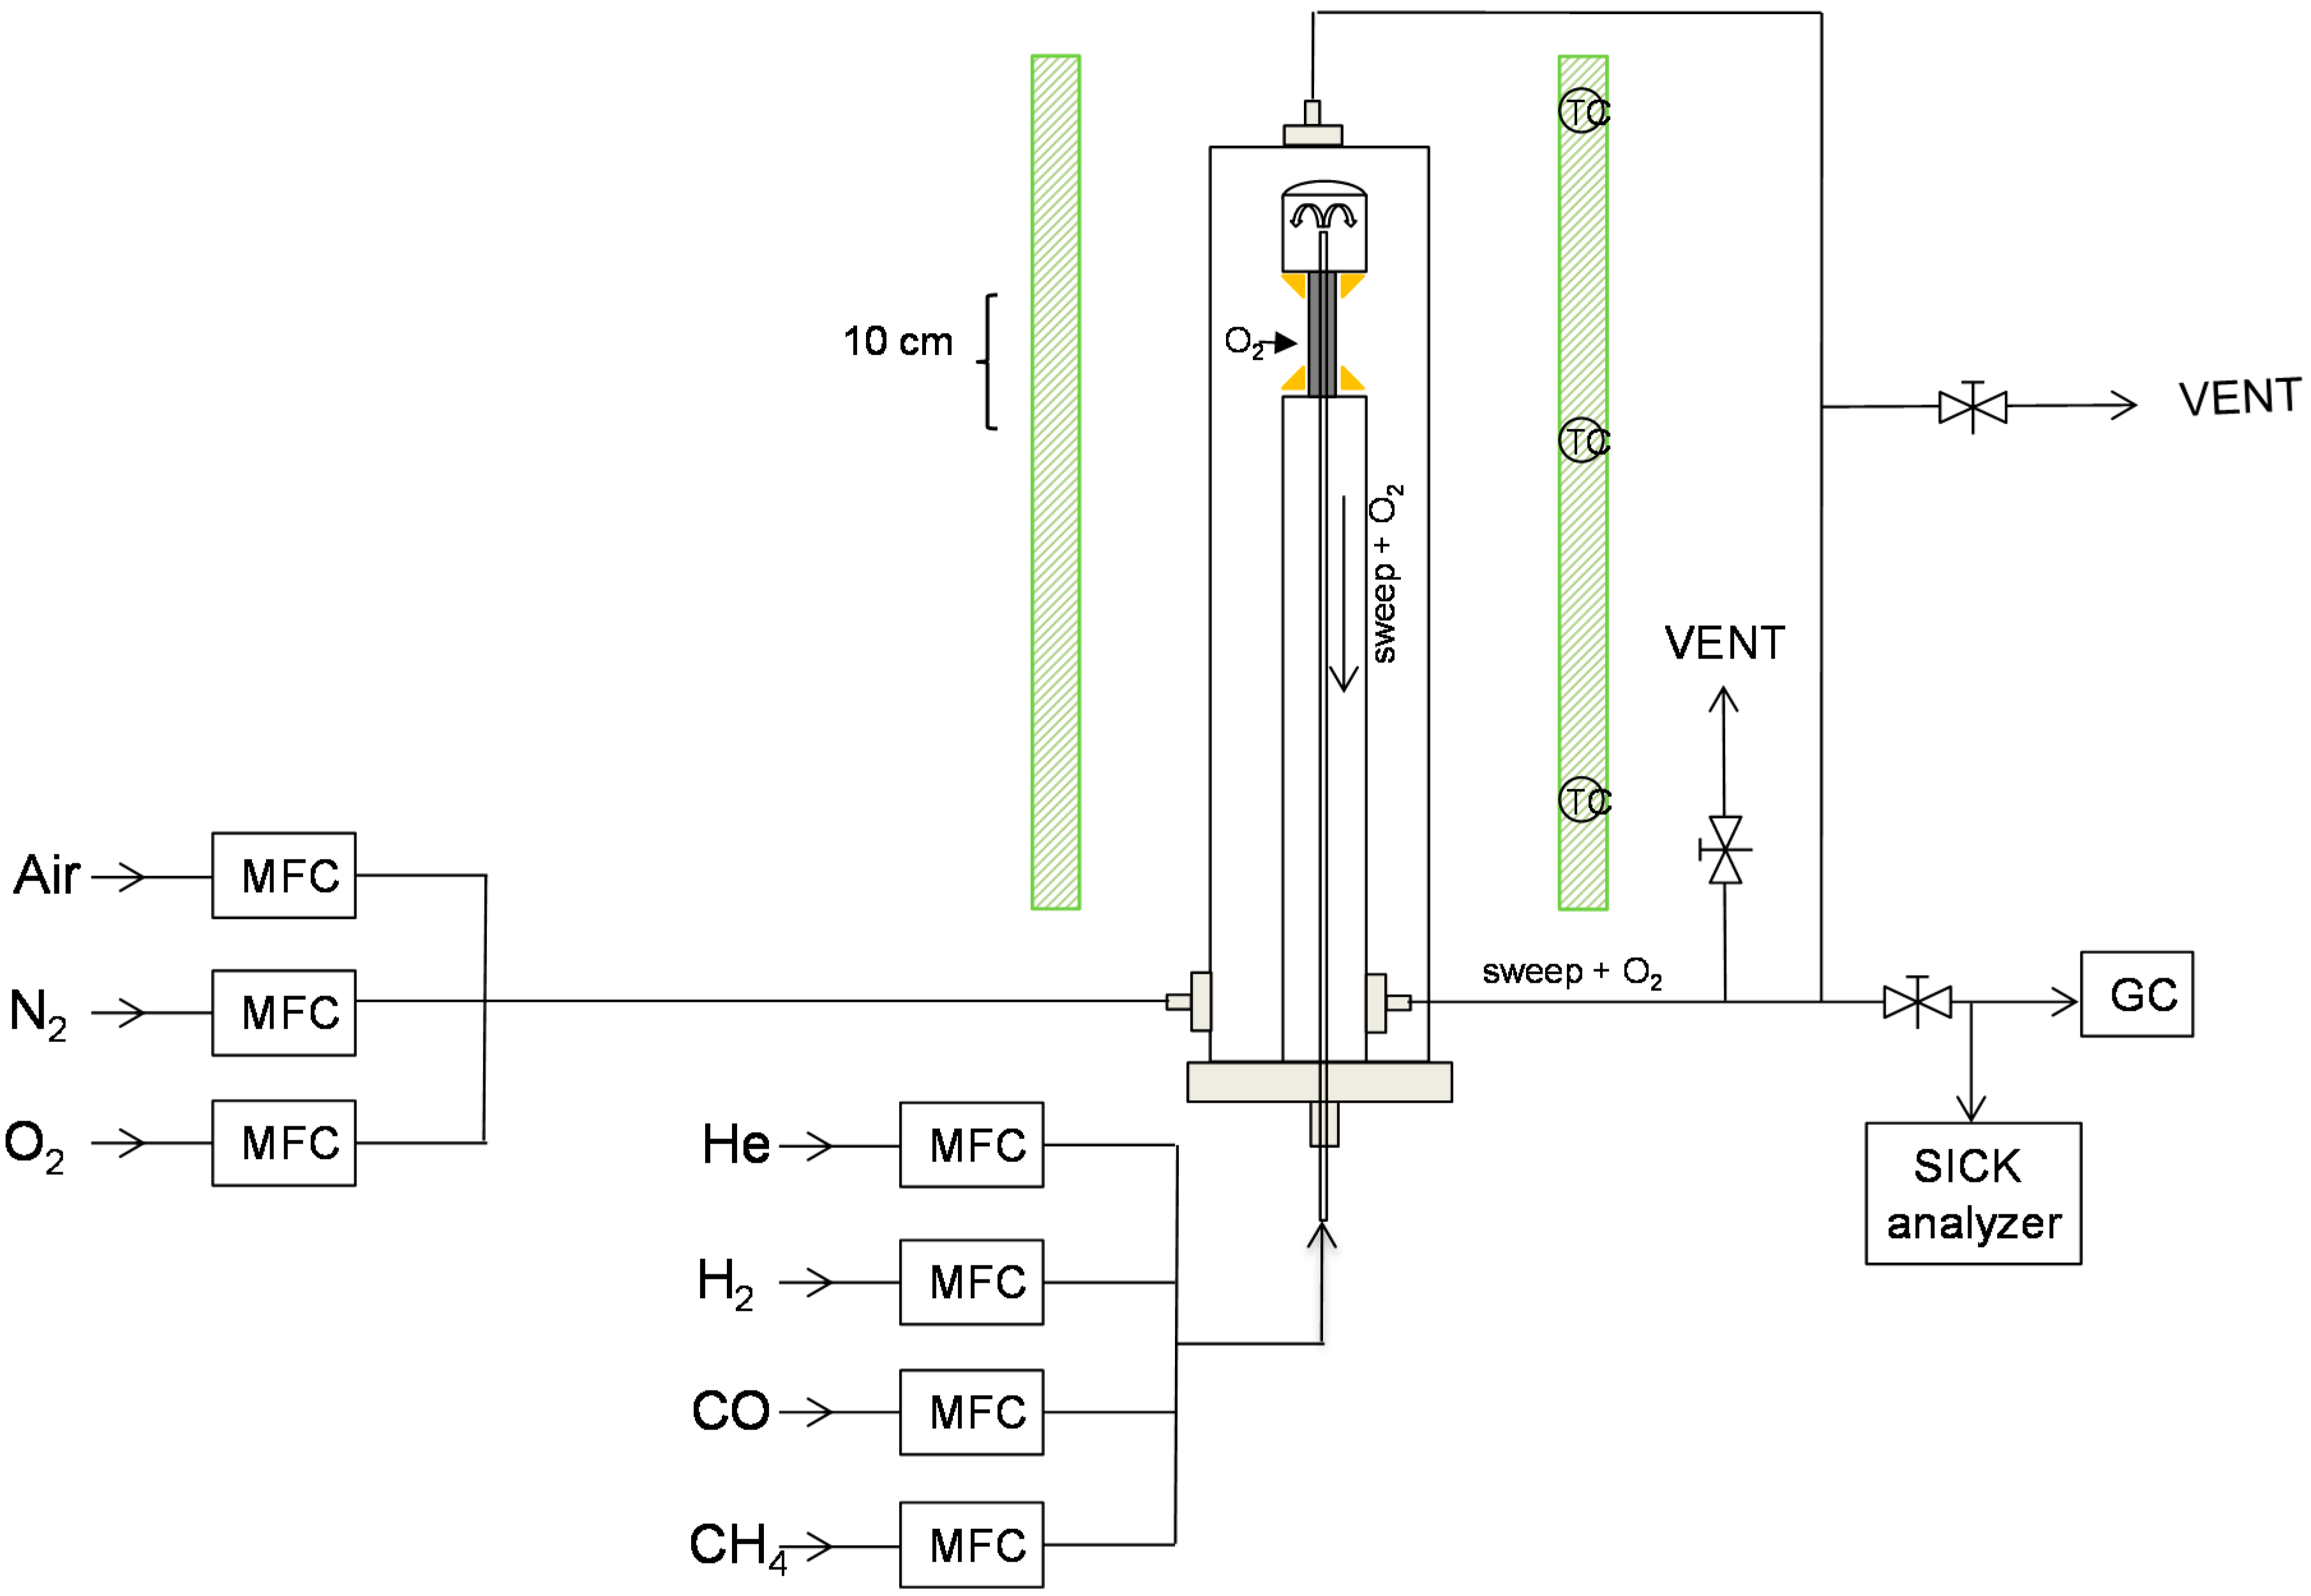
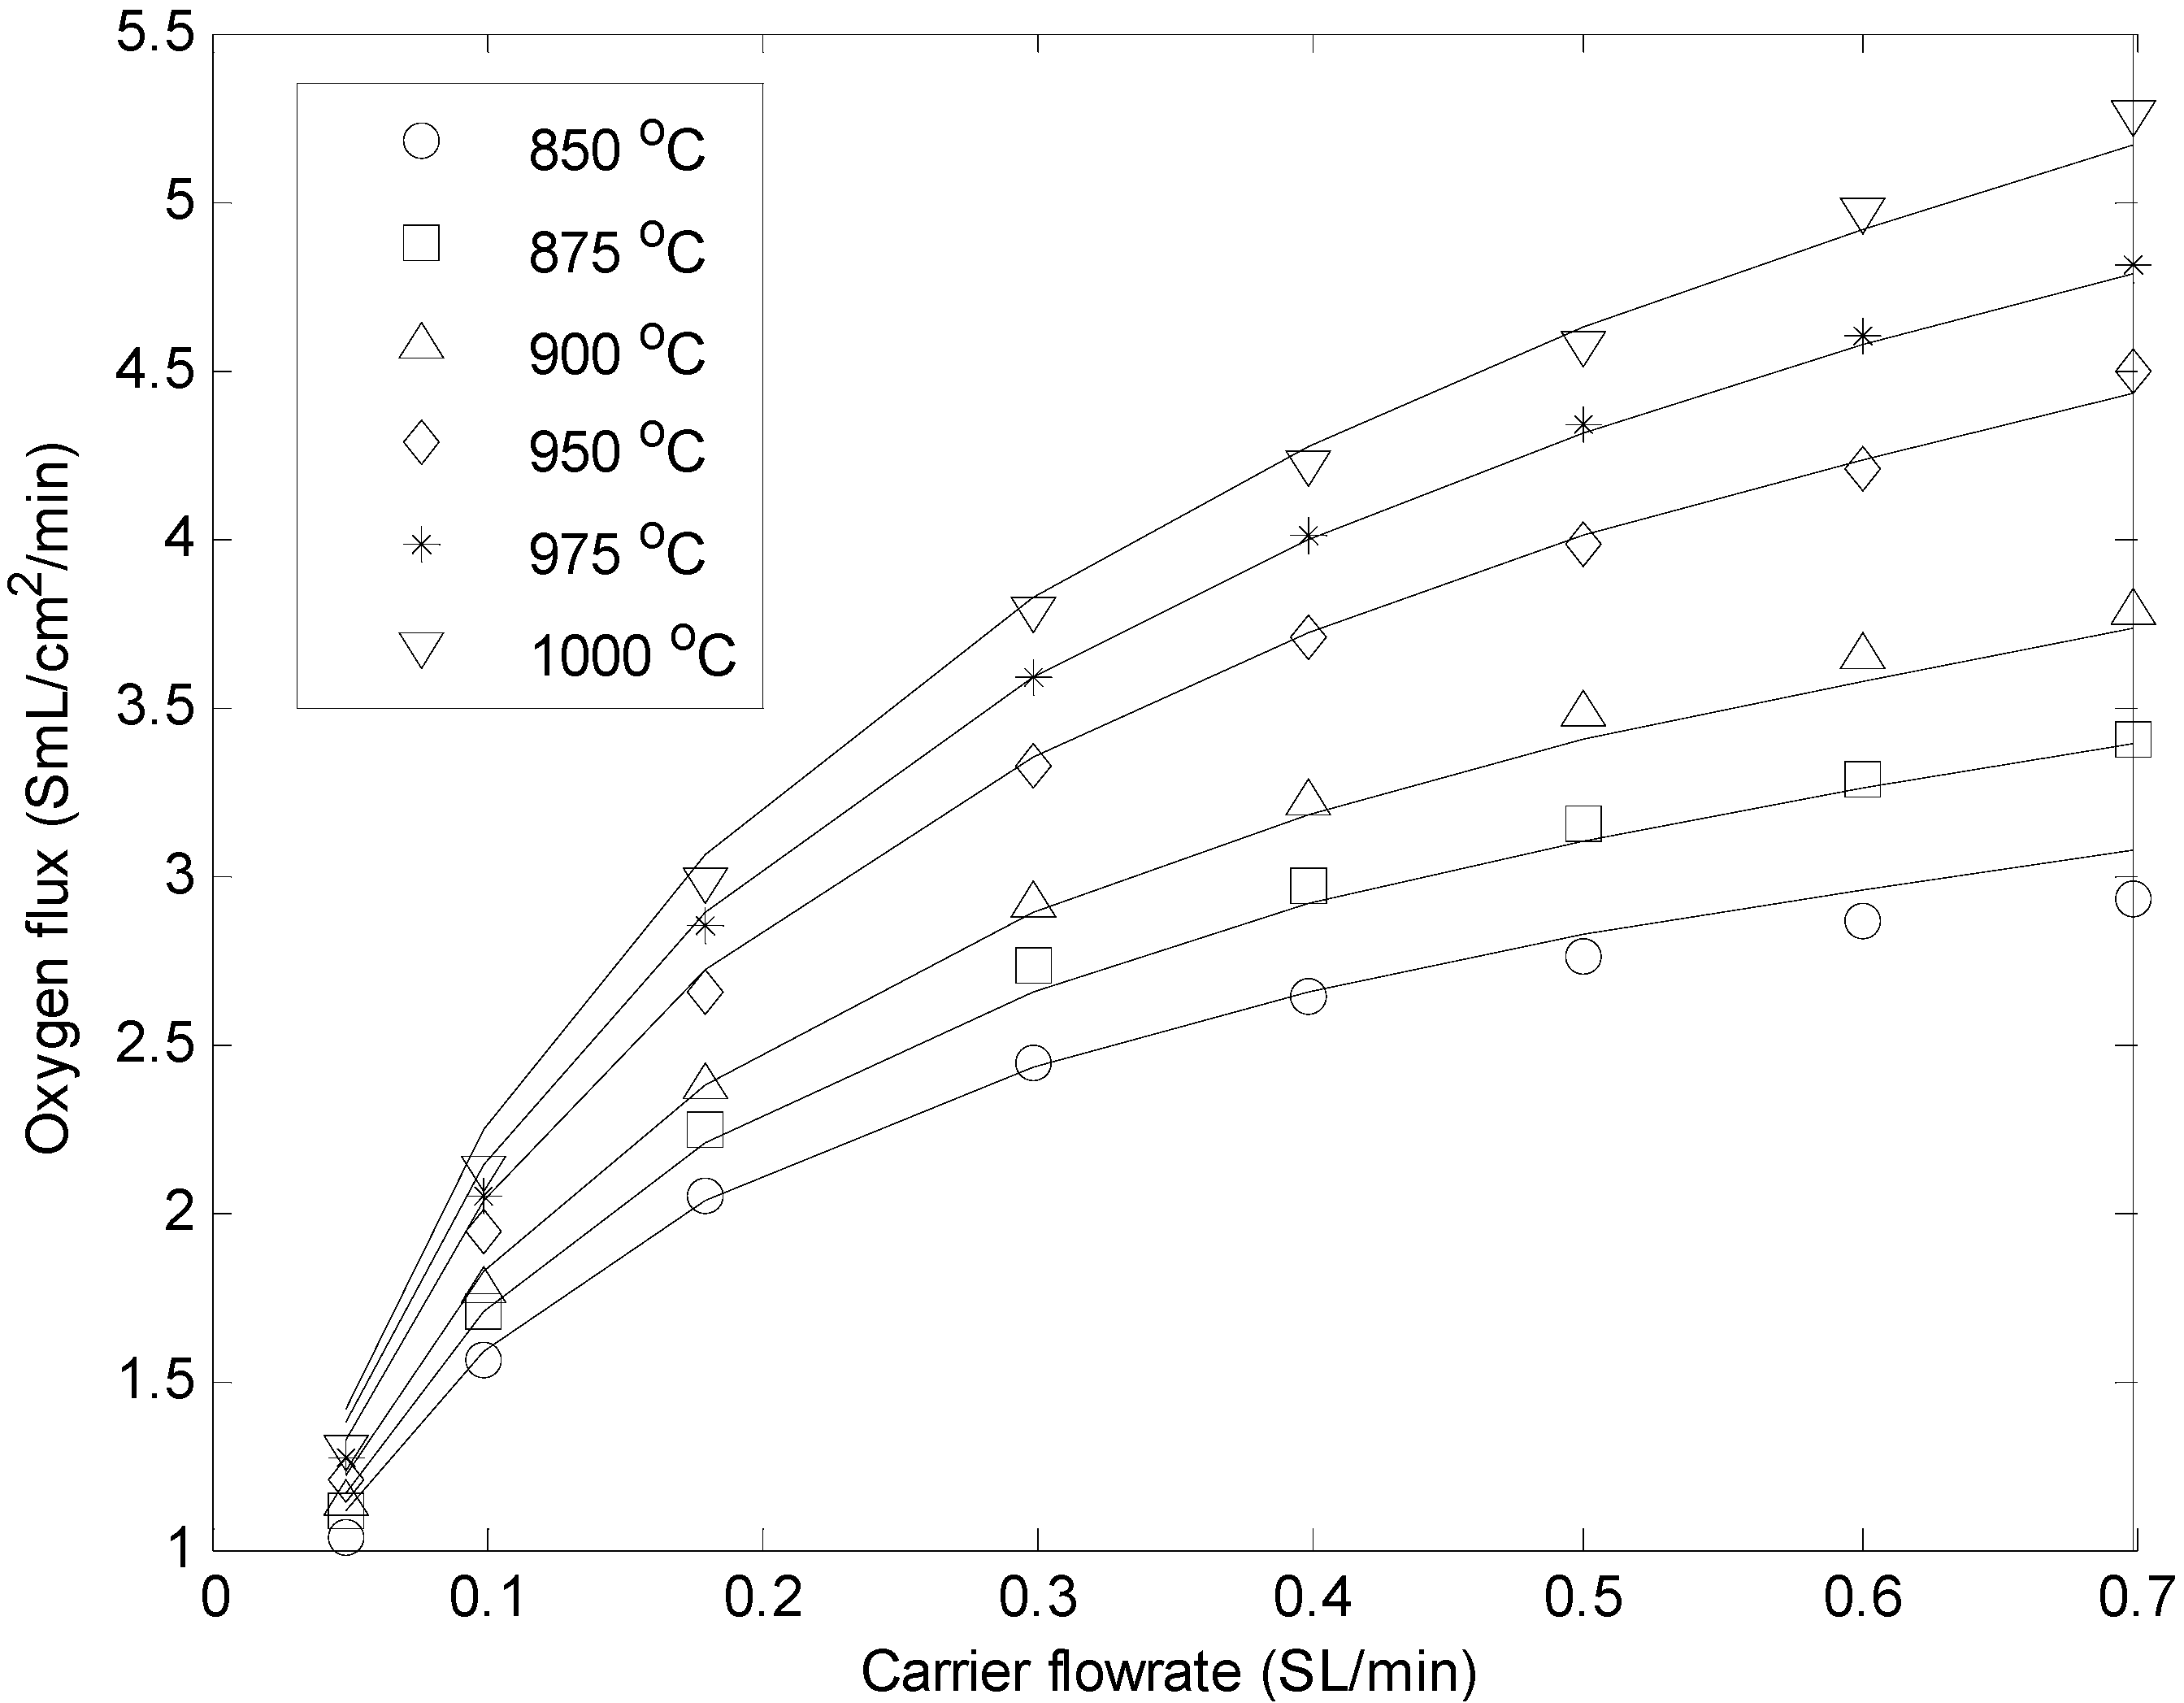
2. Membrane Testing
Description of the Experimental Setup
3. Reactor Model
3.1. Description of the Model

| Equations for the Fuel Side | |
| (1) | |
| (2) | |
| (3) | |
| (4) | |
| (5) | |
| Equations for the Air Side | |
| (6) | |
| (7) | |
| (8) | |
| Equations at the Membrane Interface | |
| (9) | |
| (10) | |
| (11) | |
| (12) | |
| Equation for the Oxygen Flux Through the Membrane | |
n = 0.5 | (13) |
| Heat and Mass Transfer Coefficients | |
| (14) | |
| (15) | |
| (16) | |
| (17) | |
| (18) | |
| Reaction Rate Expressions | |
| (19) | |
| (20) | |
| (21) | |
| Pre exponential factor | Activation energy (kJ/mol) | |
|---|---|---|
| 8.11 × 10⁵ | 86.0 | |
| 6.82 × 10⁵ | 86.0 | |
| 2.62 × 10⁵ | 106.9 | |
| 2.45 × 10² | 54.5 | |
| 1.26 × 10⁻¹ | −27.3 | |
| 7.87 × 10⁻⁷ | −92.8 |
3.2. Determination of Membrane Permeability Parameters
| - | Pre exponential Factor | Activation Energy (kJ/mol) |
|---|---|---|
| 9.823 | 91.8 | |
| 15.36 | 56.3 | |
| 308.5 | 267.0 |
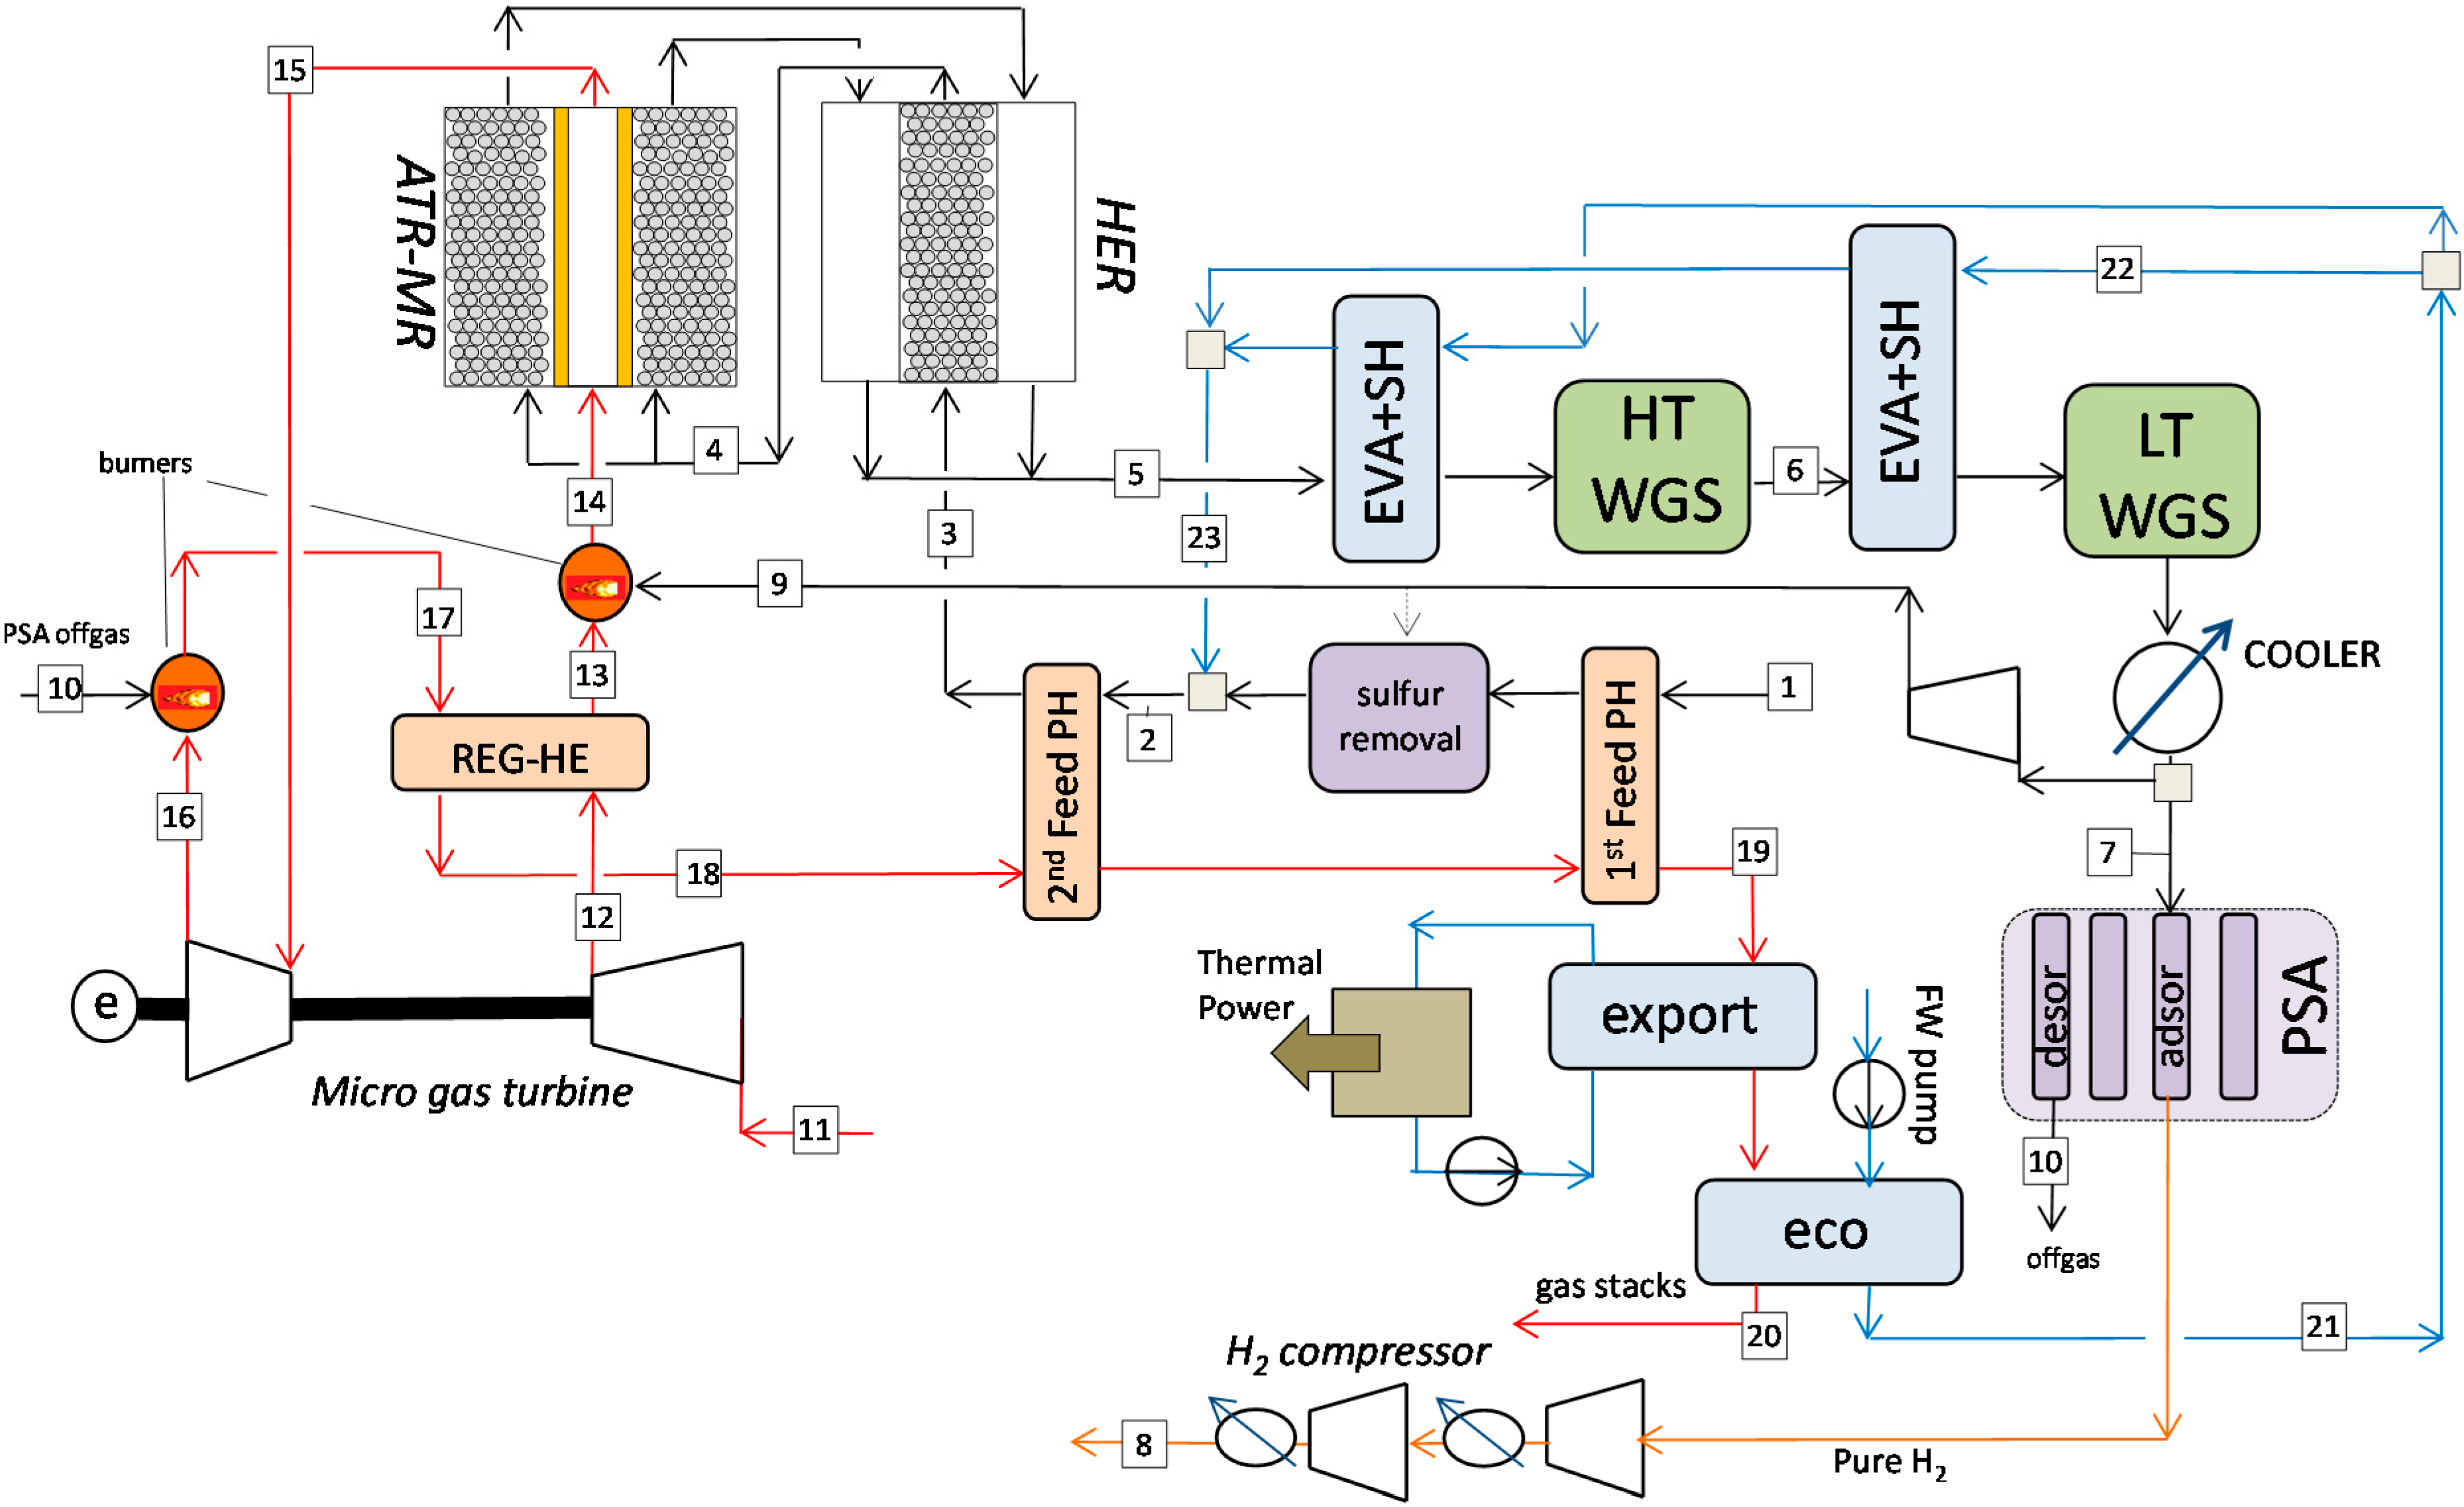
4. Description of the Plant
4.1. Plant Design

4.2. Main Assumptions and Methodology
| Main Assumptions | |
|---|---|
| Fuel feedstock composition (% Vol.) | 100% CH4 |
| LHVNG (MJ/kg) | 50 MJ/kg |
| Ambient air conditions | 1 bar, 15 °C |
| Water feed conditions | 1 bar, 15 °C |
| Air composition (%vol) | 79% N2; 21% O2 |
| Process conditions | |
| Pre-reforming inlet temperature, °C | 650 |
| Maximum reforming temperature, °C | 900–1200 °C |
| Reforming pressure, bar | 5–20 |
| steam-to-carbon ratio | 2–3 |
| HT-WGS inlet temperature °C | 400 |
| LT-WGS inlet temperature, °C | 250 |
| Pressure drops, % of inlet pressure | 1 |
| Heat Exchangers | |
| ΔTmin gas-gas | 20 |
| ΔTmin gas-liquid | 10 |
| Pressure drops, % of inlet pressure | 2 |
| H2 compressor and PSA | |
| PSA H2 Separation purity | 100% |
| PSA H2 separation efficiency* | 80% |
| H2 separation process, bar | 5–20 |
| Number of intercooled compression stages | depending on the permeate pressure |
| Final H2 pressure for plant export, bar | 20 |
| H2 outlet temperature, °C | 30 |
| Polytropic efficiency for compression stages,% | 80% |
| pump/compressors mech-electric efficiency, % | 95% |
| Gas Turbine | |
| Air compressor isentropic efficiency | 75% |
| Gas expander isentropic efficiency | 70% |
| Electric mechanic efficiency | 95% |
| Steam cycle parameters | |
| pressure drops economizers, % of inlet pressure | 25% |
| pressure drops superheaters, % of inlet pressure | 8% |
| Max. steam temperature, °C | 400 |
| steam export at 20 bar | saturated |
| pump hydraulic efficiency | 80% |
| pumps mech-electric efficiency | 94% |
| Stream | T | p | m | N | N*LHVmol | Composition (% vol.) | LHV | ||||||
|---|---|---|---|---|---|---|---|---|---|---|---|---|---|
| #p | °C | bar | kg/h | kmol/h | MW | CH4 | CO | CO2 | H2 | H2O | N2 | O2 | MJ/kmol |
| #1 | 15.0 | 10.0 | 252.0 | 15.7 | 3.50 | 1.000 | 0.000 | 0.000 | 0.000 | 0.000 | 0.000 | 0.000 | 802.3 |
| #2 | 400.0 | 10.0 | 934.4 | 53.6 | 3.50 | 0.293 | 0.000 | 0.000 | 0.000 | 0.707 | 0.000 | 0.000 | 235.2 |
| #3 | 600.0 | 10.0 | 934.4 | 53.6 | 3.50 | 0.293 | 0.000 | 0.000 | 0.000 | 0.707 | 0.000 | 0.000 | 235.2 |
| #4 | 650.0 | 10.0 | 934.4 | 66.8 | 3.84 | 0.136 | 0.031 | 0.068 | 0.366 | 0.399 | 0.000 | 0.000 | 207.0 |
| #5 | 700.0 | 9.8 | 1157.3 | 85.1 | 3.45 | 0.000 | 0.133 | 0.051 | 0.444 | 0.370 | 0.000 | 0.001 | 146.1 |
| #6 | 433.0 | 9.7 | 1157.3 | 85.0 | 3.34 | 0.000 | 0.034 | 0.151 | 0.542 | 0.273 | 0.000 | 0.000 | 141.7 |
| #7 | 35.0 | 9.2 | 709.4 | 58.3 | 3.03 | 0.000 | 0.010 | 0.236 | 0.754 | 0.000 | 0.000 | 0.000 | 186.9 |
| #8 | 30.0 | 20.0 | 70.9 | 35.2 | 2.38 | 0.000 | 0.000 | 0.000 | 1.000 | 0.000 | 0.000 | 0.000 | 244.0 |
| #9 | 44.5 | 10.1 | 69.0 | 5.7 | 0.29 | 0.000 | 0.010 | 0.236 | 0.754 | 0.000 | 0.000 | 0.000 | 186.9 |
| #10 | 35.0 | 1.1 | 638.5 | 23.1 | 0.64 | 0.000 | 0.025 | 0.594 | 0.381 | 0.000 | 0.000 | 0.000 | 100.0 |
| #11 | 15.0 | 1.0 | 2642.8 | 91.6 | 0.00 | 0.000 | 0.000 | 0.000 | 0.000 | 0.000 | 0.790 | 0.210 | 0.00 |
| #12 | 367.3 | 10.3 | 2642.8 | 91.6 | 0.00 | 0.000 | 0.000 | 0.000 | 0.000 | 0.000 | 0.790 | 0.210 | 0.00 |
| #13 | 600.0 | 10.3 | 2642.8 | 91.6 | 0.00 | 0.000 | 0.000 | 0.000 | 0.000 | 0.000 | 0.790 | 0.210 | 0.00 |
| #14 | 900.0 | 10.0 | 2711.8 | 95.1 | 0.00 | 0.000 | 0.000 | 0.015 | 0.000 | 0.045 | 0.761 | 0.179 | 0.00 |
| #15 | 863.7 | 10.0 | 2489.0 | 88.1 | 0.00 | 0.000 | 0.000 | 0.016 | 0.000 | 0.049 | 0.821 | 0.115 | 0.00 |
| #16 | 522.9 | 1.1 | 2489.0 | 88.1 | 0.00 | 0.000 | 0.000 | 0.016 | 0.000 | 0.049 | 0.821 | 0.115 | 0.00 |
| #17 | 1000.2 | 1.0 | 3127.5 | 106.6 | 0.00 | 0.000 | 0.000 | 0.147 | 0.000 | 0.123 | 0.679 | 0.051 | 0.00 |
| #18 | 835.2 | 1.0 | 3127.5 | 106.6 | 0.00 | 0.000 | 0.000 | 0.147 | 0.000 | 0.123 | 0.679 | 0.051 | 0.00 |
| #19 | 618.4 | 1.0 | 3127.5 | 106.6 | 0.00 | 0.000 | 0.000 | 0.147 | 0.000 | 0.123 | 0.679 | 0.051 | 0.00 |
| #20 | 107.1 | 1.0 | 3127.5 | 106.6 | 0.00 | 0.000 | 0.000 | 0.147 | 0.000 | 0.123 | 0.679 | 0.051 | 0.00 |
| #21 | 15.0 | 1.0 | 682.4 | 37.9 | 0.00 | 0.000 | 0.000 | 0.000 | 0.000 | 1.000 | 0.000 | 0.000 | 0.00 |
| #22 | 175.0 | 11.0 | 213.3 | 11.8 | 0.00 | 0.000 | 0.000 | 0.000 | 0.000 | 1.000 | 0.000 | 0.000 | 0.00 |
| #23 | 400 | 10 | 682.4 | 37.9 | 0.00 | 0.000 | 0.000 | 0.000 | 0.000 | 1.000 | 0.000 | 0.000 | 0.00 |
5. Results and Discussion
5.1. Detail of the Plant Flowsheet
5.2. Sensitivity Analysis
- ◾
- The fuel conversion at the pre-reforming stage is lower and therefore more heat of reaction is required in the ATR-MR, so that more oxygen has to be permeated from the air and therefore more air has to be used since the same O2 volume fraction in the depleted air exhaust was specified for this analysis. The resulting O/C at the ATR-MR increases from 0.8 to 0.94.
- ◾
- Due to the lower heat required at the pre-reforming stage the amount of steam produced for the process increases by increasing the S/C (from 2.2 to 2.9), because more heat is available from the exhaust gas cooling. However, the combination of higher pressure (which reduces the reforming conversion) and higher S/C (which improves the methane conversion) in the pre-reforming section the performance has slightly decreased.
- ◾
- The amount of pure H2 decreases (with a reforming efficiency drop from 70.5% to 66.6%) due to the higher O/C used which increases the CH4 conversion by the methane partial oxidation instead of steam methane reforming which is particularly high at the pre-reforming stage.
- ◾
- In terms of electricity production, the micro-gas turbine (micro-GT) net electricity production decreases because a low compressor ratio (βcompressor, in the range of 5) is optimum to maximize the efficiency of the thermodynamic cycle operated with such TIT; the electricity consumption for the H2 compressor is significantly lower (from 56.2 kW at 5 bar to 3.3 kW at 20 bar) due to the higher H2 separation pressure; it must be pointed out that in this analysis the efficiency of the PSA in terms of H2 purity has been kept constant, however, it is known that at low pressure the purity of H2 decreases unless some systems adopting vacuum PSA are applied [42]. The overall power consumption increases by increasing the operating pressure.
- ◾
- At higher pressure the amount of heat for export increases due to more heat available in the plant at lower temperature which also results from a lower thermal input (from CH4) converted into H2 and/or electricity.
- ◾
- The equivalent reforming efficiency slightly decreases from 77% to 74%.
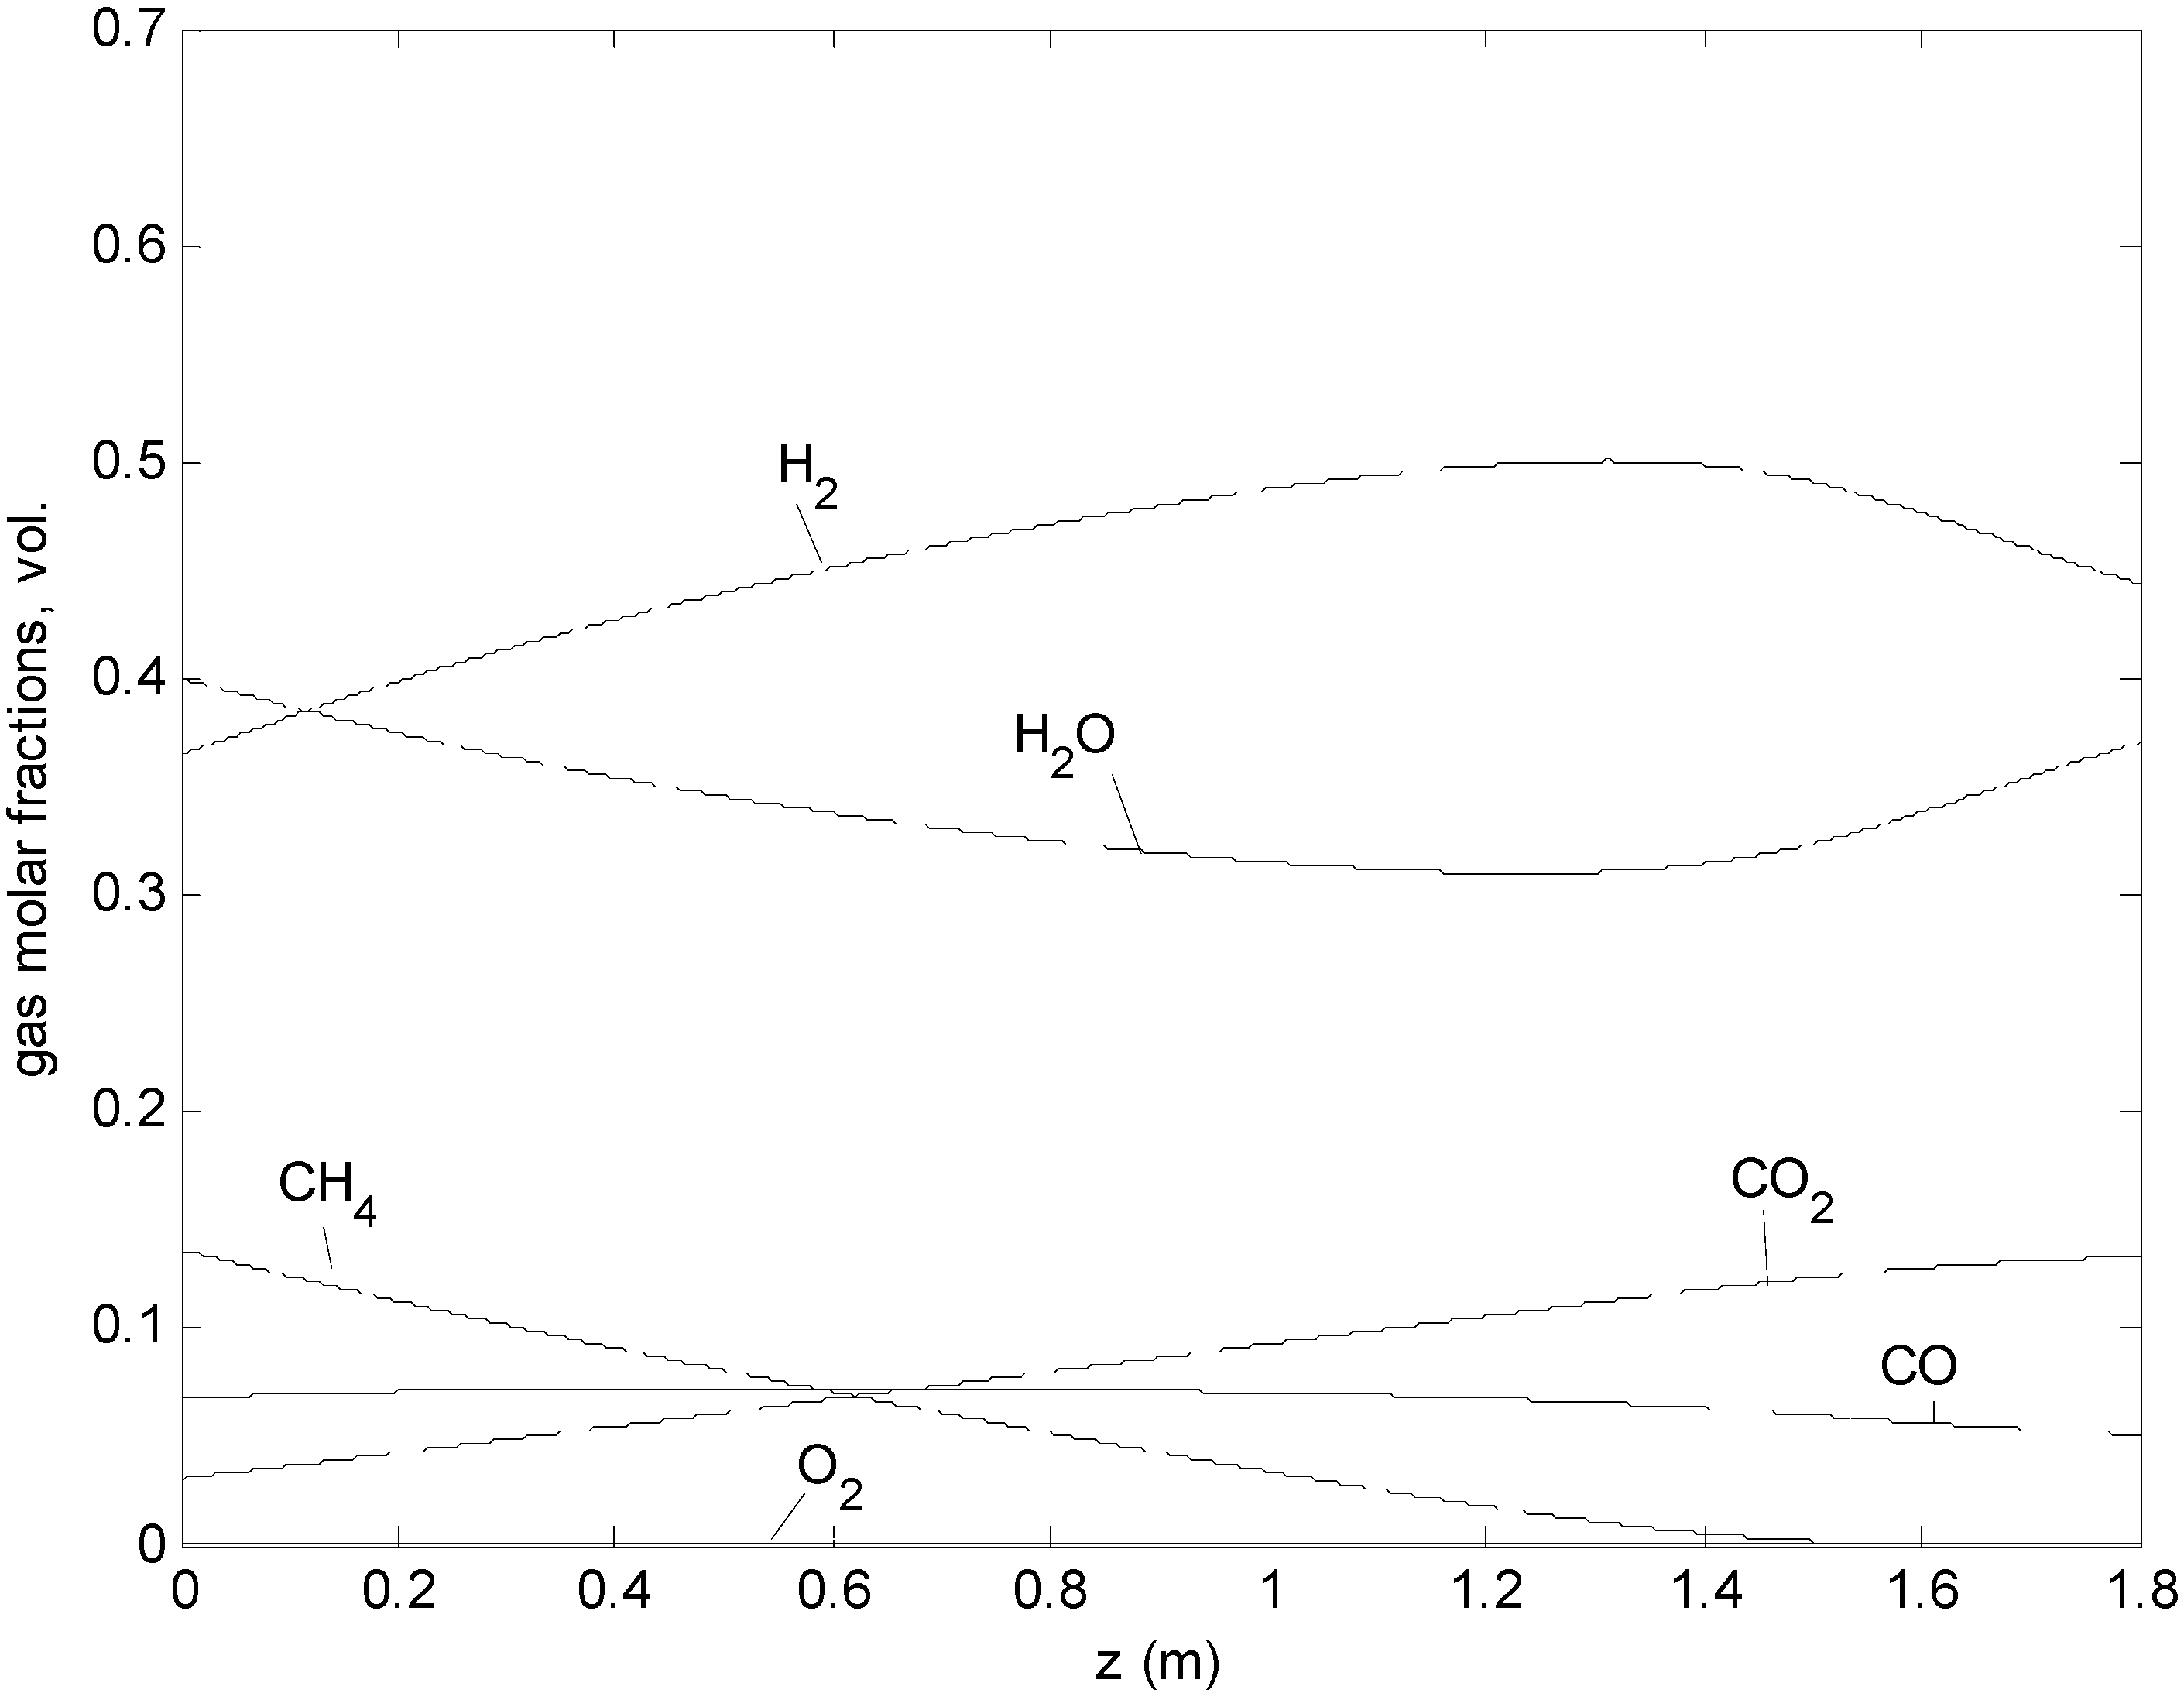
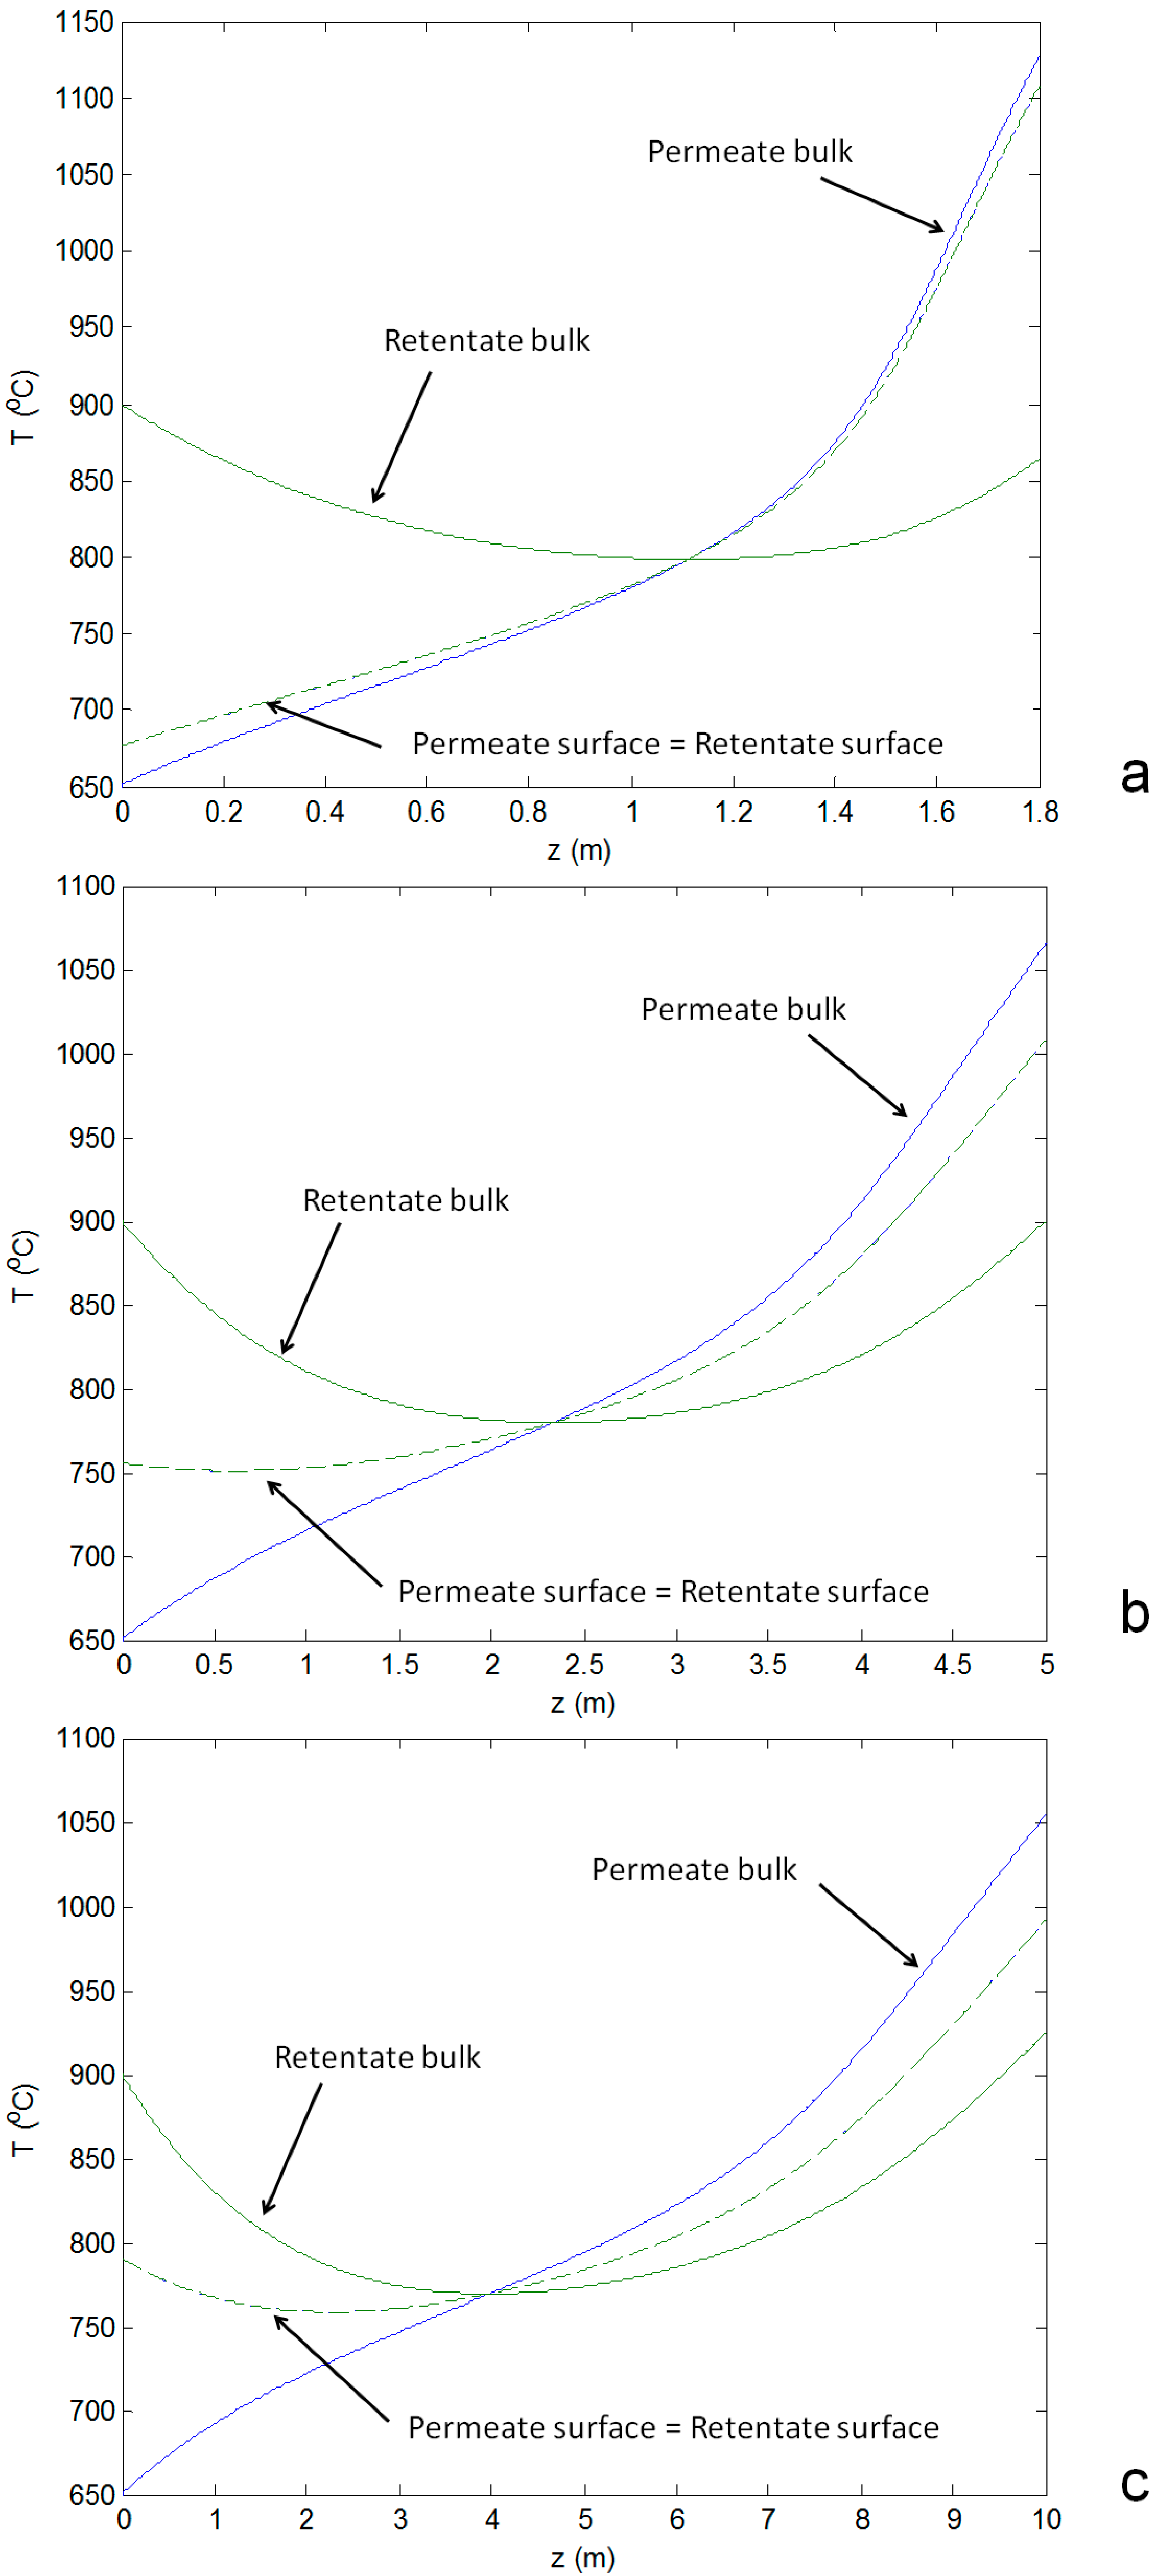
5.3. Reactor Design
| Summary of Performance | |||||||||||
|---|---|---|---|---|---|---|---|---|---|---|---|
| Oxidant Inlet Temperature, °C | 900 | 800 | |||||||||
| Case | 10 bar | 5 bar | 20 bar | 10 bar high O/C | 10 bar high O/C | ||||||
| Reference Small | Medium | Big | Small | Medium | Small | Medium | Small | Medium | Small | Medium | |
| Reactor design | |||||||||||
| N membrane | 1500 | 1400 | 750 | 1370 | 1350 | 1500 | 1430 | 1520 | 1480 | 1750 | 1600 |
| Diameter, m | 1 | 2 | 2 | 1.1 | 2 | 1 | 2 | 1.2 | 2 | 1.5 | 2 |
| Length, m | 1.8 | 5 | 10 | 2.1 | 5 | 1.8 | 5 | 2.4 | 5 | 3 | 5 |
| Main parameters | |||||||||||
| pure H2, kg/h | 70.93 | 71.72 | 71.47 | 73.44 | 73.51 | 69.35 | 69.34 | 65.26 | 65.11 | 61.59 | 63.40 |
| air flow rate, kg/h | 2642.8 | 2642.8 | 2642.8 | 2360.6 | 2360.6 | 2875.2 | 2875.2 | 3257.2 | 3257.2 | 3444.0 | 3444.0 |
| O2 separated, kg/h | 222.88 | 213.24 | 215.73 | 201.85 | 199.08 | 235.86 | 234.16 | 265.13 | 268.36 | 332.39 | 313.79 |
| O2 ret fraction, %vol. | 11.5% | 11.8% | 11.7% | 11.4% | 11.5% | 11.6% | 11.7% | 11.7% | 11.6% | 11.4% | 11.9% |
| steam for process, kg/h | 682.43 | 643.11 | 642.20 | 634.80 | 581.02 | 841.97 | 780.06 | 722.89 | 799.08 | 1101.30 | 926.44 |
| O/C | 0.89 | 0.85 | 0.86 | 0.80 | 0.79 | 0.94 | 0.93 | 1.05 | 1.07 | 1.32 | 1.25 |
| S/C | 2.41 | 2.27 | 2.27 | 2.24 | 2.05 | 2.98 | 2.76 | 2.55 | 2.82 | 3.89 | 3.27 |
| Tout ret, °C | 863.7 | 899.9 | 924.9 | 871.1 | 915.1 | 863.9 | 908.4 | 928.6 | 994.0 | 978.4 | 1012.0 |
| Tout perm, °C | 1127.0 | 1065.3 | 1054.1 | 1103.3 | 1092.7 | 1107.2 | 1064.8 | 1238.4 | 1205.8 | 1231.7 | 1243.4 |
| Energy Balance | |||||||||||
| compressor, kWe | −272.58 | −272.58 | −272.58 | −153.58 | −153.58 | −429.02 | −429.02 | −335.95 | −335.95 | −355.22 | −355.22 |
| turbine, kWe | 273.61 | 283.61 | 289.70 | 184.33 | 191.82 | 360.49 | 375.59 | 358.87 | 379.08 | 384.54 | 397.20 |
| net micro-GT, kWe | 1.03 | 11.02 | 17.12 | 30.75 | 38.25 | −68.53 | −53.43 | 22.91 | 43.12 | 29.32 | 41.97 |
| H2 compressor, kWe | −28.57 | −28.89 | −28.79 | −56.19 | −56.24 | −3.31 | −3.31 | −26.28 | −26.22 | −24.81 | −25.54 |
| FW pump, kWe | −0.30 | −0.29 | −0.29 | −0.13 | −0.12 | −0.79 | −0.73 | −0.32 | −0.36 | −0.49 | −0.41 |
| syngas fan, kWe | −0.49 | −0.49 | −0.49 | −0.53 | −0.53 | −0.66 | −0.66 | −0.62 | −0.62 | −0.44 | −0.43 |
| net electric power, kWe | −28.34 | −18.64 | −12.45 | −26.09 | −18.64 | −73.28 | −58.13 | −4.31 | 15.92 | 3.58 | 15.59 |
| Qexport, kWth | 376.08 | 364.25 | 367.31 | 280.93 | 308.92 | 430.70 | 448.98 | 477.15 | 422.48 | 363.79 | 397.99 |
| reforming efficiency | 68.1% | 68.9% | 68.6% | 70.5% | 70.6% | 66.6% | 66.6% | 62.7% | 62.5% | 59.1% | 60.9% |
| equivalent reforming efficiency | 76.1% | 77.1% | 77.1% | 76.3% | 77.5% | 74.0% | 75.1% | 73.6% | 72.8% | 67.0% | 70.3% |
| Amem/Amem,ref | 1.00 | 2.59 | 2.78 | 1.07 | 2.50 | 1.00 | 2.65 | 1.35 | 2.74 | 1.94 | 2.96 |
| O2 flux, molO2/(s-m2) | 0.0114 | 0.0042 | 0.0040 | 0.0097 | 0.0041 | 0.0121 | 0.0045 | 0.0100 | 0.0050 | 0.0087 | 0.0054 |

- ◾
- For small reactors the axial temperature profile at the membrane surface follows closely the permeate bulk temperature profile. When increasing the reactor size, the axial temperature profile at the membrane surface tends to be closer to the average temperature of both reactor compartments (permeate and retentate), as a result of the increased residence time which increases the heat transfer from both sides of the reactor (Figure 6a vs. Figure 6b,c). Consequently, the resulting reactor outlet temperatures of the streams are also closer when increasing the reactor size.
- ◾
- The heat transfer coefficient at the shell side (the permeate side) is higher in the case of a small reactor size due to the higher gas velocity which reduces the difference between the temperature of the bulk flow and the membrane surface at the permeate side.
- ◾
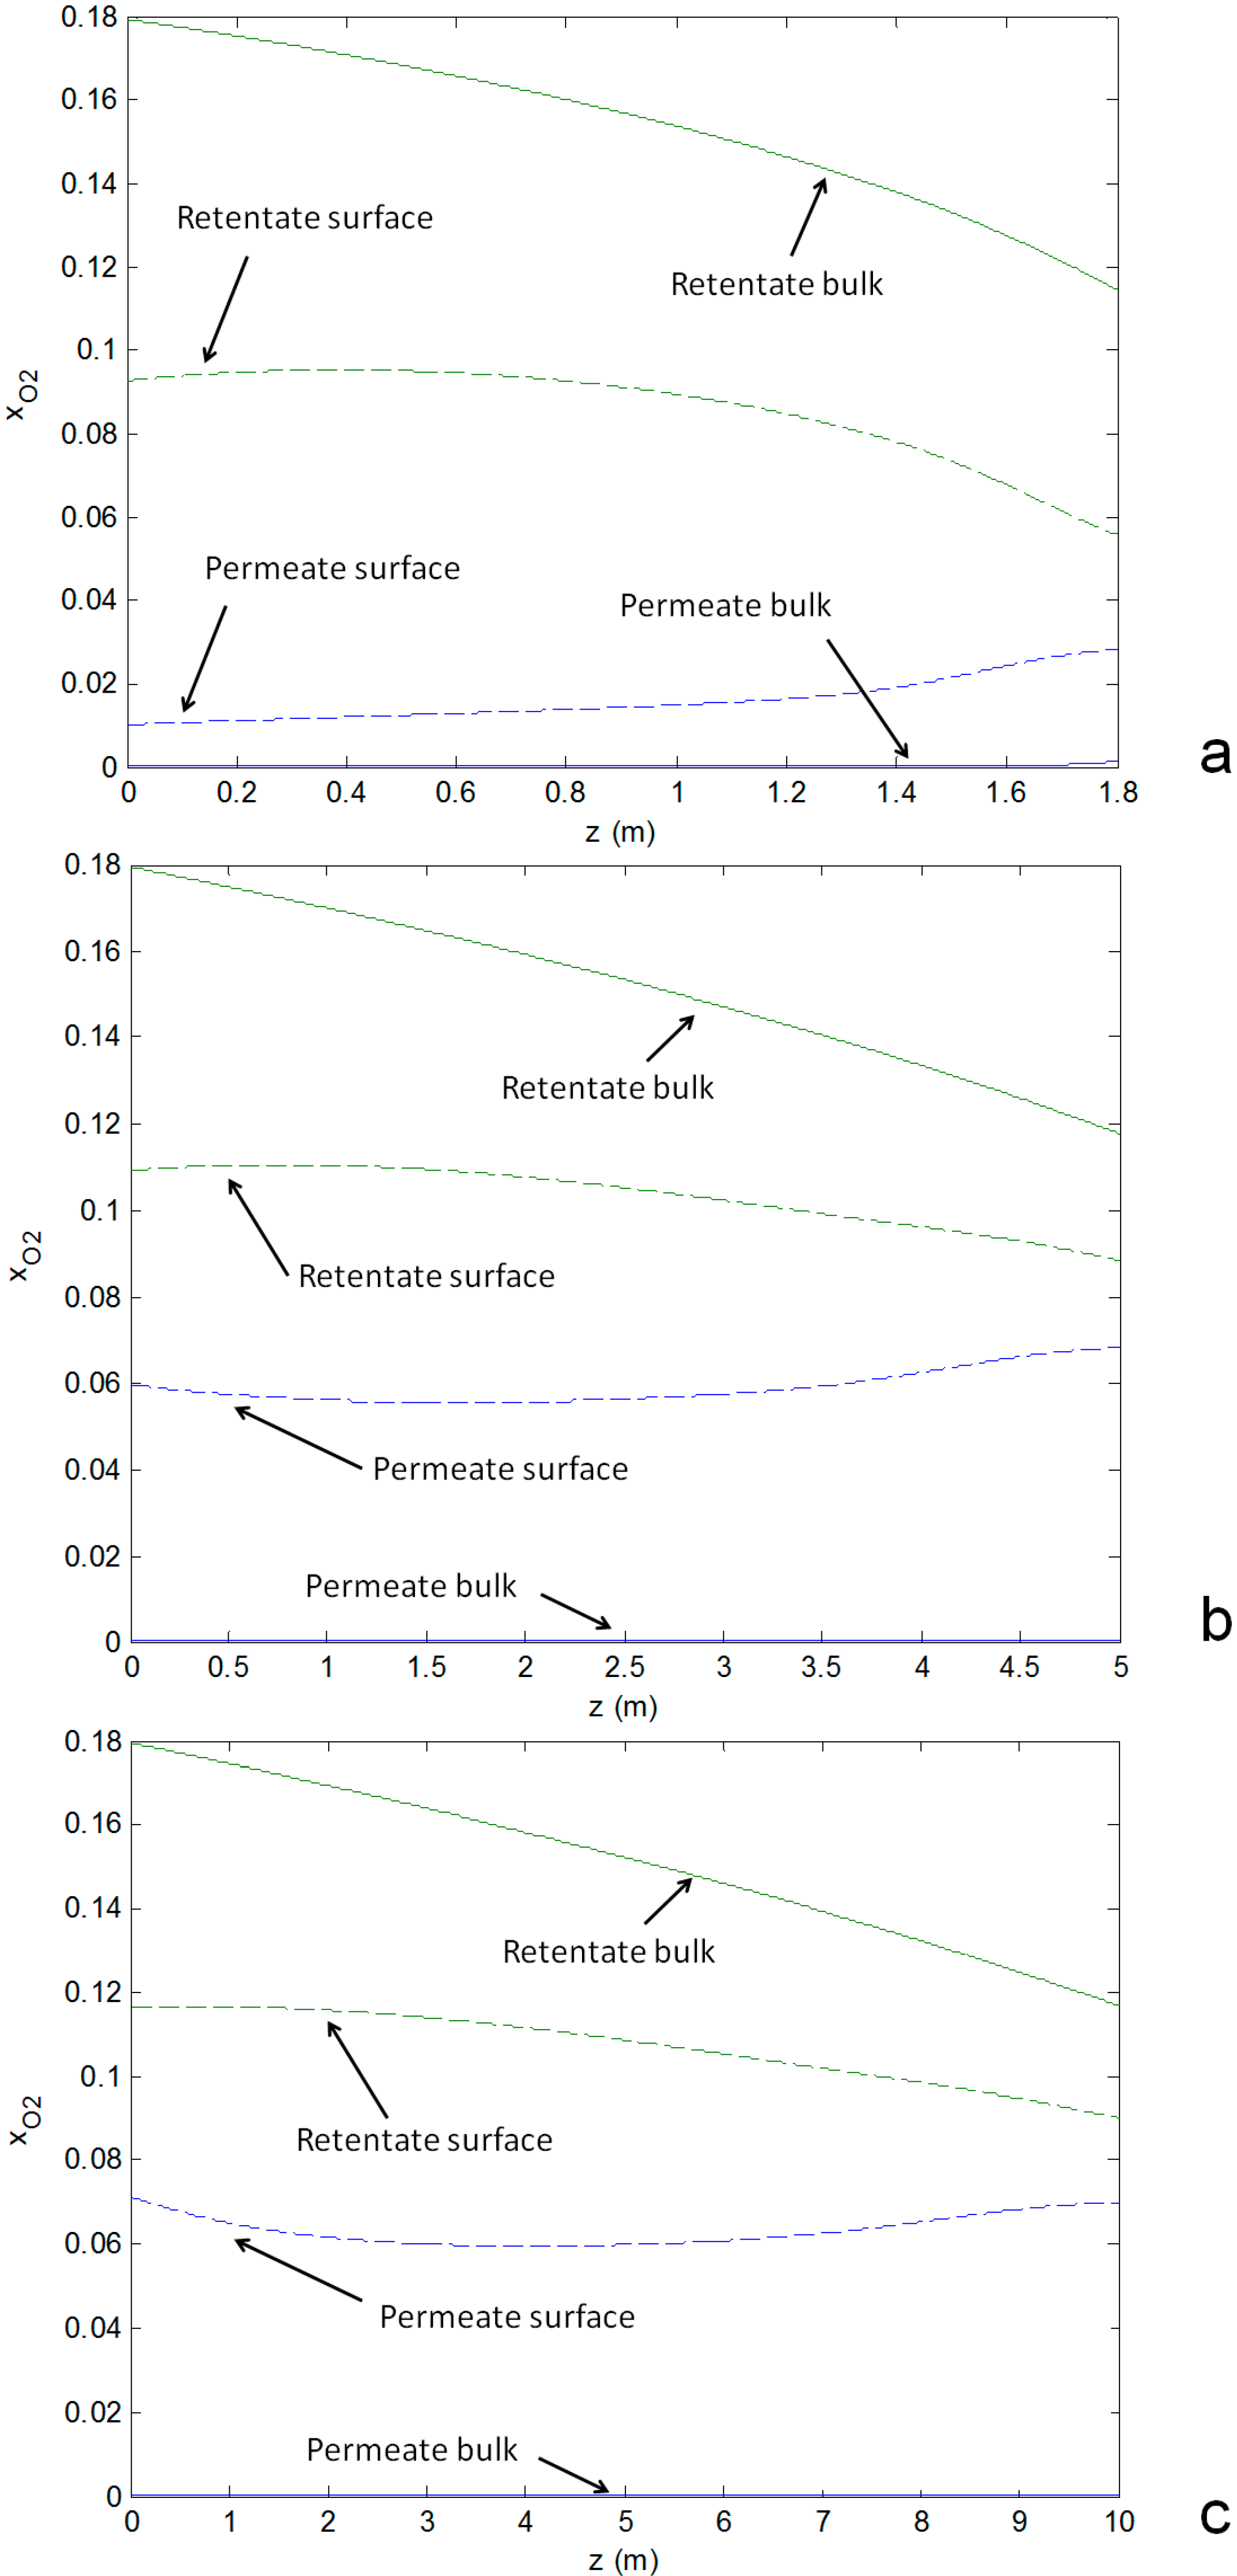
- Despite the larger membrane area by increasing the reactor volume and length, the permeated oxygen is substantially the same because of mass transfer limitations prevailing in the shell (permeate side): in the small reactor the difference of the O2 concentration between the retentate and permeate side is higher (Figure 7a) than in the other cases (Figure 7b,c) which corresponds to a higher O2 flux. In fact, at the permeate side the gas velocity decreases by increasing the reactor diameter and therefore the mass transfer coefficient decreases because of the decreased Reynolds number. A small difference occurs between the medium and big size of the reactor due to the similarities in the reactor geometry and total membrane area.

6. Conclusions
Acknowledgments
Author Contributions
Nomenclature and Abbreviations
| , | Membrane surface/reactor volume ratio for the fuel and air zone (m2/m3) |
| , | Total molar concentration in the fuel and air zone (mol/m3) |
| , | Molar concentration of the i-th species in the fuel and air zone (mol/m3) |
| , | Molar concentration of the i-th species at the membrane surface in the fuel and air zone (mol/m3) |
| , | Heat capacity in the fuel and air zone (J/mol/K) |
Diffusion coefficient of the i-th species in the gas mixture (m2/s) | |
Diameter of the membrane tubes (m) | |
Equivalent diameter of the fuel zone (m) | |
Particle diameter (m) | |
Specific enthalpy of the i-th species (J/mol) | |
| , | Wall-bulk mass transfer coefficient of the i-th species in the fuel and air zone (m/s) |
Oxygen flux through the membrane (mol/m2/s) | |
| , | Wall-bulk heat transfer coefficient in the fuel and air zone (W/m2/K) |
Kinetic constant of the i-th reaction | |
Equilibrium constant of the i-th reaction | |
Total pressure in the fuel zone (Pa) | |
Partial pressure of the i-th species (Pa) | |
| , | Partial pressure of the i-th species at the membrane surface in the fuel and air zone (Pa) |
| , | Prandtl number |
Rate of the i-th reaction (mol/kgcat/s) | |
Membrane radius (m) | |
Production rate of the i-th species (mol/m3/s) | |
| , | Reynolds number |
Reynolds number related to the catalyst particle | |
| , | Membrane outer and inner surface (m2) |
| , | Schmidt number |
| , | Absolute temperature in the fuel and air zone (K) |
| , | Absolute temperature at the membrane surface in the fuel and air zone (K) |
Global heat transfer coefficient (W/m2/K) | |
| , | Gas velocity in the fuel and air zone (m/s) |
| z | Axial reactor coordinate (m) |
| β | Compressor ratio |
Membrane thickness (m) | |
Bed porosity | |
| , | Thermal conductivity of the gas in the fuel and air zone (W/m/K) |
Thermal conductivity of the membrane (W/m/K) | |
Stoichiometric coefficient of the i-th species in the j-th reaction | |
Gas viscosity in the fuel area (Pa·s) | |
Catalyst particle density (kg/m3) | |
Gas density in the fuel area (kg/m3) |
Abbreviations
| ATR | Auto-thermal reforming |
| BSCF | Barium Strontium Cobalt Iron perovskites |
| DAE | differential and algebraic system |
| ECO | Economizer |
| EVA | Evaporator |
| GC | Gas chromatograph |
| HER | Heat exchanger reforming |
| LHV | Lower heating value |
| LP/HP | Low/High pressure |
| LT/HT | Low/High temperature |
| LSCF | Lanthanum Strontium Cobalt Iron perovskites |
| MFC | Mass flow controller |
| MIEC | Mixed ionic electronic conducting |
| MR | Membrane reactor |
| NIST | National Institute of Standards and Technology |
| NG | Natural gas |
| O/C | oxygen-to-carbon ratio |
| OTM | Oxygen transport membrane |
| POX | Methane partial oxidation |
| PSA | Pressure swing adsorption |
| REG | Regenerative |
| S/C | steam-to-carbon ratio |
| SH | Superheater |
| SMR | Steam methane reforming |
| TC | Thermocouple |
| TIT | Turbine inlet temperature |
| WGS | Water gas shift |
Conflicts of Interest
References
- Rostrup-Nielsen, J. New aspects of syngas production and use. Catal. Today 2000, 63, 159–164. [Google Scholar] [CrossRef]
- Dunn, S. Hydrogen futures: Toward a sustainable energy system. Int. J. Hydrogen Energy 2002, 27, 235–264. [Google Scholar] [CrossRef]
- Ball, M.; Wietschel, M. The future of hydrogen–opportunities and challenges. Int. J. Hydrogen Energy 2009, 34, 615–627. [Google Scholar] [CrossRef]
- Ogden, J. Review of small stationary reformers for hydrogen production; IEA: Princeton, NJ, USA, 2001; p. 52. [Google Scholar]
- Beysel, G. Enhanced Cryogenic Air Separation A Proven Process Applied to Oxyfuel: Future Prospects. In Presented at 1st Oxyfuel Combustion Conference, Cottbus, Germany, 8 September 2009.
- Smith, A.; Klosek, J. A review of air separation technologies and their integration with energy conversion processes. Fuel Process. Technol. 2001, 70, 115–134. [Google Scholar] [CrossRef]
- Sunarso, J.; Baumann, S.; Serra, J.M.; Meulenberg, W.A.; Liu, S.; Lin, Y.S.; Diniz da Costa, J.C. Mixed ionic–electronic conducting (MIEC) ceramic-based membranes for oxygen separation. J. Membr. Sci. 2008, 320, 13–41. [Google Scholar] [CrossRef]
- Bose, A.C. Inorganic Membranes for Energy and Environmental Applications; Springer: Pittsburgh, PA, USA, 2009; p. 318. [Google Scholar]
- Han, J.; Zeng, Y.; Lin, Y.S. Oxygen permeation through fluorite-type bismuth-yttrium-copper oxide membranes. J. Membr. Sci. 1997, 132, 235–243. [Google Scholar] [CrossRef]
- Engels, S.; Beggel, F.; Modigell, M.; Stadler, H. Simulation of a membrane unit for oxyfuel power plants under consideration of realistic BSCF membrane properties. J. Membr. Sci. 2010, 359, 93–101. [Google Scholar] [CrossRef]
- Pinacci, P.; Louradour, E.; Wimbert, L.; Gindrat, M.; Jarligo, M.O.; Vassen, R.; Comite, A.; Serra, J.M.; Jewulski, J.; Mancuso, L.; et al. Dense Membranes for Oxygen and Hydrogen Separation (DEMOYS): Project Overview and First Results. Energy Procedia 2013, 37, 1030–1038. [Google Scholar] [CrossRef]
- IEA GHG. Oxy Combustion Processes for CO2 Capture from Power Plant. Report Number 2005/9; Mitsui Babcock: Renfrew, UK, 2005. [Google Scholar]
- Wilson, J.; Christie, M.; Degenstein, N.; Shah, M.; Li, J. OTM Based Oxy-fuel Combustion for CO2 Capture. In Proceedings of the 34th International Technical Conference on Clean Coal & Fuel Systems, Clearwater, FL, USA, 31 May–4 June 2009.
- Romano, M.C.; Chiesa, P.; Lozza, G. Pre-combustion CO2 capture from natural gas power plants, with ATR and MDEA processes. Int. J. Greenh. Gas. Control. 2010, 4, 785–797. [Google Scholar] [CrossRef]
- Chiesa, P.; Romano, M.C.; Spallina, V.; Turi, D.M.; Mancuso, L. Efficient low CO2 emissions power generation by mixed conducting membranes. Energ. Procedia 2013, 37, 905–913. [Google Scholar] [CrossRef]
- Gallucci, F.; Annaland, M.; Kuipers, J. Autothermal reforming of methane with integrated CO2 capture in a novel fluidized bed membrane reactor. Part 1: Experimental demonstration. Top. Catal. 2008, 51, 133–145. [Google Scholar] [CrossRef]
- Gallucci, F.; Annaland, M.; Kuipers, J. Autothermal reforming of methane with integrated CO2 capture in a novel fluidized bed membrane reactor. Part 2 comparison of reactor configurations. Top. Catal. 2008, 51, 146–157. [Google Scholar] [CrossRef]
- Liu, S.; Tan, X.; Li, K.; Hughes, R. Methane Coupling Using Catalytic Membrane Reactors. Catal. Rev. 2001, 43, 147–198. [Google Scholar] [CrossRef]
- Hüppmeier, J.; Barg, S.; Baune, M.; Koch, D.; Grathwohl, G.; Thöming, J. Oxygen feed membranes in autothermal steam-reformers—A robust temperature control. Fuel 2010, 89, 1257–1264. [Google Scholar] [CrossRef]
- Kang, J.Y.; Kang, D.W.; Kim, T.S.; Hur, K.B. Comparative economic analysis of gas turbine-based power generation and combined heat and power systems using biogas fuel. Energy 2014, 67, 309–318. [Google Scholar] [CrossRef]
- Pilavachi, P.A. Mini- and micro-gas turbines for combined heat and power. Appl. Therm. Eng. 2002, 22, 2003–2014. [Google Scholar] [CrossRef]
- Technology Characterization: Microturbines; EPA report; EPA: Arlington, VA, USA, 2008.
- Mansouri Majoumerd, M.; Nikpey Somehsaraei, H.; Assadi, M.; Breuhaus, P. Micro gas turbine configurations with carbon capture—Performance assessment using a validated thermodynamic model. Appl. Therm. Eng. 2014, 73, 172–184. [Google Scholar] [CrossRef]
- Di Felice, L.; Middelkoop, V.; Anzoletti, V.; Snijkers, F.; van Sint Annaland, M.; Gallucci, F. New high temperature sealing technique and permeability data for hollow fiber BSCF perovskite membranes. Chem. Eng. Process. Process. Intensif. 2014. [Google Scholar] [CrossRef]
- McCabe, W.L.; Smith, J.; Harriott, P. Unit operations of Chemical Engineering, 5th ed.; McGraw-Hill: Singapore, 1993; p. 668. [Google Scholar]
- Dissanayake, D.; Rosynek, M.; Kharas, K.C.C.; Lunsford, J.H.J. Partial Oxidation of Methane to Carbon Monoxide and Hydrogen over a Ni/Al2O3 Catalyst. J. Catal. 1991, 132, 117–127. [Google Scholar] [CrossRef]
- De Groote, A.M.; Froment, G.F. Simulation of the catalytic partial oxidation of methane to synthesis gas. Appl. Catal. A Gen. 1996, 138, 245–264. [Google Scholar] [CrossRef]
- De Smet, C.R.H.; de Croon, M.H.J.M.; Berger, R.J.; Marin, G.B.; Schouten, J.C. Design of adiabatic fixed-bed reactors for the partial oxidation of methane to synthesis gas. Application to production of methanol and hydrogen-for-fuel-cells. Chem. Eng. Sci. 2001, 56, 4849–4861. [Google Scholar] [CrossRef]
- Trimm, D.L.; Lam, C.W. The combustion of methane on platinum-alumina fibre catalysts—I. Kinetics and mechanism. Chem. Eng. Sci. 1980, 35, 1405–1413. [Google Scholar] [CrossRef]
- Numaguchi, T.; Kikuchi, K. Intrinsic kinetics and design simulation in a complex reaction network: Steam-methane reforming. Chem. Eng. Sci. 1988, 43, 2295–2301. [Google Scholar] [CrossRef]
- Li, C.; Finlayson, B. Heat transfer in packed beds—A reevaluation. Chem. Eng. Sci. 1977, 32, 1055–1066. [Google Scholar] [CrossRef]
- Perry, R.H.; Green, D.W.; Maloney, J.O. Perry’s Chemical Engineers’ Handbook, 7th ed.; McGraw-Hill: New York, NY, United States, 1997; pp. 5–16. [Google Scholar]
- NIST Chemistry WebBook. Available online: http://www.nist.gov (accessed on 6 August 2014).
- Xu, S.J.; Thomson, W.J. Oxygen permeation rates through ion-conducting perovskite membranes. Chem. Eng. Sci. 1999, 54, 3839–3850. [Google Scholar] [CrossRef]
- Hong, J.; Kirchen, P.; Ghoniem, A.F. Numerical simulation of ion transport membrane reactors: Oxygen permeation and transport and fuel conversion. J. Membr. Sci. 2012, 407–408, 71–85. [Google Scholar] [CrossRef]
- Olsson, H.; Rudbeck, P.; Andersen, K. Adding Hydrogen Production Capacity by Heat Exchange Reforming. In Proceedings of the Conference XIV Refinery Technology Meet (RTM) on Energy & Environment Challenges for the Hydrocarbon Sector, Kovalam, India, 20–22 September 2007.
- Manzolini, G.; Macchi, E.; Binotti, M.; Gazzani, M. Integration of SEWGS for carbon capture in Natural Gas Combined Cycle. Part B: Reference case comparison. Int. J. Greenh. Gas. Control. 2011, 5, 214–225. [Google Scholar] [CrossRef]
- Rosfjord, T.; Manager, P.; Chen, A.; Mulugeta, J.; Bhatia, T. Advanced Microturbine Systems Final Report DOE/CH/11060–1; DOE: East Hartford, CT, USA, 2007; p. 155.
- European best practice guidelines for assessment of CO2 capture technologies. Available online: http://www.energia.polimi.it/news/D%204_9%20best%20practice%20guide.pdf (accessed on 11 September 2014).
- Visser, W.P.J.; Shakariyants, S.A.; Oostveen, M. Development of a 3 kW Microturbine for CHP Applications. J. Eng. Gas. Turbines Power 2011, 133, 042301. [Google Scholar] [CrossRef]
- Martínez, I.; Romano, M.C.; Chiesa, P.; Grasa, G.; Murillo, R. Hydrogen production through sorption enhanced steam reforming of natural gas: Thermodynamic plant assessment. Int. J. Hydrogen Energ. 2013, 38, 15180–15199. [Google Scholar] [CrossRef]
- Khunpolgrang, J.; Yosantea, S.; Kongnoo, A.; Phalakornkule, C. Alternative PSA process cycle with combined vacuum regeneration and nitrogen purging for CH4/CO2 separation. Fuel 2015, 140, 171–177. [Google Scholar] [CrossRef]
© 2015 by the authors. Licensee MDPI, Basel, Switzerland. This article is an open access article distributed under the terms and conditions of the Creative Commons Attribution license ( http://creativecommons.org/licenses/by/4.0/).
Share and Cite
Spallina, V.; Melchiori, T.; Gallucci, F.; Van Sint Annaland, M. Auto-Thermal Reforming Using Mixed Ion-Electronic Conducting Ceramic Membranes for a Small-Scale H2 Production Plant. Molecules 2015, 20, 4998-5023. https://doi.org/10.3390/molecules20034998
Spallina V, Melchiori T, Gallucci F, Van Sint Annaland M. Auto-Thermal Reforming Using Mixed Ion-Electronic Conducting Ceramic Membranes for a Small-Scale H2 Production Plant. Molecules. 2015; 20(3):4998-5023. https://doi.org/10.3390/molecules20034998
Chicago/Turabian StyleSpallina, Vincenzo, Tommaso Melchiori, Fausto Gallucci, and Martin Van Sint Annaland. 2015. "Auto-Thermal Reforming Using Mixed Ion-Electronic Conducting Ceramic Membranes for a Small-Scale H2 Production Plant" Molecules 20, no. 3: 4998-5023. https://doi.org/10.3390/molecules20034998