
Novel All Trans-Retinoic Acid Derivatives: Cytotoxicity, Inhibition of Cell Cycle Progression and Induction of Apoptosis in Human Cancer Cell Lines


Abstract
:
1. Introduction
2. Results and Discussion
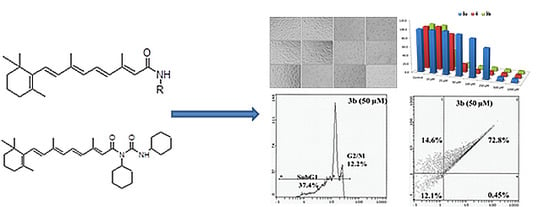
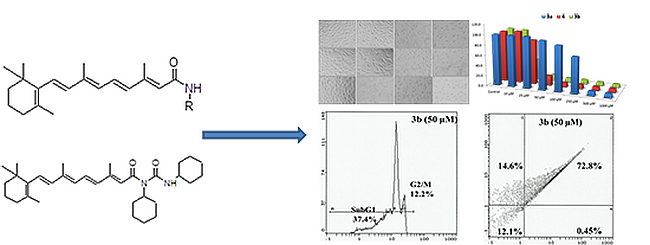
2.1. Chemistry

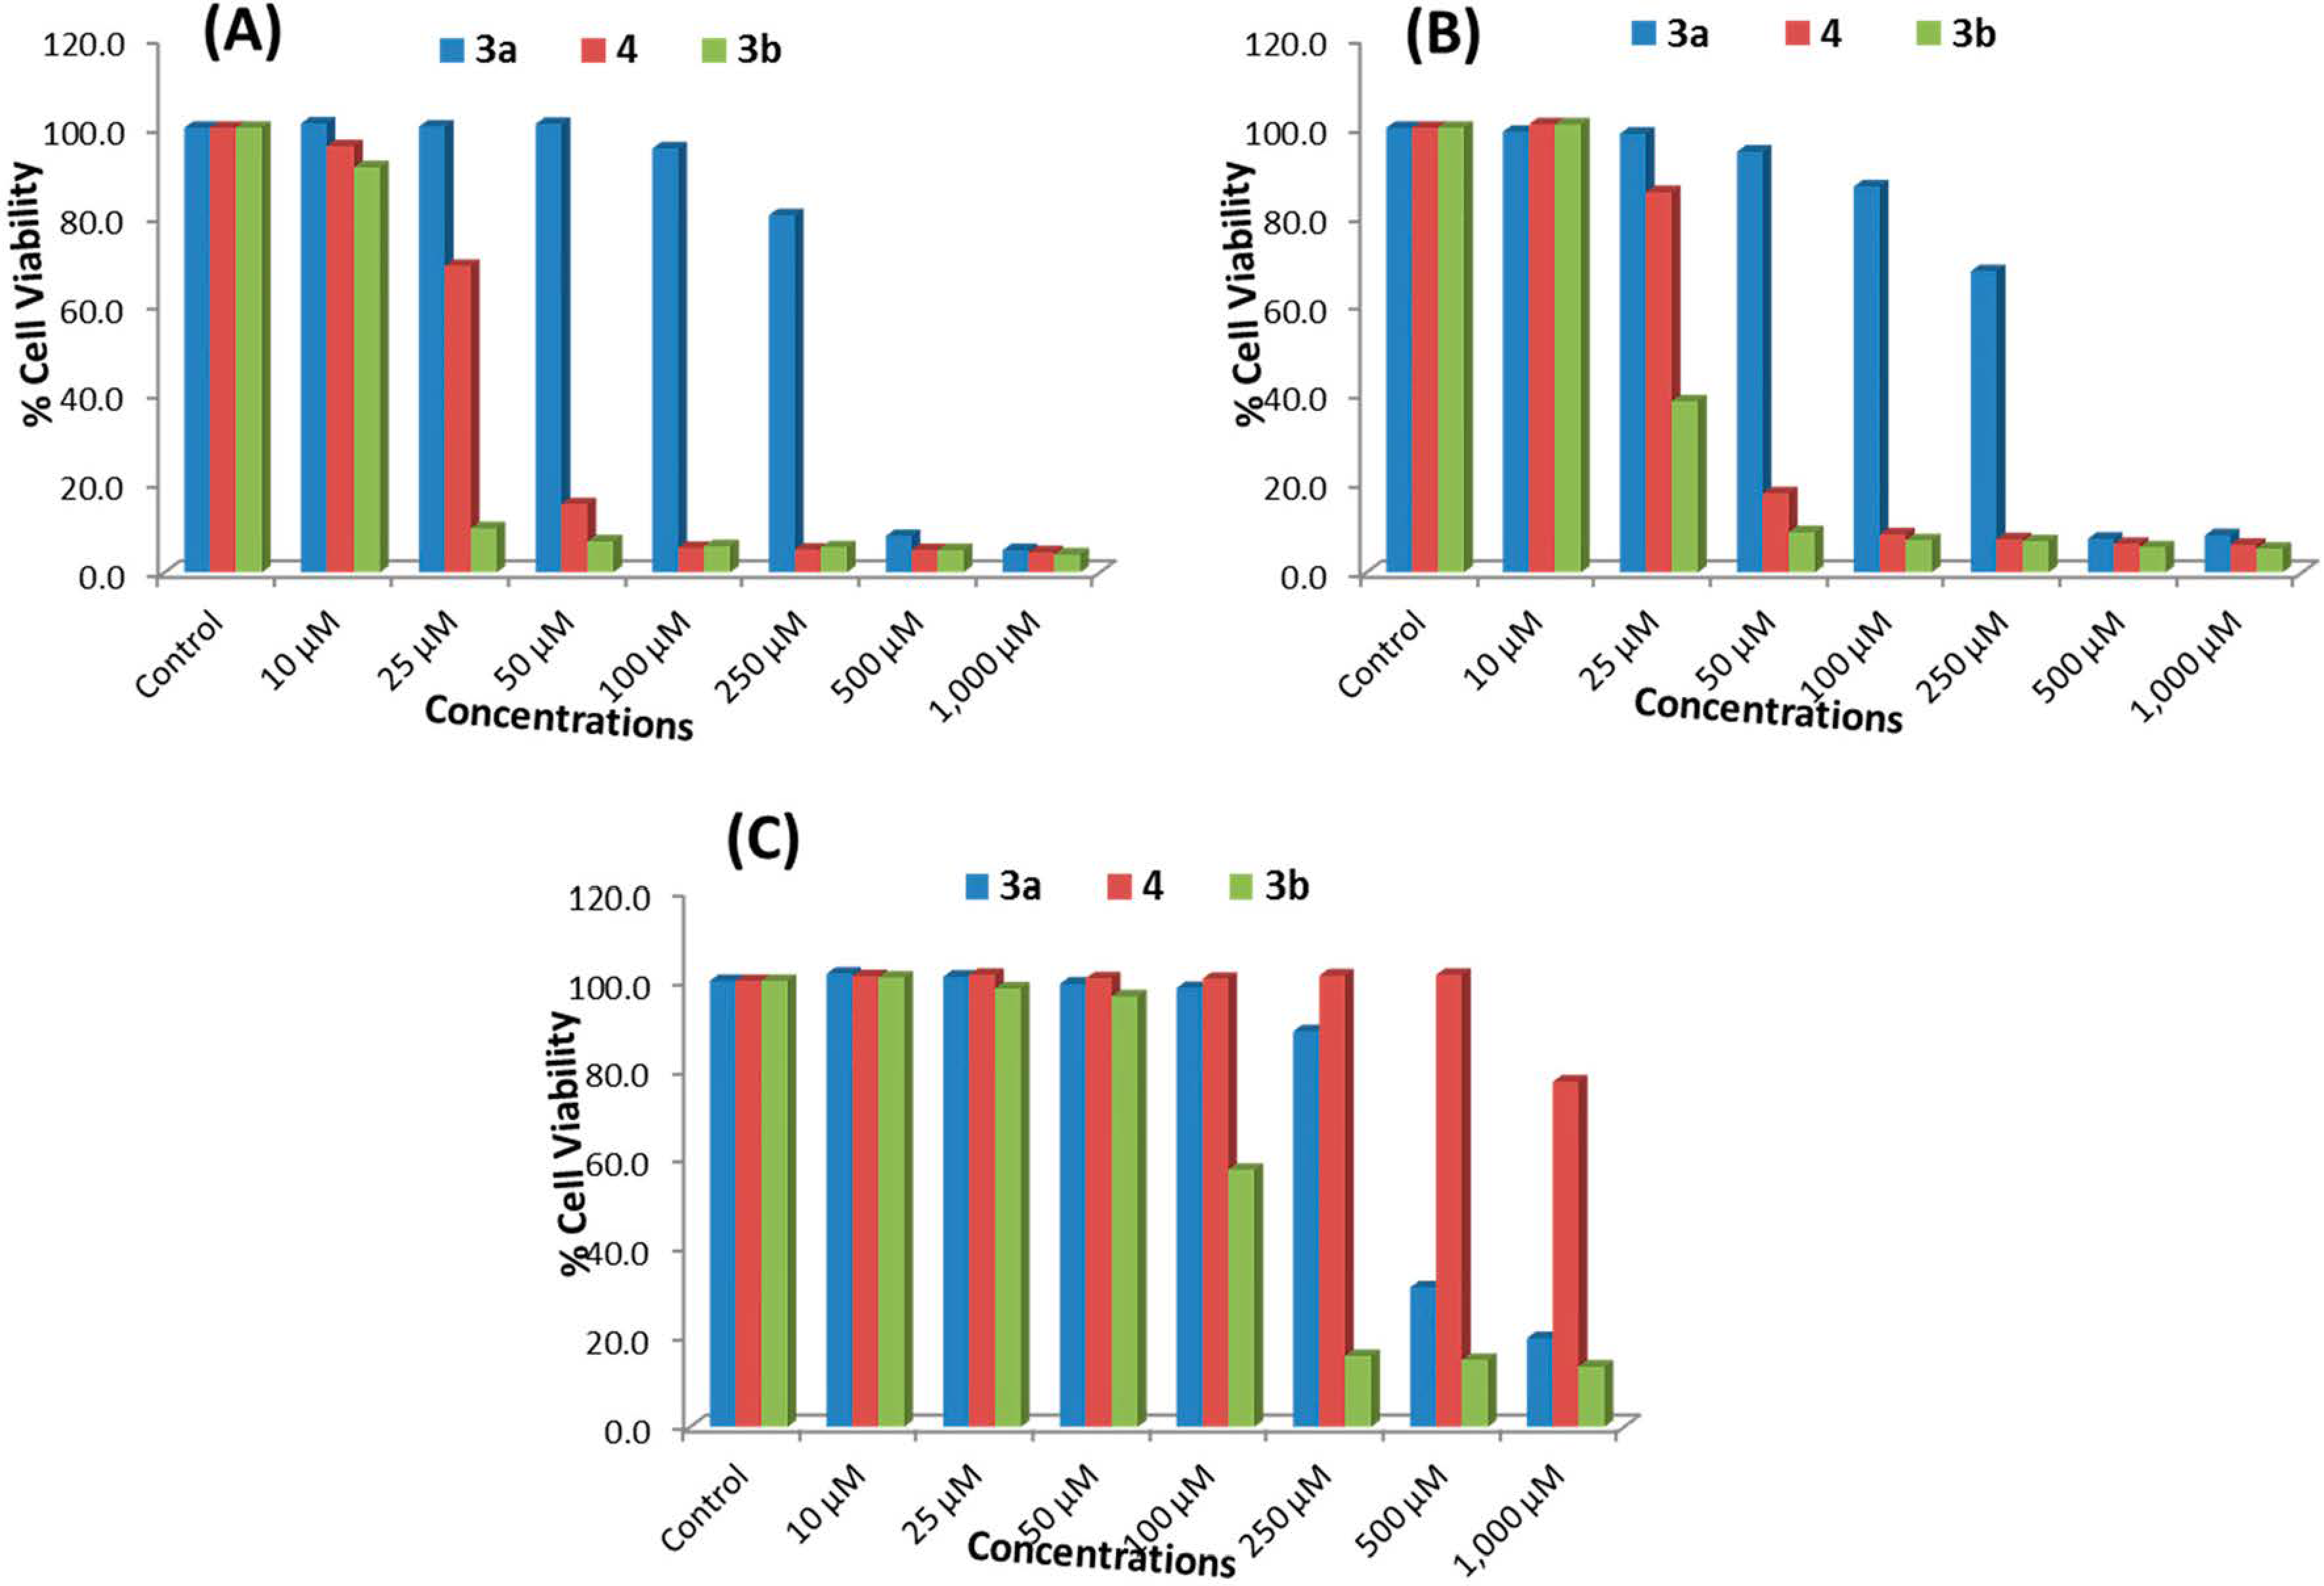
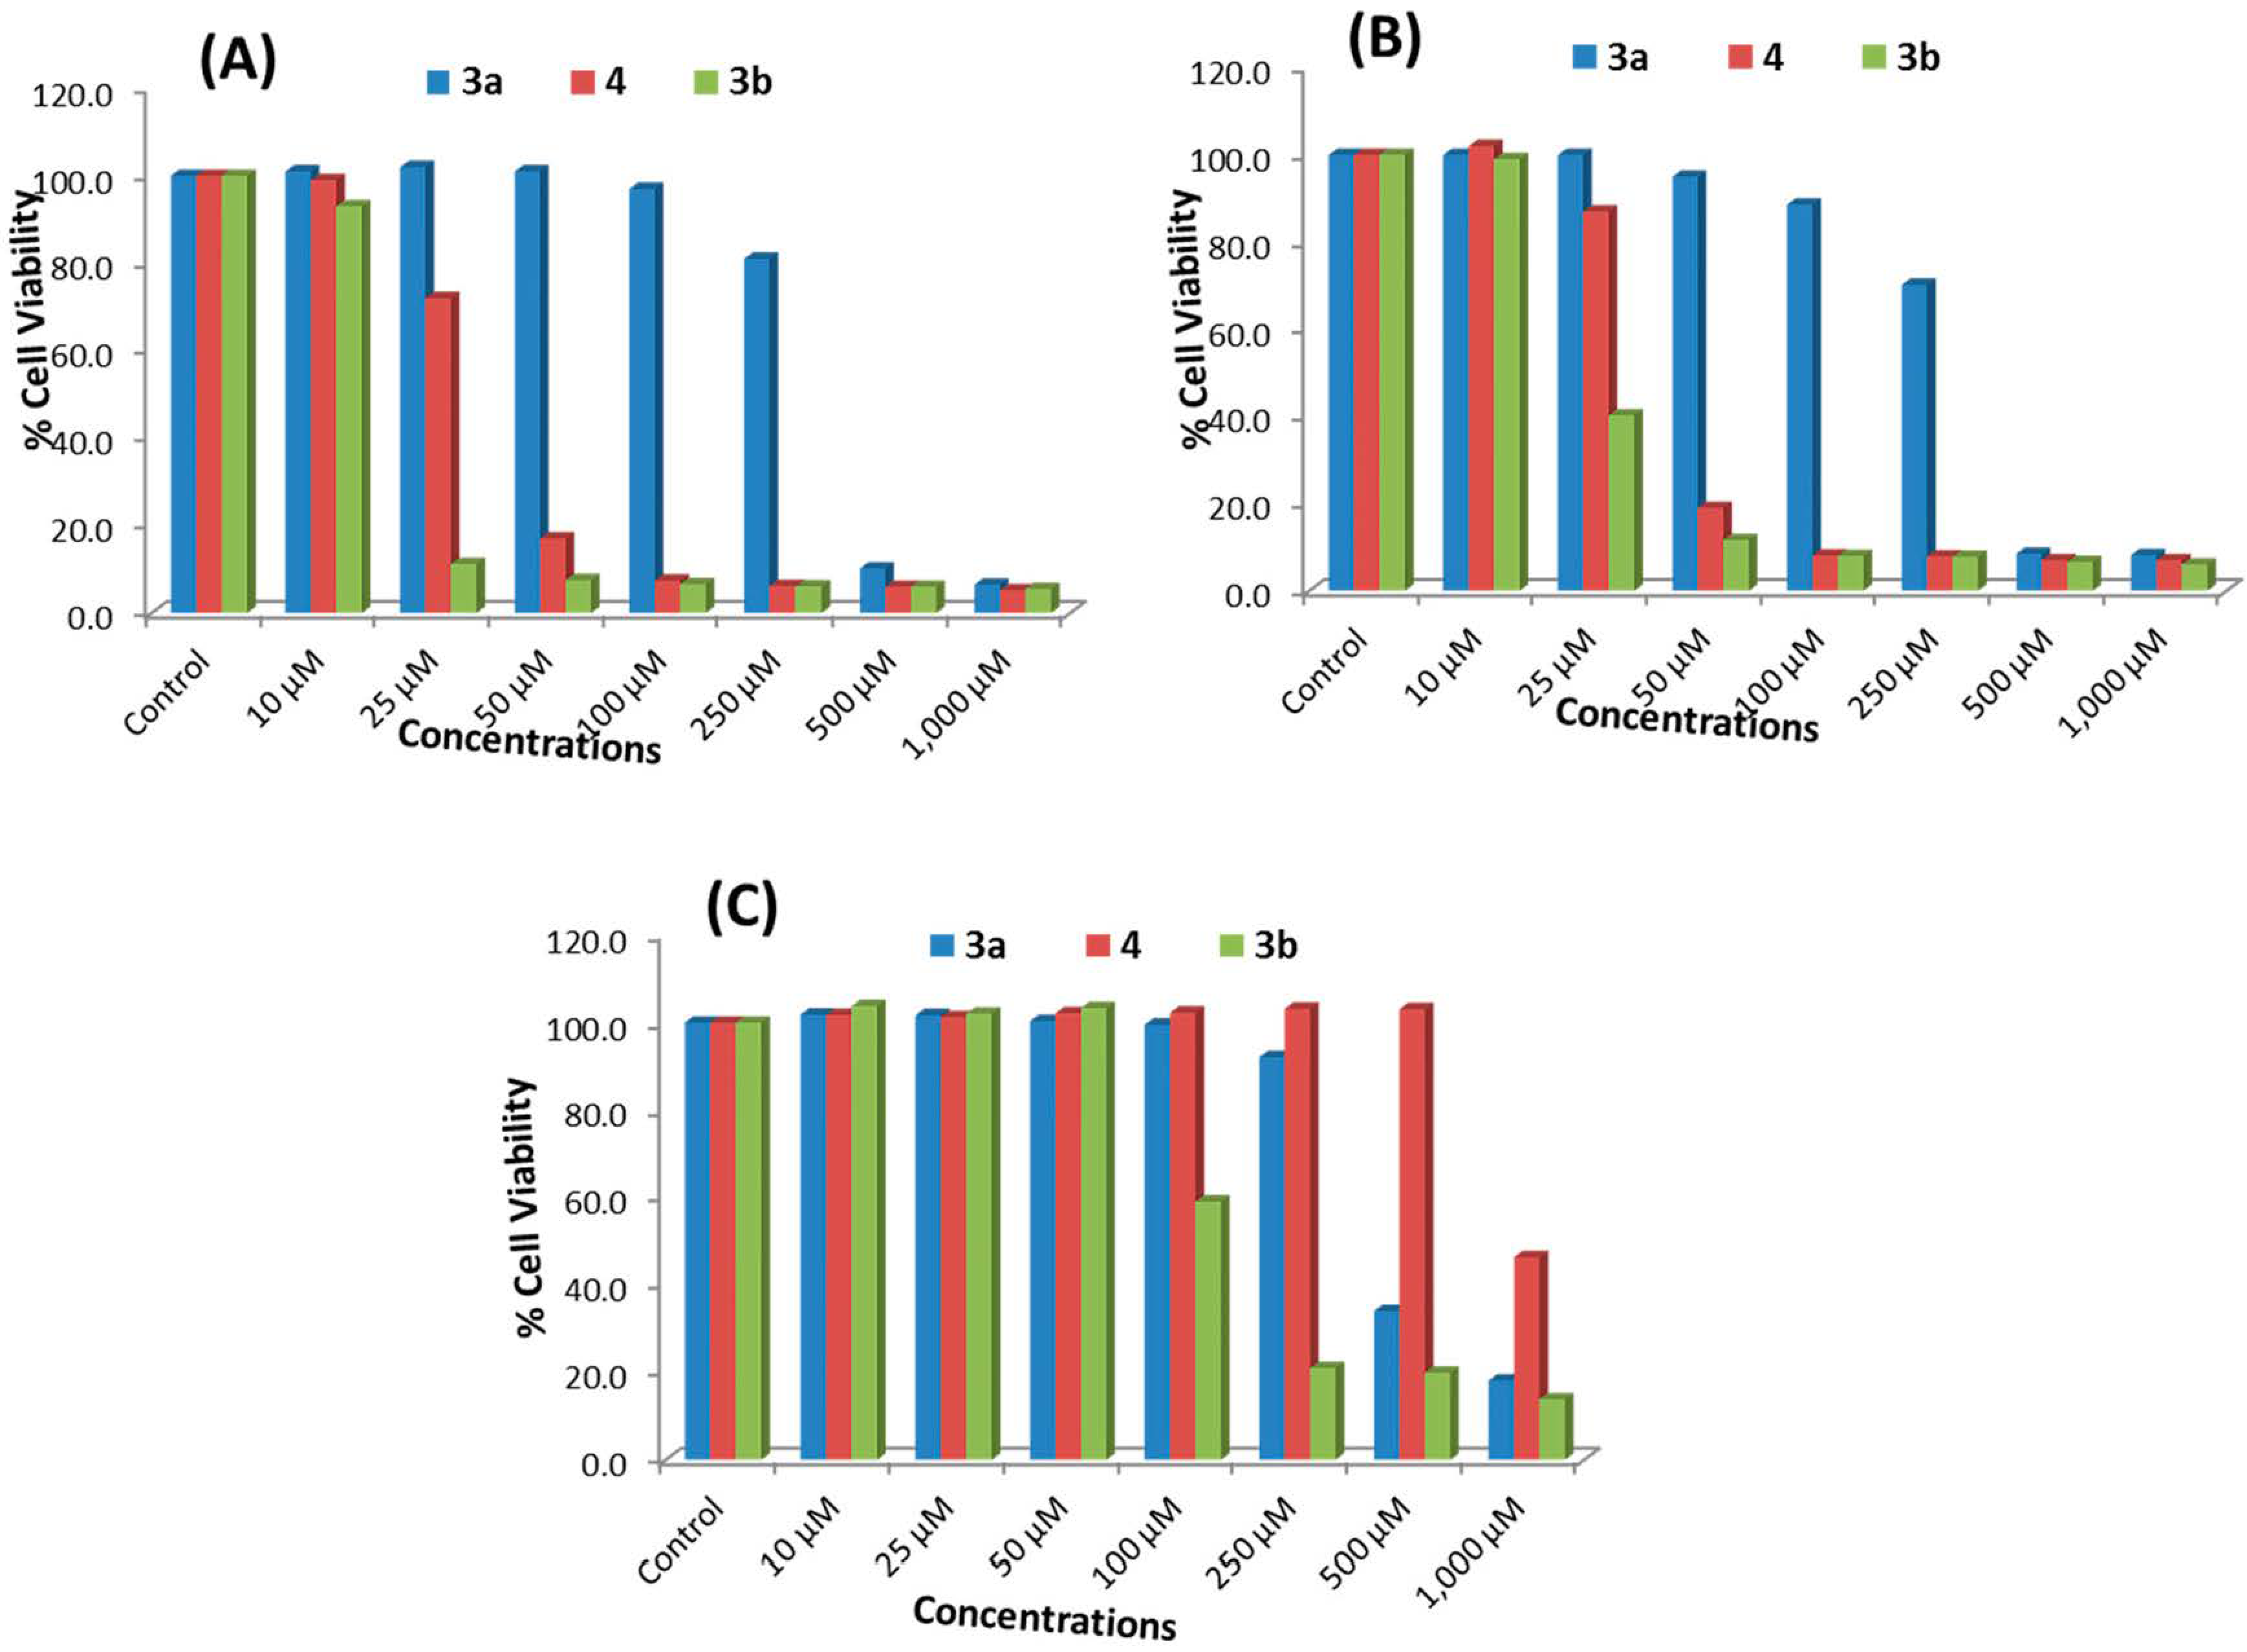
2.2. Cytotoxicity
2.2.1. MTT Assay

| Concentrations of ATRA | MCF-7 Cells | HepG2 Cells | HEK293 Cells |
|---|---|---|---|
| Control | 100 ± 5.0 | 100 ± 1.6 | 100 ± 4.0 |
| 10 μM | 104.0 ± 7.6 | 105.2 ± 1.7 | 102.6 ± 5.6 |
| 25 μM | 99.0 ± 2.4 | 102.5 ± 4.3 | 102.2 ± 4.0 |
| 50 μM | 97.0 ± 4.3 | 101.2 ± 3.2 | 100.2 ± 3.6 |
| 100 μM | 93.9 ± 7.4 | 98.2 ± 3.4 | 99.1 ± 4.2 |
| 250 μM | 90.5 ± 2.9 | 97.6 ± 2.2 | 97.2 ± 2.5 |
| 500 μM | 86.8 ± 5.0 | 95.2 ± 6.0 | 98.4 ± 3.4 |
| 1000 μM | 83.0 ± 5.8 | 91.9 ± 2.3 | 94.6 ± 4.9 |

2.2.2. NRU Assay

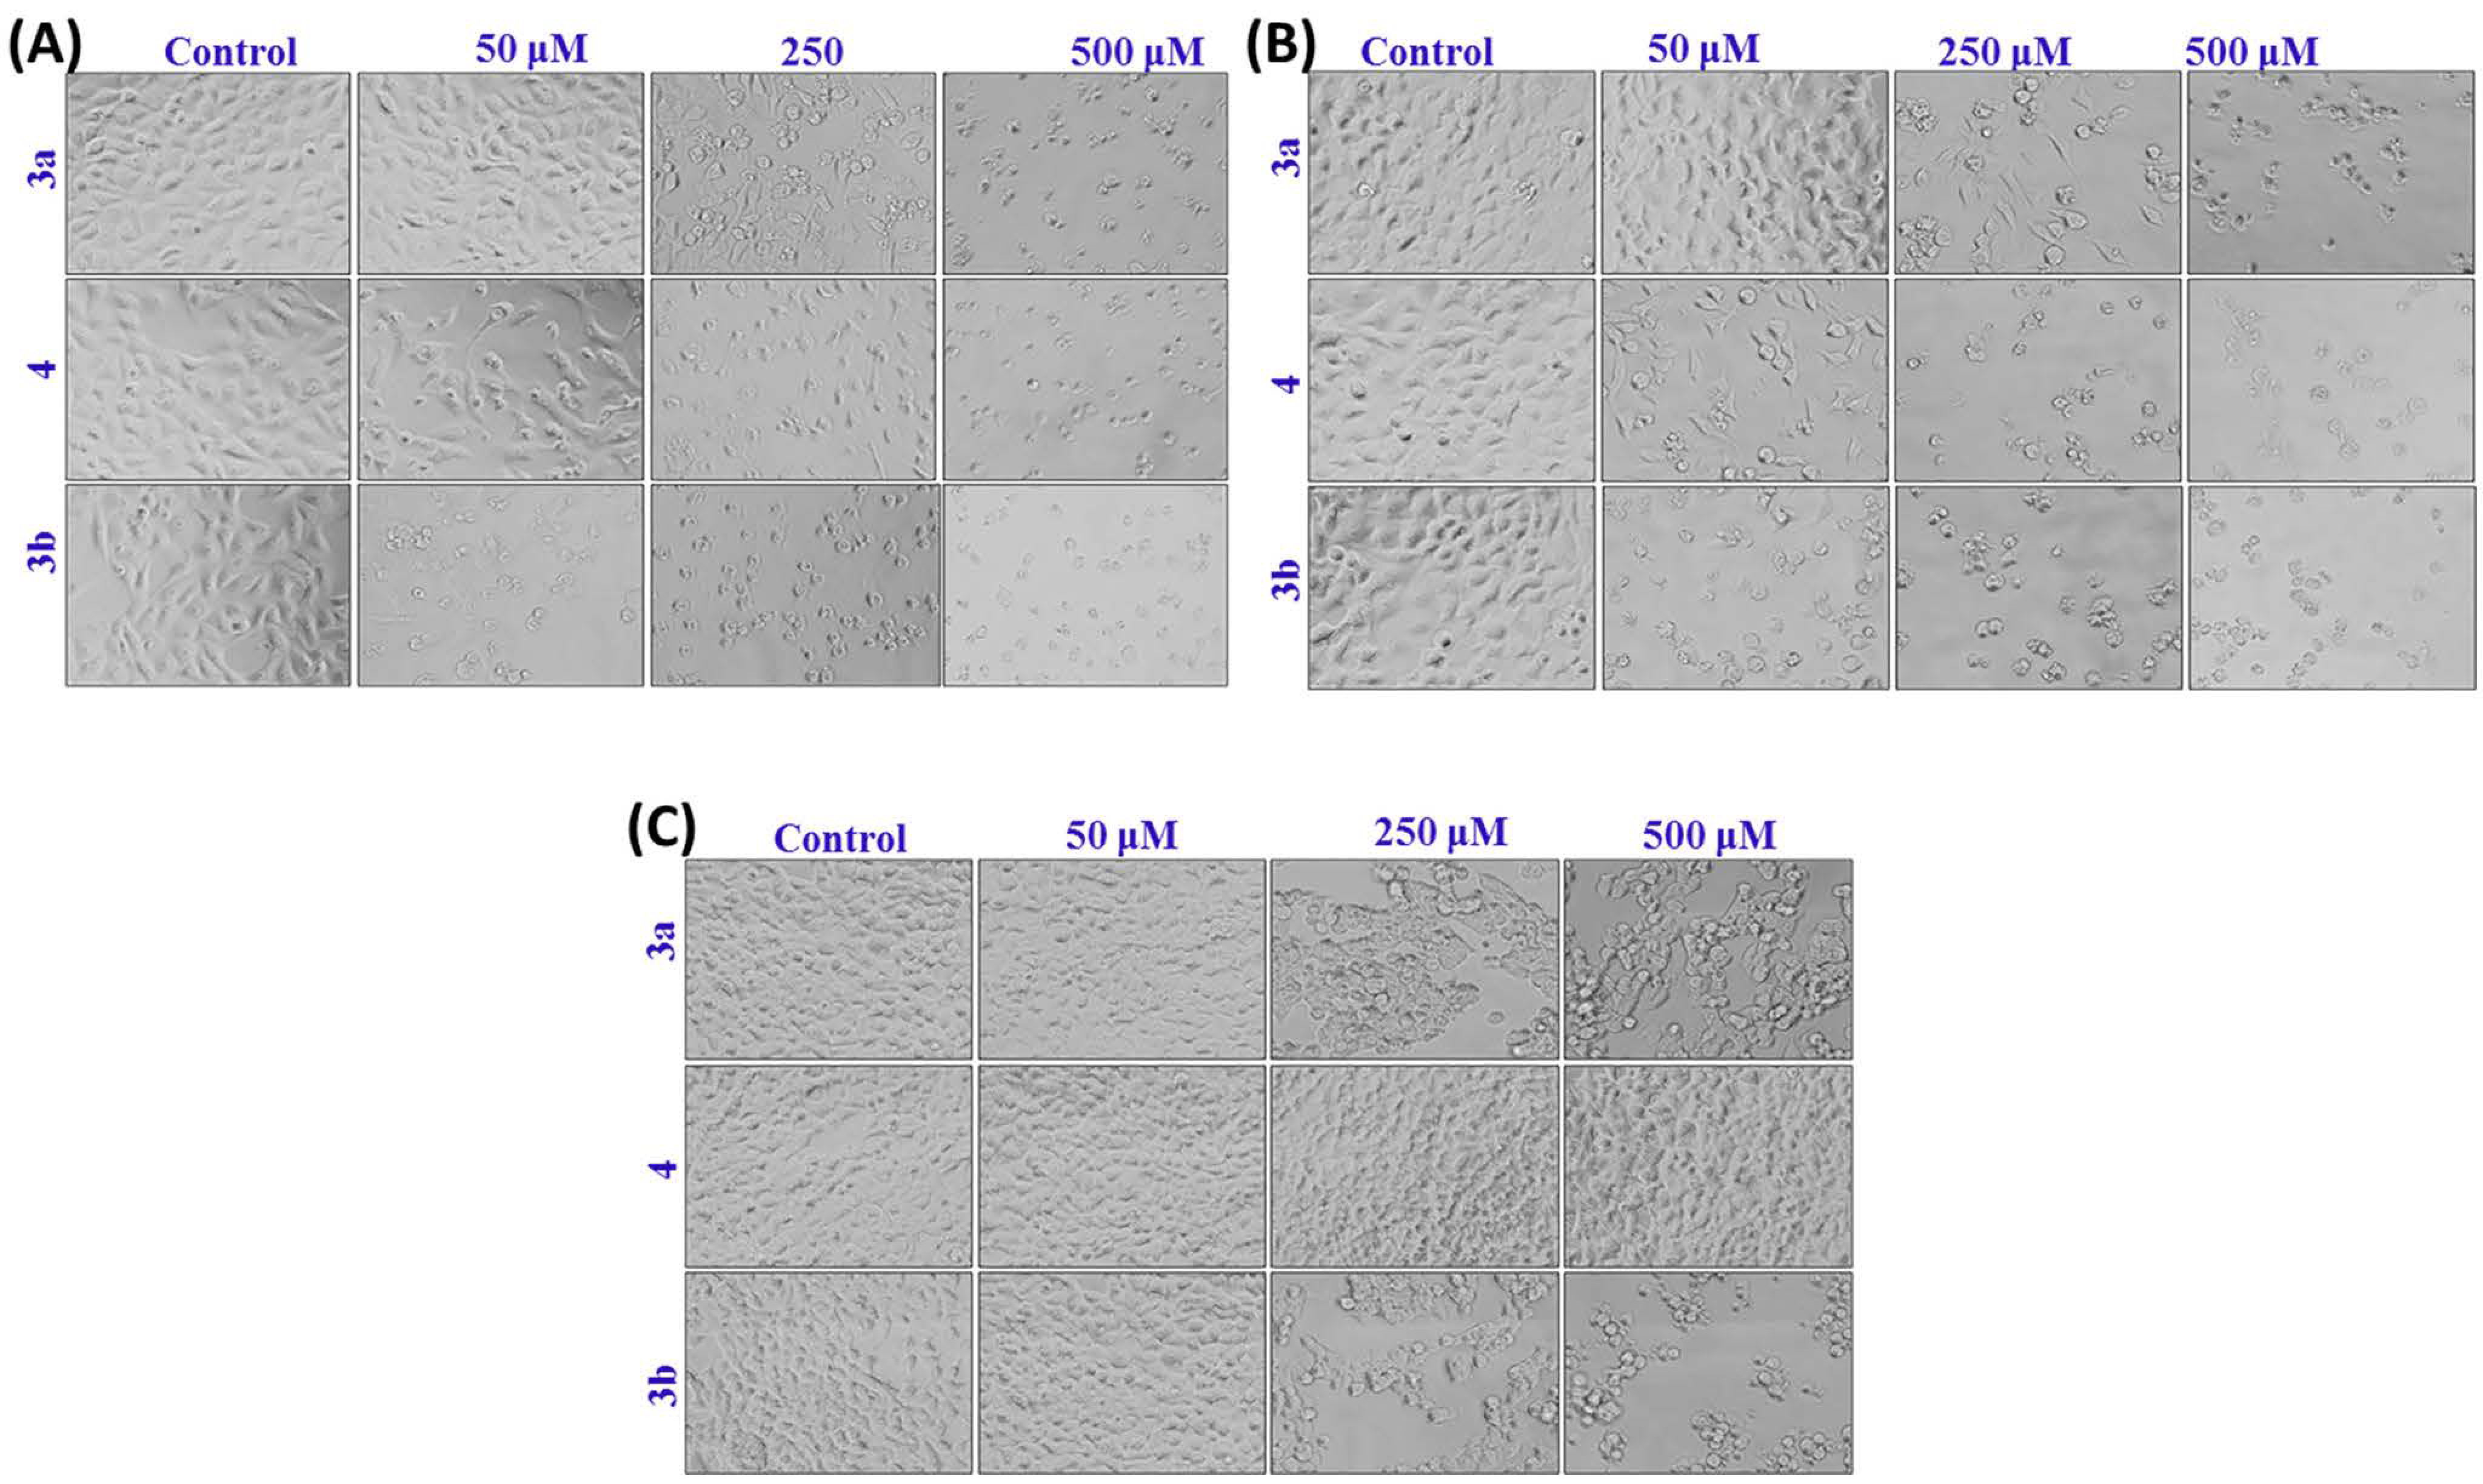
2.3. Morphological Analysis in MCF-7, HepG2 and HEK293 Cells

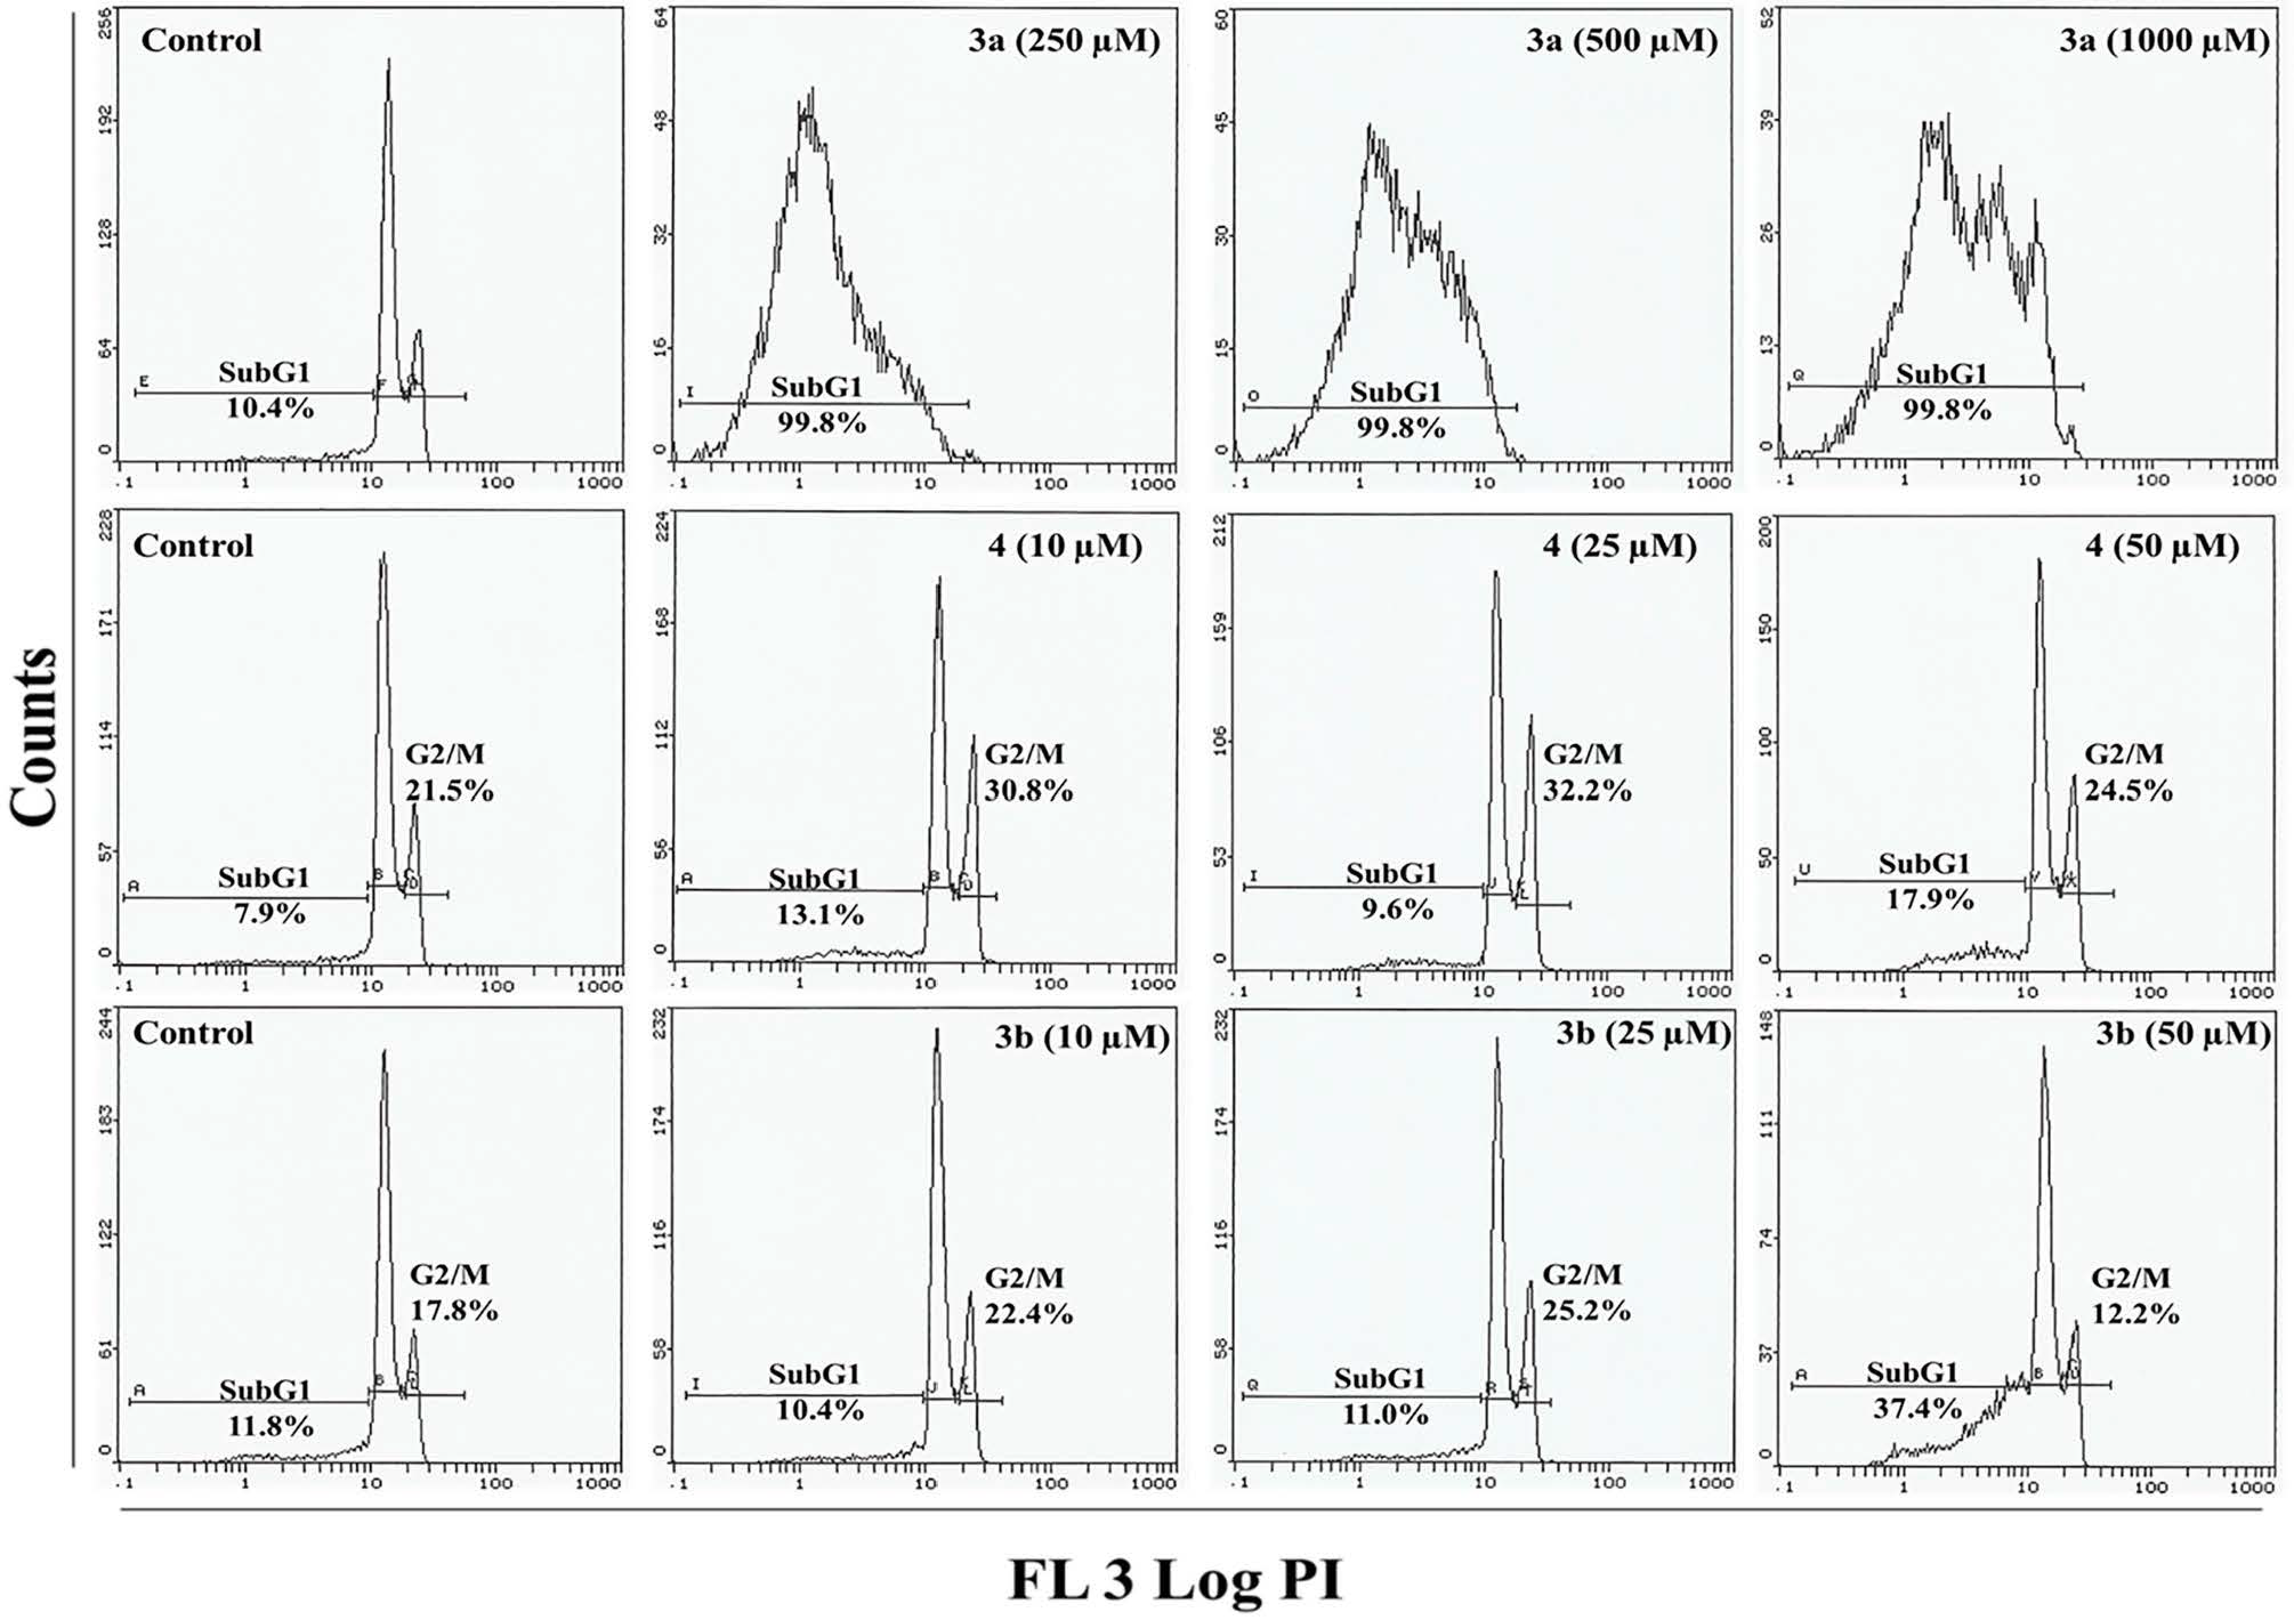
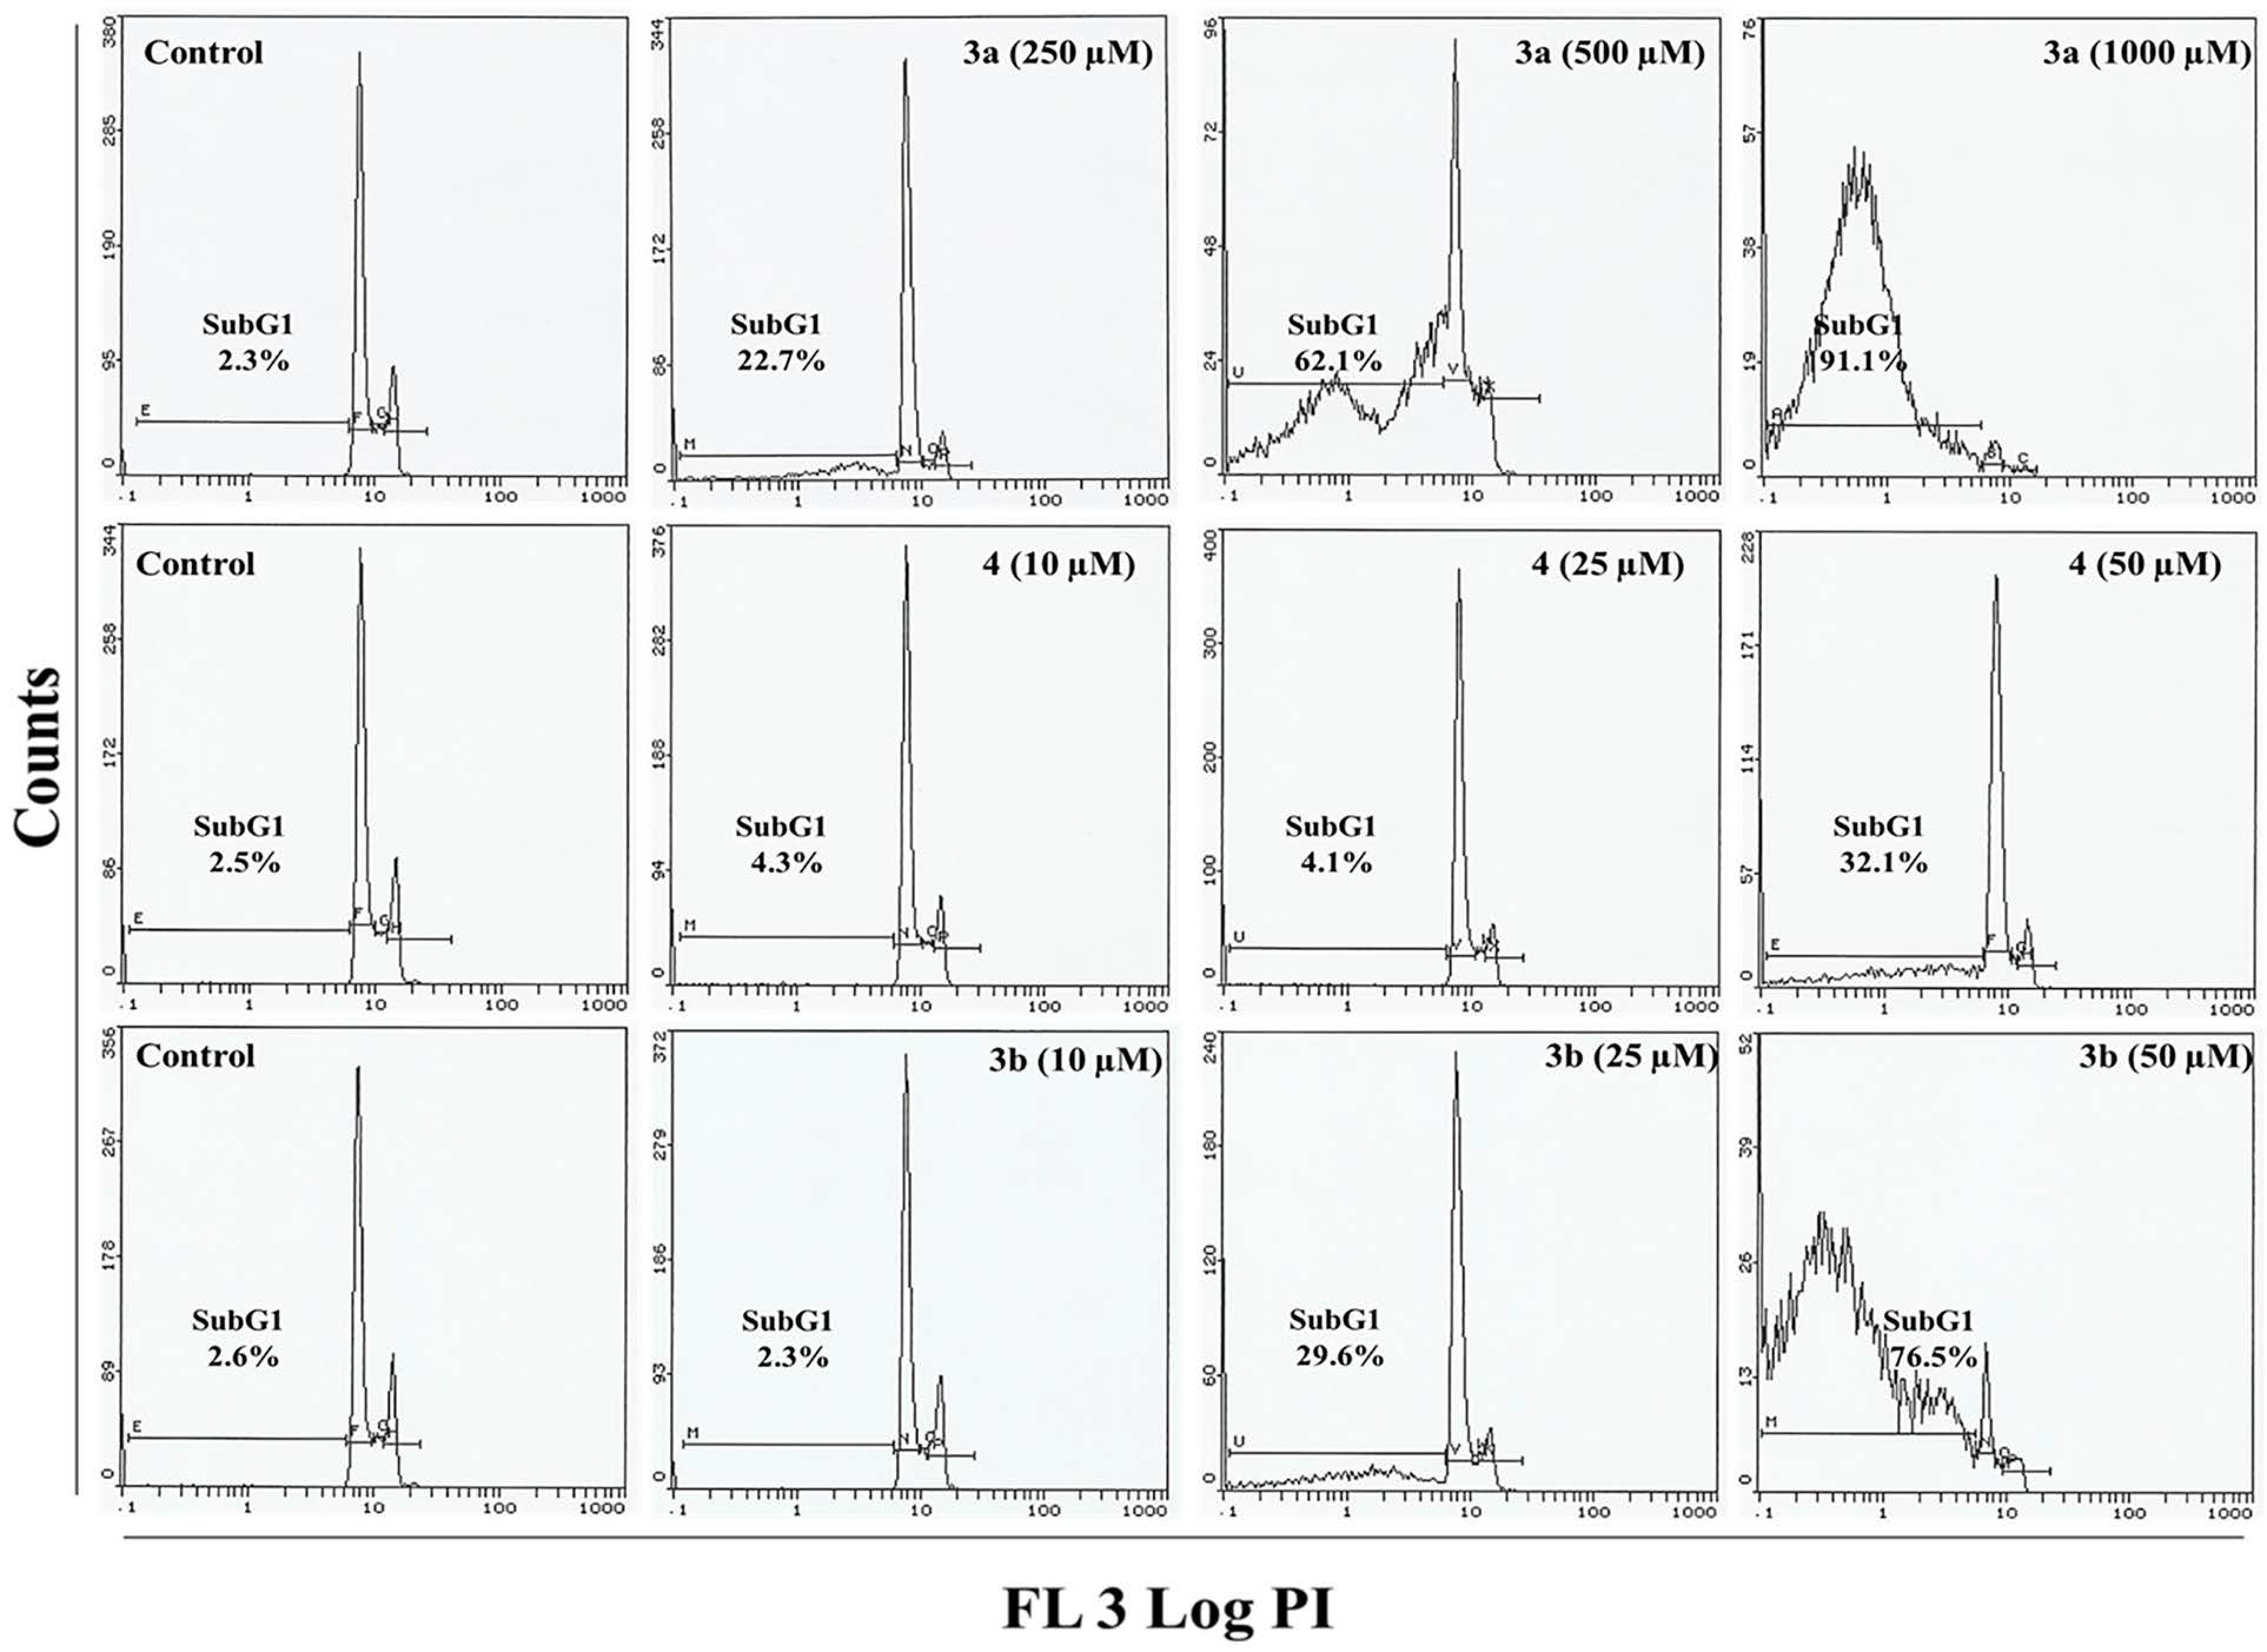
2.4. Flow Cytometry Analysis


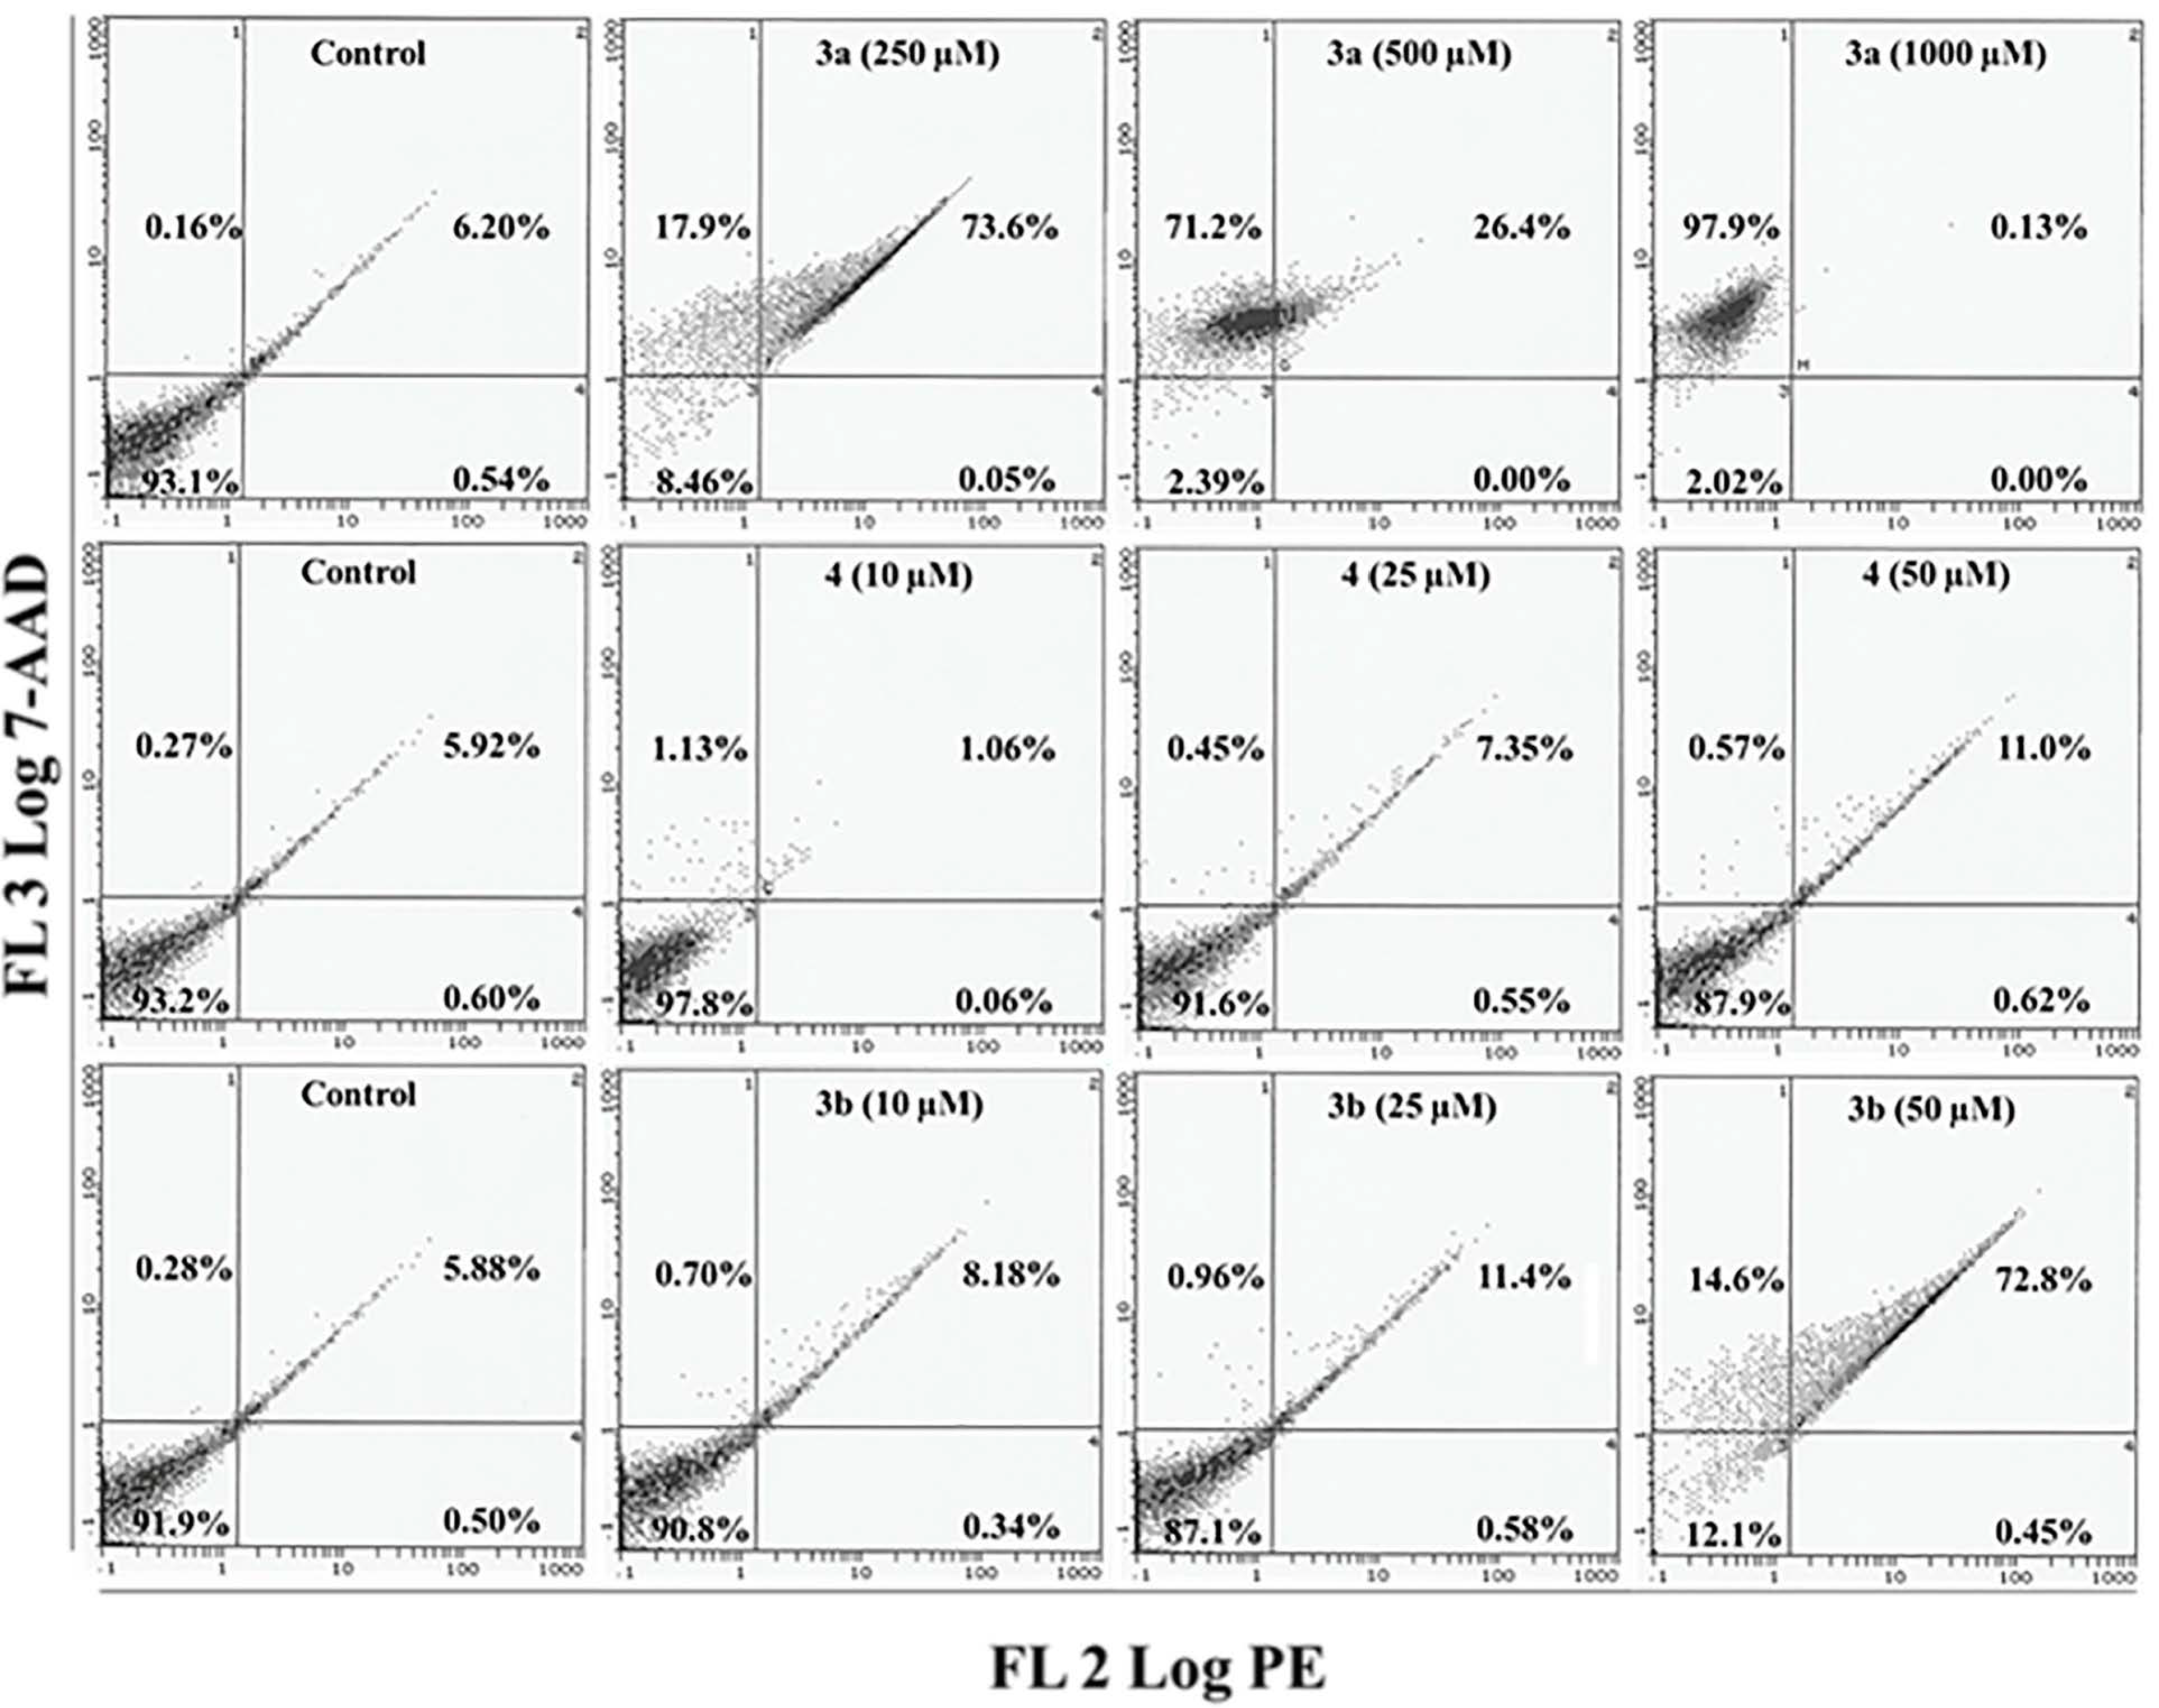
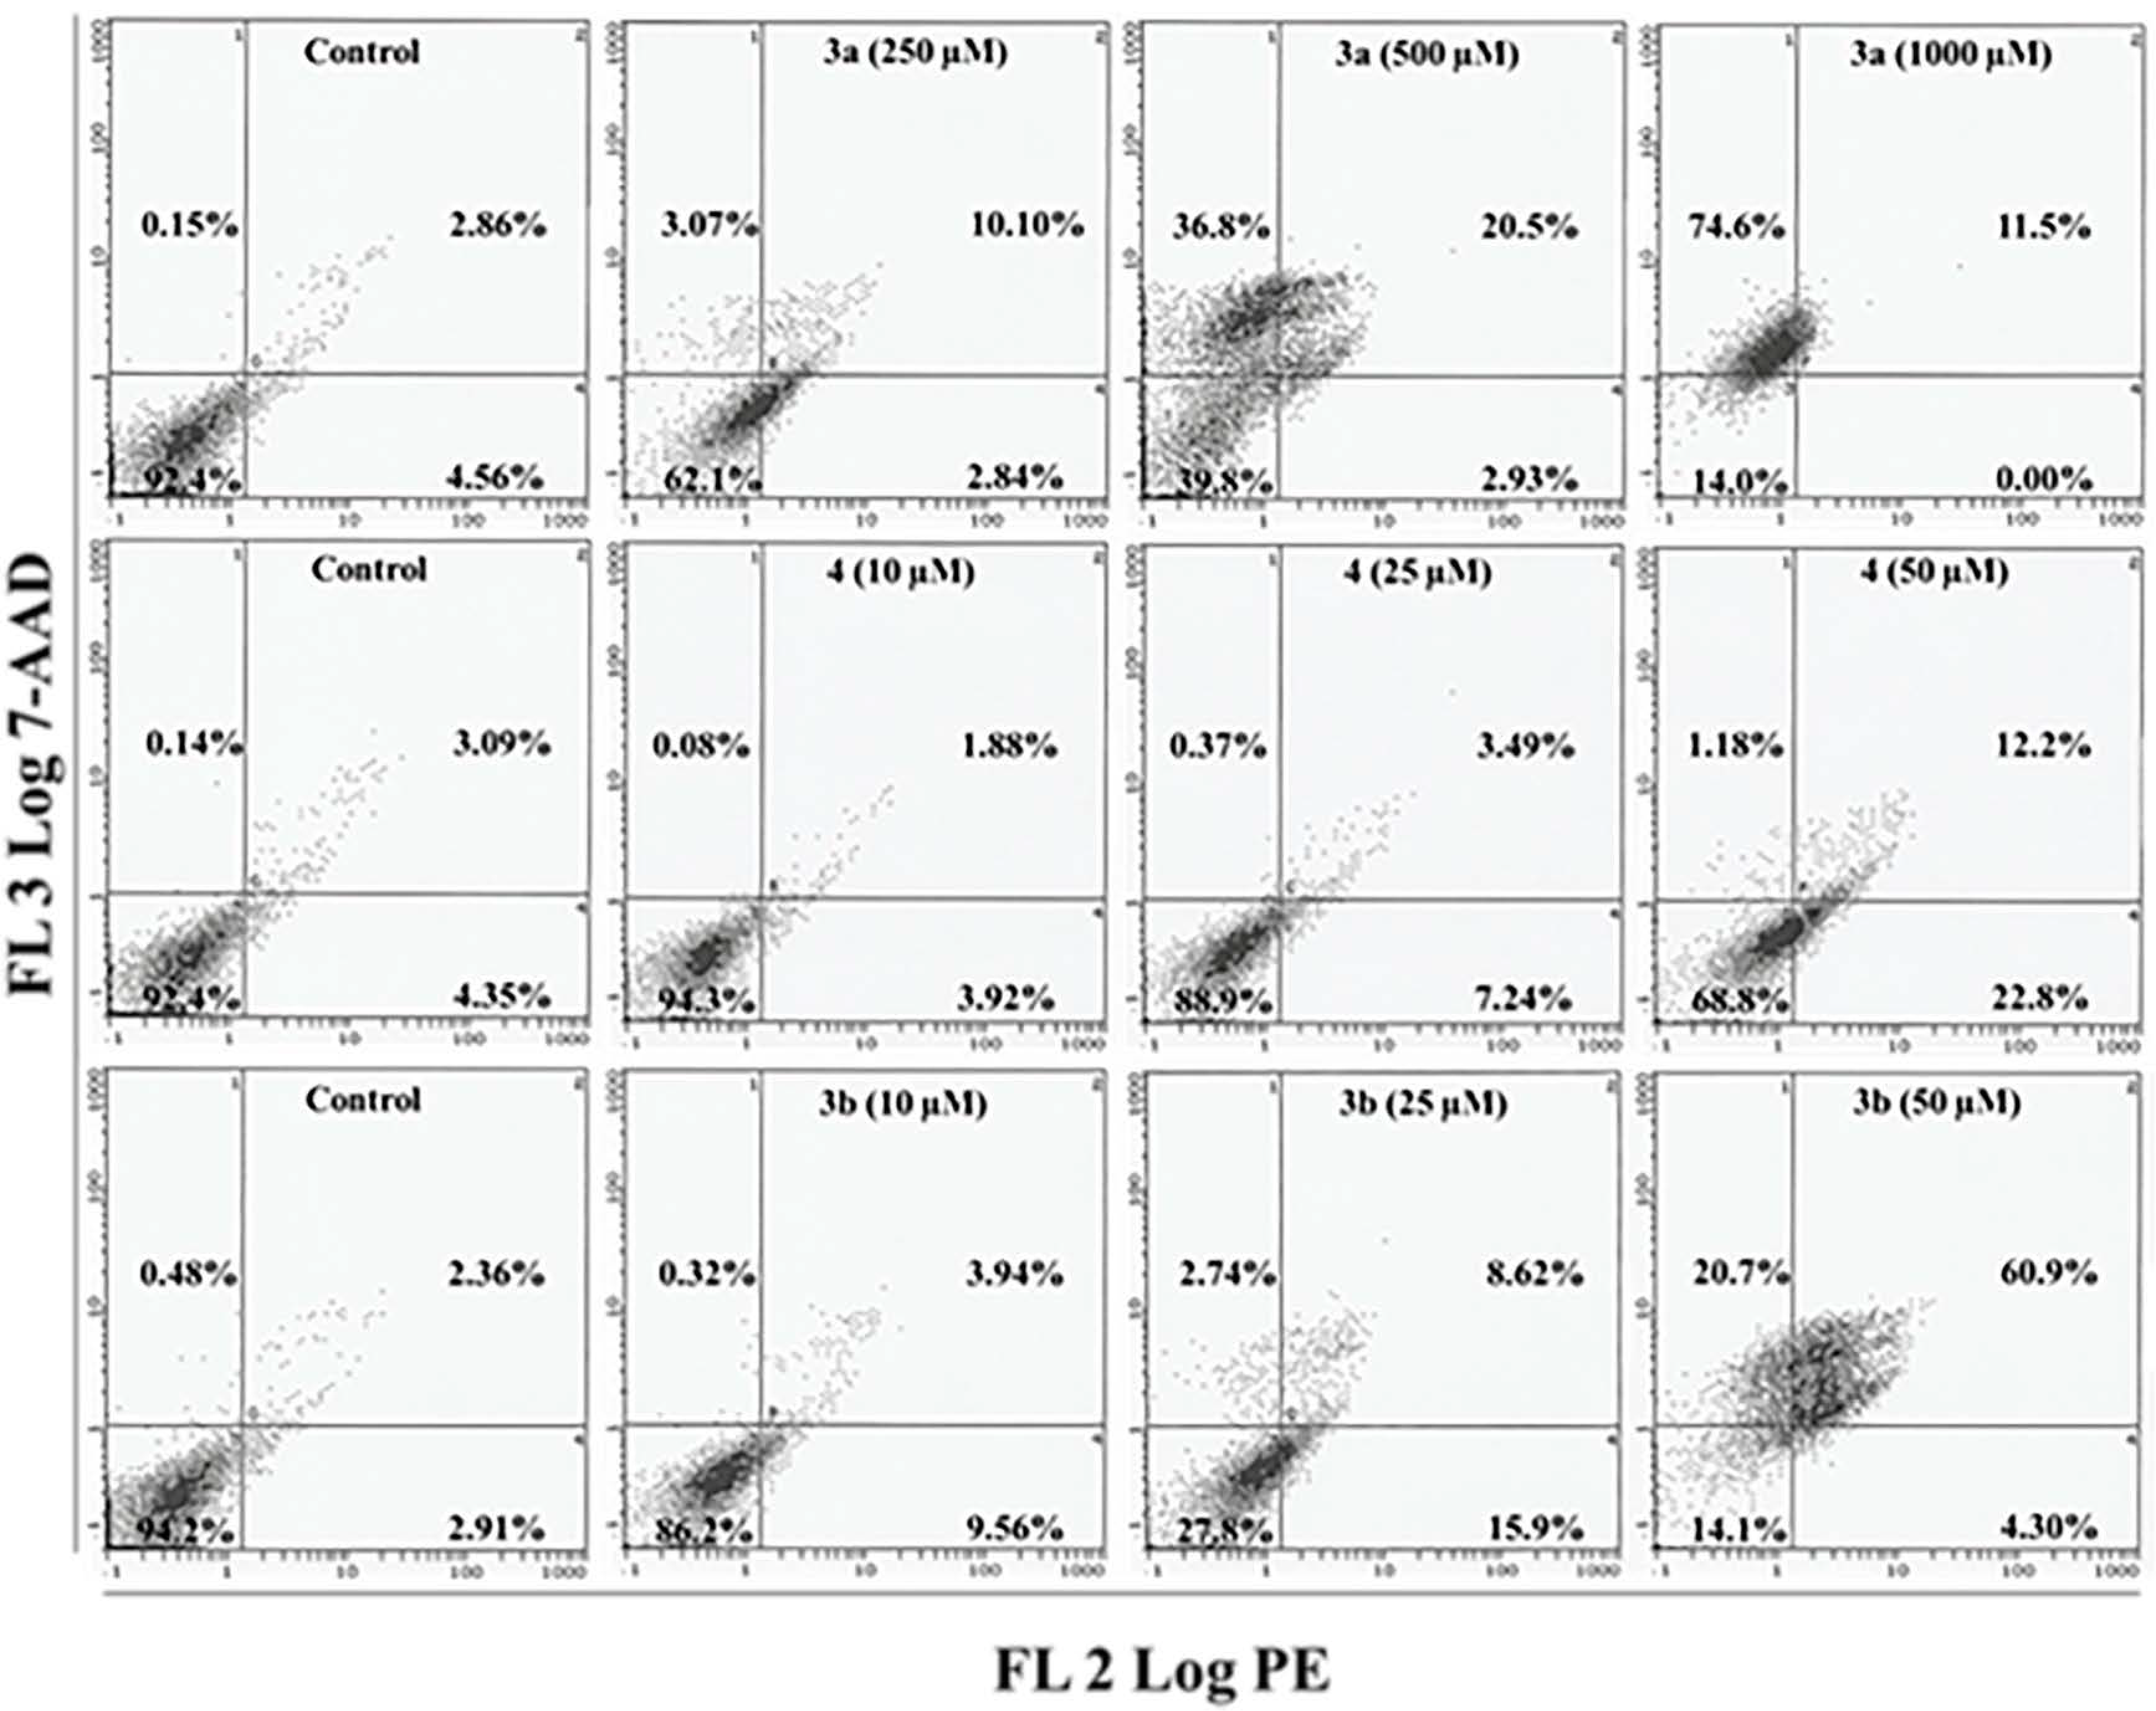
2.5. Apoptosis/Necrosis Assessment Using Annexin V-PE and 7-AAD in HepG2 and MCF 7 Cells


3. Experimental Section
3.1. Reagents
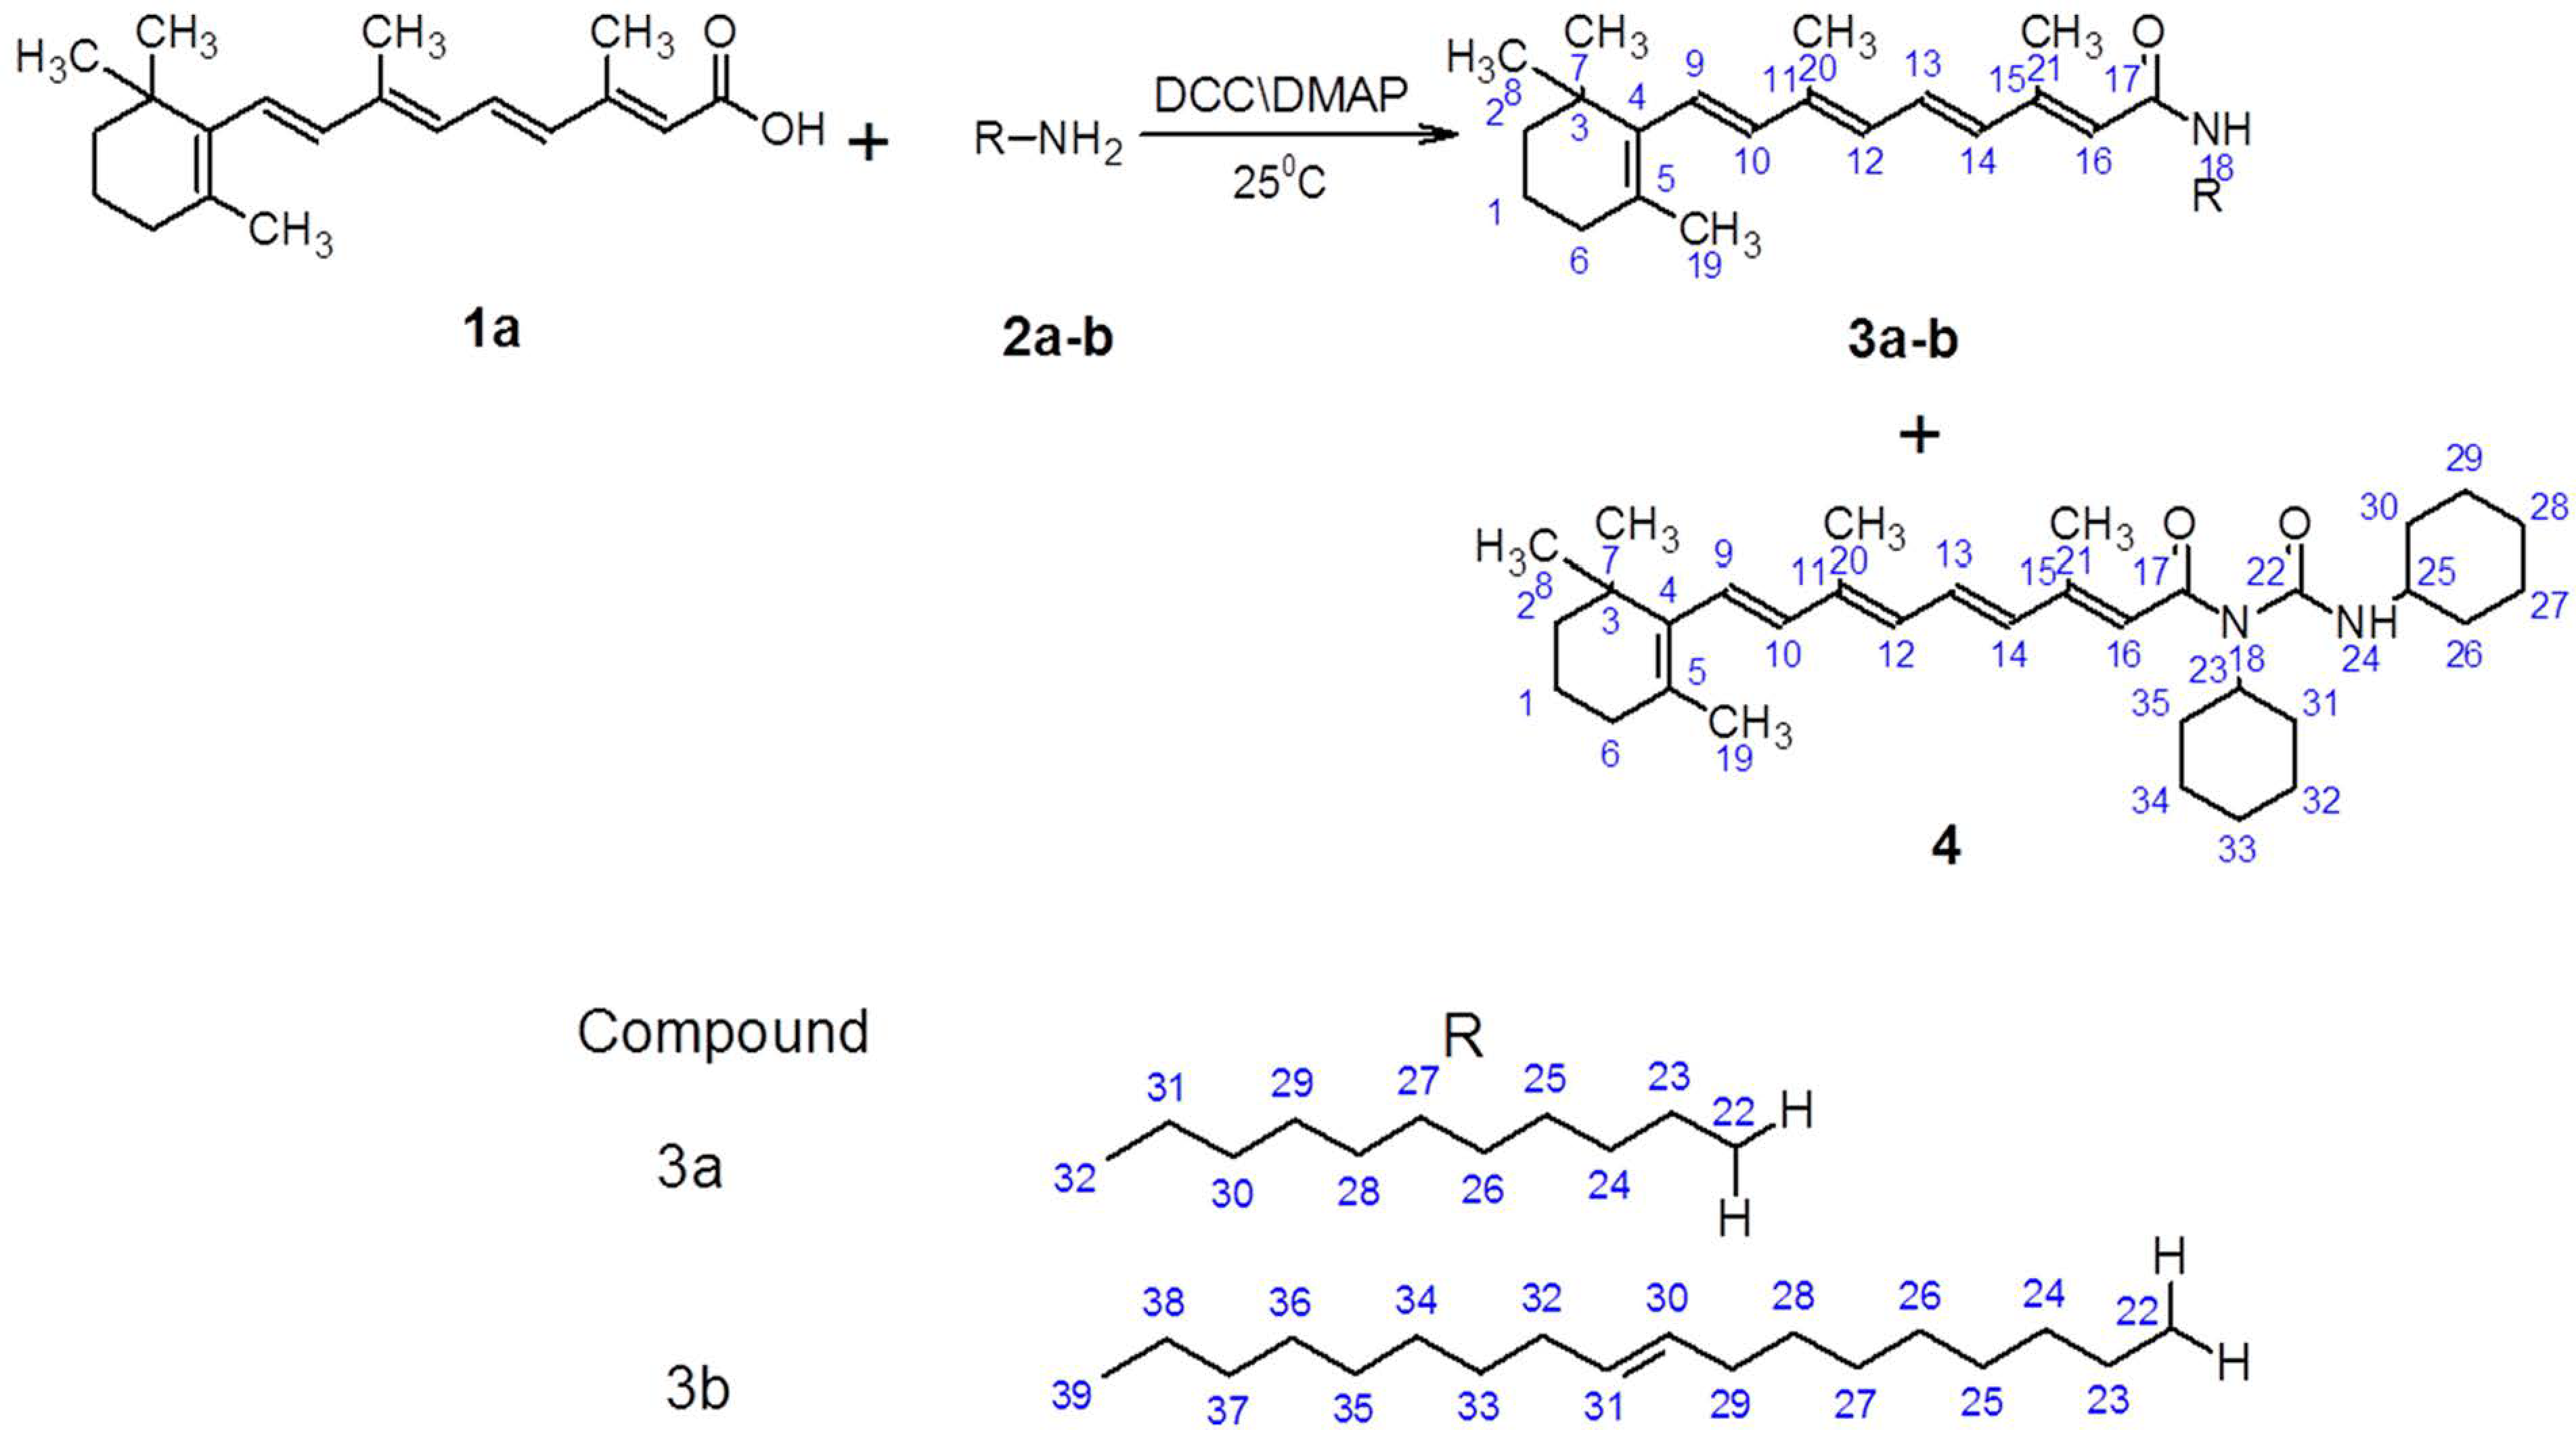
3.2. Synthesis of Amides (3a–b) and 1-Substituted-1,3-dicyclohexylurea (4) Derivatives of ATRA
3.3. Cell Culture
3.4. 3-(4,5-Dimethylthiazol-2-yl)-2,5-diphenyltetrazolium Bromide Assay
3.5. Neutral Red Uptake Assay
3.6. Morphological Analysis Using Phase Contrast Microscopy
3.7. Cell Cycle Analysis
3.8. Apoptosis/Necrosis Assay Using Annexin V-PE and 7-Aminoactinomycin D
3.9. Statistical Analysis
4. Conclusions
Supplementary Materials
Acknowledgments
Author Contributions
Conflicts of Interest
References
- Alwan, A.; MacLean, D.R.; Riley, L.M.; d’Espaignet, E.T.; Mathers, C.D.; Stevens, G.A.; Bettcher, D. Monitoring and surveillance of chronic non-communicable diseases: Progress and capacity in high-burden countries. Lancet 2010, 376, 1861–1868. [Google Scholar] [CrossRef] [PubMed]
- Sachs, L. Growth, differentiation and the reversal of malignancy. Sci. Am. 1986, 254, 40–48. [Google Scholar] [CrossRef] [PubMed]
- Lan, L.; Cui, D.; Luo, Y.; Shi, B.Y.; Deng, L.L.; Zhang, G.Y.; Wang, H. Inhibitory effects of retinoic acid on invasiveness of human thyroid carcinoma cell lines in vitro. J. Endocrinol. Investig. 2009, 32, 731–738. [Google Scholar] [CrossRef]
- Lee, J.H.; Yoon, J.H.; Yu, S.J.; Chung, G.E.; Jung, E.U.; Jung, E.U.; Kim, H.Y.; Kim, B.H.; Choi, D.H.; Myung, S.J.; et al. Retinoic acid and its binding protein modulate apoptotic signals in hypoxic hepatocellular carcinoma cells. Cancer Lett. 2010, 295, 229–235. [Google Scholar] [CrossRef] [PubMed]
- Myga-Nowak, M.; Pacholska-Bogalska, J.; Kwasniewski, W.; Kwasniewska, A.; Gozdzicka-Jozefiak, A. Proliferation of cells and expression of RARs, RXRs and HPV viral E6 and E7 proteins in cervical cancer cell lines after treatment with ATRA. Ann. Agric. Environ. Med. 2011, 18, 145–150. [Google Scholar] [PubMed]
- Ginestier, C.; Wicinski, J.; Cervera, N.; Monville, F.; Finetti, P.; Bertucci, F.; Wicha, M.S.; Birnbaum, D.; Charafe-Jauffret, E. Retinoid signaling regulates breast cancer stem cell differentiation. Cell Cycle 2009, 8, 3297–3302. [Google Scholar] [CrossRef] [PubMed]
- Carneiro, G.; Silva, E.L.; Pacheco, L.A.; de Souza-Fagundes, E.M.; Correa, N.C.R.; de Goes, A.M.; de Oliveira, M.C.; Ferreira, L.A.M. Formation of ion pairing as an alternative to improve encapsulation and anticancer activity of all-trans retinoic acid loaded in solid lipid nanoparticles. Int. J. Nanomed. 2012, 7, 6011–6020. [Google Scholar]
- Ariga, N.; Moriya, T.; Suzuki, T.; Kimura, M.; Ohuchi, N.; Sasano, H. Retinoic acid receptor and retinoid X receptor in ductal carcinoma in situ and intraductal proliferative lesions of the human breast. Jpn. J. Cancer Res. 2000, 91, 1169–1176. [Google Scholar] [CrossRef] [PubMed]
- Hakimelahi, G.H.; Ly, T.W.; Yu, S.F.; Zakerinia, M.; Khalafi-Nezhad, A.; Soltani, M.N.; Gorgani, M.N.; Chadegani, A.R.; Moosavi-Movahedi, A.A. Design and synthesis of a cephalosporin-retinoic acid prodrug activated by a monoclonal antibody-β-lactamase conjugate. Bioorg. Med. Chem. 2001, 9, 2139–2147. [Google Scholar] [CrossRef] [PubMed]
- Hakimelahi, G.H.; Zarrinehzad, M.; Jarrahpour, A.A.; Sharghi, H. Ring-open analogues of adenine nucleoside. Aminoacylderivatives of cyclo- and acyclo-nucleosides. Helv. Chim. Acta 1987, 70, 219–231. [Google Scholar] [CrossRef]
- Bard, D.R.; Lasnitzki, I. Toxicity of anti-carcinogenic retinoids in organ culture. Br. J. Cancer 1977, 35, 115–119. [Google Scholar] [CrossRef] [PubMed]
- Gander, R.J.; Gurney, J.A. Esters of Retinoic Acid. BE Patent 0847942, 1977. [Google Scholar]
- Bradley, M.O.; Webb, N.L.; Anthony, F.H.; Devanesan, P.; Witman, P.A.; Hemamalini, S.; Chander, M.C.; Baker, S.D.; He, L.; Horwitz, S.B.; et al. Tumor targeting by covalent conjugation of a natural fatty acid to paclitaxel. Clin. Cancer Res. 2001, 7, 3229–3238. [Google Scholar] [PubMed]
- Chhikara, B.S.; St Jean, N.; Mandal, D.; Kumar, A.; Parang, K. Fatty acyl amide derivatives of doxorubicin: Synthesis and in vitro anticancer activities. Eur. J. Med. Chem. 2011, 46, 2037–2042. [Google Scholar] [CrossRef] [PubMed]
- Chhikara, B.S.; Mandal, D.; Parang, K. Synthesis and evaluation of fatty acyl ester derivatives of cytarabine as anti-leukemia agents. Eur. J. Med. Chem. 2010, 45, 4601–4608. [Google Scholar] [CrossRef] [PubMed]
- The Retinoids: Biology, Chemistry and Medicine, 2nd ed.; Sporn, M.B.; Roberts, A.B.; Goodman, D.S. (Eds.) Raven Press: New York, NY, USA, 1994.
- Niederreither, K.; Dollé, P. Retinoic acid in development: towards an integrated view. Nat. Rev. Genet. 2008, 9, 541–553. [Google Scholar] [CrossRef] [PubMed]
- Smith, M.A.; Parkinson, D.R.; Cheson, B.D.; Friedman, M.A. Retinoids in cancer therapy. J. Clin. Oncol. 1992, 10, 839–864. [Google Scholar] [PubMed]
- Rhee, J.C.; Khuri, F.R.; Shin, D.M. Advances in chemoprevention of head and neck cancer. Oncologist 2004, 9, 302–311. [Google Scholar] [CrossRef] [PubMed]
- Collins, M.D.; Mao, G.E. Teratology of retinoids. Annu. Rev. Pharmacol. Toxicol. 1999, 39, 399–430. [Google Scholar] [CrossRef] [PubMed]
- Sharma, R.; Sharma, R.; Verma, U.; Bhat, N.K. Drug review: Novel drugs targeting retinoic acid receptors. JK Sci. 2005, 7, 1–2. [Google Scholar]
- David, M.; Hodak, E.; Lowe, N.J. Adverse effects of retinoids. Med. Toxicol. Advers. Drug Exp. 1988, 3, 273–288. [Google Scholar] [CrossRef]
- Silverman, A.K.; Ellis, C.N.; Voorhees, J.J. Hypervitaminosis A syndrome: A paradigm of retinoid side effects. J. Am. Acad. Dermatol. 1987, 16, 1027–1039. [Google Scholar] [CrossRef] [PubMed]
- Boehm, M.F.; Zhang, L.; Badea, B.A.; White, S.K.; Mais, D.E.; Berger, E.; Suto, C.M.; Goldman, M.E.; Heymanet, R.A. Synthesis and structure-activity relationships of novel retinoid X receptor-selective retinoids. J. Med. Chem. 1994, 37, 2930–2941. [Google Scholar] [CrossRef] [PubMed]
- Fieser, L.F.; Fieser, M. Reagents for Organic Synthesis, 1st ed.; John Wiley and Sons Inc.: London, UK, 1967. [Google Scholar]
- Nogueira, D.R.; Mitjans, M.; Infante, M.R.; Vinardell, M.P. Comparative sensitivity of tumor and non-tumor cell lines as a reliable approach for in vitro cytotoxicity screening of lysine-based surfactants with potential pharmaceutical applications. Int. J. Pharm. 2011, 420, 51–58. [Google Scholar] [CrossRef] [PubMed]
- Nicoletti, I.; Migliorati, G.; Pagliacci, M.C.; Grignani, F.; Riccardi, C. A rapid and simple method for measuring thymocyte apoptosis by propidium iodide staining and flow cytometry. J. Immunol. Methods 1991, 139, 271–279. [Google Scholar] [CrossRef] [PubMed]
- Ravi, S.; Chiruvella, K.K.; Rajesh, K.; Prabhu, V.; Raghavan, S.C. 5-Isopropylidene-3-ethyl rhodanine induce growth inhibition followed by apoptosis in leukemia cells. Eur. J. Med. Chem. 2010, 45, 2748–2752. [Google Scholar] [CrossRef] [PubMed]
- Ferreira, C.G.; Epping, M.; Kruyt, F.A.; Giaccone, G. Apoptosis: Target of cancer therapy. Clin. Cancer Res. 2002, 8, 2024–2034. [Google Scholar] [PubMed]
- Konopa, J. G2 block induced by DNA crosslinking agents and its possible consequence. Biochem. Pharmacol. 1998, 37, 2303–2309. [Google Scholar] [CrossRef]
- Tsao, Y.P.; D’Arpa, P.; Liu, L.F. The involvement of active DNA synthesis in camptothecin-induced G2 arrest: Altered regulation of p34cdc2/cyclin B. Cancer Res. 1992, 52, 1823–1829. [Google Scholar] [PubMed]
- Fadok, V.A.; Voelker, D.R.; Campbell, P.A.; Cohen, J.J.; Bratton, D.L.; Henson, P.M. Exposure of phosphatidylserine on the surface of apoptotic lymphocytes triggers specific recognition and removal by macrophages. J. Immunol. 1992, 7, 2207–2216. [Google Scholar]
- Martin, S.J; Reutelingsperger, C.P.M.; McGahon, A.J.; Rader, J.; van Schie, R.C.A.A.; LaFace, D.M.; Green, D.R. Early redistribution of plasma membrane phosphatidylserine is a general feature of apoptosis regardless of the initiating stimulus. Inhibition by over expression of Bcl-2 and Abl. J. Exp. Med. 1995, 182, 1545–1557. [Google Scholar] [CrossRef] [PubMed]
- Diaz, C.; Schroit, A. Role of translocases in the generation of phosphatidylserine asymmetry. J. Membr. Biol. 1996, 151, 1–9. [Google Scholar] [CrossRef] [PubMed]
- Siddiqui, M.A.; Singh, G.; Kashyap, M.P.; Khanna, V.K.; Yadav, S.; Chandra, D.; Pant, A.B. Influence of cytotoxic doses of 4-hydroxynonenal on selected neurotransmitter receptors in PC-12 cells. Toxicol. In Vitro 2008, 22, 1681–1688. [Google Scholar] [CrossRef] [PubMed]
- Siddiqui, M.A.; Kashyap, M.P.; Kumar, V.; Al-Khedhairy, A.A.; Musarrat, J.; Pant, A.B. Protective potential of trans-resveratrol against 4-hydroxynonenal induced damage in PC12 cells. Toxicol. In Vitro 2010, 6, 1592–1598. [Google Scholar] [CrossRef]
- Saquib, Q.; Al-Khedhairy, A.A.; Ahmad, J.; Siddiqui, M.A.; Dwivedi, S.; Khan, S.T.; Musarrat, J. Zinc ferrite nanoparticles activate IL-1b, NFKB1, CCL21 and NOS2 signaling to induce mitochondrial dependent intrinsic apoptotic pathway in WISH cells. Toxicol. Appl. Pharmacol. 2013, 273, 289–297. [Google Scholar] [CrossRef] [PubMed]
- Saquib, Q.; Musarrat, J.; Siddiqui, M.A.; Dutta, S.; Dasgupta, S.; Giesy, J.P.; Al-Khedhairy, A.A. Cytotoxic and necrotic responses in human amniotic epithelial (WISH) cells exposed to organophosphate insecticide phorate. Mutat. Res. 2012, 744, 125–134. [Google Scholar] [CrossRef] [PubMed]
- Sample Availability: Samples of the compounds 3a–b and 4 are available from the authors.
© 2015 by the authors. Licensee MDPI, Basel, Switzerland. This article is an open access article distributed under the terms and conditions of the Creative Commons Attribution license ( http://creativecommons.org/licenses/by/4.0/).
Share and Cite
Al-Sheddi, E.S.; Al-Oqail, M.M.; Saquib, Q.; Siddiqui, M.A.; Musarrat, J.; Al-Khedhairy, A.A.; Farshori, N.N. Novel All Trans-Retinoic Acid Derivatives: Cytotoxicity, Inhibition of Cell Cycle Progression and Induction of Apoptosis in Human Cancer Cell Lines. Molecules 2015, 20, 8181-8197. https://doi.org/10.3390/molecules20058181
Al-Sheddi ES, Al-Oqail MM, Saquib Q, Siddiqui MA, Musarrat J, Al-Khedhairy AA, Farshori NN. Novel All Trans-Retinoic Acid Derivatives: Cytotoxicity, Inhibition of Cell Cycle Progression and Induction of Apoptosis in Human Cancer Cell Lines. Molecules. 2015; 20(5):8181-8197. https://doi.org/10.3390/molecules20058181
Chicago/Turabian StyleAl-Sheddi, Ebtesam Saad, Mai Mohammad Al-Oqail, Quaiser Saquib, Maqsood Ahmed Siddiqui, Javed Musarrat, Abdulaziz Ali Al-Khedhairy, and Nida Nayyar Farshori. 2015. "Novel All Trans-Retinoic Acid Derivatives: Cytotoxicity, Inhibition of Cell Cycle Progression and Induction of Apoptosis in Human Cancer Cell Lines" Molecules 20, no. 5: 8181-8197. https://doi.org/10.3390/molecules20058181