
Clinacanthus nutans (Burm. f.) Lindau Ethanol Extract Inhibits Hepatoma in Mice through Upregulation of the Immune Response


Abstract
:1. Introduction
2. Results and Discussion
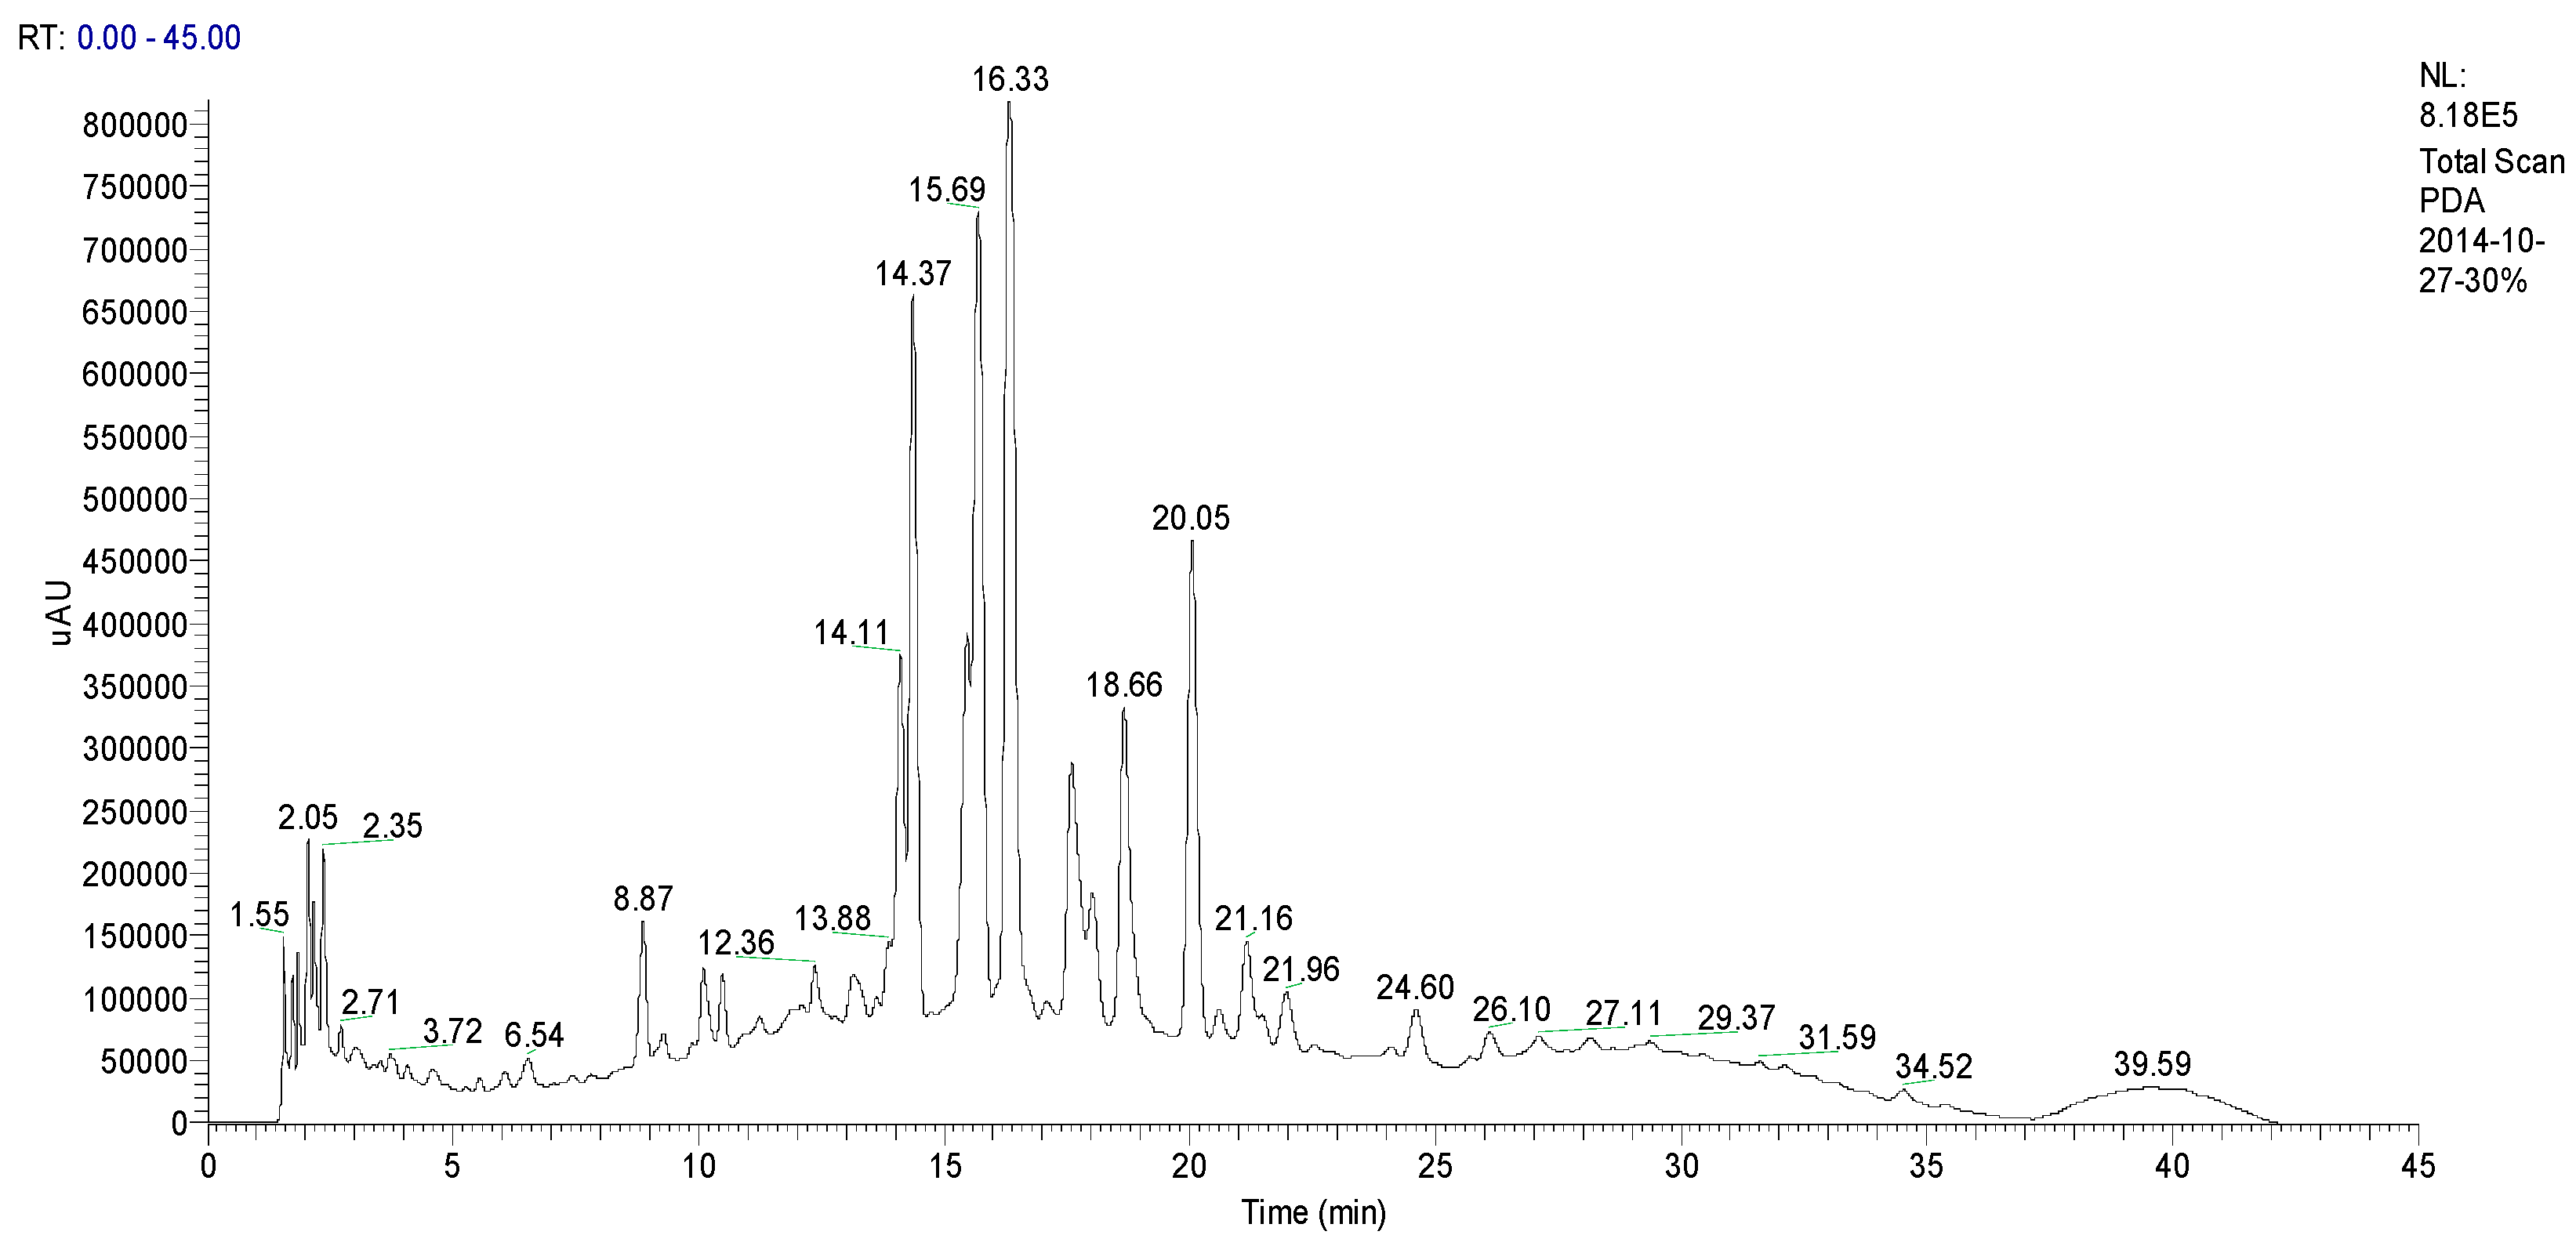
2.1. Identification CN30 by HPLC


| Rt (min) | Tentative Compound | [M – H]− (m/z) | Fragment Ions, (m/z) | Fragment Ions of [M − H]− |
|---|---|---|---|---|
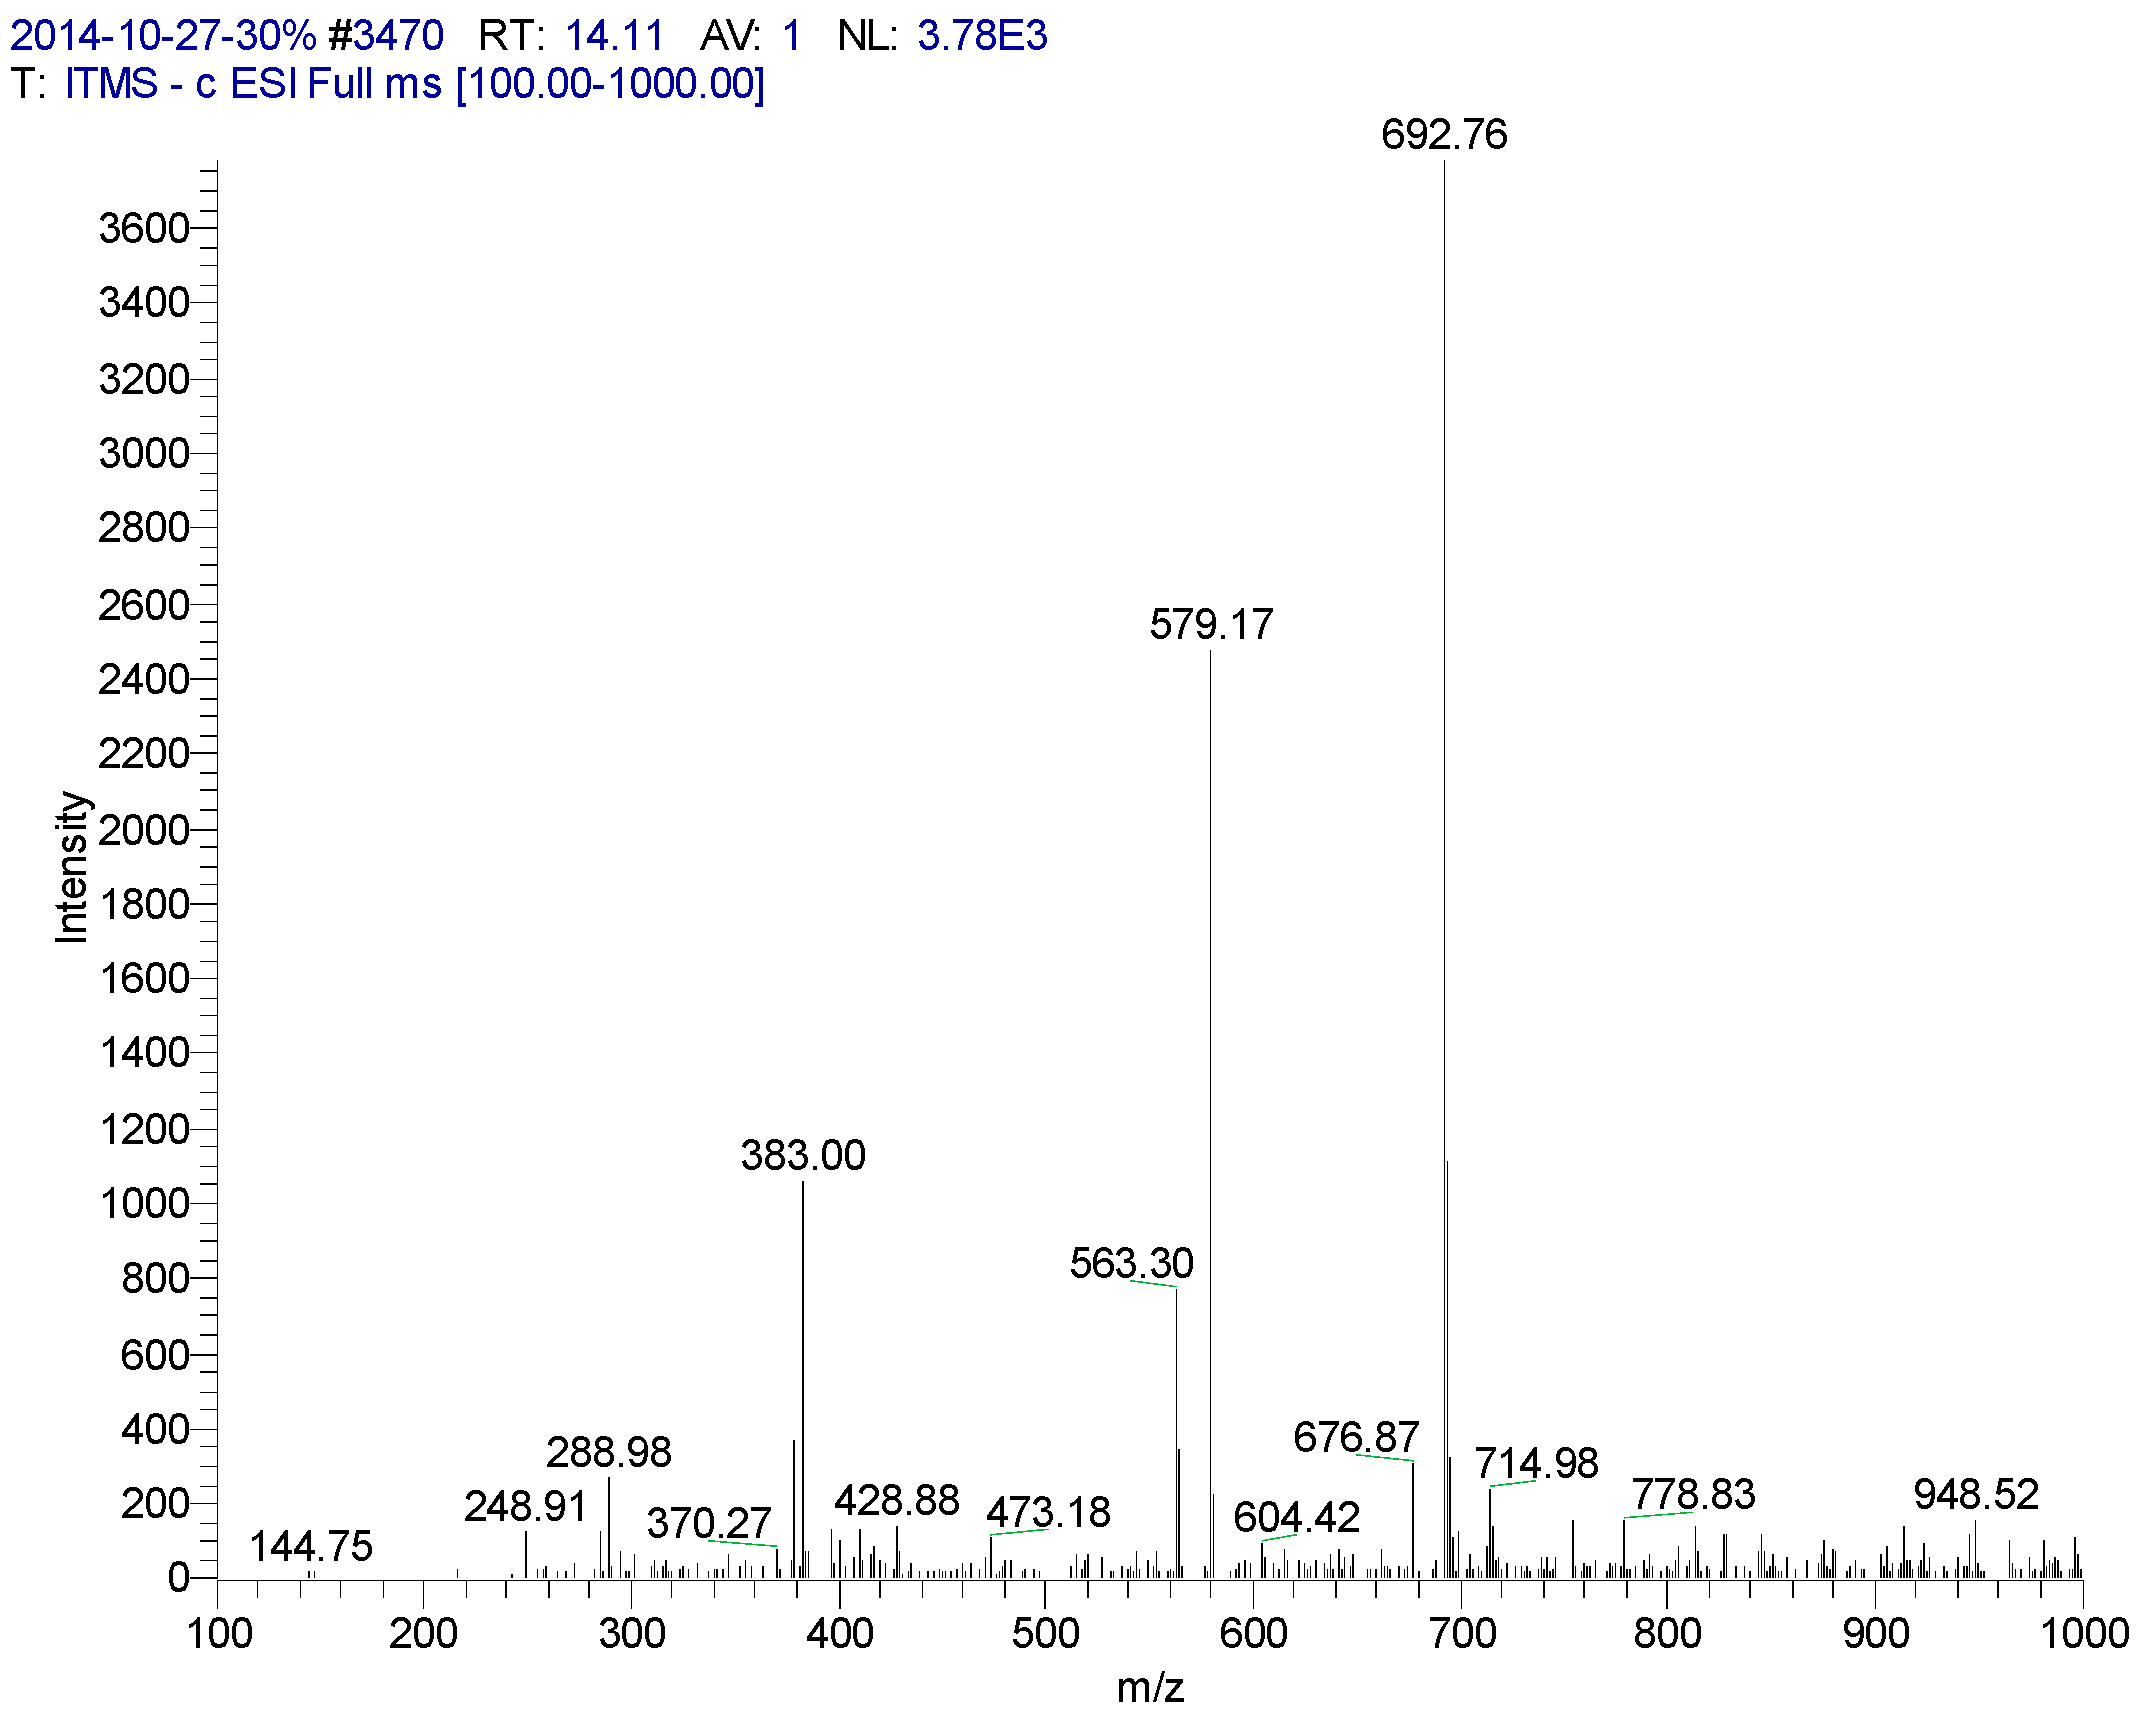
| 14.11 | Isoorientin | 579 | 288, 383, 563, 579, 692 | 235, 270 (99.14), 346 (100), 395, |
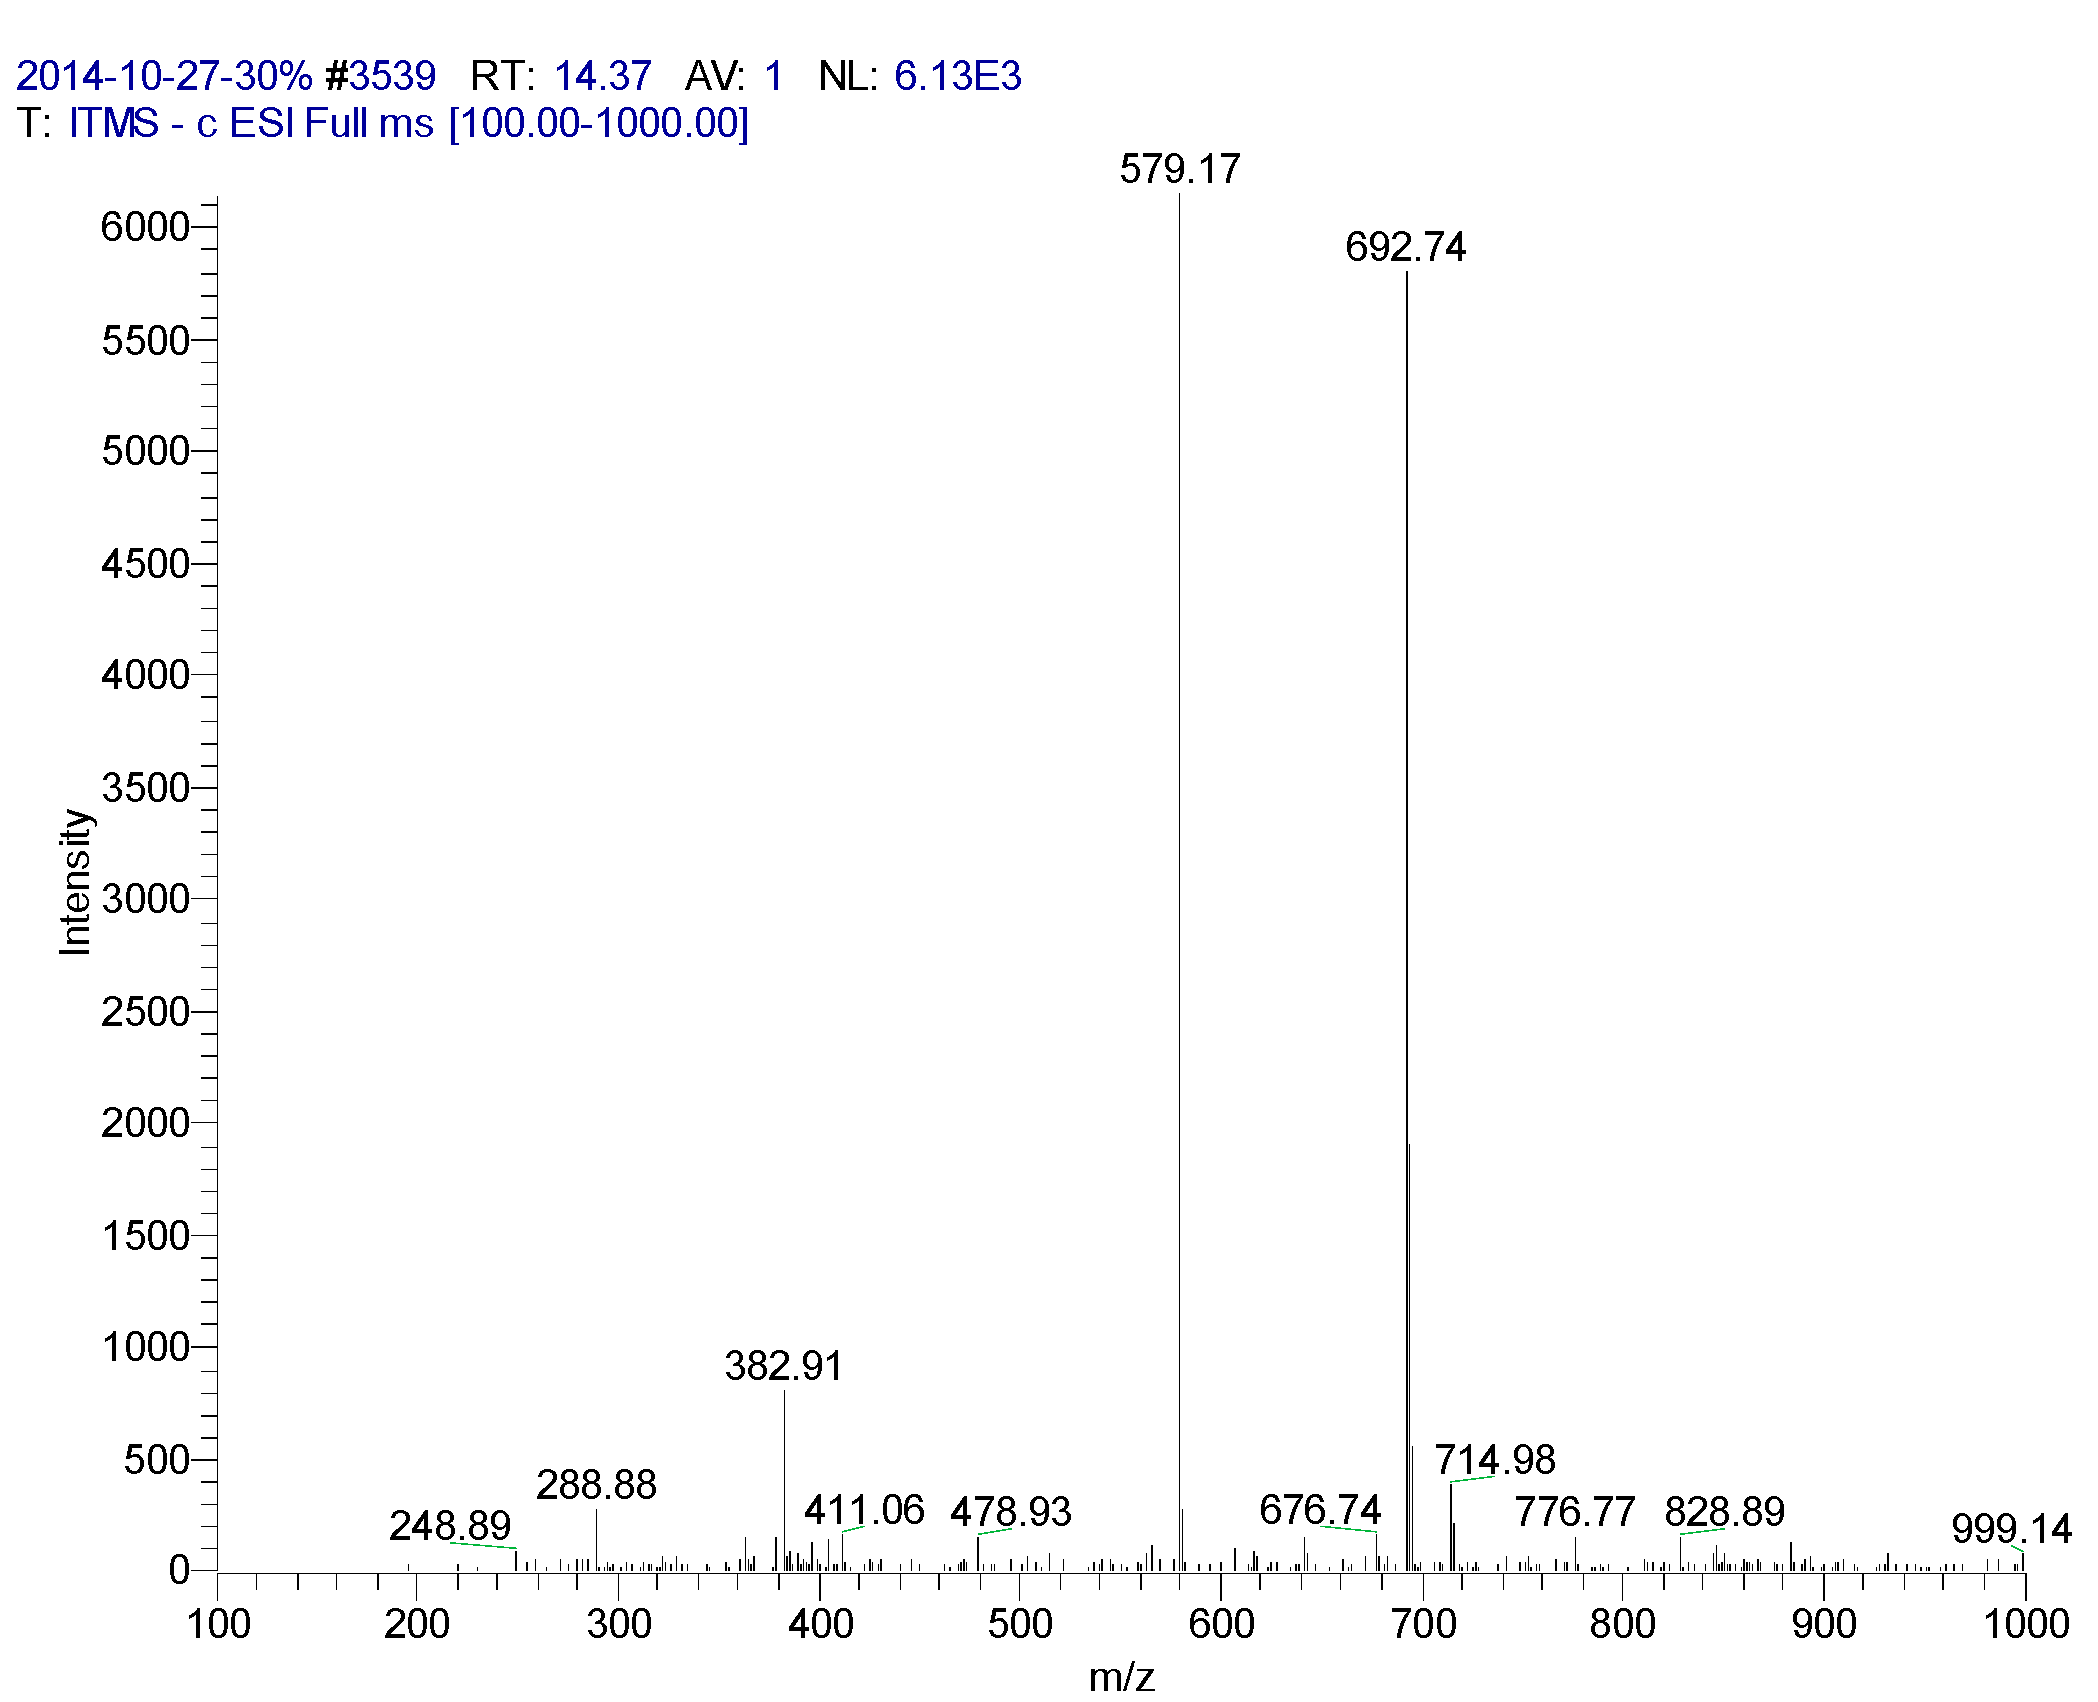
| 14.37 | Orientin | 579 | 288, 382, 579, 692, 714 | 239, 258 (97.22), 348 (100), 349 (100), 440 |
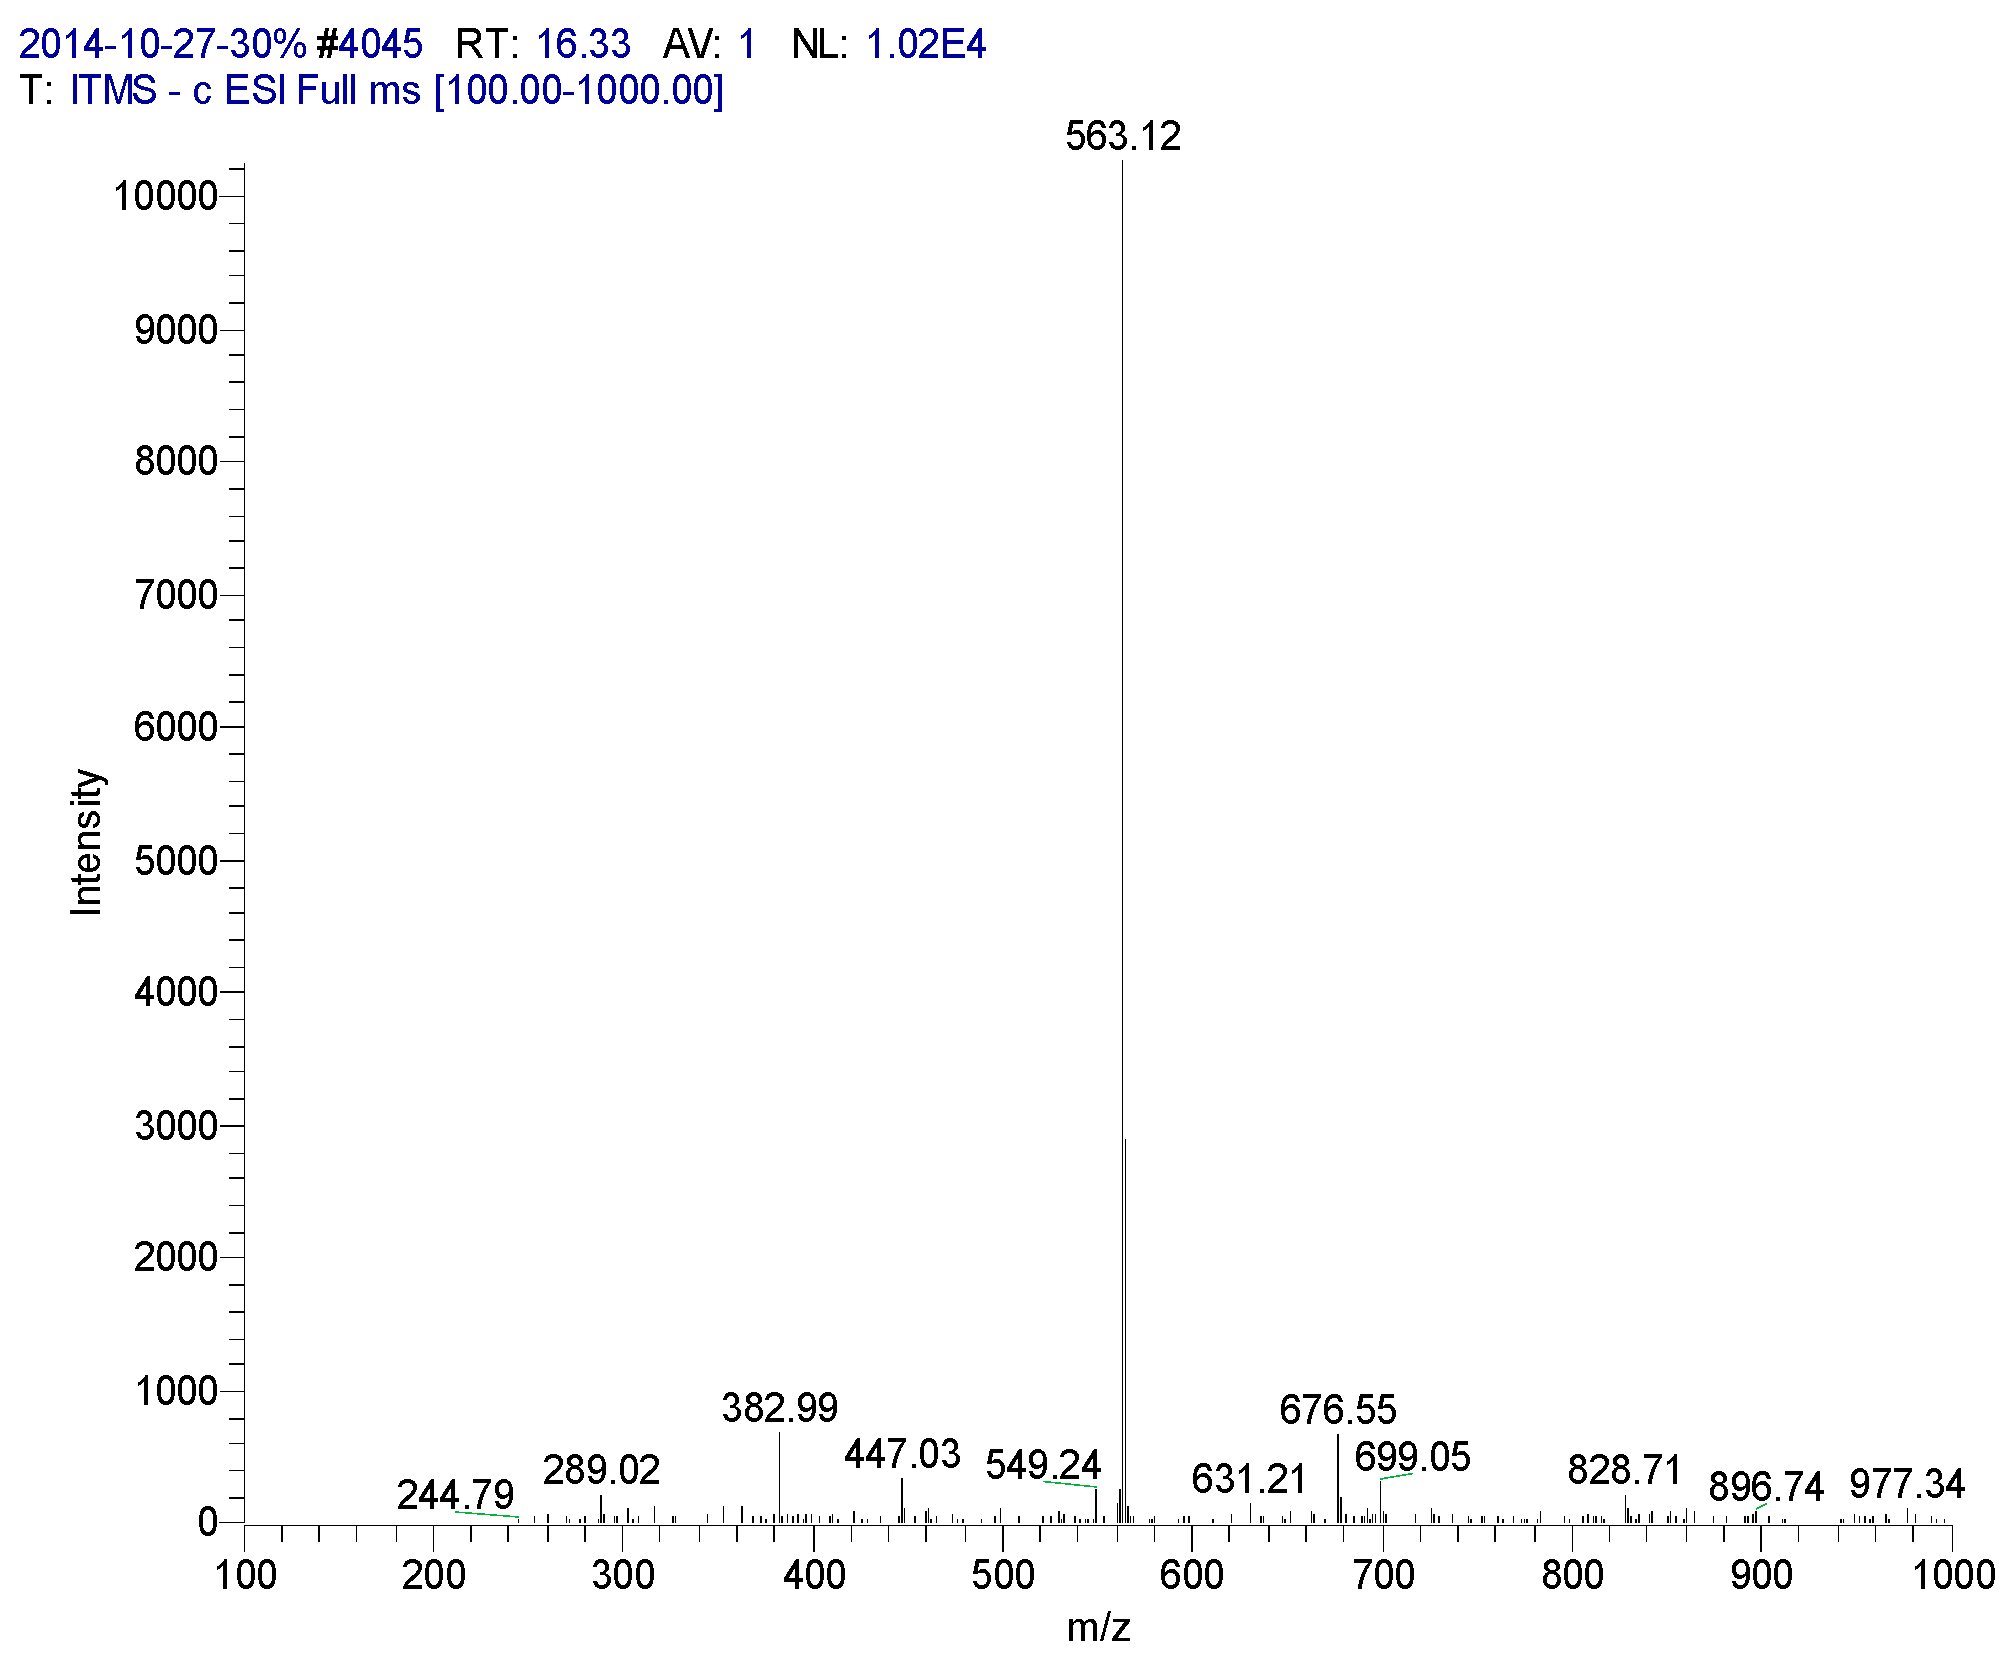
| 16.33 | Isovitexin | 563 | 244, 289, 382, 447, 549, 563, 676 | 242 (96.17), 258 (100), 296, 321, 329, 338 |
| 17.60 | Vitexin | 533 | 533 | 235, 270 (99.14), 347 (100) |
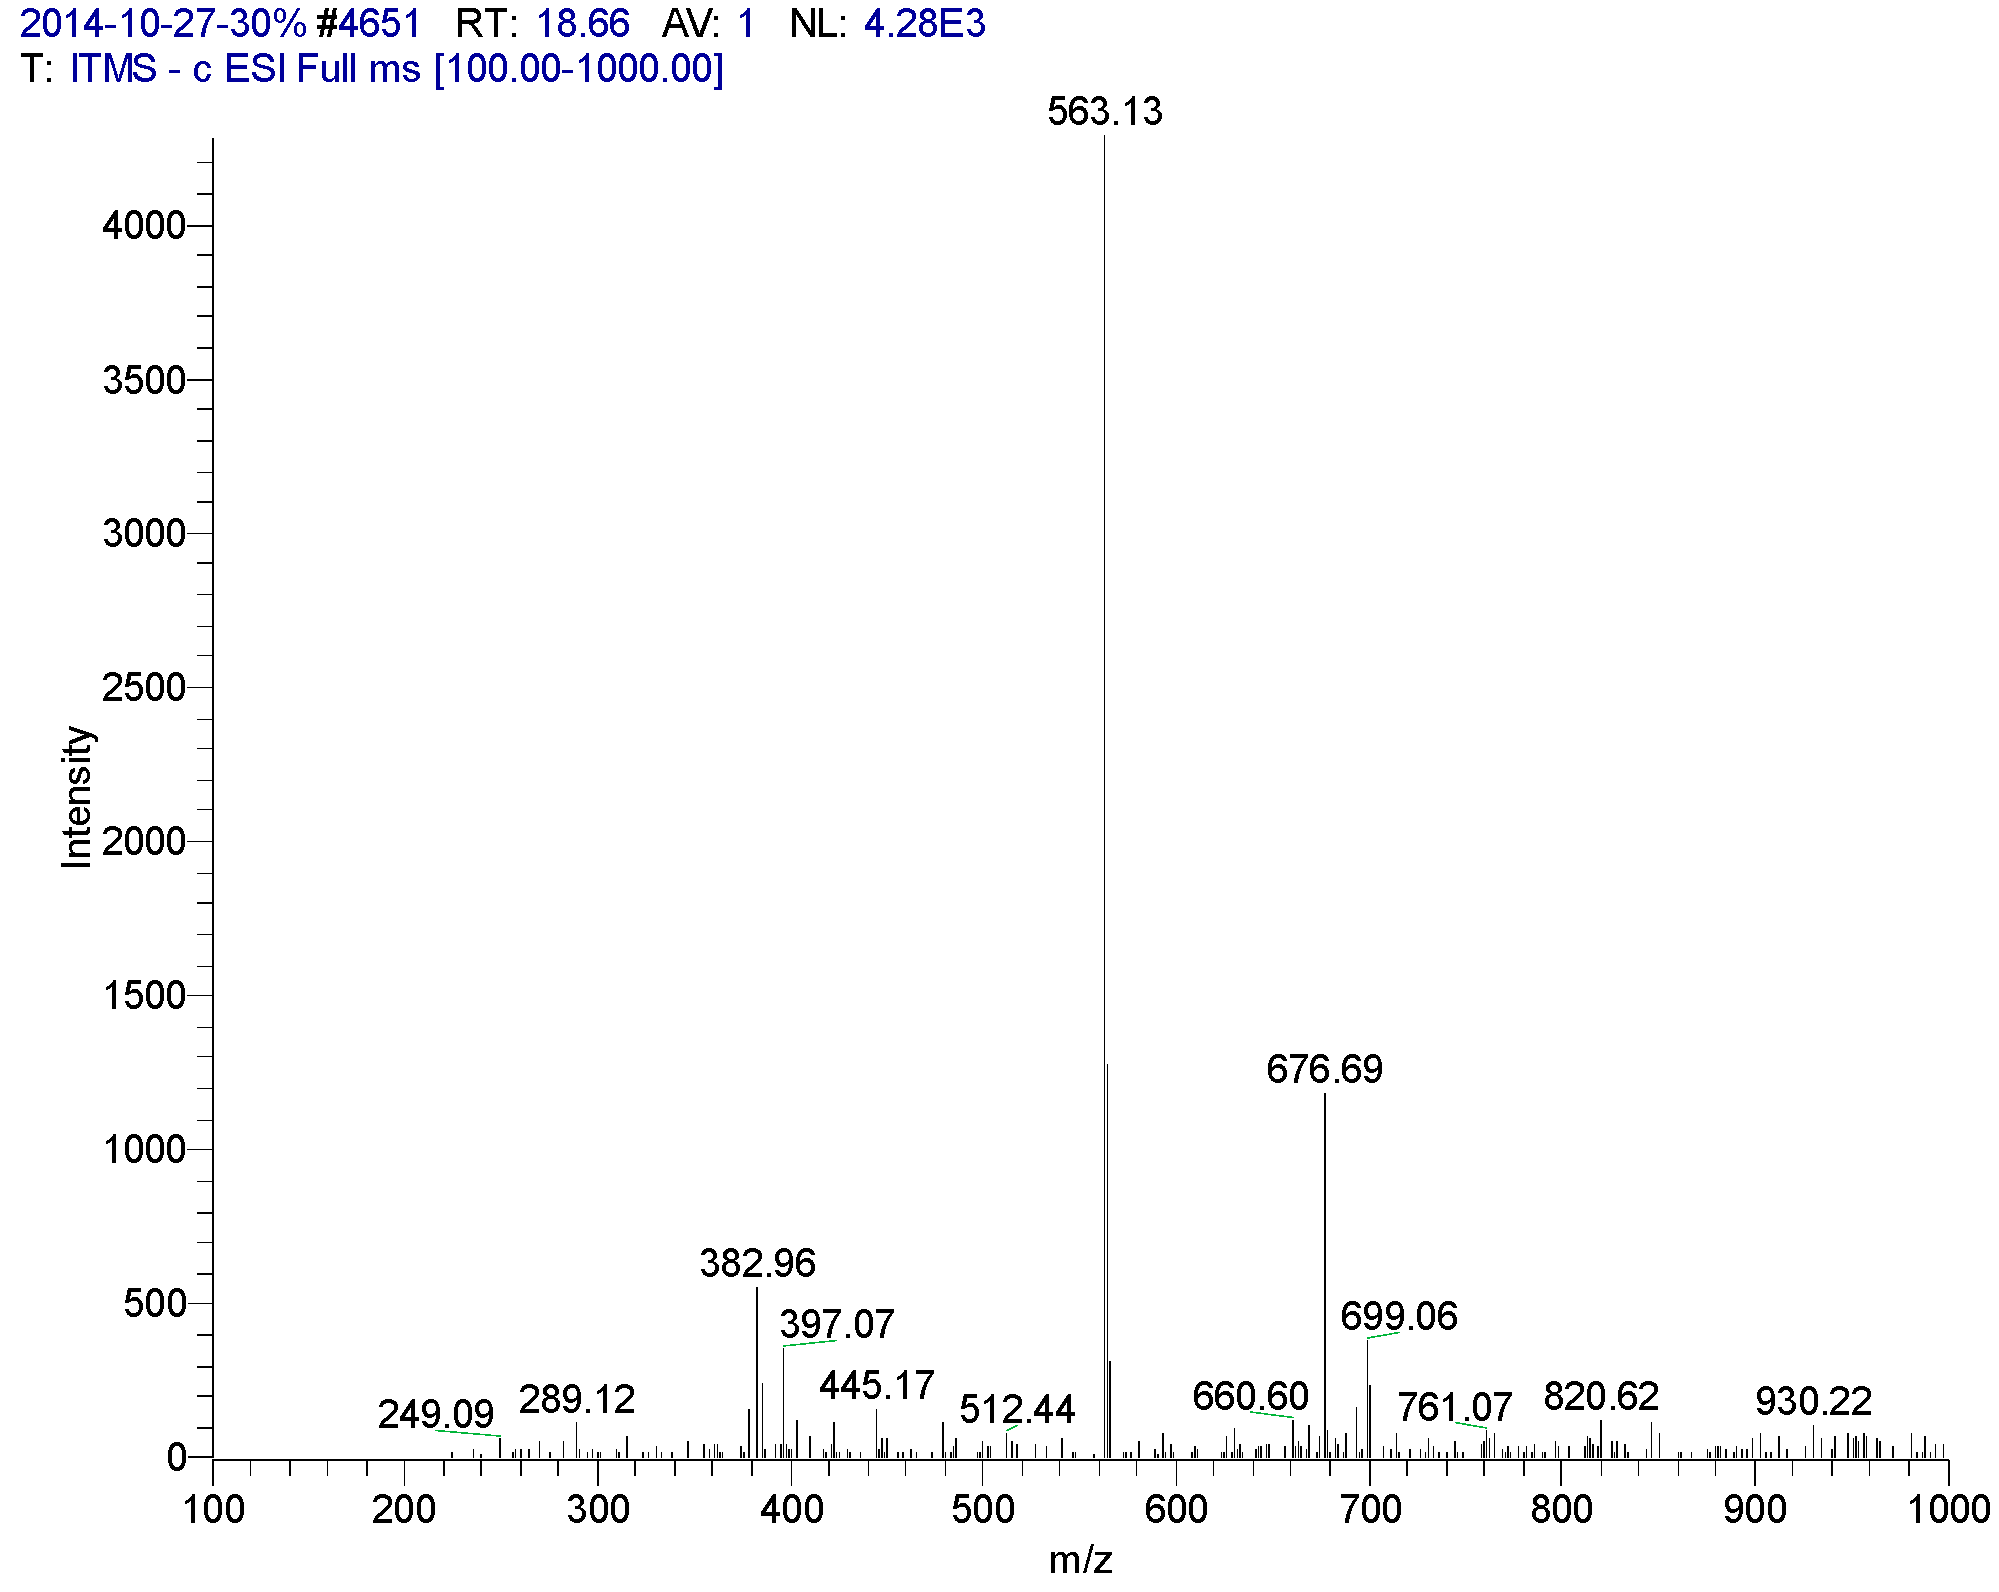
| 18.66 | Apigenin6-C-β-d-glucopyranosyl-8-C-α-l-arabinopyranoside | 563 | 249, 289, 335, 382, 397, 447, 512, 563, 676 | 234, 272 (98.95), 335 (100), 396 |
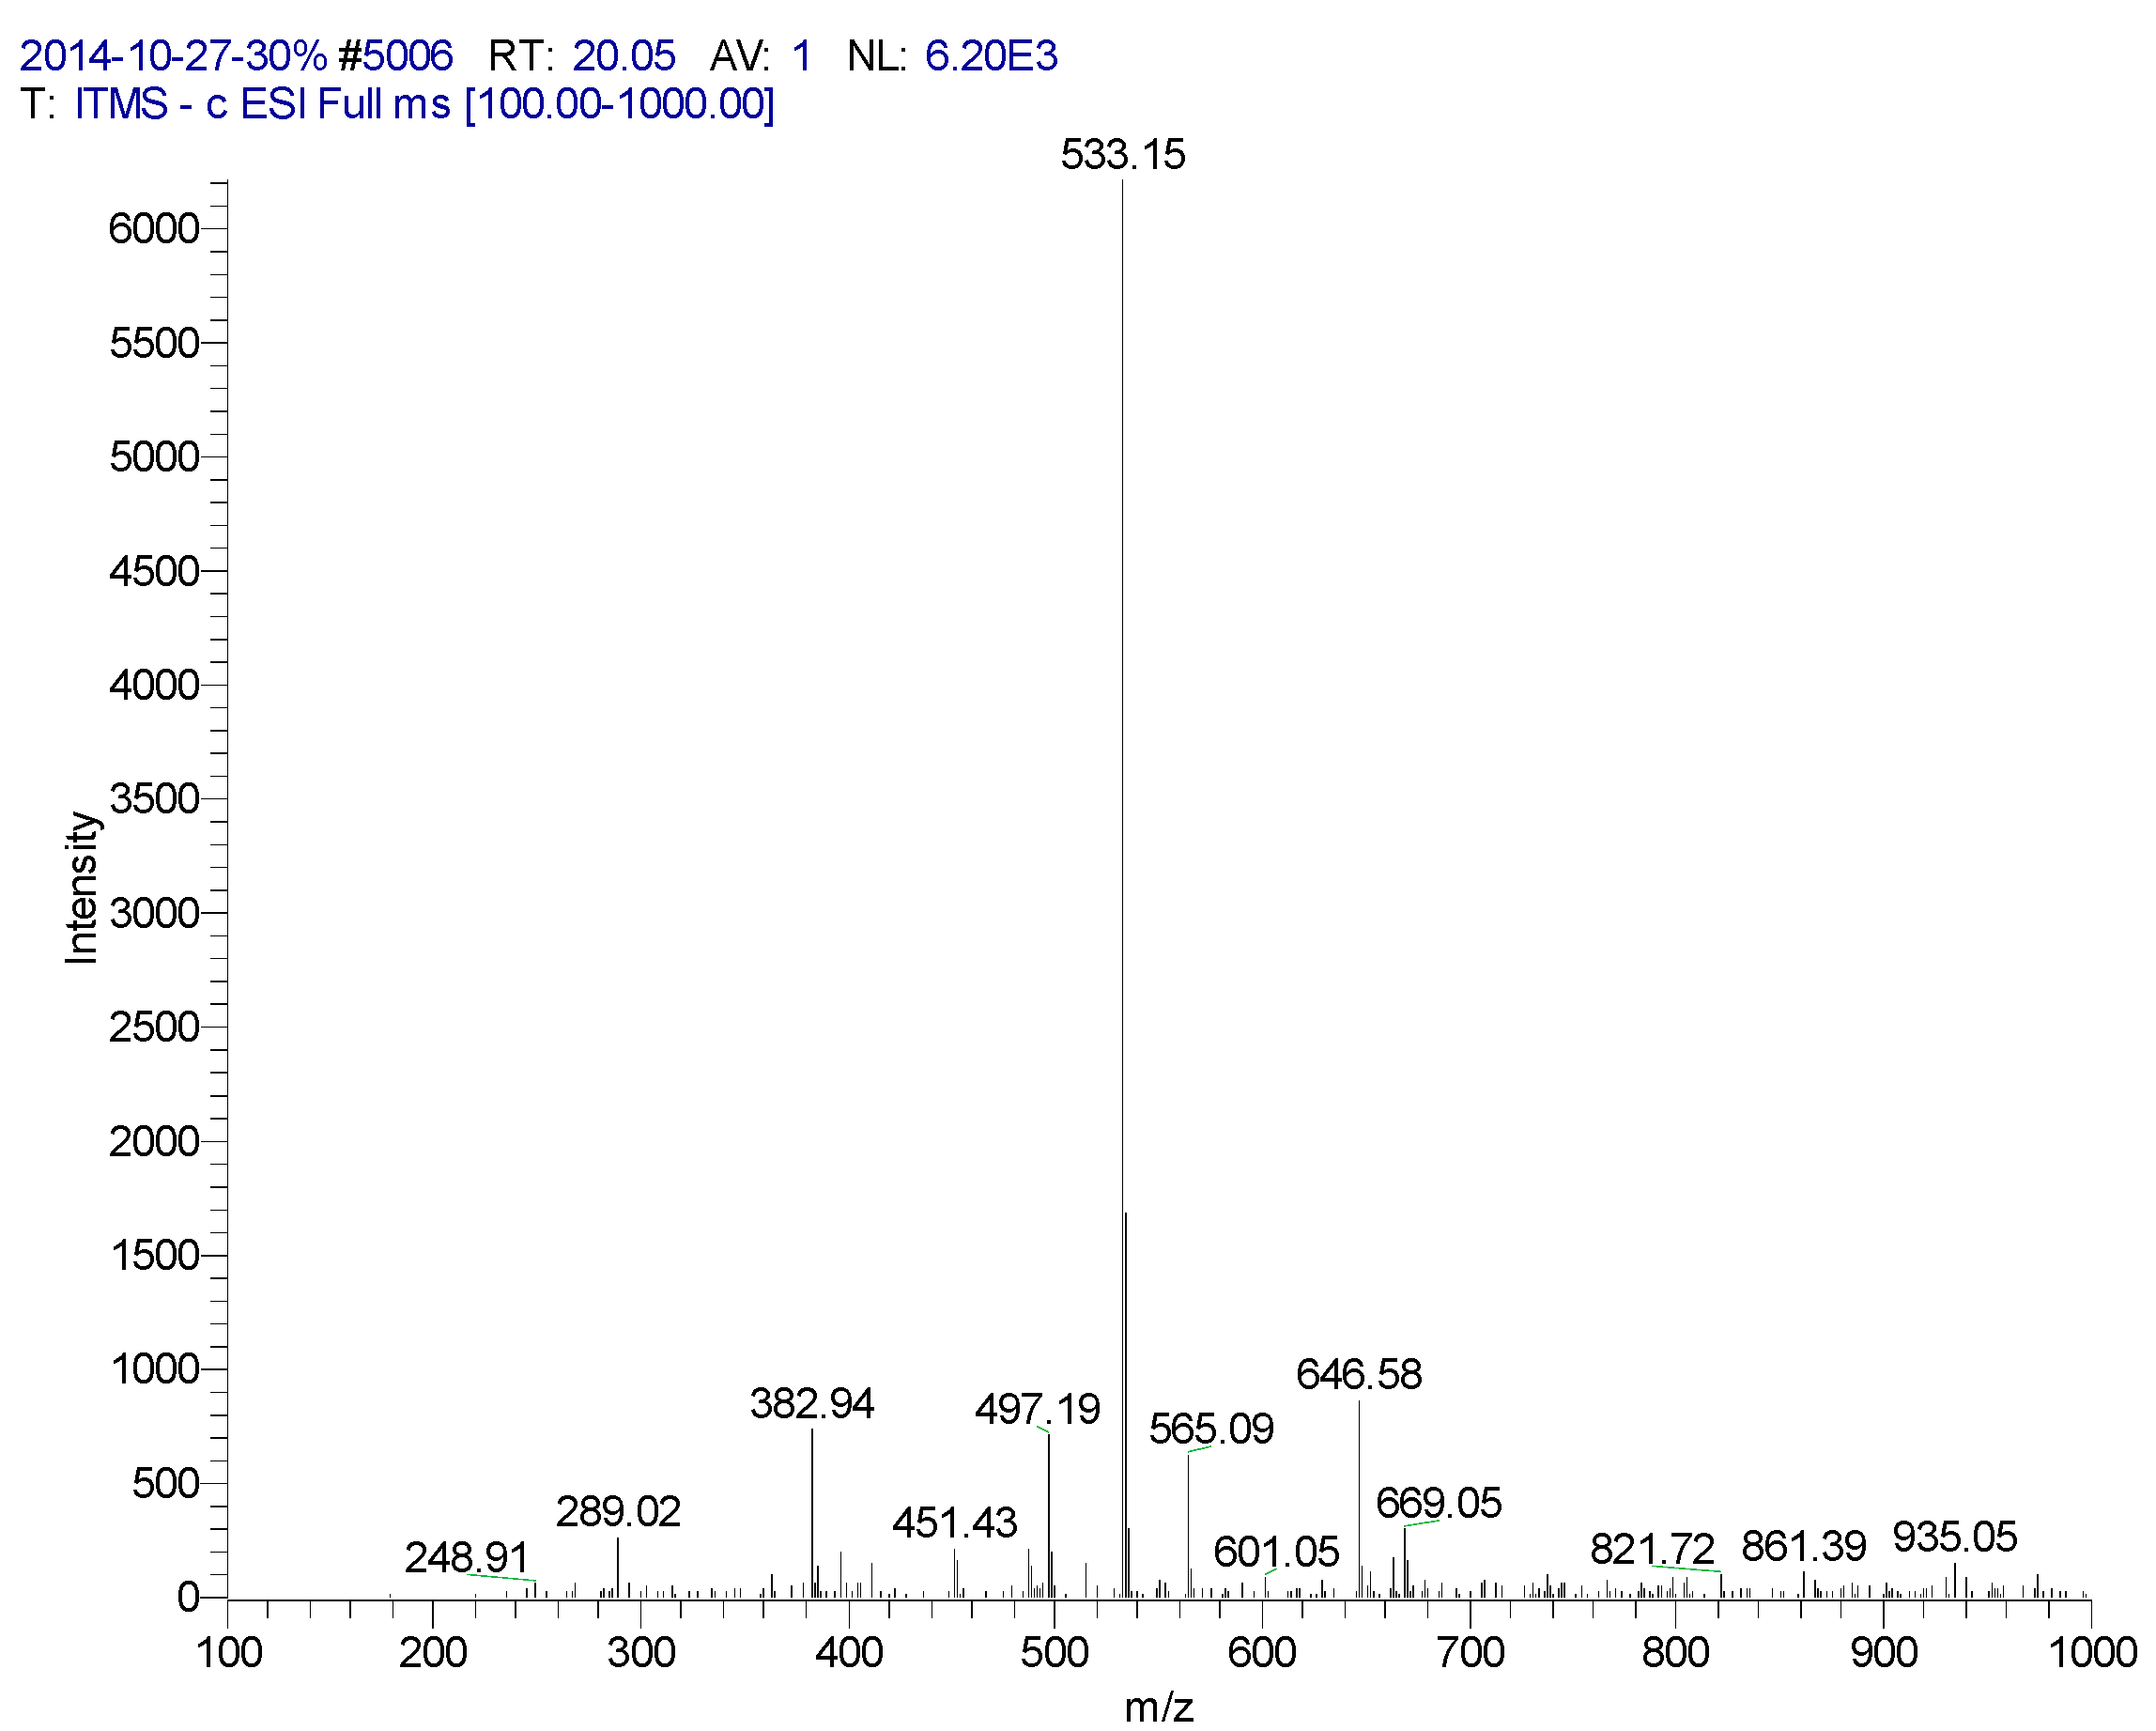
| 20.05 | 6,8-Apigenin-C-α-l-pyranarabinoside | 533 | 289, 382, 497, 533, 565, 646 | 235, 271, 335 (100), 396 |


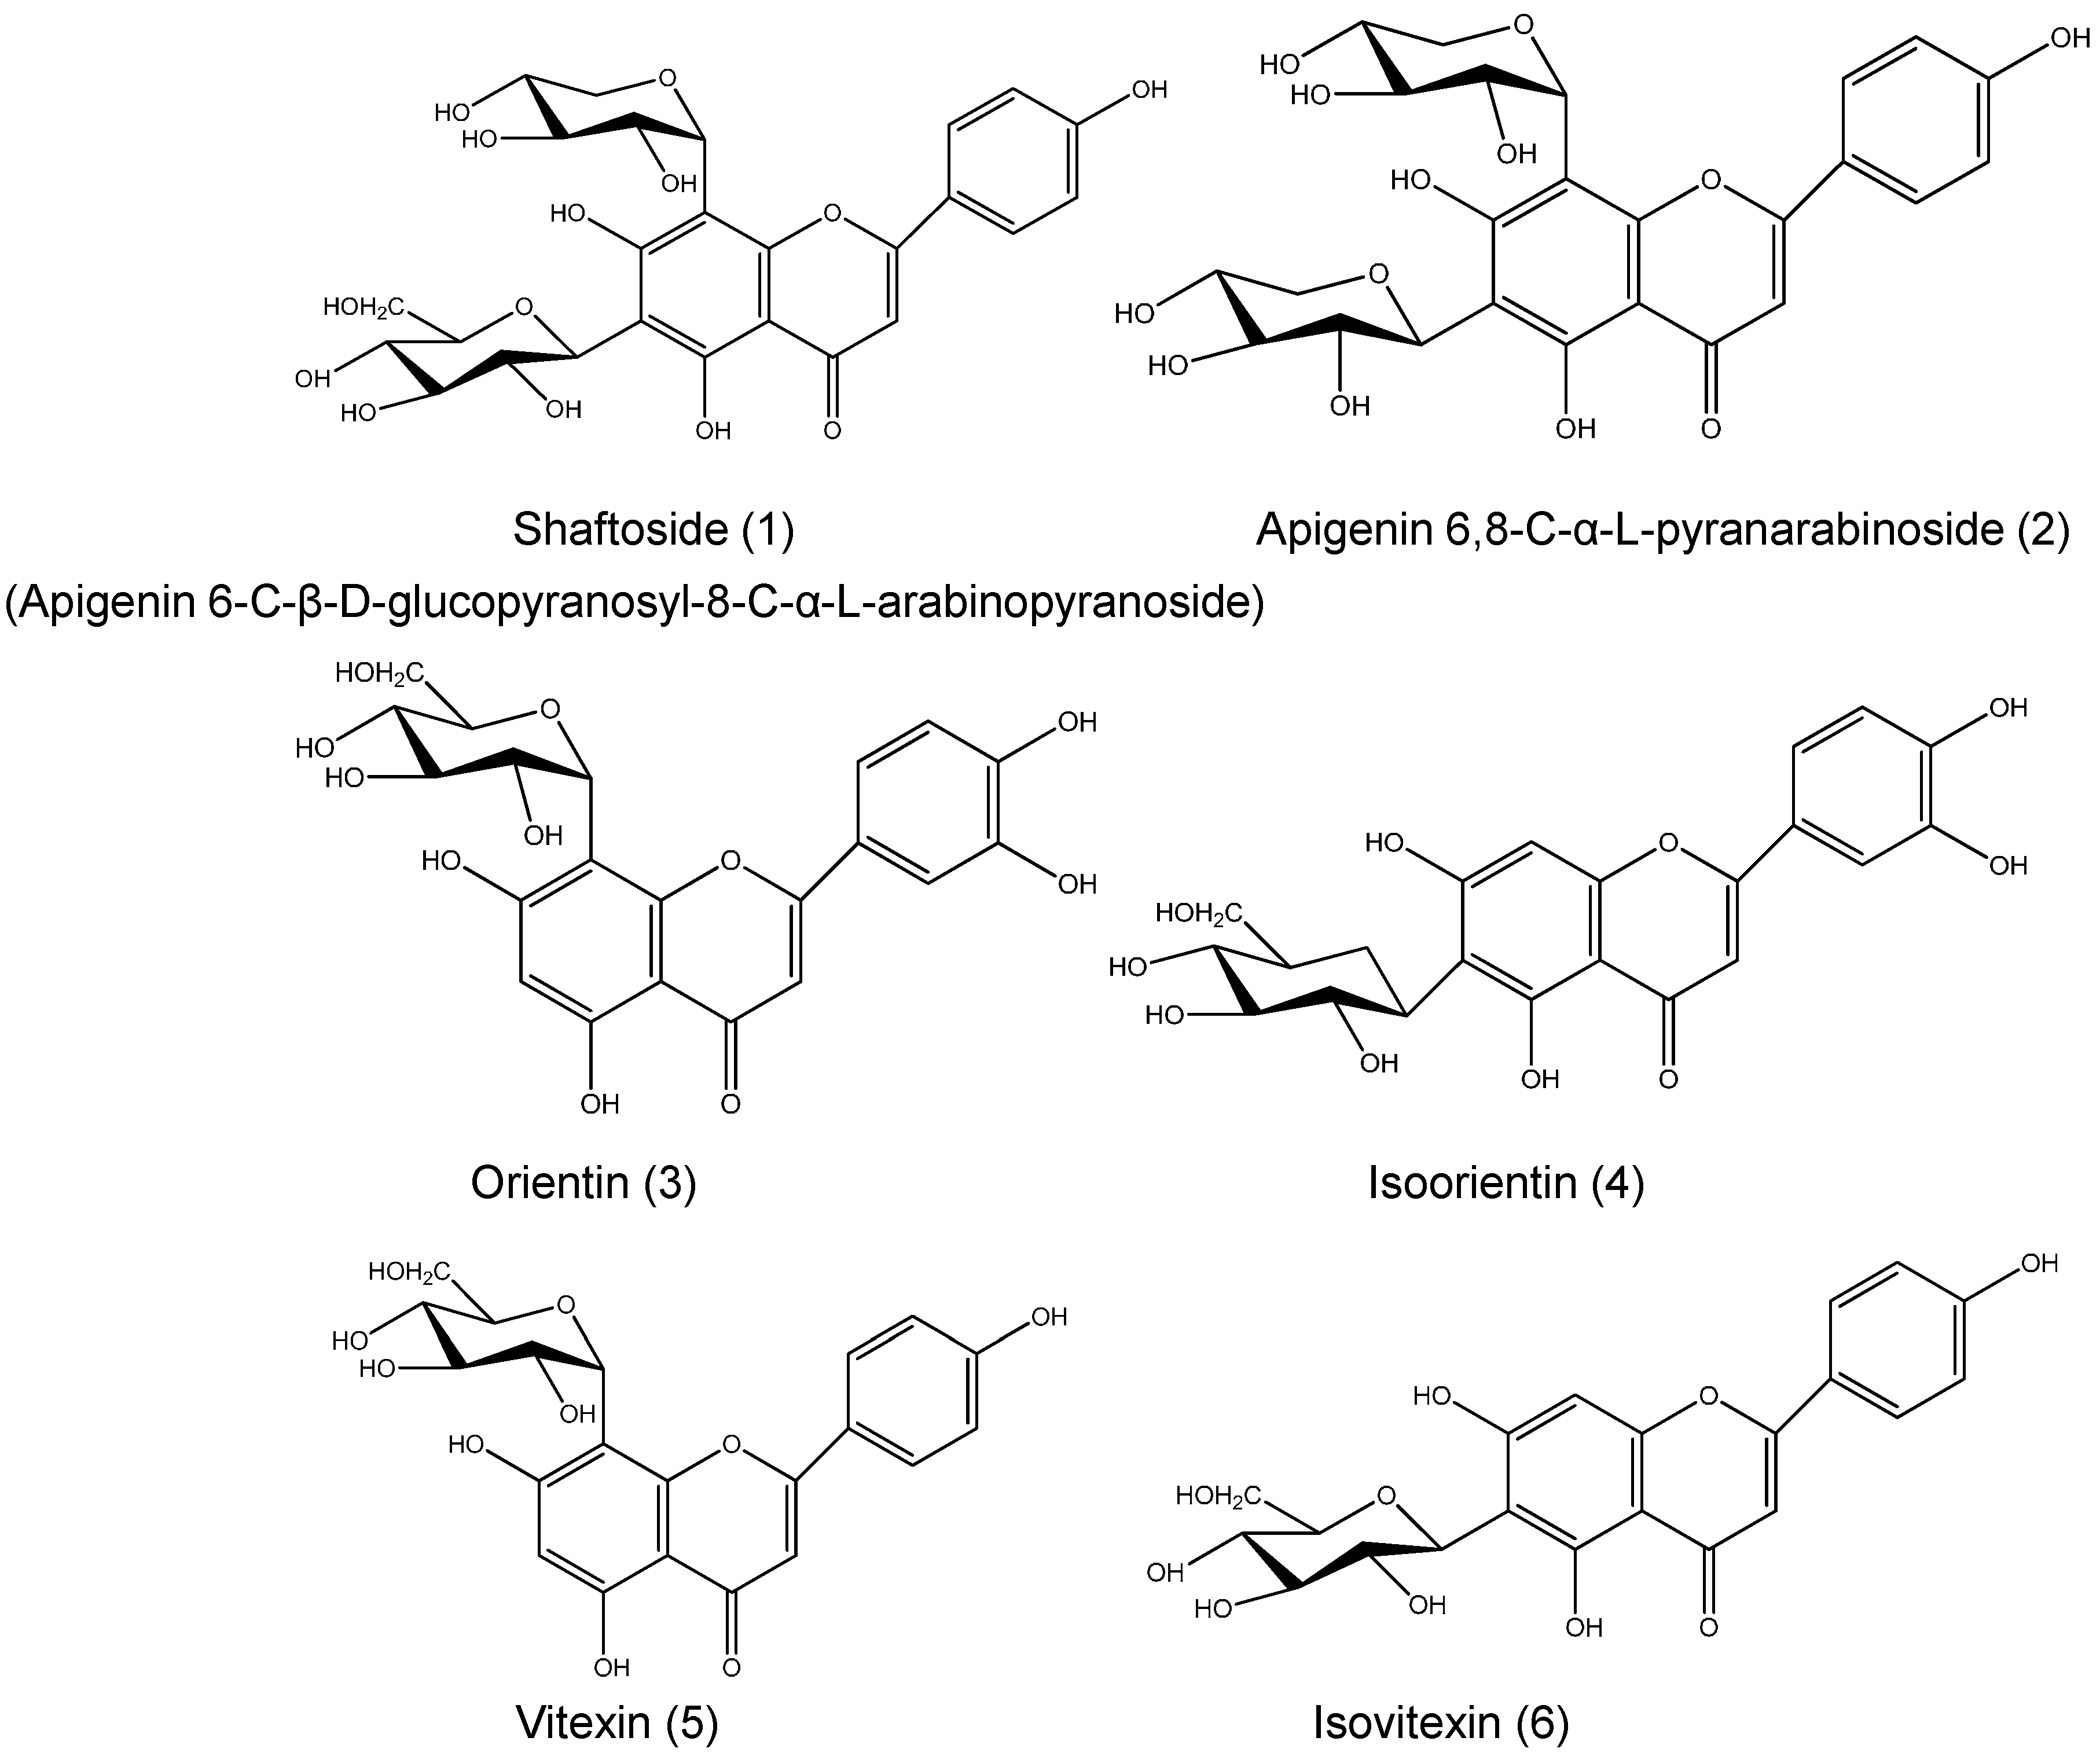
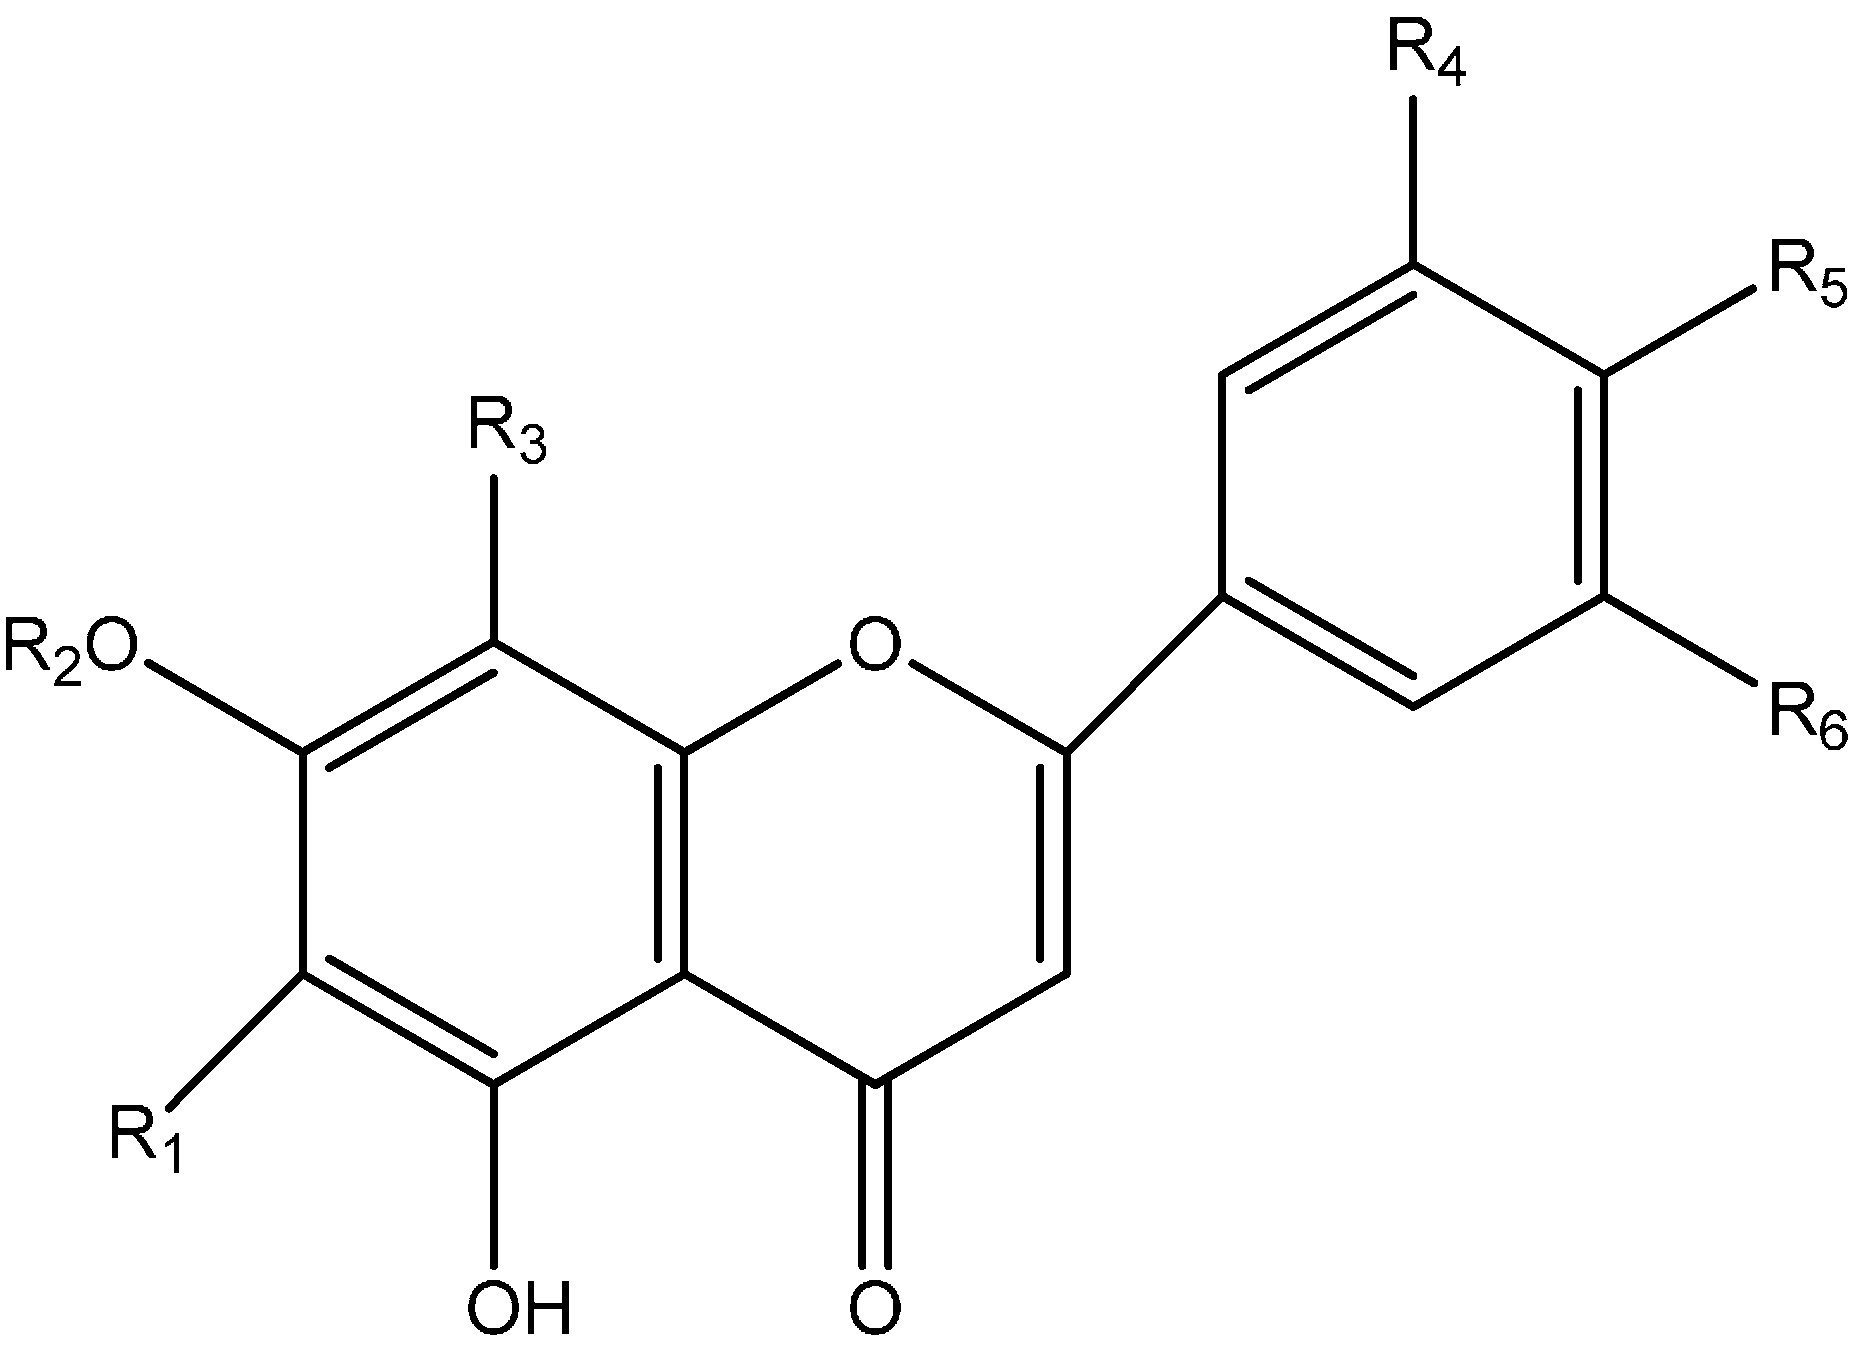
| Proposed Structure | R1 | R2 | R3 | R4 | R5 | R6 |
|---|---|---|---|---|---|---|
| Shaftoside | Glc | H | Rha | H | OH | H |
| Isoorientin | Glc | H | H | H | OH | H |
| Orientin | H | H | Glc | H | OH | OH |
| Isovitexin | Glc- | H | H | H | OH | H |
| Vitexin | H | H | Glc | H | OH | H |
| Apigenin 6,8-di-C-α-l-arabinopyranoside | Rha | H | Rha | H | OH | H |
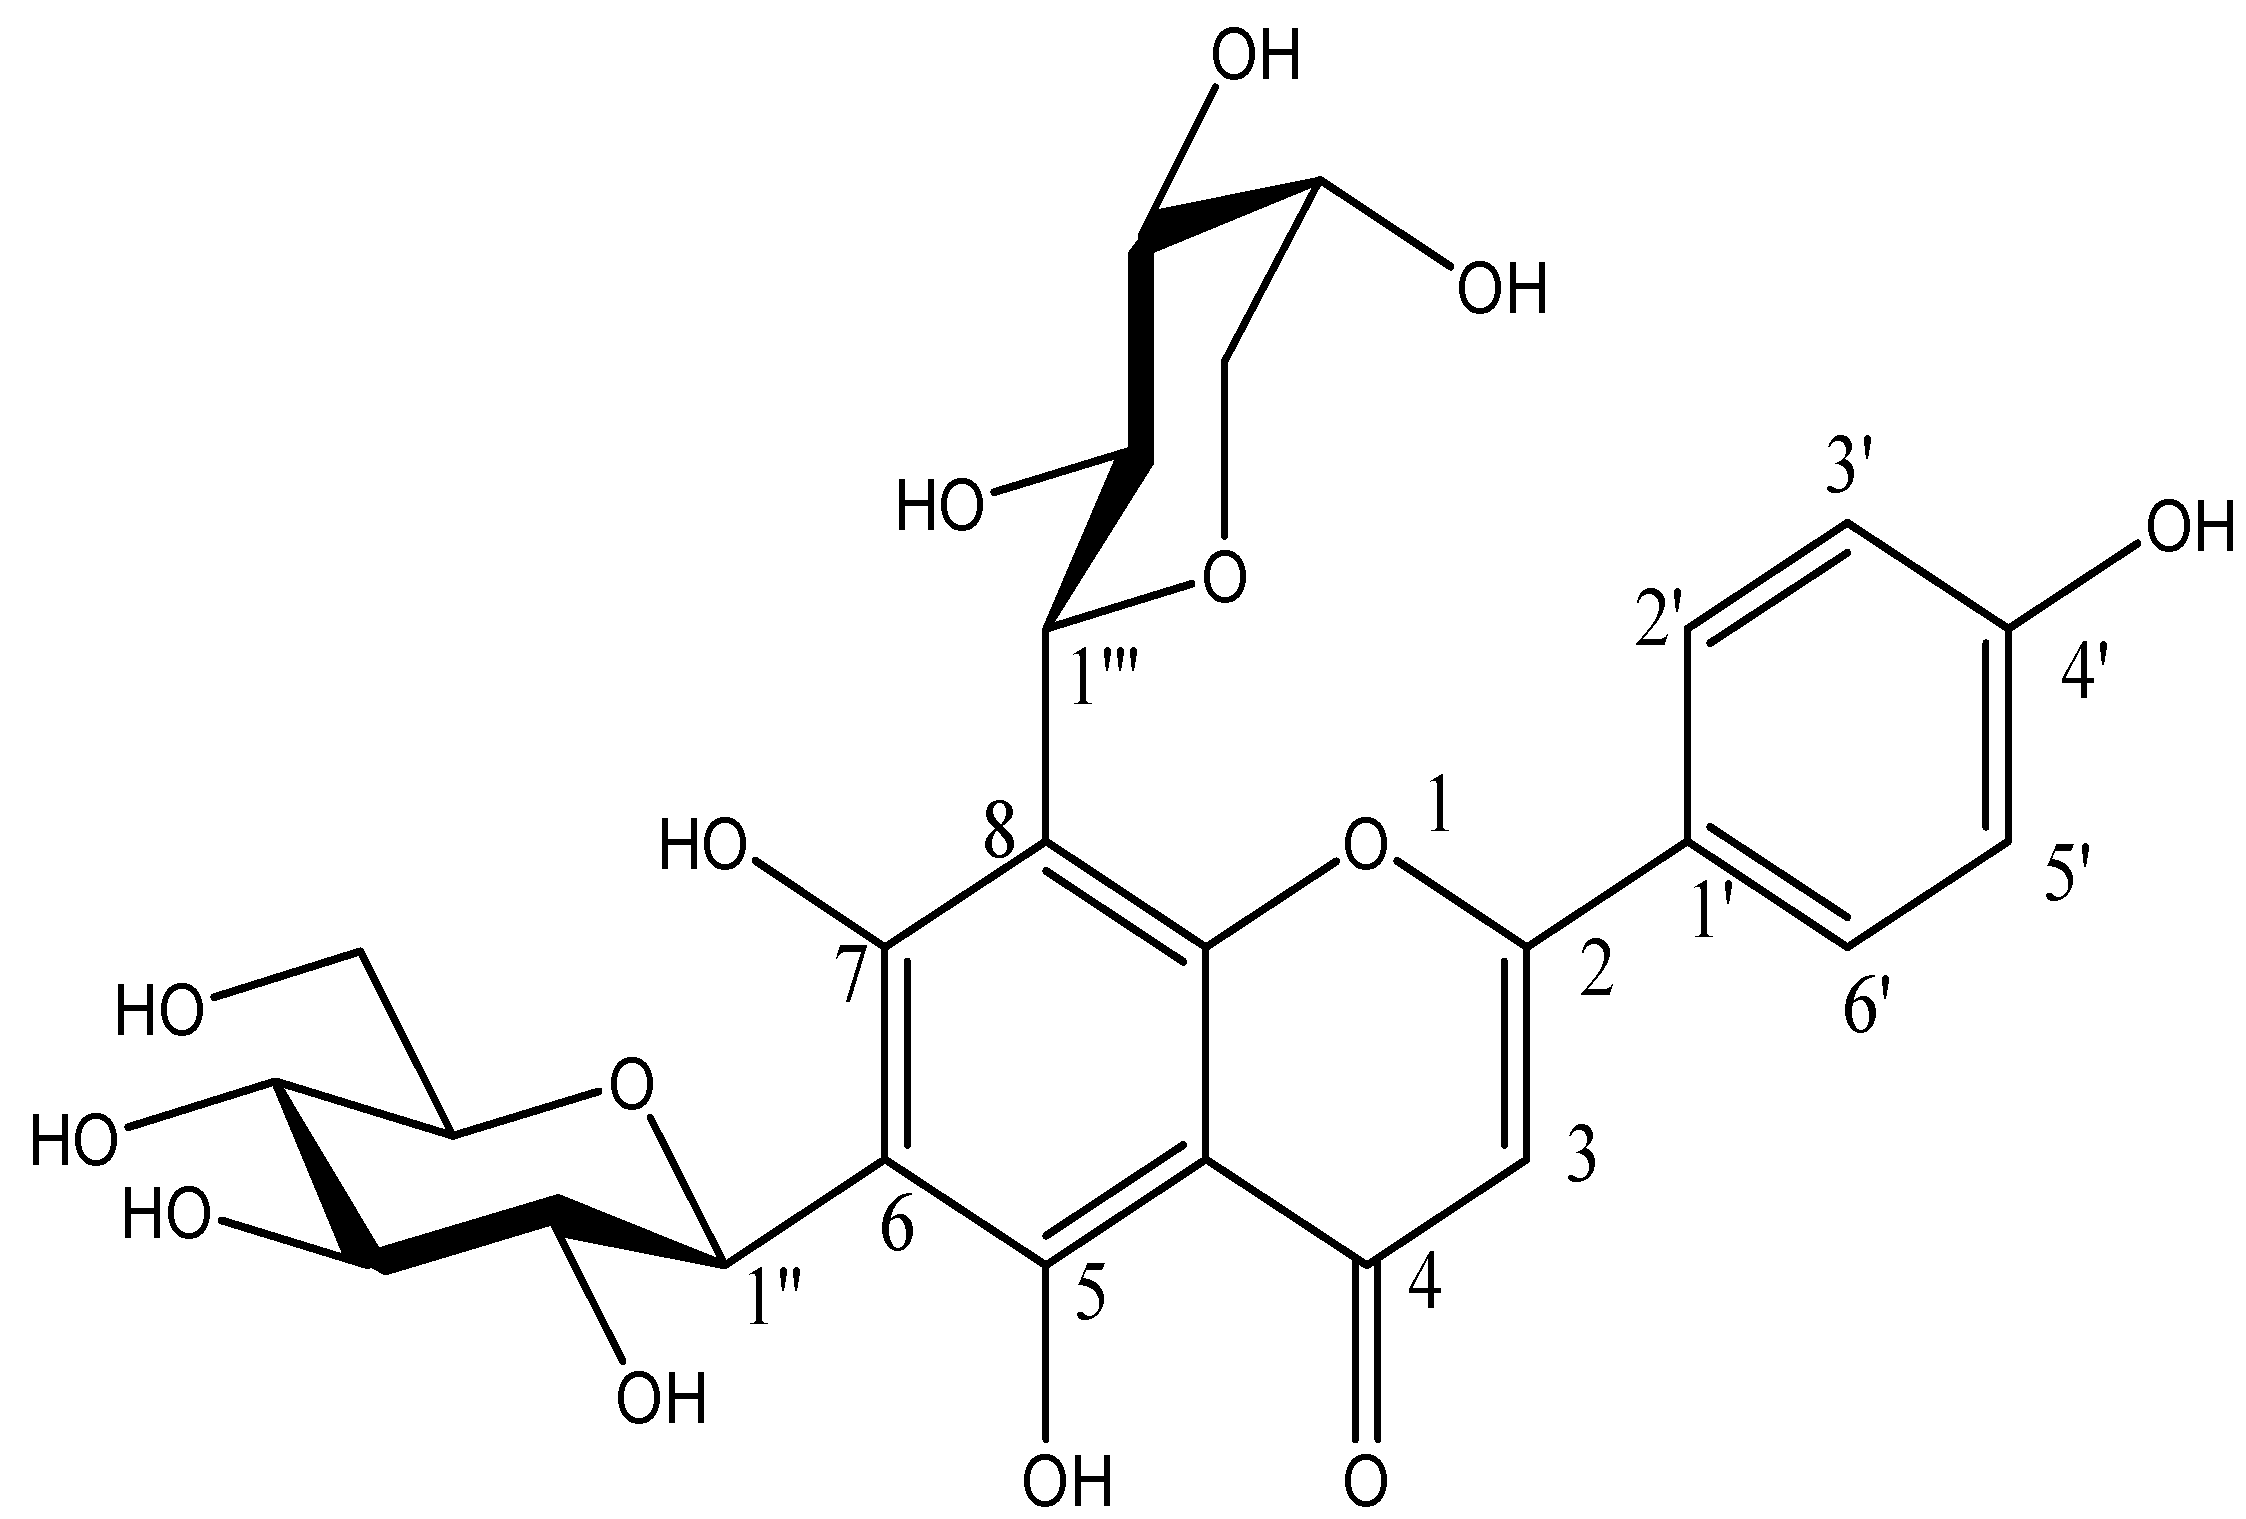
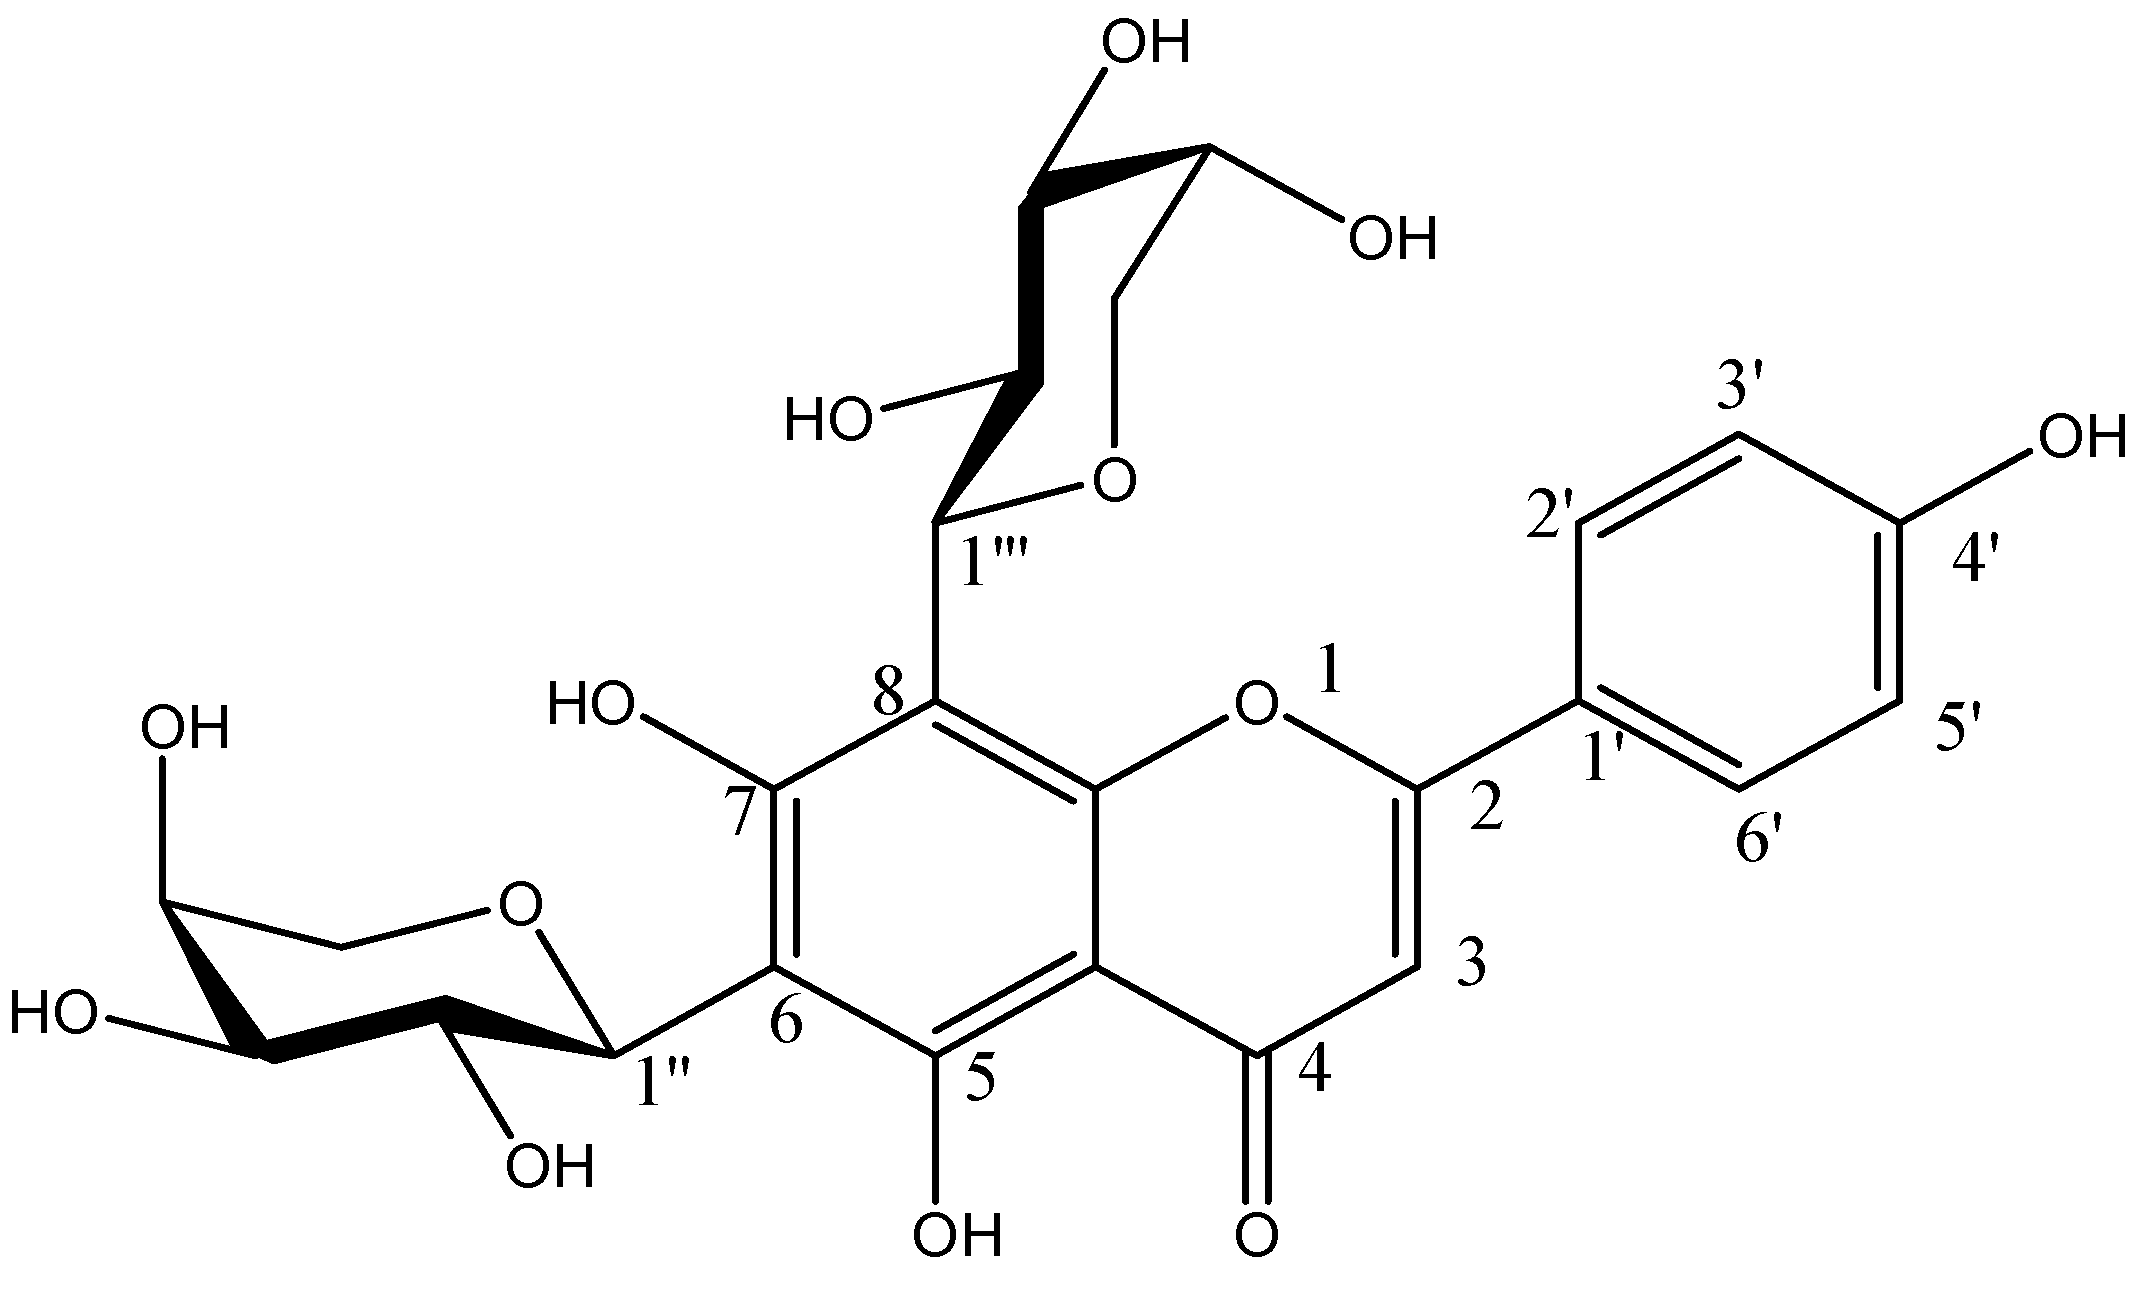
2.2. Identification of Compounds

| Carbon | 13C-NMR | 1H-NMR | 13C-NMR [19] | 1H-NMR [19] (Reference Volume) |
|---|---|---|---|---|
| 2 | 164.127 | 164.1 | ||
| 3 | 102.333 | 6.774 (1H, s) | 102.2 | 6.78 (1H, s) |
| 4 | 182.308 | 182.3 | ||
| 5 | 158.892 | 158.7 | ||
| 6 | 108.588 | 108.4 | ||
| 7 | 162.014 | 161.2 | ||
| 8 | 104.786 | 104.7 | ||
| 9 | 154.910 | 155.0 | ||
| 10 | 103.427 | 103.5 | ||
| 1′ | 121.331 | 121.1 | ||
| 2′ | 129.360 | 8.149 (2H, brs) | 129.4 | 8.15 (2H, brs) |
| 3′ | 116.117 | 6.914, 6.892 (2H, d, J = 8.8 Hz) | 116.0 | 6.91 (2H, d, J = 8.8 Hz) |
| 4′ | 161.239 | 161.2 | ||
| 5′ | 116.117 | 6.914,6.892 (2H, d, J = 8.8 Hz) | 116.0 | 6.91 (2H, d, J = 8.8 Hz) |
| 6′ | 129.360 | 8.149 (2H, brs) | 129.4 | 8.15 (2H, brs) |
| 6-Ara | ||||
| 1′′ | 74.298 | 4.665 (1H, d, J = 9.2 Hz) | 74.1 | 4.66 (1H, d, J = 9.5 Hz) |
| 2′′ | 68.776 | 3.997 (1H, brm) | 68.6 | 4.00 (1H, brm) |
| 3′′ | 74.829 | 3.448 (1H, m) | 74.6 | 3.44 (1H, m) |
| 4'' | 69.126 | 3.802 (1H, m) | 69.0 | 3.79 (1H,m) |
| 5'' | 70.294 | 3.870, 3.606 (2 × 1H, 2 × m) | 70.2 | 3.83, 3.60 (2 × 1H, 2 × m) |
| 8-Ara | ||||
| 1′′′ | 74.298 | 4.724 (1H ,d, J = 9.2 Hz) | 74.1 | 4.72 (1H, d, J = 9.4 Hz) |
| 2′′′ | 69.126 | 4.211 (1H, brm) | 69.0 | 4.22 (1H, brm) |
| 3′′′ | 75.031 | 3.487 (1H, m) | 74.9 | 3.48 (1H, m) |
| 4′′′ | 70.294 | 3.802 (1H, m) | 70.2 | 3.85 (1H, m) |
| 5′′′ | 71.059 | 3.901, 3.635 (2 × 1H, 2 × m) | 71.0 | 3.90, 3.62 (2 × 1H, 2 × m) |
| 5-OH | 13.752 (1H, brs) | 13.76 (1H, brs) |

| Carbon | 13C-NMR | 1H-NMR | 13C-NMR [19] | 1H-NMR [1] (Reference Volume) |
|---|---|---|---|---|
| 2 | 164.127 | 164.1 | ||
| 3 | 102.333 | 6.774 (1H, s) | 102.2 | 6.78 (1H, s) |
| 4 | 182.308 | 182.3 | ||
| 5 | 158.892 | 158.7 | ||
| 6 | 108.588 | 108.4 | ||
| 7 | 162.014 | 161.2 | ||
| 8 | 104.786 | 104.7 | ||
| 9 | 154.910 | 155.0 | ||
| 10 | 103.427 | 103.5 | ||
| 1′ | 121.331 | 121.1 | ||
| 2′ | 129.360 | 8.149 (2H, brs) | 129.4 | 8.15 (2H, brs) |
| 3′ | 116.117 | 6.914, 6.892 (2H, d, J = 8.8 Hz) | 116.0 | 6.91 (2H, d, J = 8.8 Hz) |
| 4′ | 161.239 | 161.2 | ||
| 5′ | 116.117 | 6.914, 6.892 (2H, d, J = 8.8 Hz) | 116.0 | 6.91 (2H, d, J = 8.8 Hz) |
| 6′ | 129.360 | 8.149 (2H, brs) | 129.4 | 8.15 (2H, brs) |
| 6-Ara | ||||
| 1′′ | 74.298 | 4.665 (1H, d, J = 9.2 Hz) | 74.1 | 4.66 (1H, d, J = 9.5 Hz) |
| 2′′ | 68.776 | 3.997 (1H, brm) | 68.6 | 4.00 (1H, brm) |
| 3′′ | 74.829 | 3.448 (1H, m) | 74.6 | 3.44 (1H,m) |
| 4′′ | 69.126 | 3.802 (1H, m) | 69.0 | 3.79 (1H, m) |
| 5'' | 70.294 | 3.870, 3.606 (2 × 1H, 2 × m) | 70.2 | 3.83, 3.60(2 × 1H, 2 × m) |
| 8-Ara | ||||
| 1′′′ | 74.298 | 4.724 (1H, d, J = 9.2 Hz) | 74.1 | 4.72 (1H, d, J = 9.4 Hz) |
| 2′′′ | 69.126 | 4.211 (1H, brm) | 69.0 | 4.22 (1H, brm) |
| 3′′′ | 75.031 | 3.487 (1H, m) | 74.9 | 3.48 (1H, m) |
| 4′′′ | 70.294 | 3.802 (1H, m) | 70.2 | 3.85 (1H, m) |
| 5′′′ | 71.059 | 3.901, 3.635 (2 × 1H, 2 × m) | 71.0 | 3.90, 3.62(2 × 1H, 2 × m) |
| 5-OH | 13.752 (1H, brs) | 13.76 (1H, brs) |
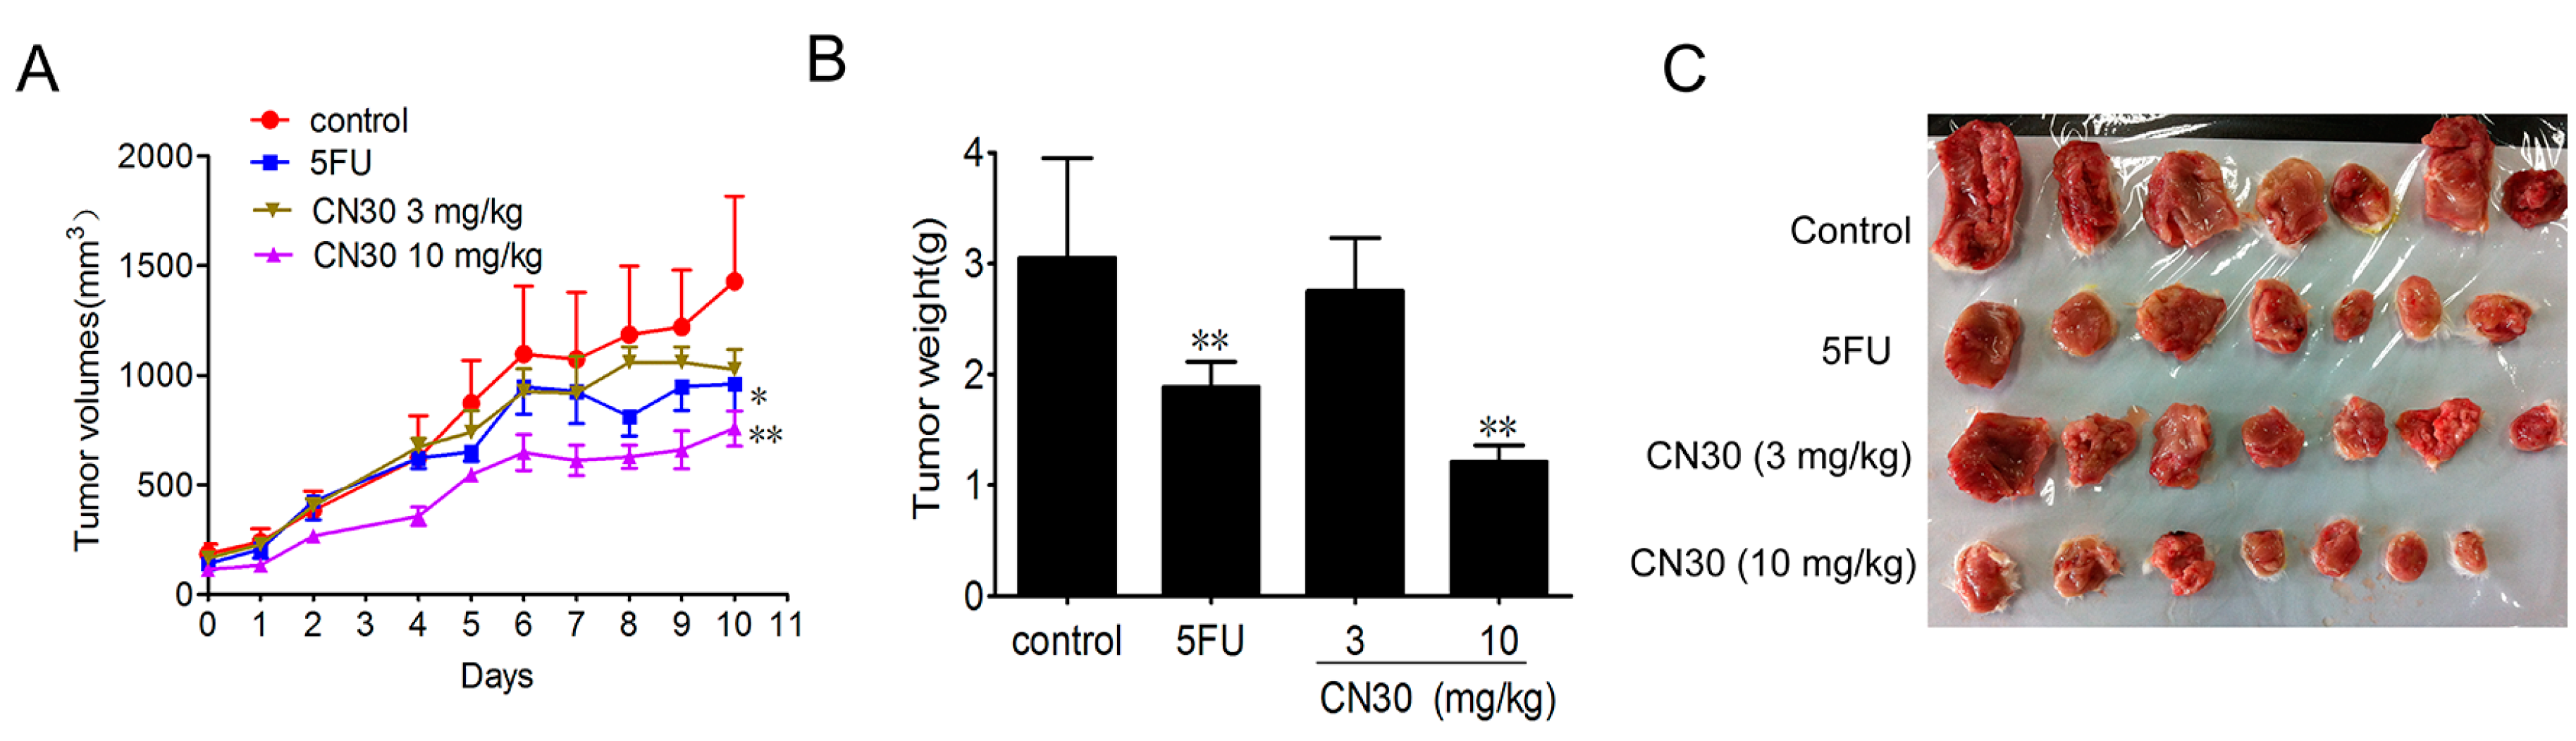
2.3. Effect of CN30 on HepAXenograf Growth in Vivo


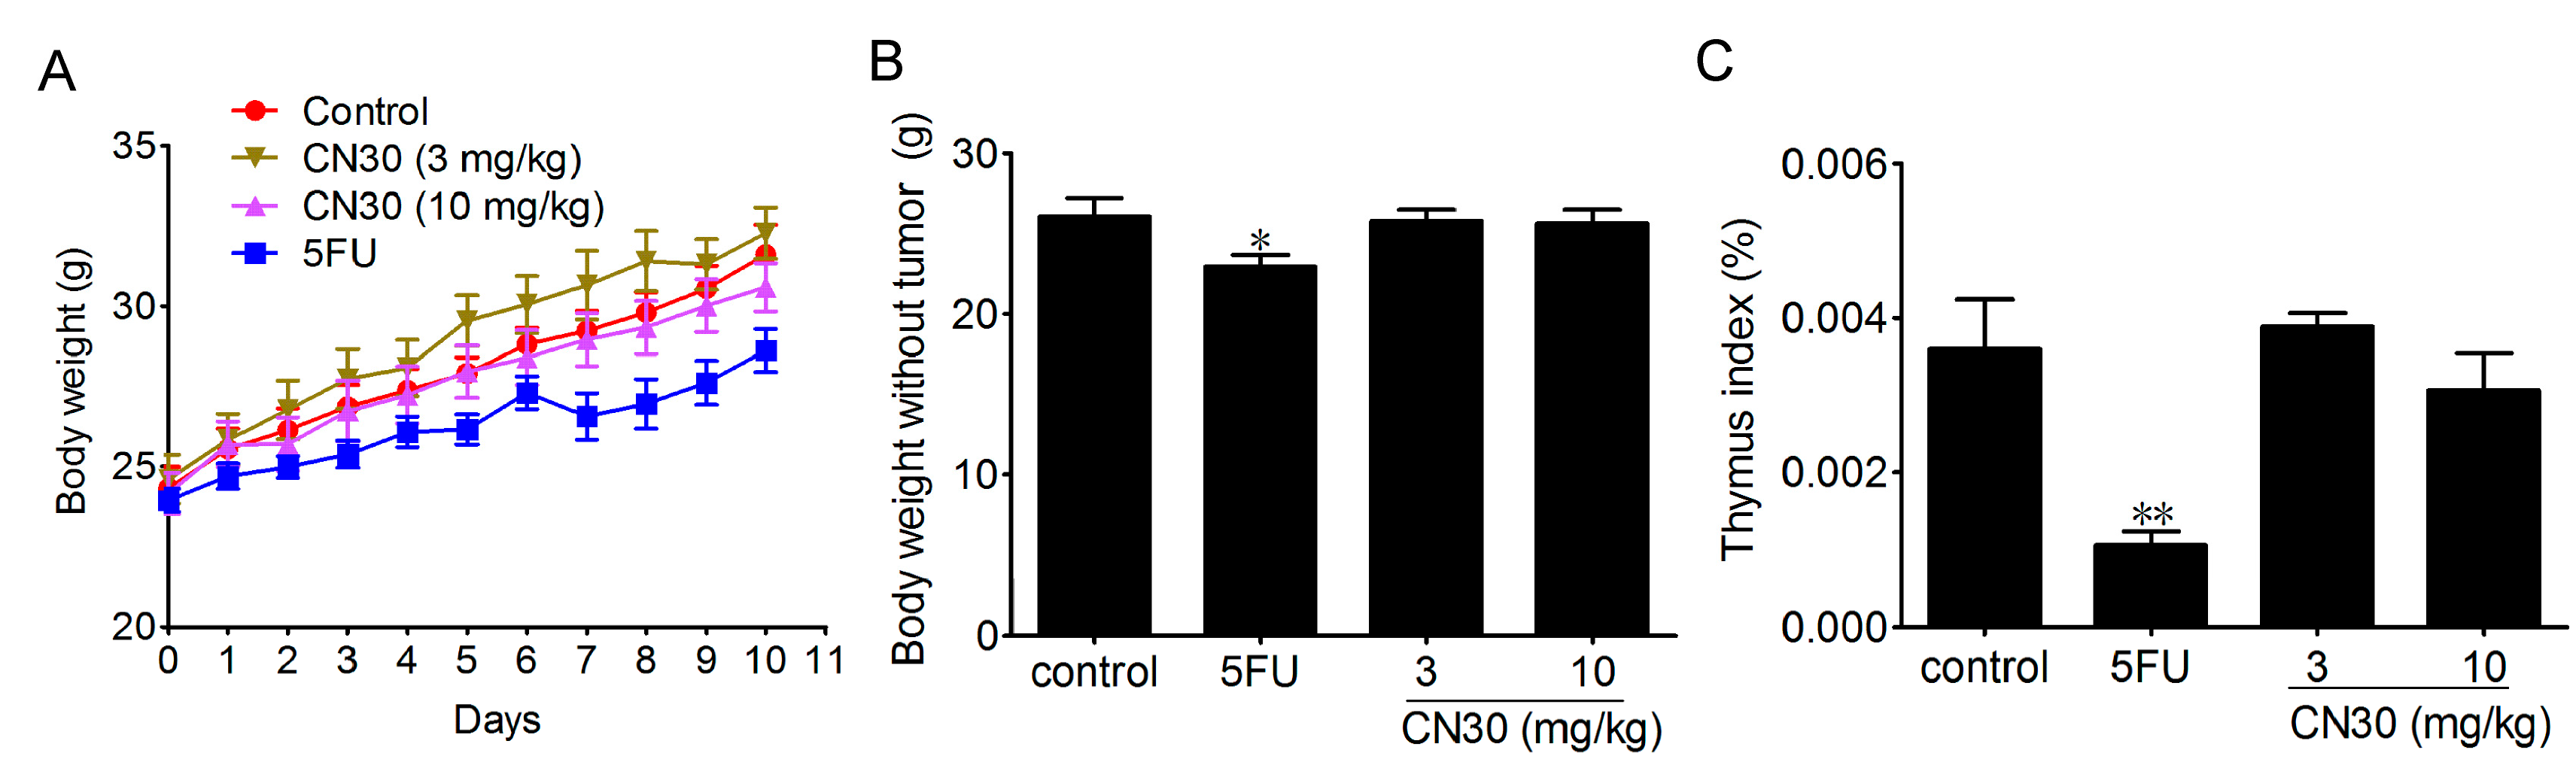
2.4. Effect of CN30 Treatment on Body Weight and Immune Organ Index

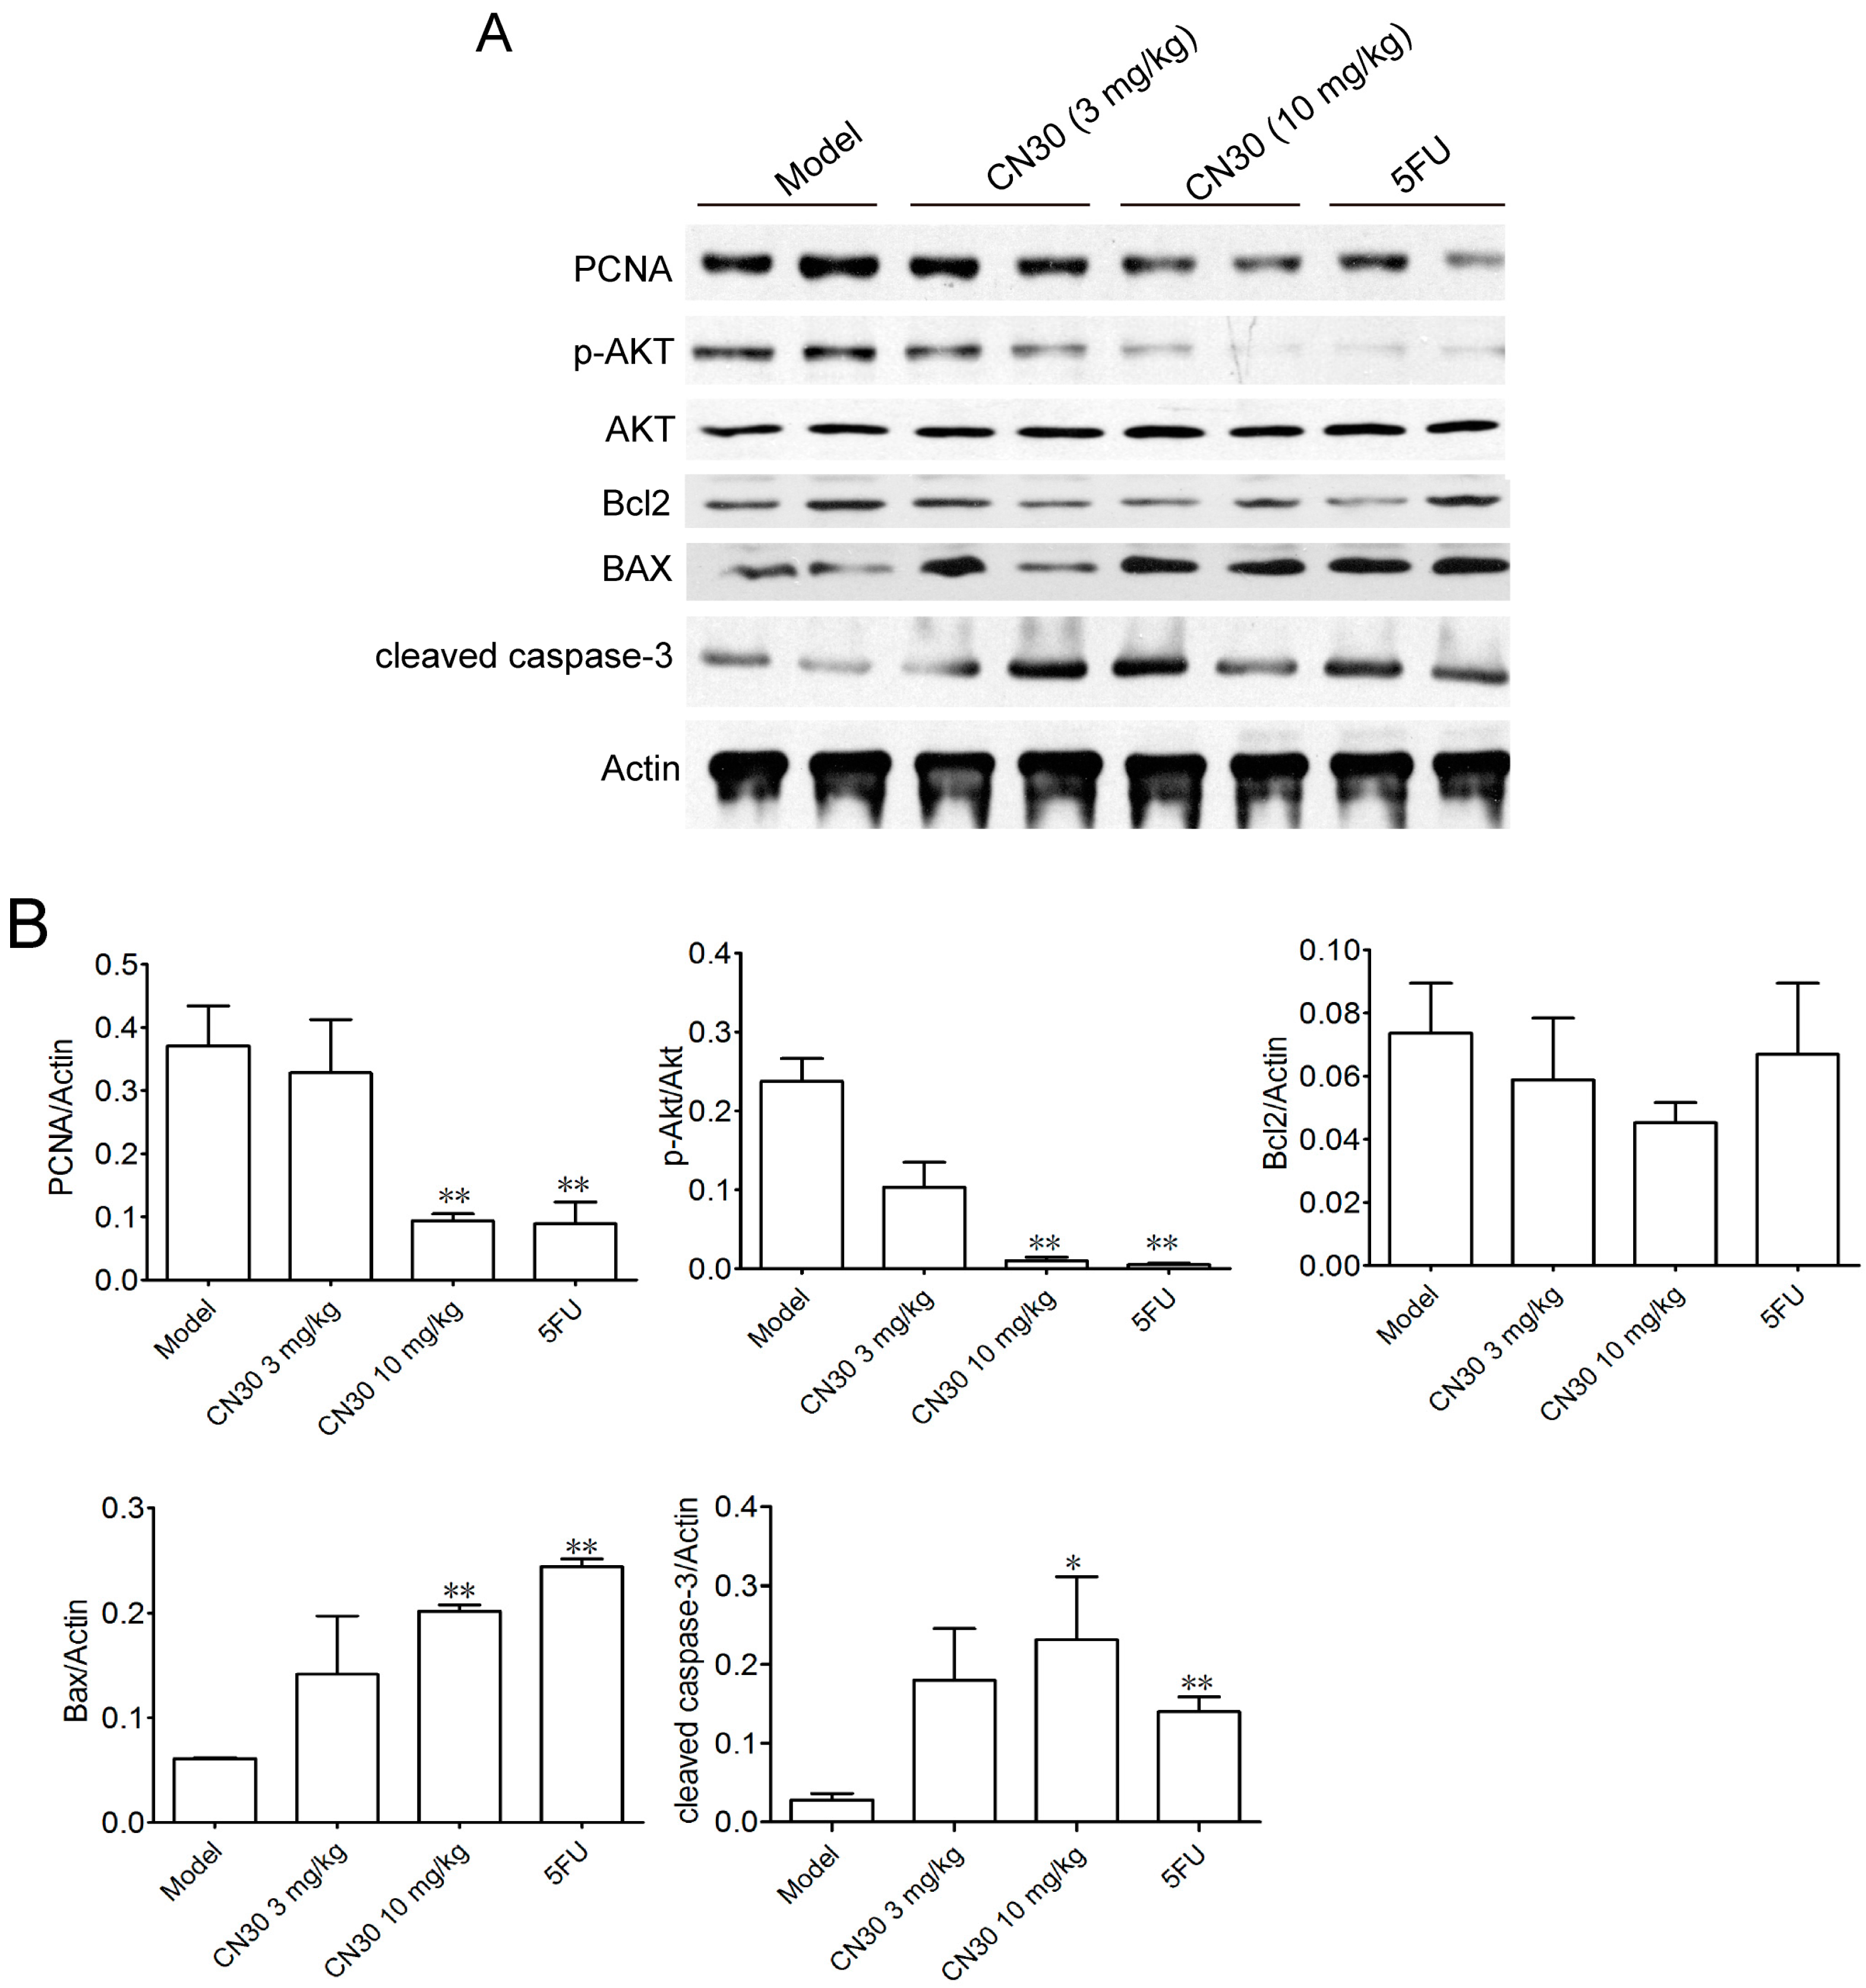
2.5. Effect of CN30 on Induced Tumor Cell Apoptosis


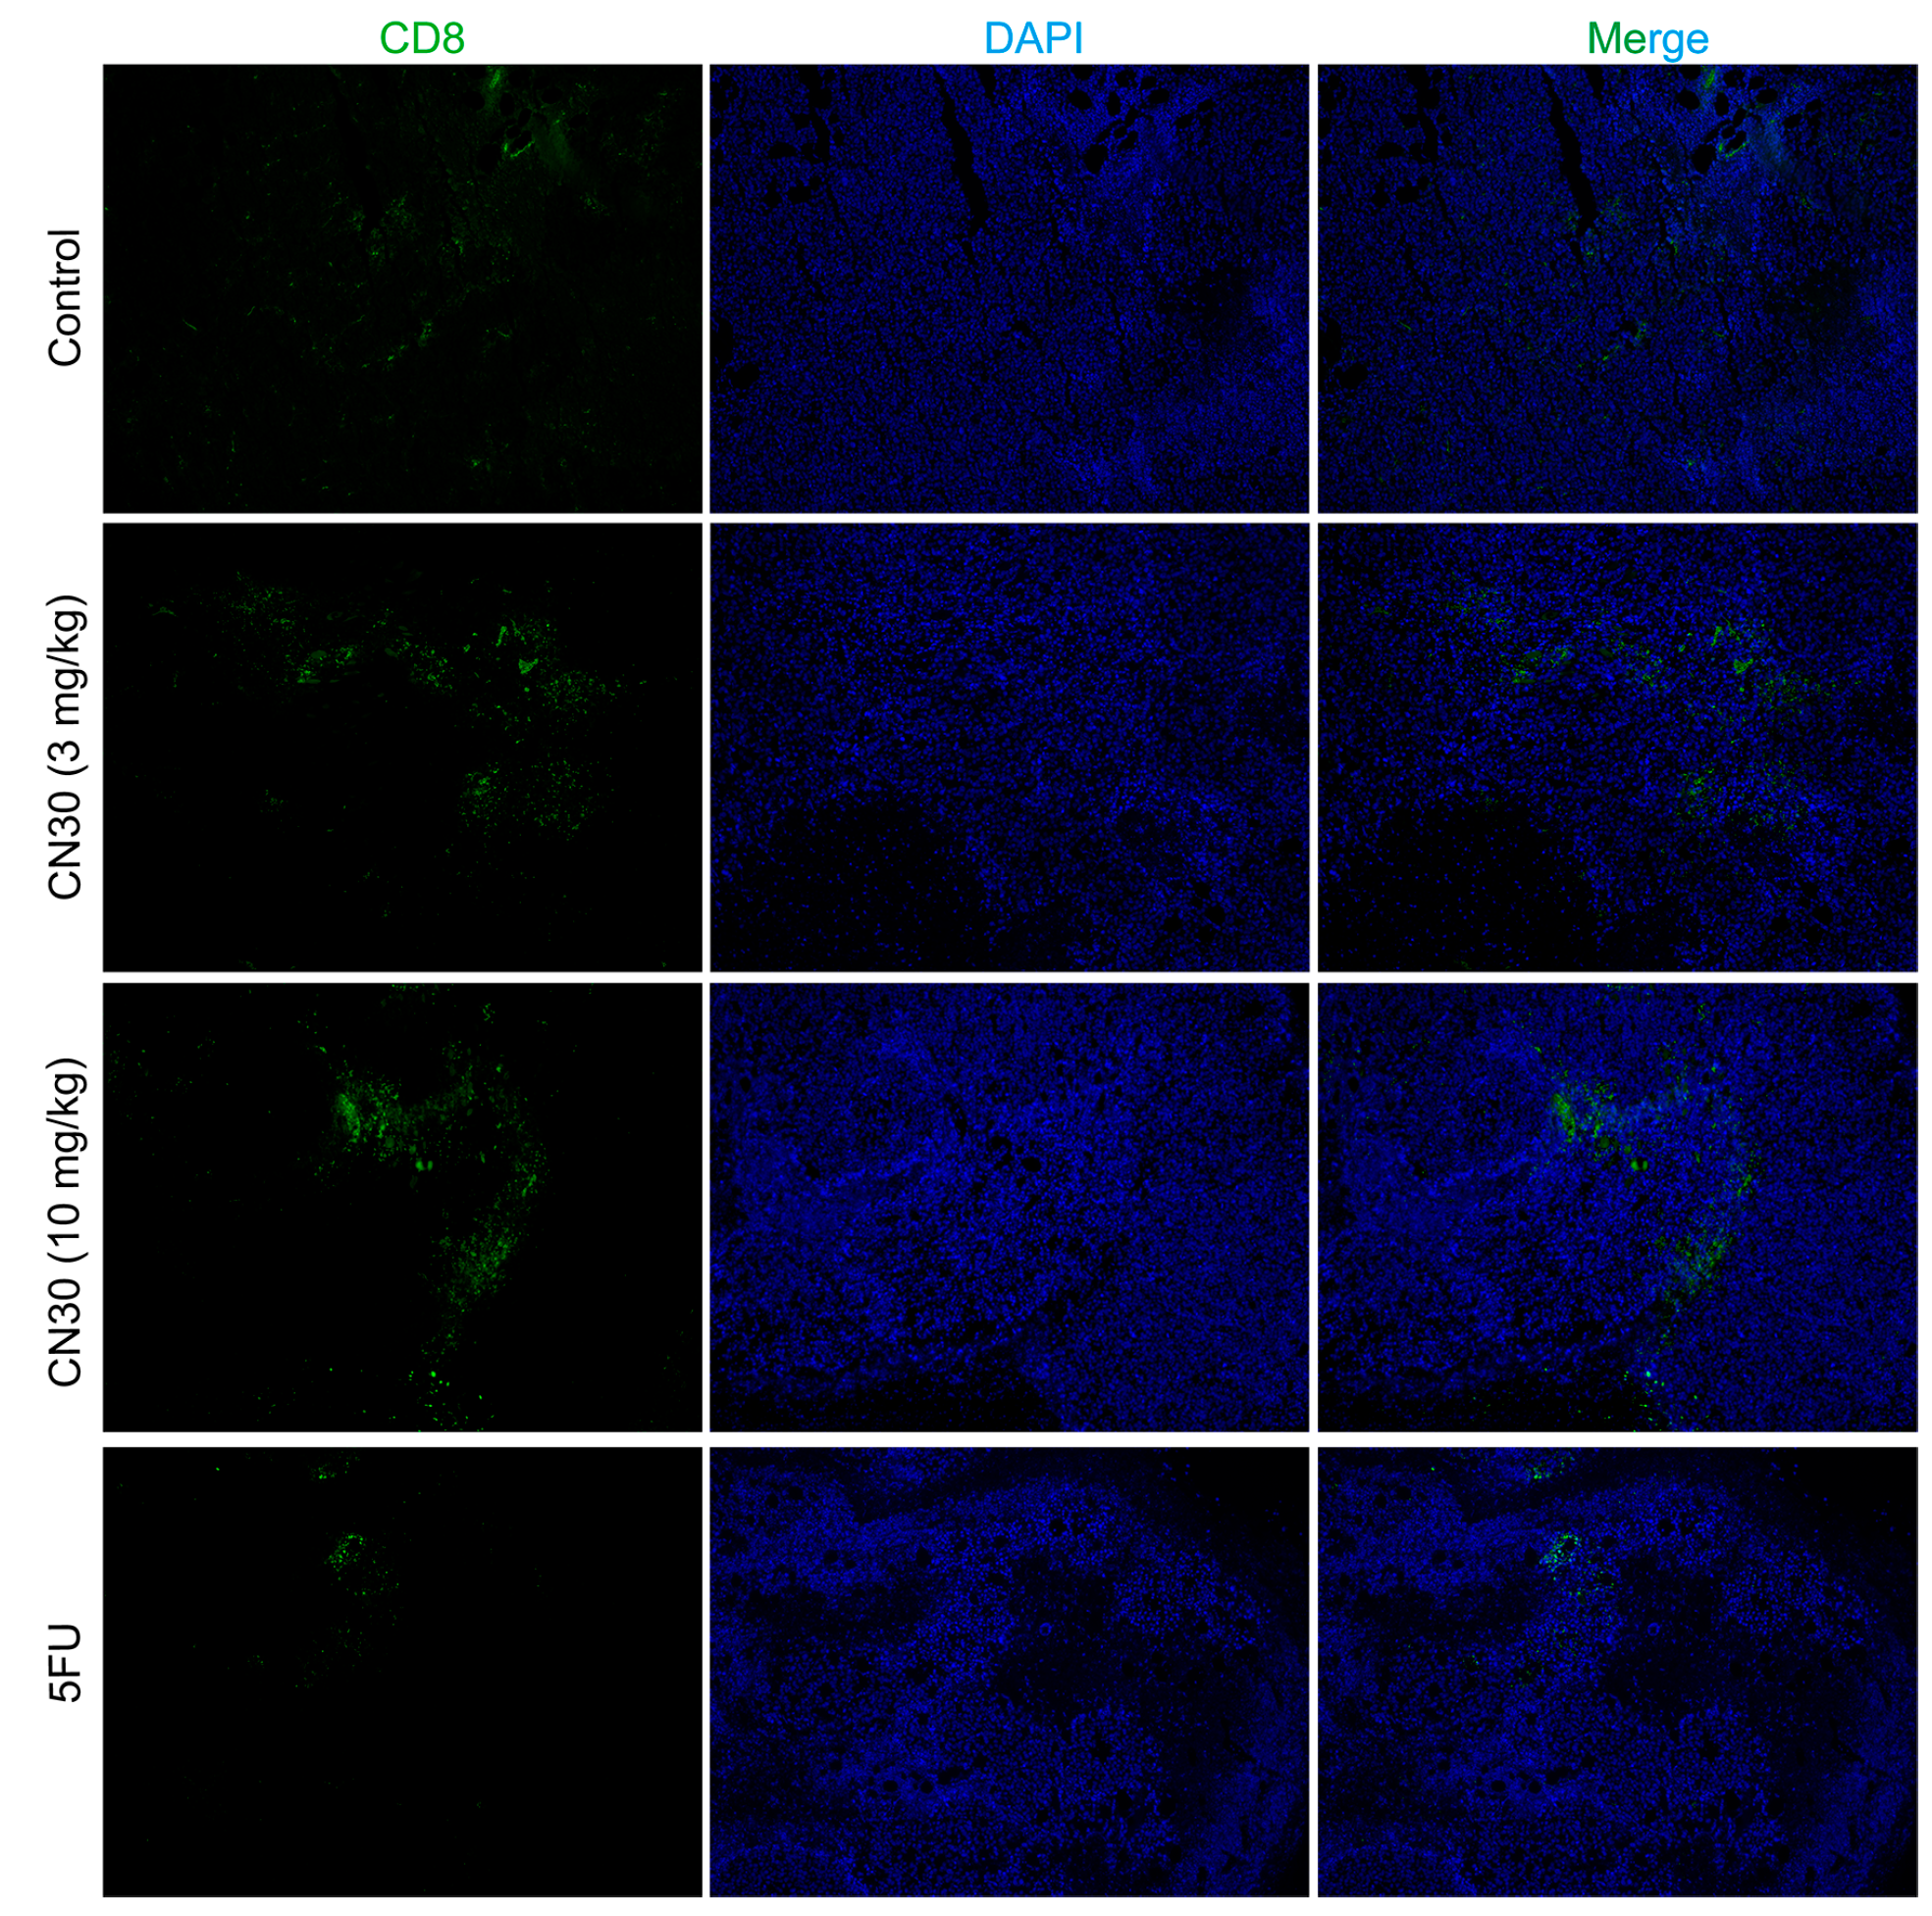
2.6. CN30 Treatment Enhanced CD8+ T Cell Infiltration
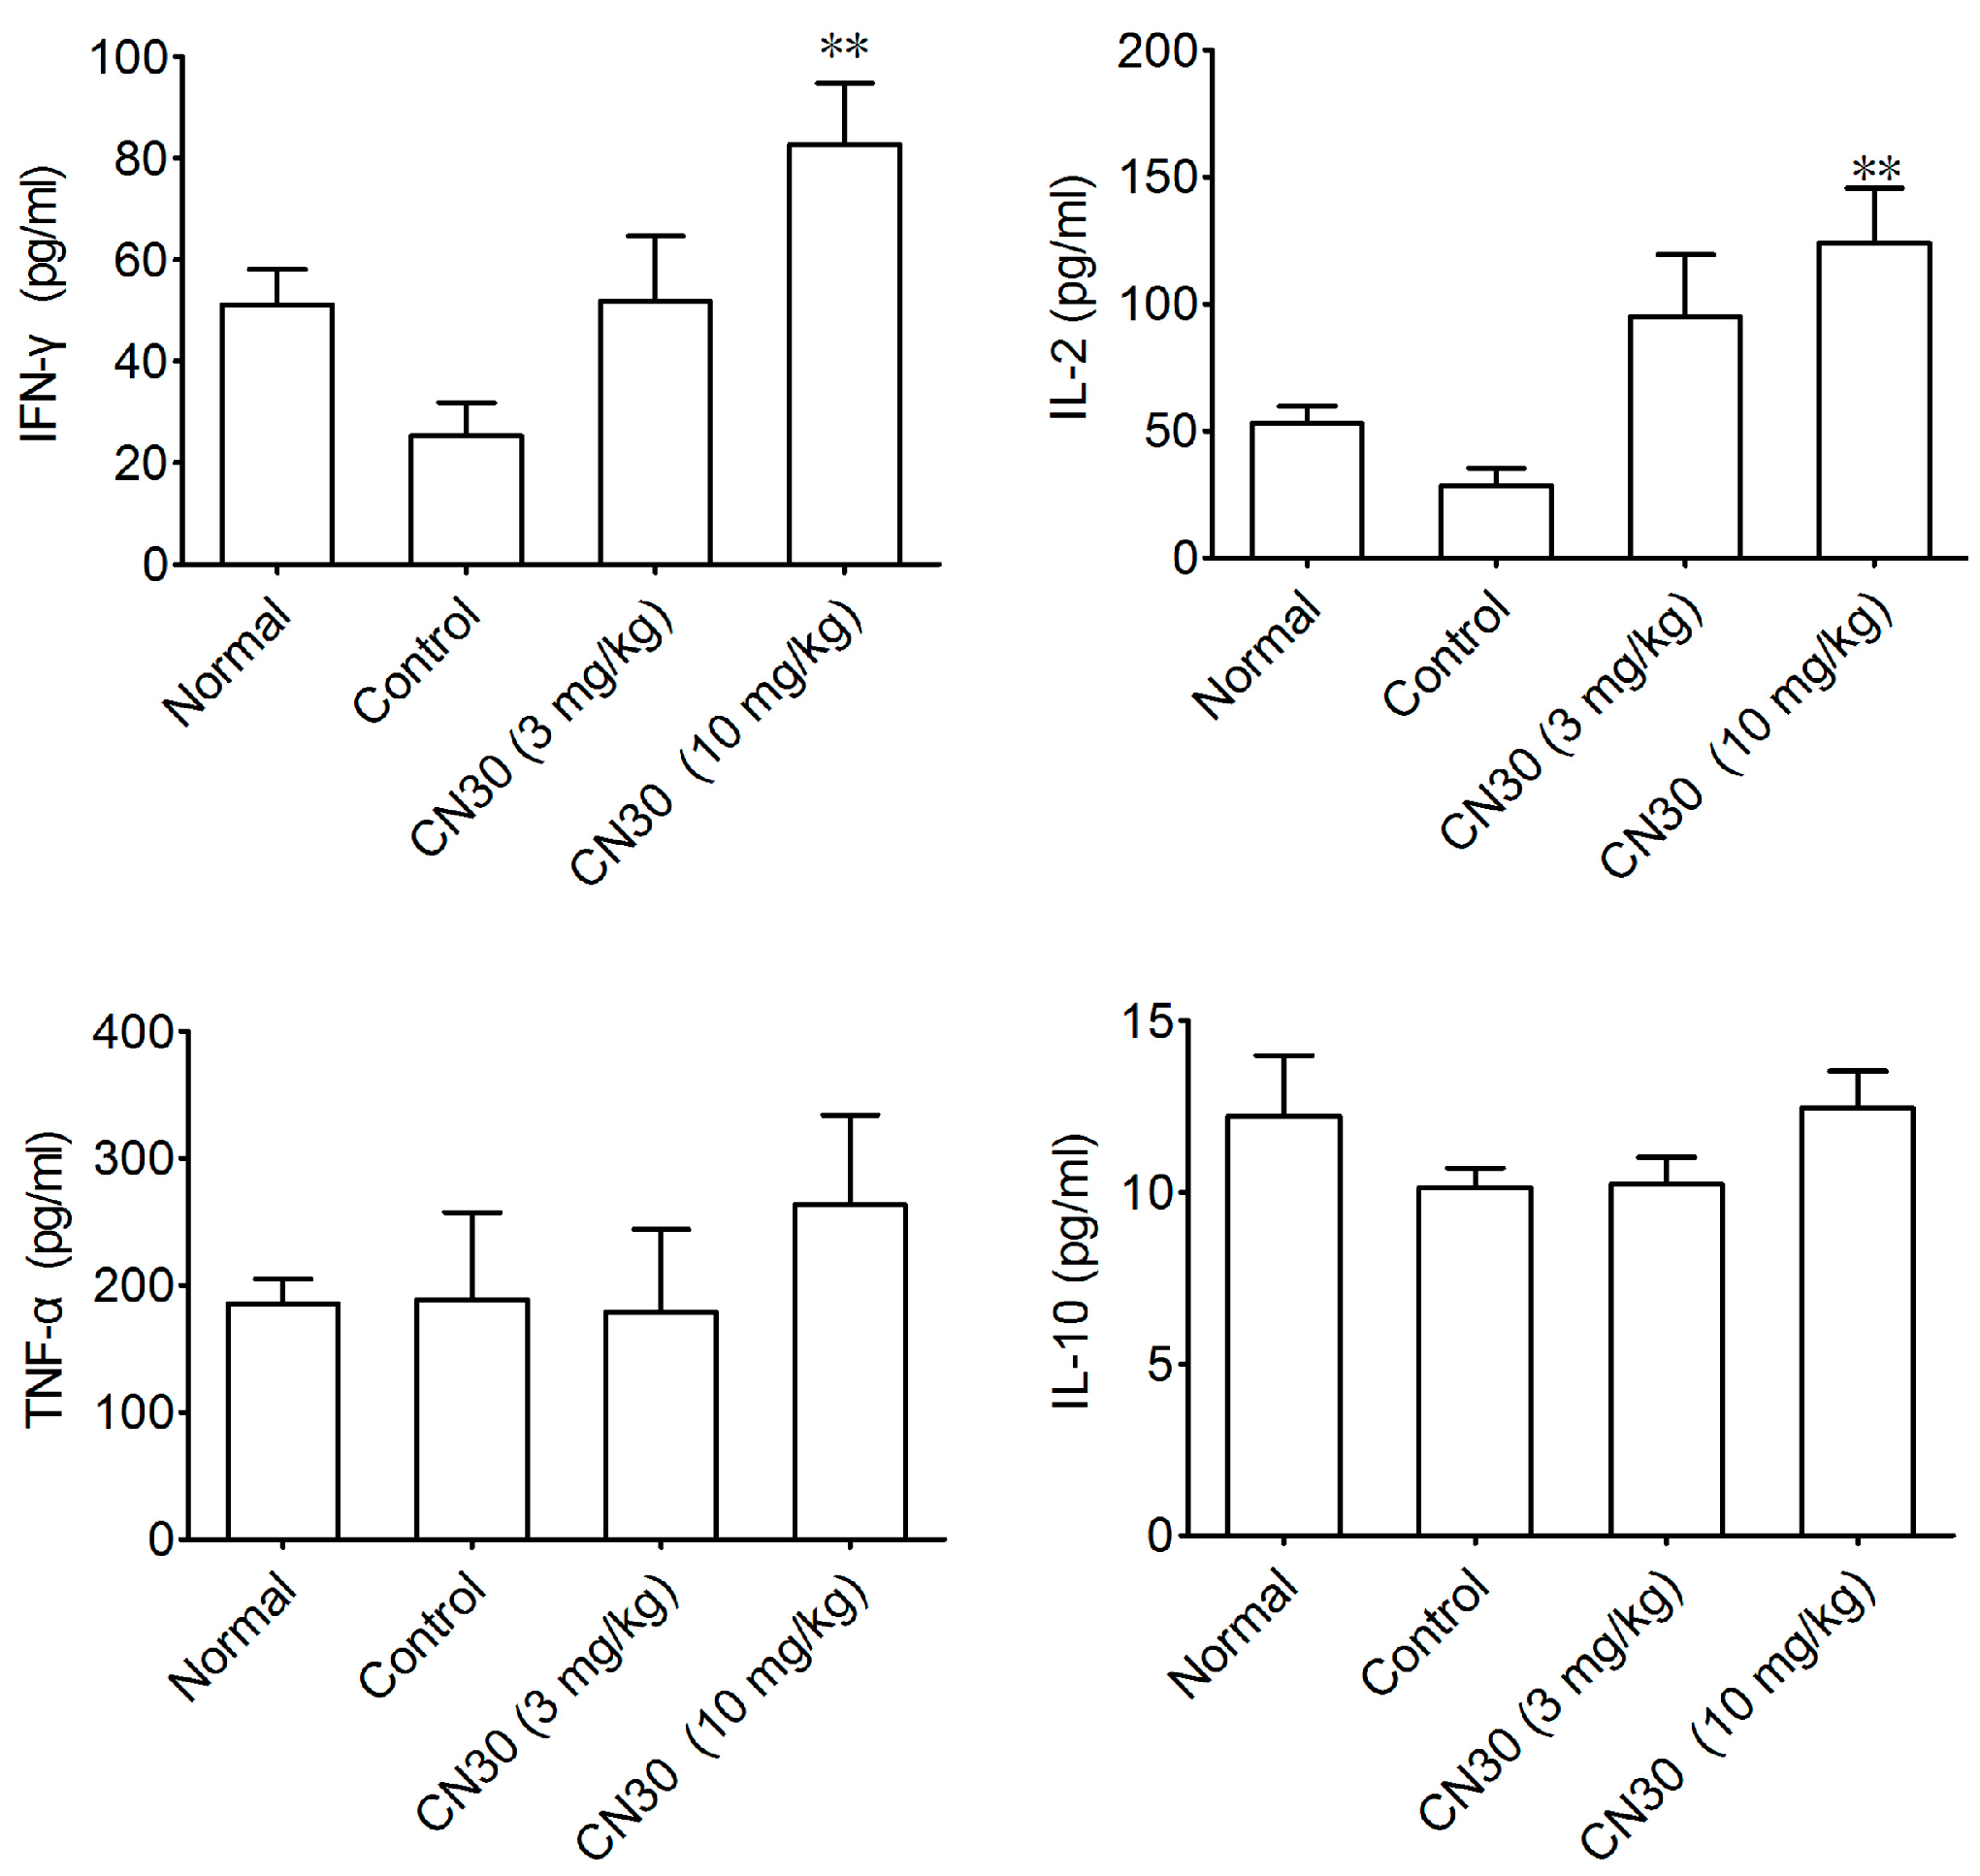
2.7. Effect of CN30 on Serum Cytokines Levels in HepA-Bearing Mice


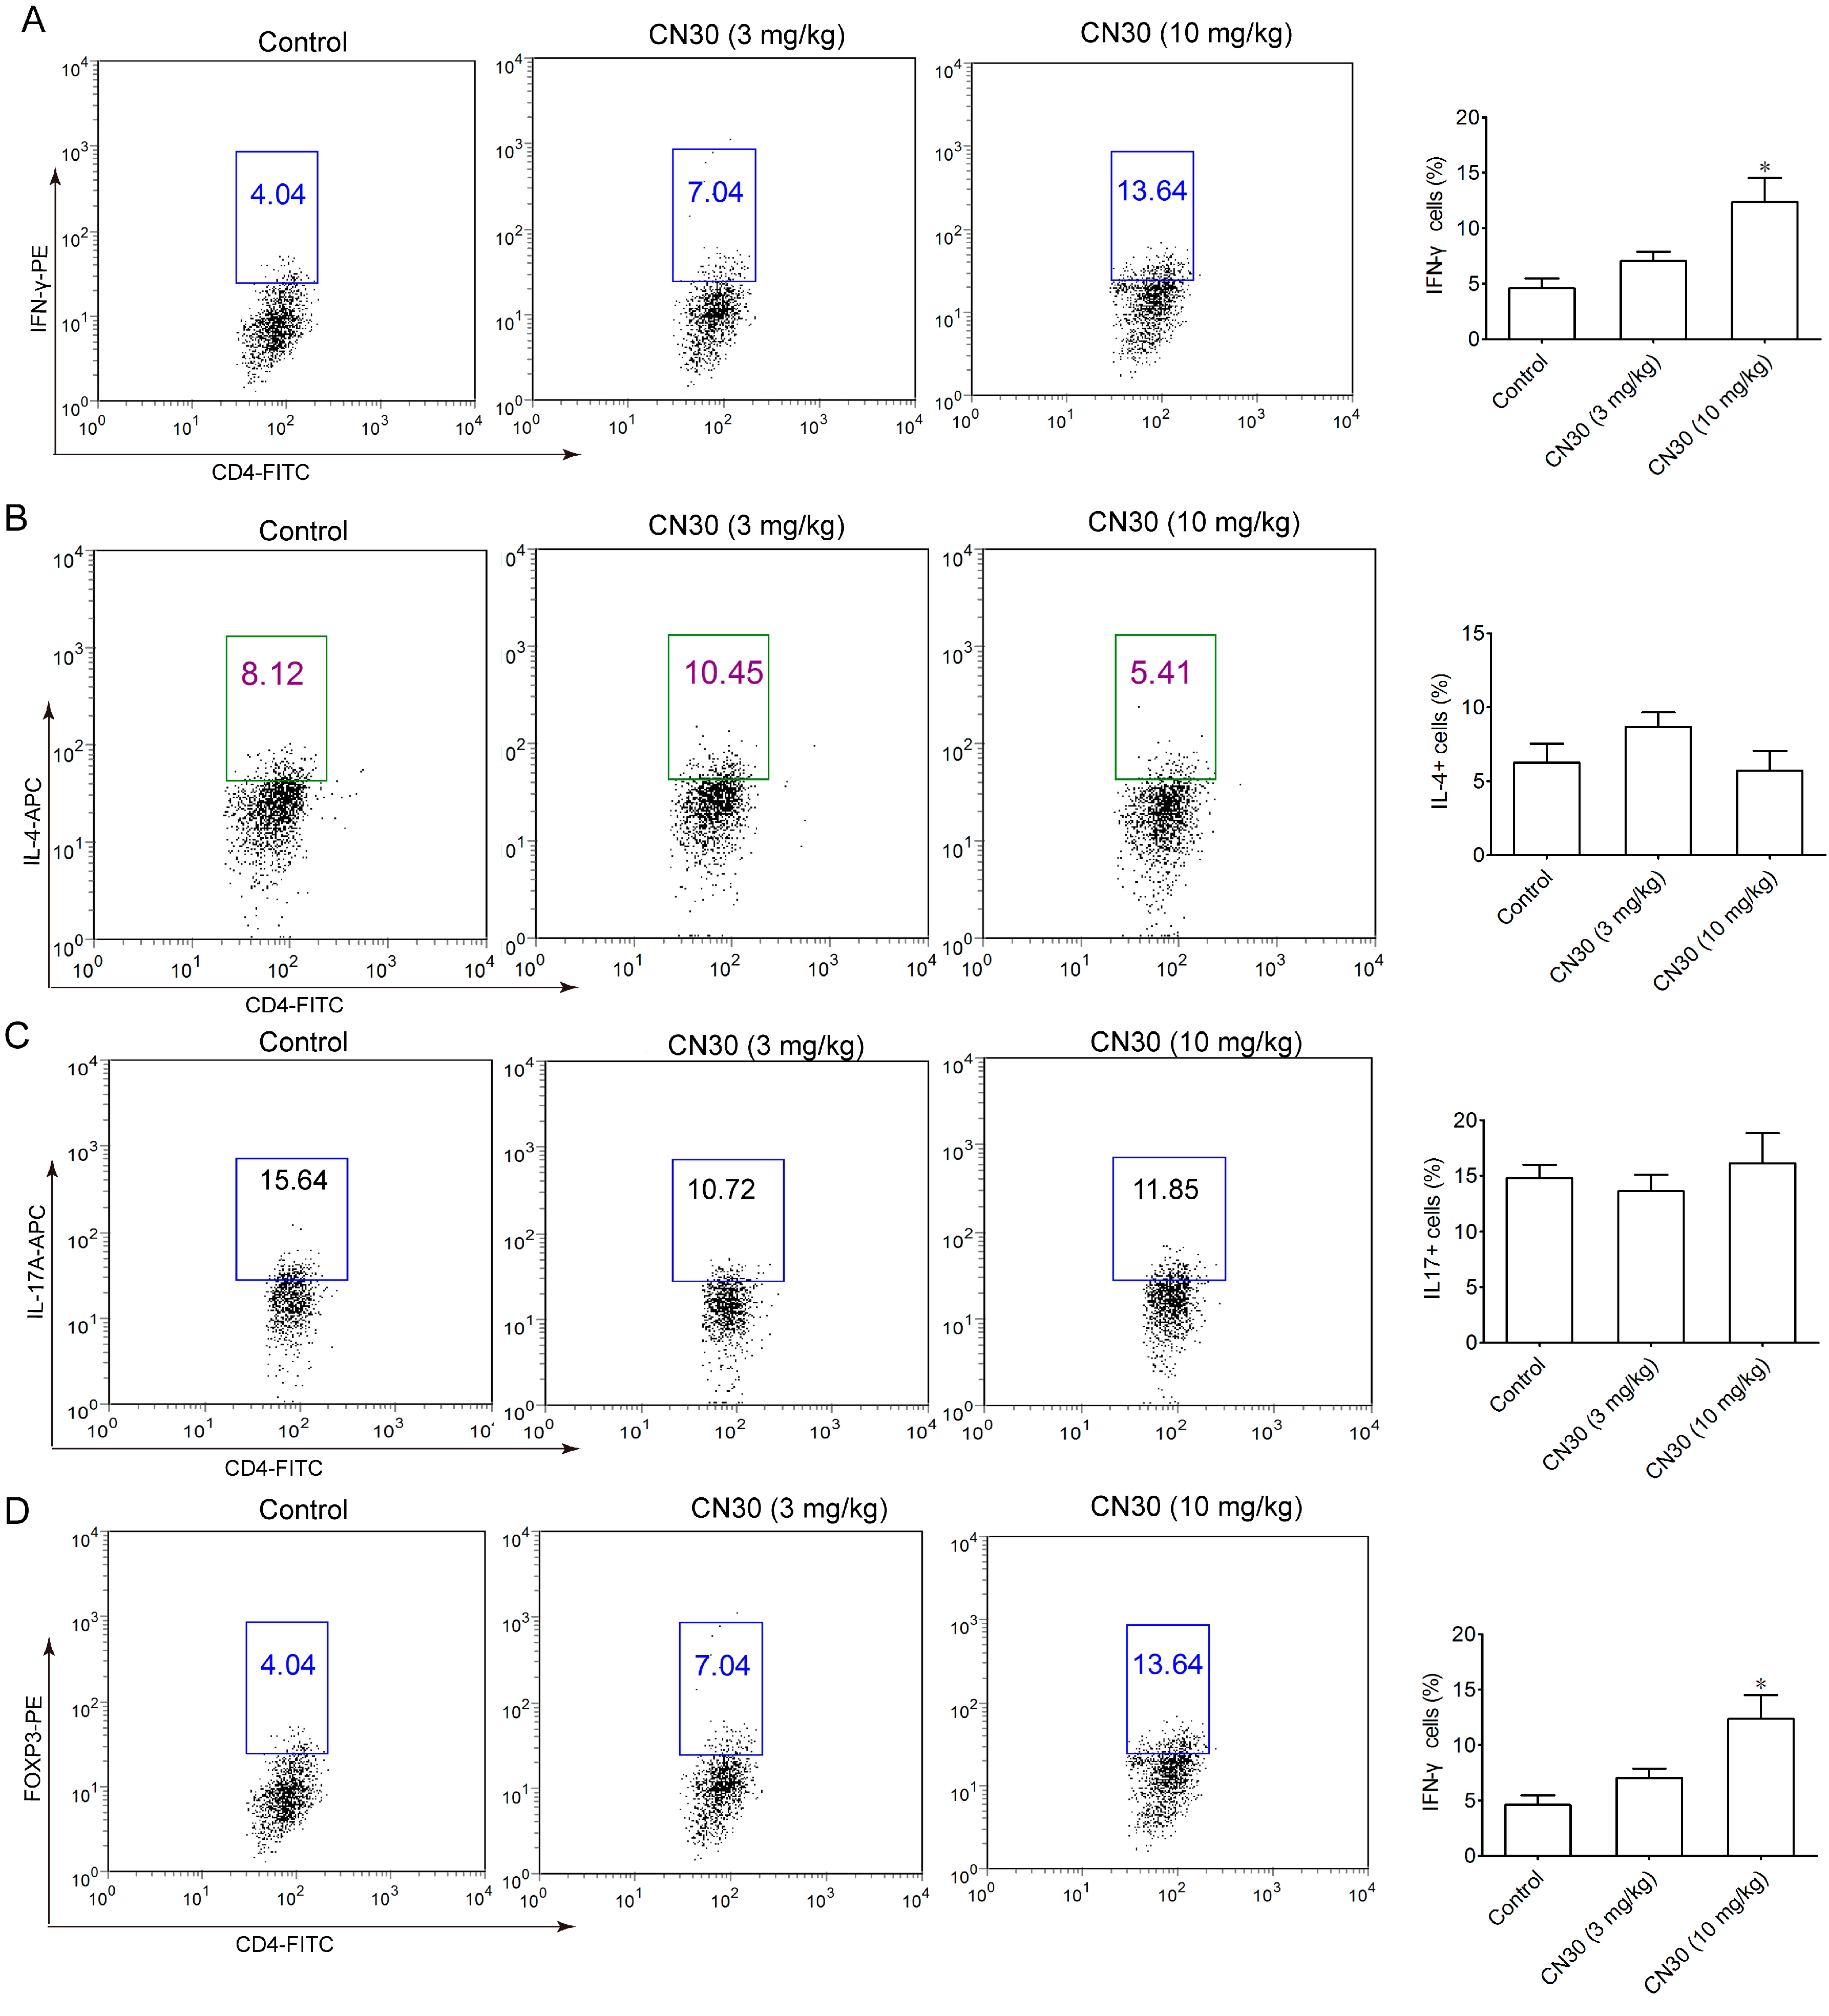
2.8. CN30 Treatment Promoted Th1 Cell Differentiation in HepA-Bearing Mice

2.9. Discussion
3. Experimental Section
3.1. Chemicals
3.2. Plant Material
3.3. Extraction and Isolation
3.4. LC/MS/MS Experiment
3.5. Animal Studies
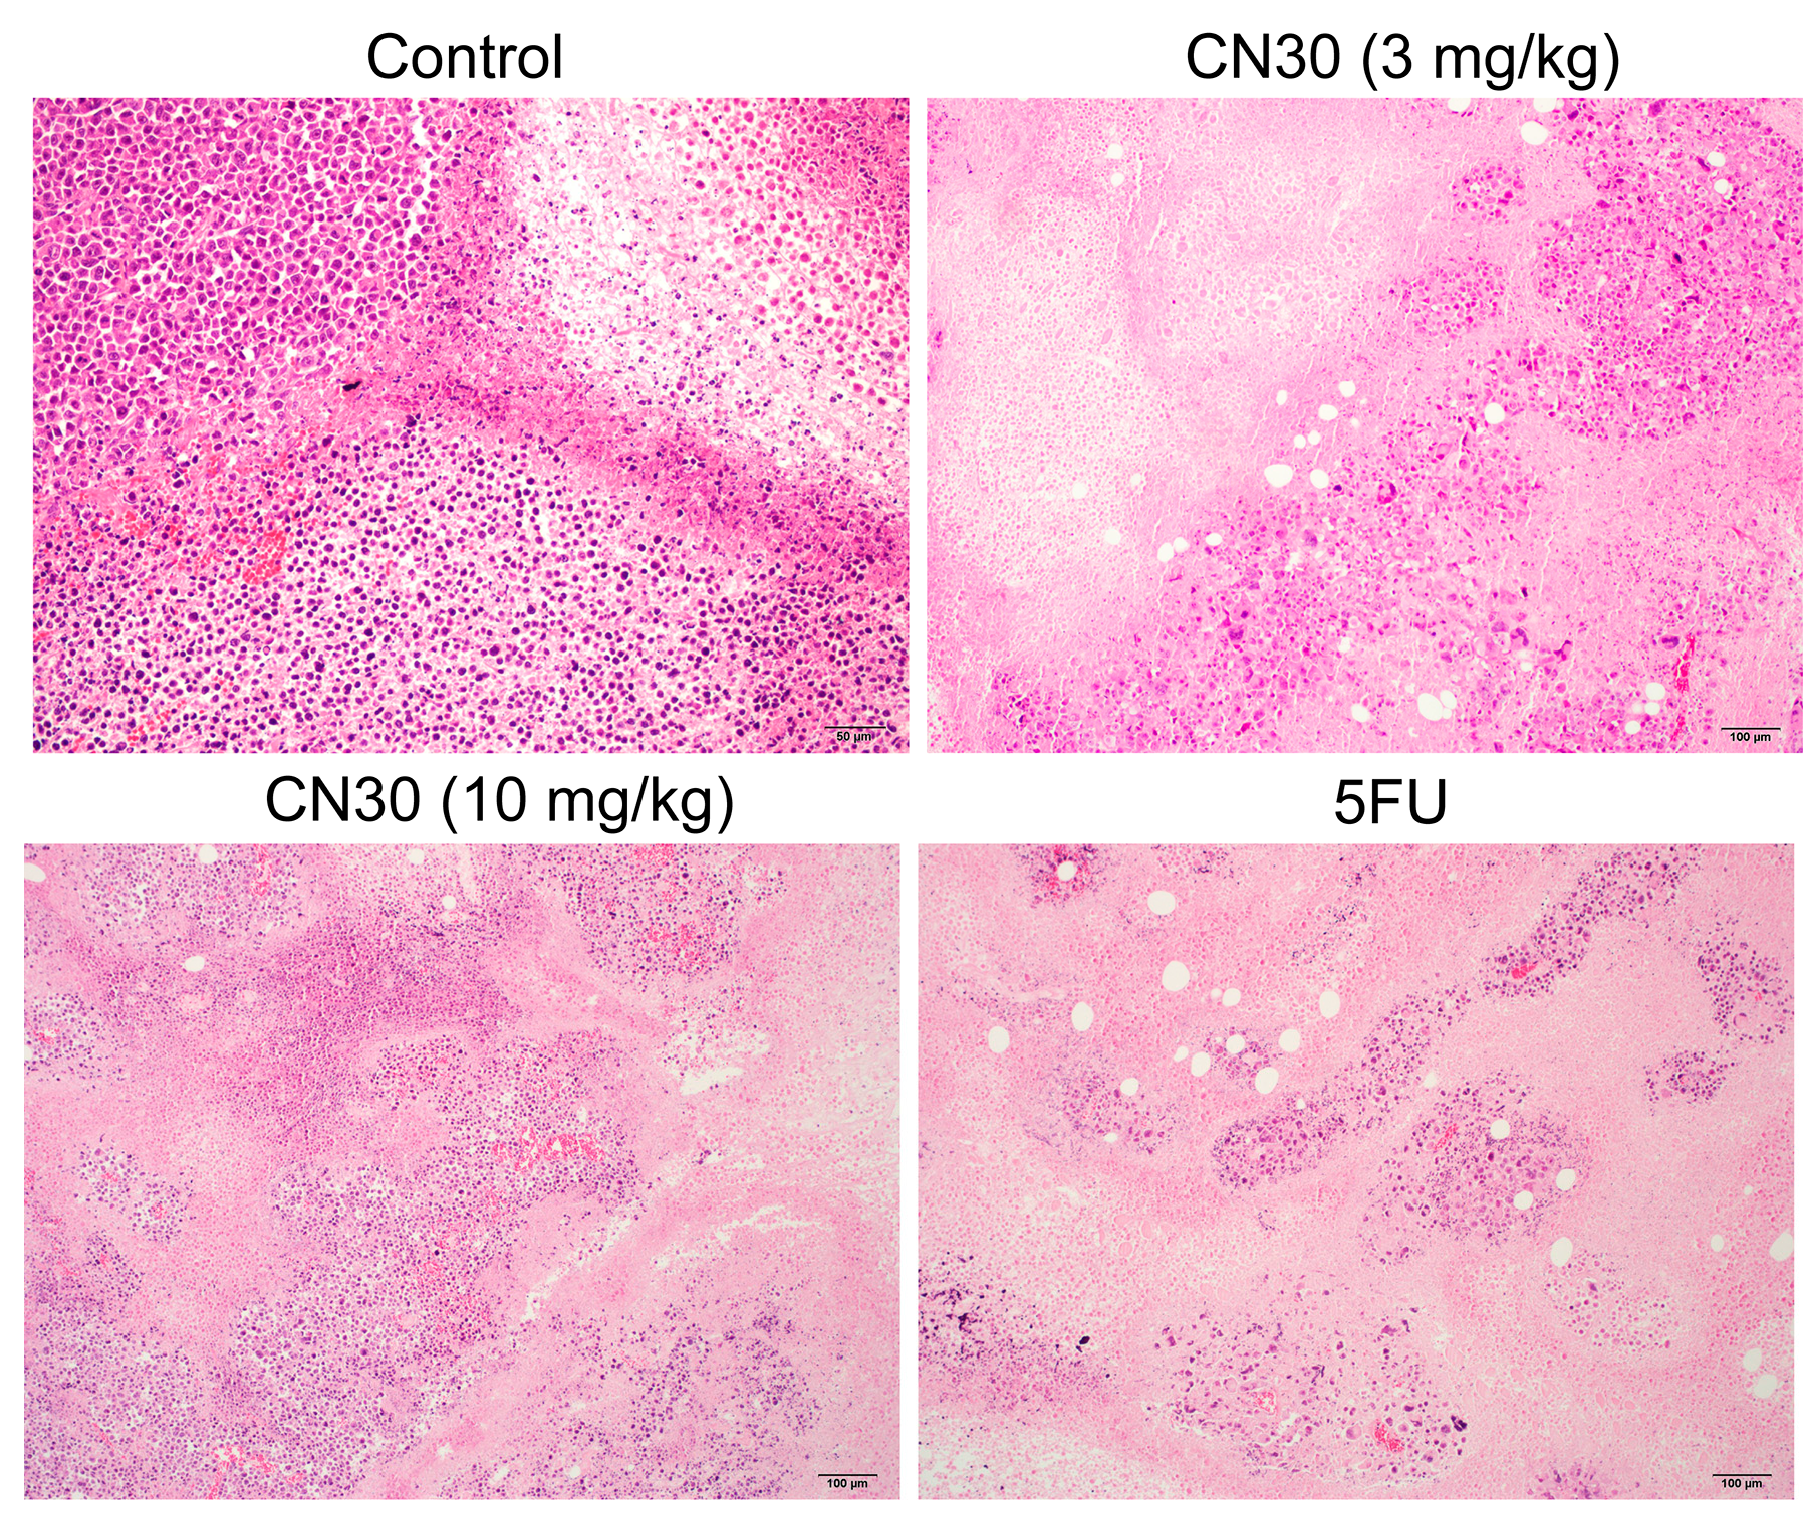
3.6. Hematoxylin-Eosin Staining
3.7. Western Blot Analysis
3.8. Immunofluorescence Histochemistry
3.9. Determination of Biochemical Parameters
3.10. Intracellular Staining
3.11. Statistical Analysis
4. Conclusions
Acknowledgments
Author Contributions
Conflicts of Interest
References
- Bosetti, C.; Turati, F.; La Vecchia, C. Hepatocellular carcinoma epidemiology. Best Pract. Res. Clin. Gastroenterol. 2014, 28, 753–770. [Google Scholar] [CrossRef] [PubMed]
- Forner, A.; Llovet, J.-M.; Bruix, J. Hepatocellular carcinoma. Lancet 2012, 379, 1245–1255. [Google Scholar] [CrossRef]
- Saraswat, V.A.; Pandey, G.; Shetty, S. Treatment algorithms for managing hepatocellular carcinoma. J. Clin. Exp. Hepatol. 2014, 4, S80–S89. [Google Scholar] [CrossRef] [PubMed]
- Zamarron, B.F.; Chen, W. Dual roles of immune cells and their factors in cancer development and progression. Int. J. Biol. Sci. 2011, 7, 651–658. [Google Scholar] [CrossRef] [PubMed]
- Bracci, L.; Schiavoni, G.; Sistigu, A.; Belardelli, F. Immune-based mechanisms of cytotoxic chemotherapy: Implications for the design of novel and rationale-based combined treatments against cancer. Cell Death Differ. 2014, 21, 15–25. [Google Scholar] [CrossRef] [PubMed]
- Sakdarat, S.; Shuypromb, A.; Pientongc, C.; Ekalaksanananc, T.; Thongchai, S. Bioactive constituents from the leaves of Clinacanthu snutans Lindau. Bioorg. Med. Chem. 2009, 17, 1857–1860. [Google Scholar] [CrossRef] [PubMed]
- Satayavivad, J.; Bunyaoraphatsara, N.; Kitisiripornkul, S.; Tanasomwang, W. Analgesic and anti-inflammatory activities of extract of Clinacanthus nutans Lindau. Thai. J.Phytopharm. 1996, 3, 7–17. [Google Scholar]
- Kunsorn, P.; Ruangrungsi, N.; Lipipun, V.; Khanboon, A.; Rungsihirunrat, K.; Chaijaroenkul, W. The identities and anti-herpes simplex virus activity of Clinacanthus nutans and Clinacanthussiamensis. Asian Pac. J. Trop. Biomed. 2013, 3, 284–290. [Google Scholar] [CrossRef]
- To, S.F.; Liu, R.H.; Cheng, Y.B.; Hsu, Y.M.; Du, Y.C.; El-Shazly, M.; Wu, Y.C.; Chang, F.R. Chemical constituents and bioactivities of Clinacanthus nutans aerial parts. Molecules 2014, 19, 20382–20390. [Google Scholar]
- Yong, Y.K.; Tan, J.J.; The, S.S.; Mah, S.H.; Ee, G.C.L.; Chiong, H.S.; Ahmad, Z. Clinacanthus nutans extracts are antioxidant with antiproliferative effect on cultured human cancer cell lines. Evid. Based Complement. Alternat. Med. 2013, 2013, 462751. [Google Scholar] [CrossRef] [PubMed]
- Kaur, M.; Velmurugan, B.; Rajamanickam, S.; Agarwal, R.; Agarwal, C. Gallic acid, an active constituent of grape seed extract, exhibits anti-proliferative, pro-apoptotic and anti-tumorigenic effects against prostate carcinoma xenograft growth in nude mice. Pharm.Res. 2009, 26, 2133–2140. [Google Scholar] [CrossRef] [PubMed]
- Sakthivel, K.M.; Guruvayoorappan, C. Biophytum sensitivum: Ancient medicine, modern targets. J. Adv. Pharm. Technol. Res. 2012, 3, 83–91. [Google Scholar] [PubMed]
- Baby, J.; Vrundha, M.; Ocimum, S. Pharmacology behind its anti- cancerous effect. Int. J. Pharm. Bio. Sci. 2013, 4, 556–575. [Google Scholar]
- Aaron, N.; Cate, A.; Michelle, C. The flavonoid profile of pigeonpea, Cajanuscajan: A review. SpringerPlus 2015, 4, 125. [Google Scholar] [CrossRef]
- Swapna, U.; Madhulika, D. Role of polyphenols and other phytochemicals on molecular signaling. Oxid. Med. Cell. Longe. 2015, 2015, 504253. [Google Scholar] [CrossRef]
- Lavhale, M.S.; Mishra, S.H. Nutritional and therapeutic potential of Ailanthus excels—A review. Pharmacogn. Rev. 2007, 1, 105–113. [Google Scholar]
- Chinar, M.; Sharma, N.; Dobhal, M.; Joshi, Y. Flavonoids: A versatile source of anticancer drugs. Pharmacogn. Rev. 2011, 5, 1–12. [Google Scholar]
- Hu, Y.M.; Ye, W.C.; Li, Q.; Tian, H.Y.; Wang, H. C-glycosylflavones from stellaria media. Chin. J. Nat. Med. 2006, 4, 420–424. [Google Scholar]
- Xie, C.; Veitch, N.C.; Houghton, P.J.; Simmonds, M.S. Flavone C-glycosides from Viola yedoensis Makino. Chem. Pharm. Bull. 2003, 51, 1204–1207. [Google Scholar]
- Chelyn, J.L.; Omar, M.H.; Yousof, S.A.M.; Ranggasamy, R.; Wasiman, M.I.; Ismail, Z. Analysis of flavone C-glycosides in the leaves of Clinacanthus nutans (Burm. f.) Lindau by HPTLC and HPLC-UV/DAD. Sci. World J. 2014, 2014, 724267. [Google Scholar] [CrossRef] [PubMed]
- Shibata, T.; Aburatani, H. Exploration of liver cancer genomes. Nat. Rev. Gastroenterol. Hepatol. 2014, 11, 340–349. [Google Scholar] [CrossRef] [PubMed]
- Yang, J.D.; Roberts, L.R. Hepatocellular carcinoma: A global view. Nat. Rev.Gastroenterol. Hepatol. 2010, 7, 448–458. [Google Scholar] [CrossRef] [PubMed]
- Li, Y.; Martin, R.C.G. Herbal medicine and hepatocellular carcinoma: Applications and challenges. Evid. Based Complement Alternat. Med. 2011, 2011, 541209. [Google Scholar] [CrossRef] [PubMed]
- Fattovich, G.; Stroffolini, T.; Zagni, I.; Donato, F. Hepatocellular carcinoma in cirrhosis: Incidence and risk factors. Gastroenterology 2004, 127, 35–50. [Google Scholar] [CrossRef]
- Chen, X.; Nie, W.; Yu, G.; Li, Y.; Hu, Y.; Lu, J.; Jin, L. Antitumor and immunomodulatory activity of polysaccharides from Sargassumfusiforme. Food Chem. Toxicol. 2012, 50, 695–700. [Google Scholar] [CrossRef] [PubMed]
- Intlekofer, A.M.; Thompson, C.B. At the bench: Preclinical rationale for CTLA-4 and PD-1 blockade as cancer immunotherapy. J. Leukoc. Biol. 2013, 94, 25–39. [Google Scholar] [CrossRef] [PubMed]
- Kuss, I.; Hathaway, B.; Ferris, R.L.; Gooding, W.; Whiteside, T.L. Decreased absolute counts of T lymphocyte subsets and their relation to disease in squamous cell carcinoma of the head and neck. Clin. Cancer Res. 2004, 10, 3755–3762. [Google Scholar] [CrossRef] [PubMed]
- Shanker, A.; Verdeil, G.; Buferne, M.; Inderberg-Suso, E.M.; Puthier, D.; Joly, F.; Nguyen, C.; Leserman, L.; Auphan-Anezin, N.; Schmitt-Verhulst, A.M. CD8+ T cell help for innate antitumor immunity. J. Immunol. 2007, 179, 6651–6662. [Google Scholar] [CrossRef] [PubMed]
- Filaci, G.; Suciu-Foca, N. CD8+ T suppressor cells are back to the game: Are they players in autoimmunity? Autoimmun. Rev. 2002, 1, 279–283. [Google Scholar] [CrossRef]
- Tateyama, M.; Oyaizu, N.; McCloskey, T.W.; Than, S.; Pahwa, S. CD4+ T lymphocytes are primed to express Fas lig and by CD4+ cross-linking and to contribute to CD8+ T-cell apoptosis via Fas/FasL death signaling pathway. Blood 2002, 96, 195–202. [Google Scholar]
- Afshar-Sterle, S.; Zotos, D.; Bernard, N.J.; Scherger, A.K.; Rödling, L.; Alsop, A.E.; Walker, J.; Masson, F.; Belz, G.T.; Corcoran, L.M.; et al. Fas ligand-mediated immune surveillance by T cells is essential for the control of spontaneous B cell lymphomas. Nat. Med. 2014, 20, 283–290. [Google Scholar] [CrossRef] [PubMed]
- Kaplan, D.H.; Shankaran, V.; Dighe, A.S.; Stockert, E.; Aguet, M.; Old, L.J.; Schreiber, R.D. Demonstration of an interferon gamma-dependent tumor surveillance system in immunocompetent mice. Proc. Natl. Acad. Sci. 1998, 95, 7556–7561. [Google Scholar] [CrossRef] [PubMed]
- Dunn, G.P.; Koebel, C.M.; Schreiber, R.D. Interferons, immunity and cancer immunoediting. Nat. Rev. Immunol. 2006, 6, 836–848. [Google Scholar] [CrossRef] [PubMed]
- Hartenstein, B.; Teurich, S.; Hess, J.; Schenkel, J.; Schorpp-Kistner, M.; Angel, P. Th2 cell-specific cytokine expression and allergen-induced airway inflammation depend on JunB. EMBO J. 2002, 21, 6321–6329. [Google Scholar] [CrossRef] [PubMed]
- Aspord, C.; Pedroza-Gonzalez, A.; Gallegos, M.; Tindle, S.; Burton, E.C.; Su, D.; Marches, F.; Banchereau, J.; Palucka, A.K. Breast cancer instructs dendritic cells to prime interleukin 13-secreting CD4+ T cells that facilitate tumor development. J. Exp. Med. 2007, 204, 1037–1047. [Google Scholar] [CrossRef] [PubMed]
- He, D.; Li, H.; Yusuf, N.; Elmets, C.A.; Li, J.; Mountz, J.D.; Xu, H. IL-17 promotes tumor development through the induction of tumor promoting microenvironments at tumor sites and myeloid-derived suppressor cells. J. Immunol. 2010, 184, 2281–2288. [Google Scholar] [CrossRef] [PubMed]
- Todaro, M.; Lombardo, Y.; Francipane, M.G.; Alea, M.P.; Cammareri, P.; Iovino, F.; di Stefano, A.B.; di Bernardo, C.; Agrusa, A.; Condorelli, G.; et al. Apoptosis resistance in epithelial tumors is mediated by tumor-cell-derived interleukin-4. Cell Death Differ. 2008, 15, 762–772. [Google Scholar] [CrossRef] [PubMed] [Green Version]
- Trzonkowski, P.; Szmit, E.; Mysliwska, J.; Myśliwski, A. CD4+ CD25+ T regulatory cells inhibit cytotoxic activity of CTL and NK cells in humans-impact of immunosenescence. Clin. Immunol. 2006, 119, 307–316. [Google Scholar] [CrossRef] [PubMed]
- Wang, L.; Yi, T.; Kortylewski, M.; Pardoll, D.M.; Zeng, D.; Yu, H. IL-17 can promote tumor growth through an IL-6-Stat3 signaling pathway. J. Exp. Med. 2009, 206, 1457–1464. [Google Scholar] [CrossRef] [PubMed]
- Sample Availability: Samples of the compounds are not available from the authors.
© 2015 by the authors. Licensee MDPI, Basel, Switzerland. This article is an open access article distributed under the terms and conditions of the Creative Commons Attribution license ( http://creativecommons.org/licenses/by/4.0/).
Share and Cite
Huang, D.; Guo, W.; Gao, J.; Chen, J.; Olatunji, J.O. Clinacanthus nutans (Burm. f.) Lindau Ethanol Extract Inhibits Hepatoma in Mice through Upregulation of the Immune Response. Molecules 2015, 20, 17405-17428. https://doi.org/10.3390/molecules200917405
Huang D, Guo W, Gao J, Chen J, Olatunji JO. Clinacanthus nutans (Burm. f.) Lindau Ethanol Extract Inhibits Hepatoma in Mice through Upregulation of the Immune Response. Molecules. 2015; 20(9):17405-17428. https://doi.org/10.3390/molecules200917405
Chicago/Turabian StyleHuang, Danmin, Wenjie Guo, Jing Gao, Jun Chen, and Joshua Opeyemi Olatunji. 2015. "Clinacanthus nutans (Burm. f.) Lindau Ethanol Extract Inhibits Hepatoma in Mice through Upregulation of the Immune Response" Molecules 20, no. 9: 17405-17428. https://doi.org/10.3390/molecules200917405