
A Set of 20 New SSR Markers Developed and Evaluated in Mandevilla Lindl.

Abstract
:1. Introduction
2. Results
2.1. Microsatellite Development
2.2. SSR Polymorphism and Genetic Diversity
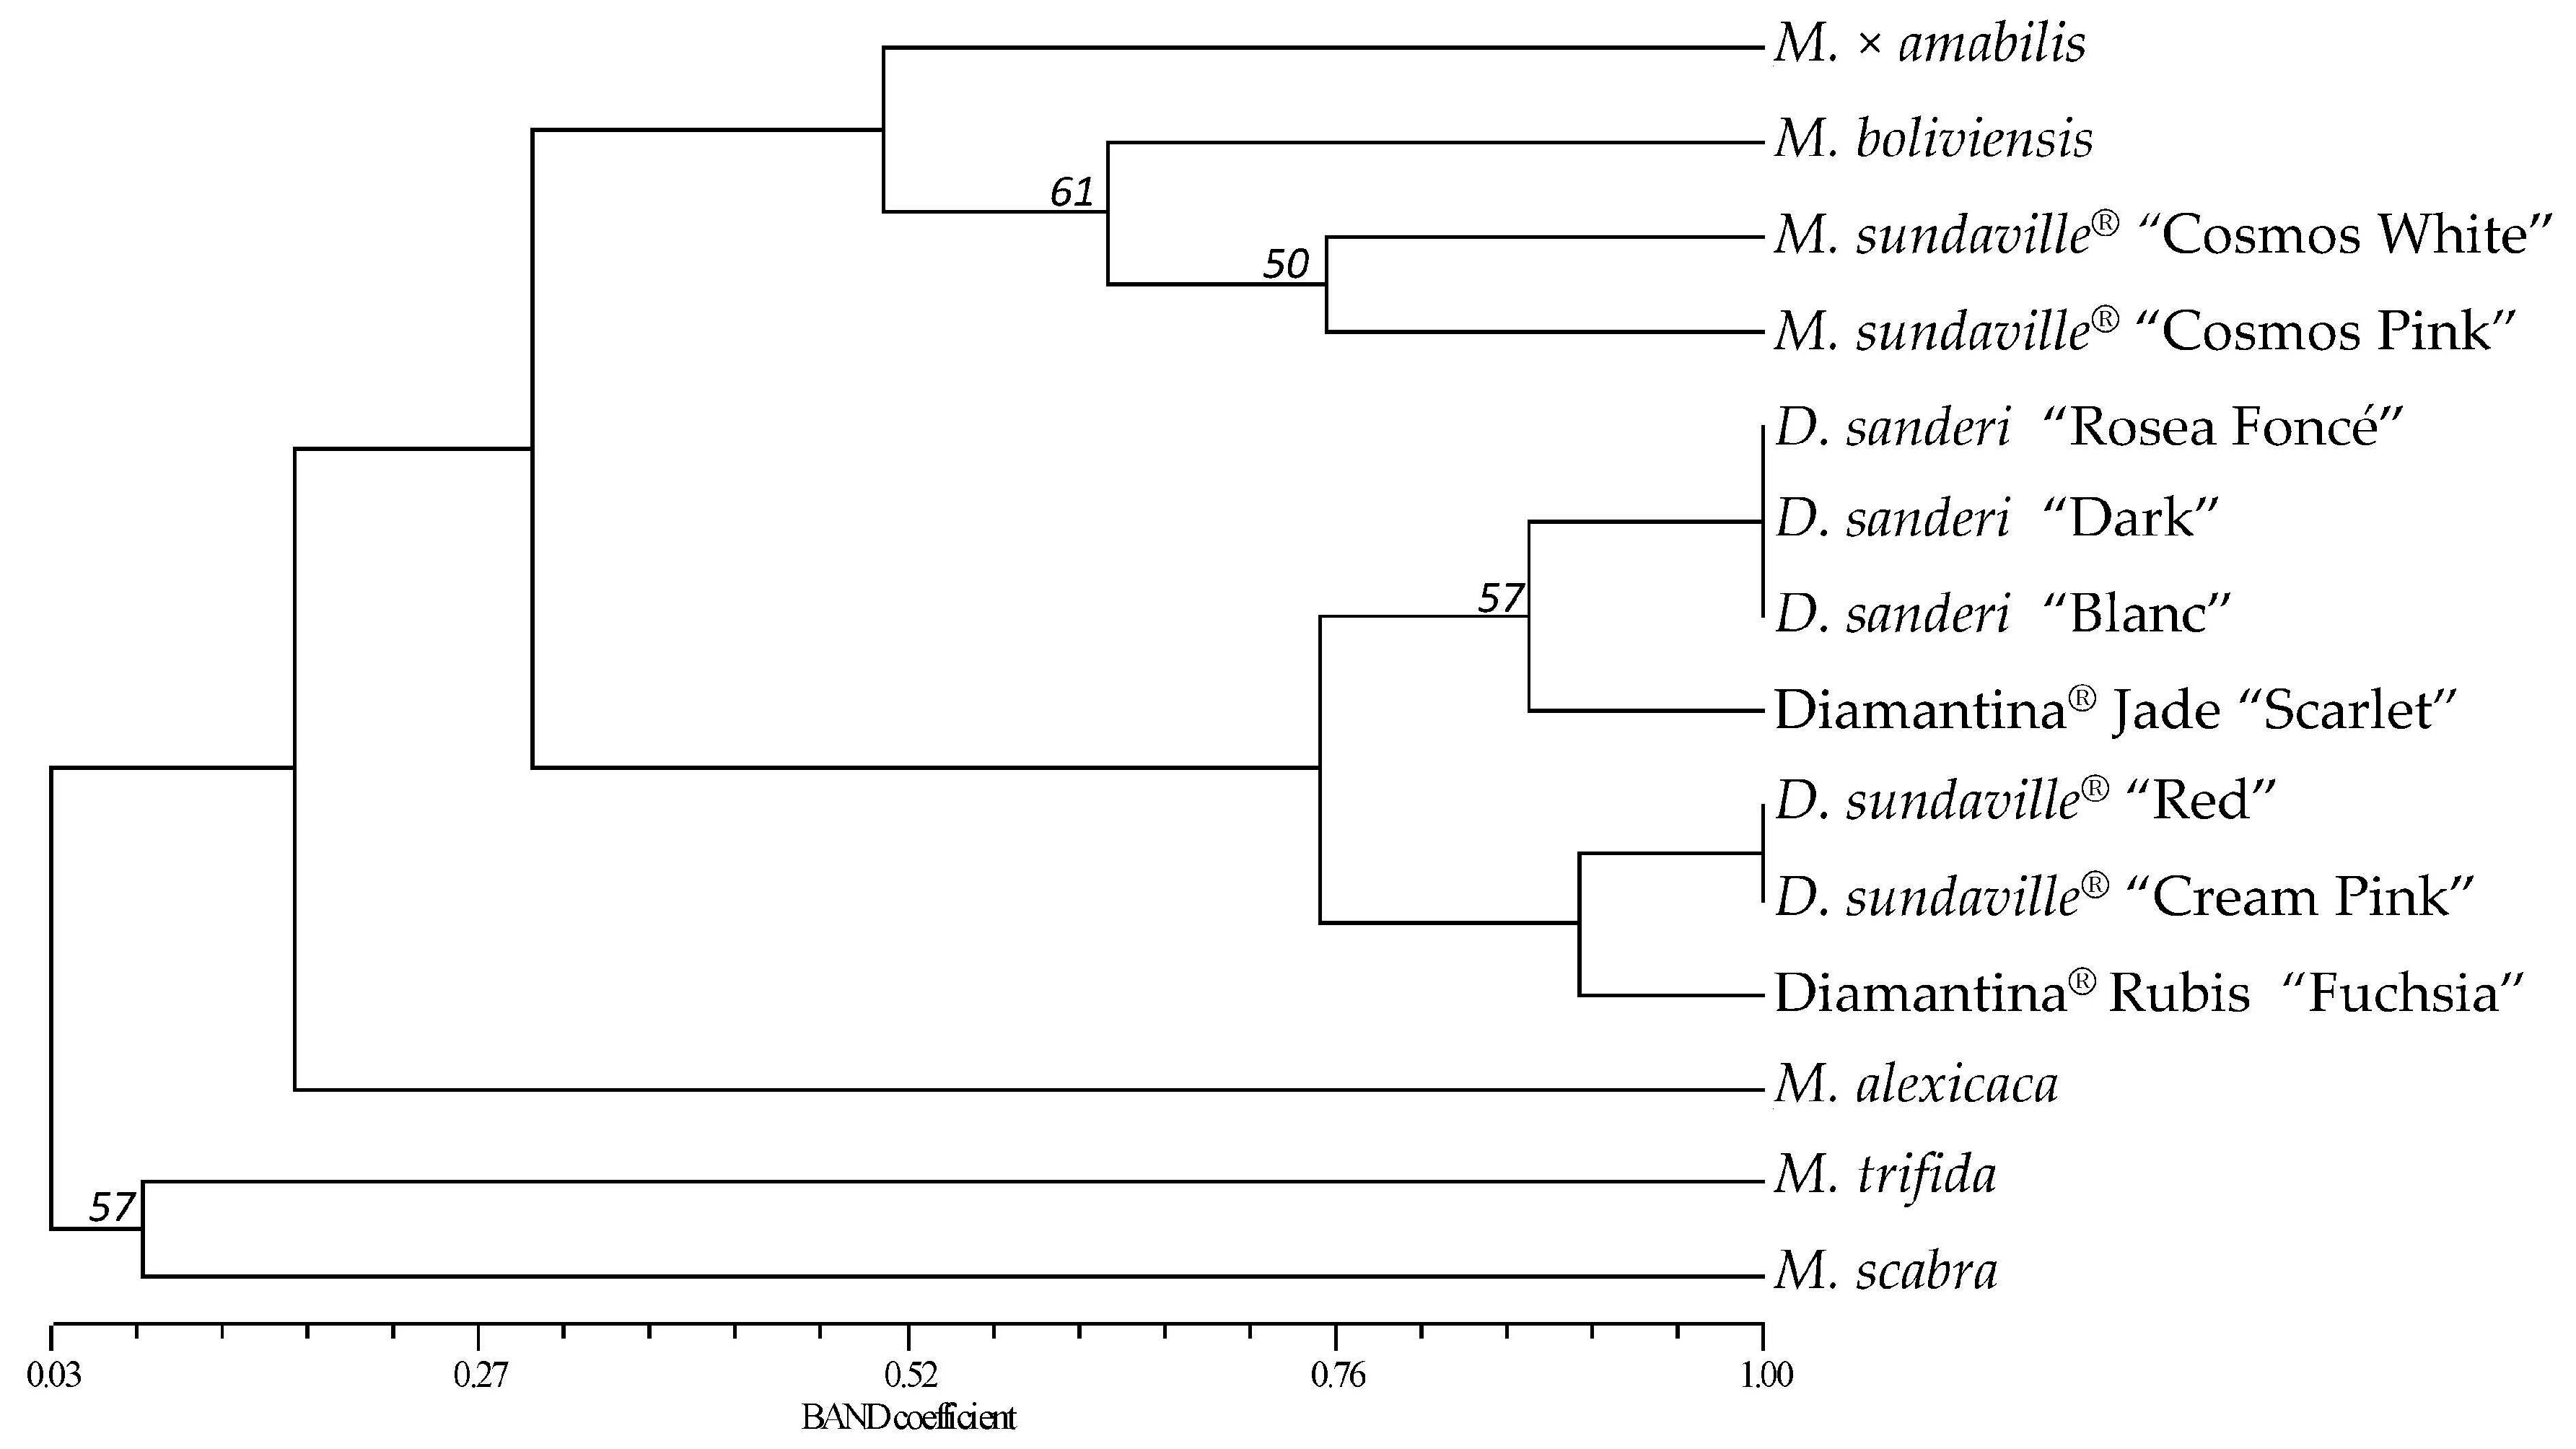
2.3. Molecular Fingerprinting and Genetic Relationships of the Mandevilla Genotypes
3. Discussion
3.1. SSR Development and Yield
3.2. SSRs Polymorphism, Diversity and Relationships Among Mandevilla Cultivars
4. Materials and Methods
4.1. Plant Material and Genomic DNA Extraction
4.2. Construction and Screening of a Microsatellite-Enriched Library
4.3. SSR Analysis
4.4. Genetic Diversity
5. Conclusions
Acknowledgments
Author Contributions
Conflicts of Interest
References
- Lannes, H.; Lannes, R. Dipladenia & Mandevilla pas à pas; ÉDISUD: Aix-en-Provence, France, 2010; pp. 10–21. [Google Scholar]
- Lannes, J.P.; SAS DHM INNOVATION, Malause, France. Personal communication, 2016.
- Woodson, R.E. Studies in Apocynaceae IV. The American genera of Erchitoideae III: Mandevilla. Ann. MO Bot. Gard. 1933, 20, 667. [Google Scholar]
- Morales, J.F. A synopsis of the genus Mandevilla (Apocynaceae) in Mexico and Central America. Brittonia 1998, 50, 214–232. [Google Scholar] [CrossRef]
- Morales, J.F. Estudios en las Apocynaceae Neotropicales XII: Tres nuevas especies de Mandevilla Lindl. (Apocynoideae, Mesechiteae), para Colombia. Candollea 2005, 60, 51–58. [Google Scholar]
- Morales, J.F. Estudios en las Apocynaceae Neotropicales XXXI: El complejo de Mandevilla hirsuta y cuatro nuevas especies. J. Bot. Res. Inst. Tex. 2007, 1, 859–869. [Google Scholar]
- de Souza-Silva, R.F.; Rapini, A.; Morales, J.F. Mandevilla catimbauensis (Apocynaceae), a new species form the semi-ardi region, Pernamabuco, Brazil. Edinb. J. Bot. 2010, 67. [Google Scholar] [CrossRef]
- Simões, A.O.; Kinoshita, L.S.; Endress, M.E. New combinations in Mandevilla Lindley (Apocynaceae). Novon 2007, 17, 87–90. [Google Scholar] [CrossRef]
- Lannes, R.; SAS DHM INNOVATION, Malause, France. Personal communication, 2016.
- Patent Genius. Available online: http://www.patentgenius.com (accessed on 26 September 2016).
- Krieger, E. New trends in Intellecutual Property Protection for Plant Innovations. Acta Hortic. 2012, 953, 19–22. [Google Scholar] [CrossRef]
- Gupta, P.K.; Varshney, R.K. The development and use of microsatellite markers for genetic analysis and plant breeding with emphasis in bread wheat. Euphytica 2000, 113, 163–185. [Google Scholar] [CrossRef]
- Tautz, D. Hypervariabflity of simple sequences as a general source for polymorphic DNA markers. Nucleic Acids Res. 1989, 17, 6463–6471. [Google Scholar] [CrossRef] [PubMed]
- Debener, T. Molecular markers for ornamental plant genetics, genomics and breeding. Acta Hortic. 2012, 953, 193–200. [Google Scholar] [CrossRef]
- De Riek, J.; Debener, T. Present use of molecular markers in ornamental breeding. Acta Hortic. 2010, 855, 77–84. [Google Scholar] [CrossRef]
- Debener, T.; Linde, M. Exploring complex ornamental genomes: The rose as a model plant. CRC Crit. Rev. Plant Sci. 2009, 28, 267–280. [Google Scholar] [CrossRef]
- Kimura, T.; Yagi, M.; Nishitani, C.; Onozaki, T.; Ban, Y.; Yamamoto, T. Development of SSR markers in carnation (Dianthus caryophyllus). J. Jpn. Soc. Hort. Sci. 2009, 78, 115–123. [Google Scholar] [CrossRef]
- Gong, L.; Deng, Z. EST-SSR markers for gerbera (Gerbera hybrida). Mol. Breed. 2010, 26, 125–132. [Google Scholar] [CrossRef]
- Lee, S.I.; Park, K.C.; Song, Y.S.; Son, J.H.; Kwon, S.J.; Na, K.J.; Kim, J.H.; Kim, N.S. Development of expressed sequence tag derived-simple sequence repeats in the genus Lilium. Genes Genom. 2011, 33, 727–733. [Google Scholar] [CrossRef]
- Tang, N.; Shahin, A.; Bijman, P.; Liu, J.; van Tuyl, J.; Arens, P. Genetic diversity and structure in a collection of tulip cultivars assessed by SNP markers. Sci. Hortic. 2013, 61, 286–292. [Google Scholar] [CrossRef]
- Jo, K.M.; Jo, Y.; Chu, H.; Lian, S.; Cho, W.K. Development of EST-derived SSR markers using next-generation sequencing to reveal the genetic diversity of 50 chrysanthemum cultivars. Biochem. Syst. Ecol. 2015, 60, 37–45. [Google Scholar] [CrossRef]
- Callen, D.F.; Thompson, A.D.; Shen, Y.; Phillips, H.A.; Richards, R.I.; Mulley, J.C.; Sutherland, G.R. Incidence and origin of “null” alleles in the (AC)n microsatellite markers. Am. J. Hum. Genet 1993, 52, 922–927. [Google Scholar] [PubMed]
- Viruel, M.A.; Escribano, P.; Barbieri, M.; Ferri, M.; Hormaza, J.I. Fingerprinting, embryo type and geographic differentiation in mango (Mangifera indica L., Anacardiaceae) with microsatellites. Mol. Breed. 2005, 15, 383–393. [Google Scholar] [CrossRef]
- Escribano, P.; Viruel, M.A.; Hormaza, J.I. Characterization and cross-species amplification of microsatellite markers in cherimoya (Annona cherimola Mill., Annonaceae). Mol. Ecol. Notes 2004, 4, 746–748. [Google Scholar] [CrossRef]
- Viruel, M.A.; Hormaza, J.I. Development, characterization and variability analysis of microsatellite in lychee (Litchi chinensis Sonn, Sapindaceae). Theor. Appl. Genet. 2004, 108, 896–902. [Google Scholar] [CrossRef] [PubMed]
- Bennet, M.D.; Leitch, I.J. Royal Botanic Gardens, Kew. Plant DNA-C Values Database (Release 6.0, December 2012). Available online: http://www.kew.org/cvalues/ (accessed on 23 September 2016).
- Martín, C. Desarrollo de un mapa genético, variación de ploidía y anomalías meióticas en el género Annona. Ph.D. Thesis, Universidad de Málaga, Málaga, Spain, 2013. [Google Scholar]
- Escribano, P.; Viruel, M.A.; Hormaza, J.I. Development of 52 new polymorphic SSR markers from cherimoya (Annona cherimola Mill.). Transferability to related taxa and selection of a reduced set for DNA fingerprinting and diversity studies. Mol. Ecol. Resour. 2008, 8, 317–321. [Google Scholar] [CrossRef] [PubMed]
- Morgante, M.; Hanafey, M.; Powell, W. Microsatellites are preferentially associated with nonrepetitive DNA in plant genomes. Nat. Genet. 2002, 30, 194–200. [Google Scholar] [CrossRef] [PubMed]
- Kalinowski, S.T.; Taper, M.L.; Marshall, T.C. Revising how the computer program CERVUS accommodates genotyping error increases success in paternity assignment. Mol. Ecol. 2007, 16, 1099–1106. [Google Scholar] [CrossRef] [PubMed]
- Gross-German, E.; Viruel, M.A. Molecular characterization of avocado germplasm with a new set of SSR and EST-SSR markers: Genetic diversity, population structure, and identification of race-specific markers in a group of cultivated genotypes: Tree Genet. Genomes 2013, 9, 539–555. [Google Scholar] [CrossRef]
- Suntory Collection. Available online: http://suntorycollection.info/merken/sundaville-2/ (accessed on 23 September 2016).
- Lannes. Available online: http://www.lannes.pro/ (accessed on 23 September 2016).
- Weising, K.; Nybom, H.; Wolff, K.; Meyer, W. DNA Fingerprinting in Plants and Fungi; CRC Press: Boca Raton, FL, USA, 1995; pp. 229–233. [Google Scholar]
- Esselink, G.; Smulders, M.; Vosman, B. Identification of cut rose (Rosa hybrida) and rootstock varieties using robust sequence tagged microsatellite site markers. Theor. Appl. Genet. 2003, 106, 277–286. [Google Scholar] [PubMed]
- Aranzana, M.J.; Carbó, J.; Arús, P. Using amplified fragment-length polymorphisms (AFLPs) to identify peach cultivars. J. Am. Soc. Hortic. Sci. 2003, 128, 672–677. [Google Scholar]
- Merritt, B.J.; Culley, T.M.; Avanesyan, A.; Stokes, R.; Brzyski, J. An empirical review: Characteristics of plant microsatellite markers that confer higher levels of genetic variation. Appl. Plant Sci. 2015, 3, 1500025. [Google Scholar] [CrossRef] [PubMed]
- Steinkellner, H.; Lexer, C.; Turetschek, E.; Glössl, J. Conservation of (GA)n microsatellite loci between Quercus species. Mol. Ecol. 1997, 6, 1189–1194. [Google Scholar] [CrossRef]
- Longwood Gardens. Available online: http://longwoodgardens.org (accessed on 13 April 2016).
- Tachibana, R.; Suzuki, K.; Yomo, Y. Mandevilla Plant Named “Sunmandeho”. U.S. Plant Patent PP11556, 10 October 2000. [Google Scholar]
- Misato, T.; Murakami, Y. Mandevilla Plant Named “Sunmandecos”. U.S. Plant Patent PP15202, 5 October 2004. [Google Scholar]
- Misato, T.; Murakami, Y. Mandevilla Plant Named “Sunmandecrim”. U.S. Plant Patent PP15539, 8 February 2005. [Google Scholar]
- Ruys, T. Mandevilla Plant Named “Sunparapibra”. U.S. Plant Patent PP19649, 20 January 2009. [Google Scholar]
- Lannes, R. Mandevilla Plant Named “Lanmontana”. U.S. Plant Patent PP24121, 31 December 2013. [Google Scholar]
- Lannes, R. Mandevilla Plant Named “Laniowa”. PP24075, 10 December 2013. [Google Scholar]
- Varshney, R.K.; Kumar, A.; Balyan, H.S.; Roy, J.K.; Prasad, M.; Gupta, P.K. Characterization of microsatellites and development of chromosome specific STMS markers in bread wheat. Plant Mol. Biol. Rep. 2000, 18, 5–16. [Google Scholar] [CrossRef]
- Paetkau, D.; Strobeck, C. Microsatellite analysis of genetic variation in black bear populations. Mol. Ecol. 1994, 3, 489–495. [Google Scholar] [CrossRef] [PubMed]
- Wright, S. The genetic structure of populations. Ann. Eugen. 1949, 15, 323–354. [Google Scholar] [CrossRef]
- Botstein, D.; White, R.L.; Skolnick, M.; David, R.W. Construction of a genetic linkage map in man using restriction fragment length polymorphisms. Am. J. Hum. Genet. 1980, 32, 314–331. [Google Scholar] [PubMed]
- Kendall, M.; Stewart, A. Distribution theroy. In The Advanced Theory of Statistics, 4th ed.; Macmillan: New York, NY, USA, 1977; Volume 1. [Google Scholar]
- Valière, N. GIMLET: A computer program for analysing genetic individual identification data. Mol. Ecol. Notes 2002, 2, 377–379. [Google Scholar] [CrossRef]
- Lynch, M. The similarity index and DNA fingerprinting. Mol. Biol. Evol. 1990, 7, 478–484. [Google Scholar] [PubMed]
- Yap, V.; Nelson, R.J. WinBoot: A Program for Performing Bootstrap Analysis of Binary Data to Determine the Confidence Limits of UPGMA-Based Dendrograms; International Rice Research Institute: Manila, Philippines, 1996; pp. 1–22. [Google Scholar]
- Jaccard, P. Nouvelles recherches sur la distribution florale. Bull. Soc. Vaud. Sci. Nat. 1908, 44, 223–270. [Google Scholar]
- Sample Availability: Samples of the compounds are not available from the authors.


| SSR | GenBank Accession | Primer Sequence (5’-3’) | Repeat Motif | Type 1 | Expected Size (bp) | A | Ne | Ho | He | PIC | HW 2 | F (Wright) | F (Null) | PI (Biased) | PI (Unbiased) | A (with Species) |
|---|---|---|---|---|---|---|---|---|---|---|---|---|---|---|---|---|
| MDVLM1 | KX243191 | F: AATACAAGGGCACACATAGG | (GT)13(GA)10 | I | 115 | 3 | 1.48 | 0.36 | 0.33 | 0.28 | NS | −0.12 | −0.09 | 0.50 | 0.40 | 6 |
| R: CAAGGATCCTCTGTTTTCTG | ||||||||||||||||
| MDVLM2 | KX243192 | F: AGTGTTCTCCACTGTACTAGA | (GT)7(GA)9 | P | 248 | 2 | 1.21 | 0.18 | 0.17 | 0.15 | NS | −0.05 | −0.04 | 0.71 | 0.64 | 2 |
| R: CTGTGTTACCATTCTCATCT | ||||||||||||||||
| MDVLM3 | KX243193 | F: TTCTTCCCTCCTAAAAAGGT | (CT)10 | I | 206 | 3 | 2.22 | 0.55 | 0.55 | 0.47 | NS | 0.01 | −0.04 | 0.28 | 0.20 | 7 |
| R: TCAAGTGTGAATTTGGTTGA | ||||||||||||||||
| MDVLM4 | KX243194 | F: GGGGAAGGGAAAATAATAGA | (GA)11 | P | 141 | 5 | 2.38 | 0.27 | 0.58 | 0.52 | NS | 0.53 | 0.41 | 0.23 | 0.13 | 7 |
| R: CGACATAAGCAAAGGAACTT | ||||||||||||||||
| MDVLM5 | KX243195 | F: TGGGAGTAGAAGAAACCCTA | (GA)14 | I | 108 | 3 | 1.49 | 0.27 | 0.33 | 0.29 | NS | 0.17 | 0.15 | 0.49 | 0.38 | 7 |
| R: CATACCCTTCTCCTCCTCTT | ||||||||||||||||
| MDVLM6 | KX243196 | F: GAGCTACTCTTTTTGTGTGC | (GT)6(GA)10 | P | 126 | 5 | 5.78 | 0.91 | 0.83 | 0.76 | NS | −0.10 | −0.07 | 0.08 | 0.04 | 7 |
| R: ATAGATTGAGTGAGAAATACCA | ||||||||||||||||
| MDVLM7 | KX243197 | F: TATGAAGAATGAATGAATGAC | (GGAA)9 | I | 135 | 3 | 1.22 | 0.09 | 0.18 | 0.16 | ** | 0.49 | 0.45 | 0.70 | 0.61 | 5 |
| R: GTGATTAGAAGAAAAGTCACAC | ||||||||||||||||
| MDVLM8 | KX265707 | F: AGGTGATACATCTTCTGACTT | (CT)13 | P | 105 | 6 | 5.13 | 0.82 | 0.81 | 0.73 | NS | −0.02 | −0.04 | 0.09 | 0.04 | 9 |
| R: ATTGCTACATCCAATCTAATC | ||||||||||||||||
| MDVLM9 | KX243198 | F: TCTGTCTTTTATTTTTACCTTT | (GA)10 | I | 257 | 3 | 2.18 | 0.73 | 0.54 | 0.42 | NS | −0.34 | −0.16 | 0.33 | 0.28 | 7 |
| R: GCATTTCAGTAGTAAGTTGAA | ||||||||||||||||
| MDVLM10 | KX265708 | F: GAAATCTCAGAGGAAAAAGTAG | (GA)10 | I | 105 | 2 | 1.10 | 0.09 | 0.09 | 0.08 | NS | 0.00 | −0.01 | 0.84 | 0.79 | 5 |
| R: GCCTTATTGAGGAGGGTATT | ||||||||||||||||
| MDVLM11 | KX243199 | F: AAAGGACCAAAGAATAATAAAC | (GT)7(GA)13 | I | 111 | 5 | 3.08 | 0.46 | 0.68 | 0.61 | NS | 0.33 | 0.21 | 0.16 | 0.08 | 9 |
| R: CAGGTTTTTGAAGGTGATCT | ||||||||||||||||
| MDVLM12 | KX243200 | F: CTACCTTGGTCTTTAGTCTGTA | (CT)10 | I | 166 | 3 | 2.46 | 0.46 | 0.59 | 0.50 | NS | 0.23 | 0.09 | 0.25 | 0.18 | 3 |
| R: AGGAAAAGCAAATCATACTT | ||||||||||||||||
| MDVLM13 | KX243201 | F: ATGAACATTTCGTGTATGTG | (GA)12 | I | 142 | 5 | 3.45 | 0.55 | 0.71 | 0.64 | NS | 0.23 | 0.13 | 0.14 | 0.07 | 9 |
| R: CTATTTCTTCTTGTTGTCTTCT | ||||||||||||||||
| MDVLM14 | KX243202 | F: GTGAATTCTATTACAGTTTTTGT | (CT)10 | P | 123 | 3 | 2.18 | 0.73 | 0.54 | 0.42 | NS | −0.34 | −0.16 | 0.33 | 0.28 | 5 |
| R: GAGATAATGATAGCGACTAAAC | ||||||||||||||||
| MDVLM15 | KX243203 | F: TCATAAATCTTTGTTGCTAAA | (CT)10 | I | 191 | 3 | 2.75 | 0.46 | 0.64 | 0.52 | NS | 0.28 | 0.13 | 0.24 | 0.20 | 4 |
| R: ATTCCAATAAGTTCATCACTAT | ||||||||||||||||
| MDVLM16 | KX243204 | F: AGTGAGCGTCTCTTACCAAA | (GA)10 | P | 175 | 4 | 2.26 | 0.09 | 0.56 | 0.48 | *** | 0.84 | 0.73 | 0.27 | 0.18 | 5 |
| R: ACACAAGCAAGGAATTATGC | ||||||||||||||||
| MDVLM17 | KX243205 | F: TATTTATAGTCTTGGCCTCTAT | (GT)11(GA)9 | I | 160 | 4 | 3.08 | 0.46 | 0.68 | 0.58 | NS | 0.33 | 0.20 | 0.19 | 0.14 | 5 |
| R: TATCTAGTTTCTGACTTGCATA | ||||||||||||||||
| MDVLM18 | KX243206 | F: AGTATATCAAAGGAATTTTCAA | (GA)9 | P | 245 | 4 | 2.36 | 0.27 | 0.58 | 0.51 | * | 0.53 | 0.40 | 0.24 | 0.14 | 7 |
| R: ATAACTGTAGTGAGGATGAGAT | ||||||||||||||||
| MDVLM19 | KX243207 | F: ACCCAGAAACTTGGAAATCT | (GA)10 | P | 189 | 6 | 5.92 | 0.91 | 0.83 | 0.76 | * | 0.11 | −0.08 | 0.07 | 0.03 | 9 |
| R: GGTTTGGTGTTGTCAATTTT | ||||||||||||||||
| MDVLM20 | KX580305 | F: TATCTGTAAGCAAGTATCTGAA | (CT)8(CA)14 | P | 249 | 7 | 5.78 | 0.91 | 0.83 | 0.76 | NS | −0.10 | −0.07 | 0.06 | 0.01 | 9 |
| R: ACTGAGAAATCAAGAGAAGAT | ||||||||||||||||
| AVERAGE | 3.95 | 2.87 | 0.48 | 0.55 | 0.48 | 0.15 | 0.11 | 0.31 | 0.24 | 6.35 |
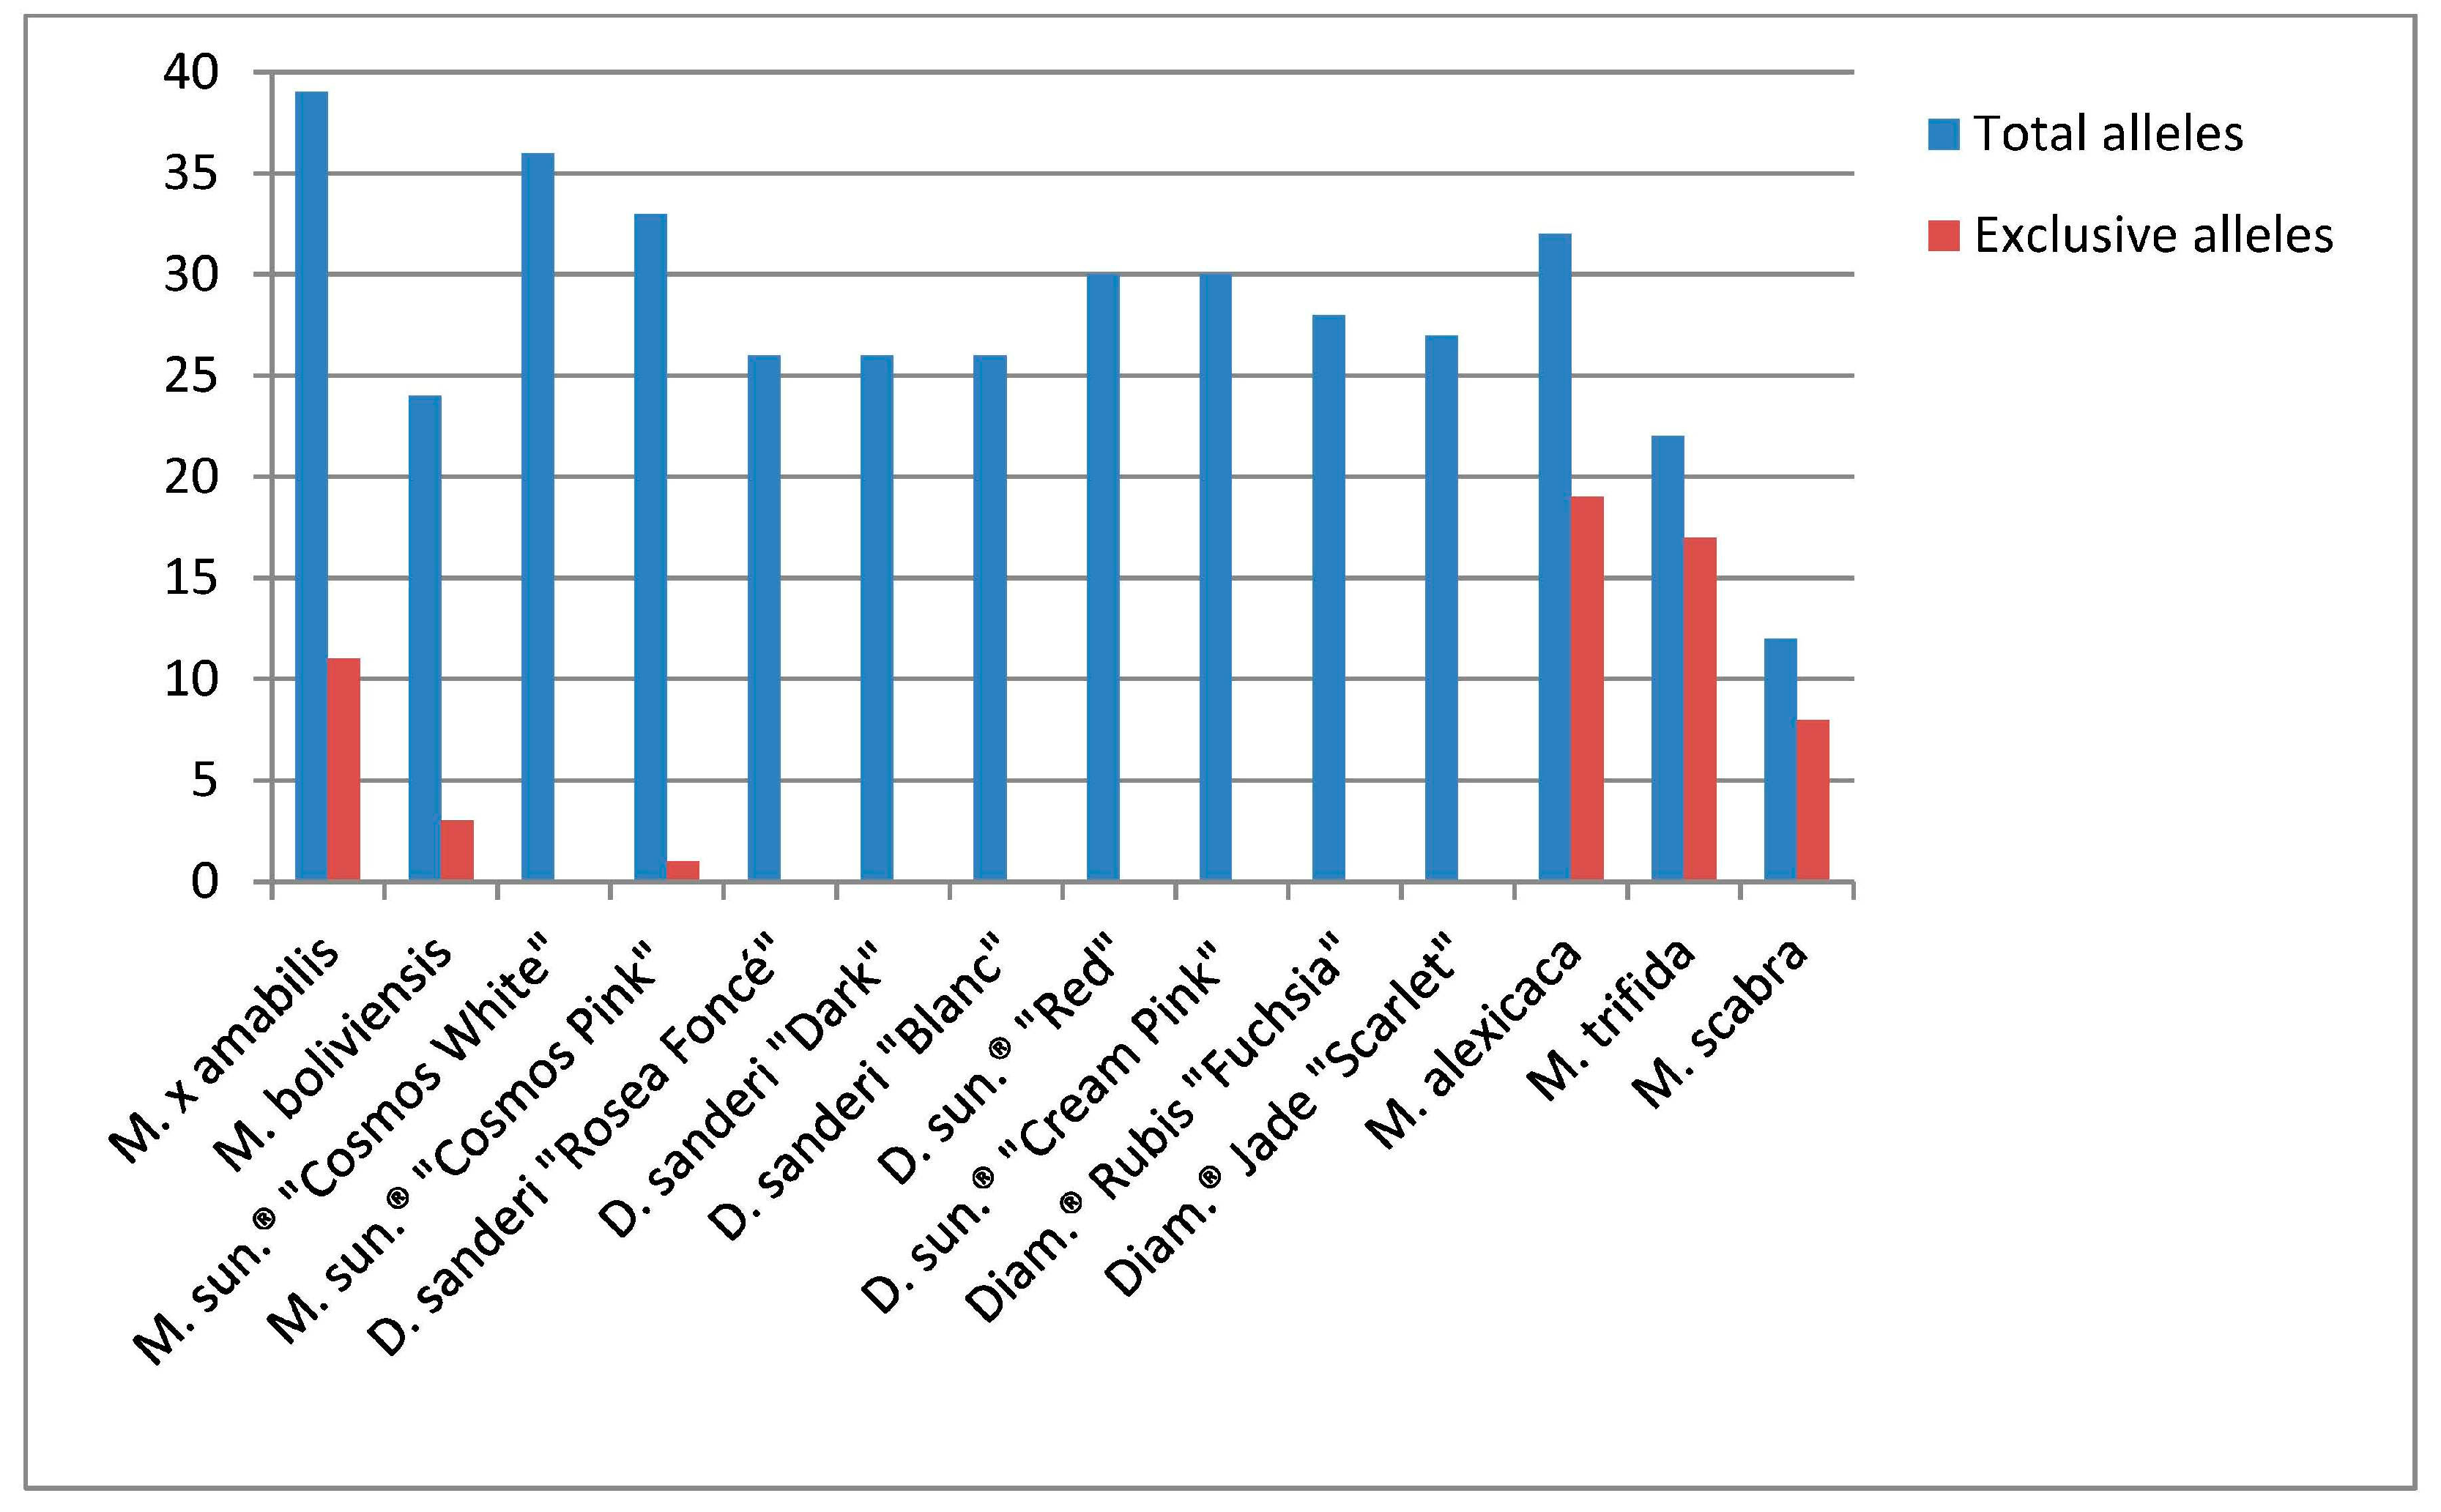
| Genotype | SSR Data | Total Alleles | Alleles Per Locus (Average) | Exclusive Alleles |
|---|---|---|---|---|
| M. × amabilis | 20 | 39 | 1.9 | 11 |
| M. boliviensis | 20 | 24 | 1.2 | 3 |
| M. sundaville® “Cosmos White” | 20 | 36 | 1.8 | 0 |
| M. sundaville® “Cosmos Pink” | 20 | 33 | 1.6 | 1 |
| D. sanderi “Rosea Foncé” | 20 | 26 | 1.3 | 0 |
| D. sanderi “Dark” | 20 | 26 | 1.3 | 0 |
| D. sanderi “Blanc” | 20 | 26 | 1.3 | 0 |
| D. sundaville® “Red” | 20 | 30 | 1.5 | 0 |
| D. sundaville® “Cream Pink” | 20 | 30 | 1.5 | 0 |
| Diamantina® Rubis “Fuchsia” | 20 | 28 | 1.4 | 0 |
| Diamantina® Jade “Scarlet” | 20 | 27 | 1.3 | 0 |
| M. alexicaca | 19 | 32 | 1.7 | 19 |
| M. trifida | 16 | 22 | 1.4 | 17 |
| M. scabra | 11 | 12 | 1.1 | 8 |
| Genotypes | M. × amabilis | M. boliviensis | M. sundaville® “Cosmos White” | M. sundaville® “Cosmos Pink” | D. sanderi “Rosea Foncé” | D. sanderi “Dark” | D. sanderi “Blanc” | D. sundaville® “Red” | D. sundaville® “Cream Pink” | Diamantina® Rubis “Fuchsia” | Diamantina® Jade “Scarlet” | M. alexicaca | M. trifida | M. scabra |
|---|---|---|---|---|---|---|---|---|---|---|---|---|---|---|
| M. × amabilis | 1.000 | |||||||||||||
| M. boliviensis | 0.286 | 1.000 | ||||||||||||
| M. sundaville® “Cosmos White” | 0.640 | 0.700 | 1.000 | |||||||||||
| M. sundaville® “Cosmos Pink” | 0.583 | 0.561 | 0.754 | 1.000 | ||||||||||
| D. sanderi “Rosea Foncé” | 0.246 | 0.280 | 0.355 | 0.339 | 1.000 | |||||||||
| D. sanderi “Dark” | 0.246 | 0.280 | 0.355 | 0.339 | 1.000 | 1.000 | ||||||||
| D. sanderi “Blanc” | 0.246 | 0.280 | 0.355 | 0.339 | 1.000 | 1.000 | 1.000 | |||||||
| D. sundaville® “Red” | 0.203 | 0.259 | 0.333 | 0.349 | 0.714 | 0.714 | 0.714 | 1.000 | ||||||
| D. sundaville® “Cream Pink” | 0.203 | 0.259 | 0.333 | 0.349 | 0.714 | 0.714 | 0.714 | 1.000 | 1.000 | |||||
| Diamantina® Rubis “Fuchsia” | 0.239 | 0.231 | 0.344 | 0.361 | 0.778 | 0.778 | 0.778 | 0.897 | 0.897 | 1.000 | ||||
| Diamantina® Jade “Scarlet” | 0.273 | 0.314 | 0.413 | 0.400 | 0.868 | 0.868 | 0.868 | 0.807 | 0.807 | 0.764 | 1.000 | |||
| M. alexicaca | 0.203 | 0.182 | 0.212 | 0.219 | 0.140 | 0.140 | 0.140 | 0.164 | 0.164 | 0.169 | 0.138 | 1.000 | ||
| M. trifida | 0.075 | 0.050 | 0.082 | 0.000 | 0.048 | 0.048 | 0.048 | 0.044 | 0.044 | 0.045 | 0.048 | 0.000 | 1.000 | |
| M. scabra | 0.118 | 0.000 | 0.000 | 0.000 | 0.000 | 0.000 | 0.000 | 0.000 | 0.000 | 0.000 | 0.000 | 0.129 | 0.083 | 1.000 |
| Vegetal Material | Botanical Designation/Registered Name (Released Year) | Origin | Pedigree |
|---|---|---|---|
| Mandevilla × amabilis | Mandevilla hybrida | Brazil | Mandevilla splends hybrid |
| Mandevilla boliviensis | Native species | Bolivia and Ecuador | - |
| Mandevilla sundaville® “Cosmos White” | Mandevilla hybrida/Sunmadeho® (2000) | Hybrid. Suntory® Cosmos serie | M.× amabilis “Rose Giant” × M. boliviensis |
| Mandevilla sundaville® “Cosmos Pink” | Mandevilla hybrida/Sunmadecos® (2004) | Hybrid. Suntory® Cosmos serie | M. sundaville® “Cosmos White” × M. × amabilis “Rose Giant” |
| Dipladenia sanderi “Rosea Foncé” | Native species | Original clon from Brazil | M. sanderi “Rosea” sport mutation |
| Dipladenia sanderi “Dark” | Native species | Original clon from Brazil | M. sanderi “Rosea” sport mutation |
| Dipladenia sanderi “Blanc” | Native species | Original clon from Brazil | M. sanderi “Rosea” sport mutation |
| Dipladenia sundaville® “Red” | Mandevilla hybrida/Sunmadecrim® (2005) | Hybrid. Suntory® Classic serie | M. atroviolacea × M. sundaville® “Cosmos White” |
| Dipladenia sundaville® “Cream Pink” | Mandevilla hybrida/Sunparapibra® (2009) | Hybrid. Suntory® Classic serie | D. sundaville® “Red” sport mutation |
| Diamantina® Rubis “Fuchsia” | Mandevilla sanderi/Lanmontana® (2013) | Hybrid. DHM Diamantina® serie | D. sundaville® “Cream Pink” × M. sanderi “Rosea Foncé” |
| Diamantina® Jade “Scarlet” | Mandevilla sanderi/Laniowa® (2013) | Hybrid. DHM Diamantina® serie | D. sundaville® “Cream Pink” × M. sanderi “Rosea Foncé” |
| Mandevilla alexicaca | wild species | Brazil | - |
| Mandevilla trifida | wild species | Brazil | - |
| Mandevilla scabra | wild species | Brazil | - |
© 2016 by the authors. Licensee MDPI, Basel, Switzerland. This article is an open access article distributed under the terms and conditions of the Creative Commons Attribution (CC-BY) license ( http://creativecommons.org/licenses/by/4.0/).
Share and Cite
Oder, A.; Lannes, R.; Viruel, M.A. A Set of 20 New SSR Markers Developed and Evaluated in Mandevilla Lindl. Molecules 2016, 21, 1316. https://doi.org/10.3390/molecules21101316
Oder A, Lannes R, Viruel MA. A Set of 20 New SSR Markers Developed and Evaluated in Mandevilla Lindl. Molecules. 2016; 21(10):1316. https://doi.org/10.3390/molecules21101316
Chicago/Turabian StyleOder, Alev, Robert Lannes, and Maria Angeles Viruel. 2016. "A Set of 20 New SSR Markers Developed and Evaluated in Mandevilla Lindl." Molecules 21, no. 10: 1316. https://doi.org/10.3390/molecules21101316
APA StyleOder, A., Lannes, R., & Viruel, M. A. (2016). A Set of 20 New SSR Markers Developed and Evaluated in Mandevilla Lindl. Molecules, 21(10), 1316. https://doi.org/10.3390/molecules21101316