
A Novel Tetrahydrocannabinol Electrochemical Nano Immunosensor Based on Horseradish Peroxidase and Double-Layer Gold Nanoparticles


Abstract
: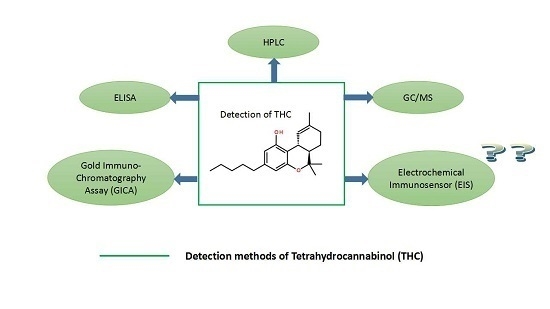
1. Introduction
2. Results and Discussion
2.1. The Characterization of GNPs
2.2. The Characterization of Electrode Pretreatment
2.3. The Assembly and Characterization of the Electrode
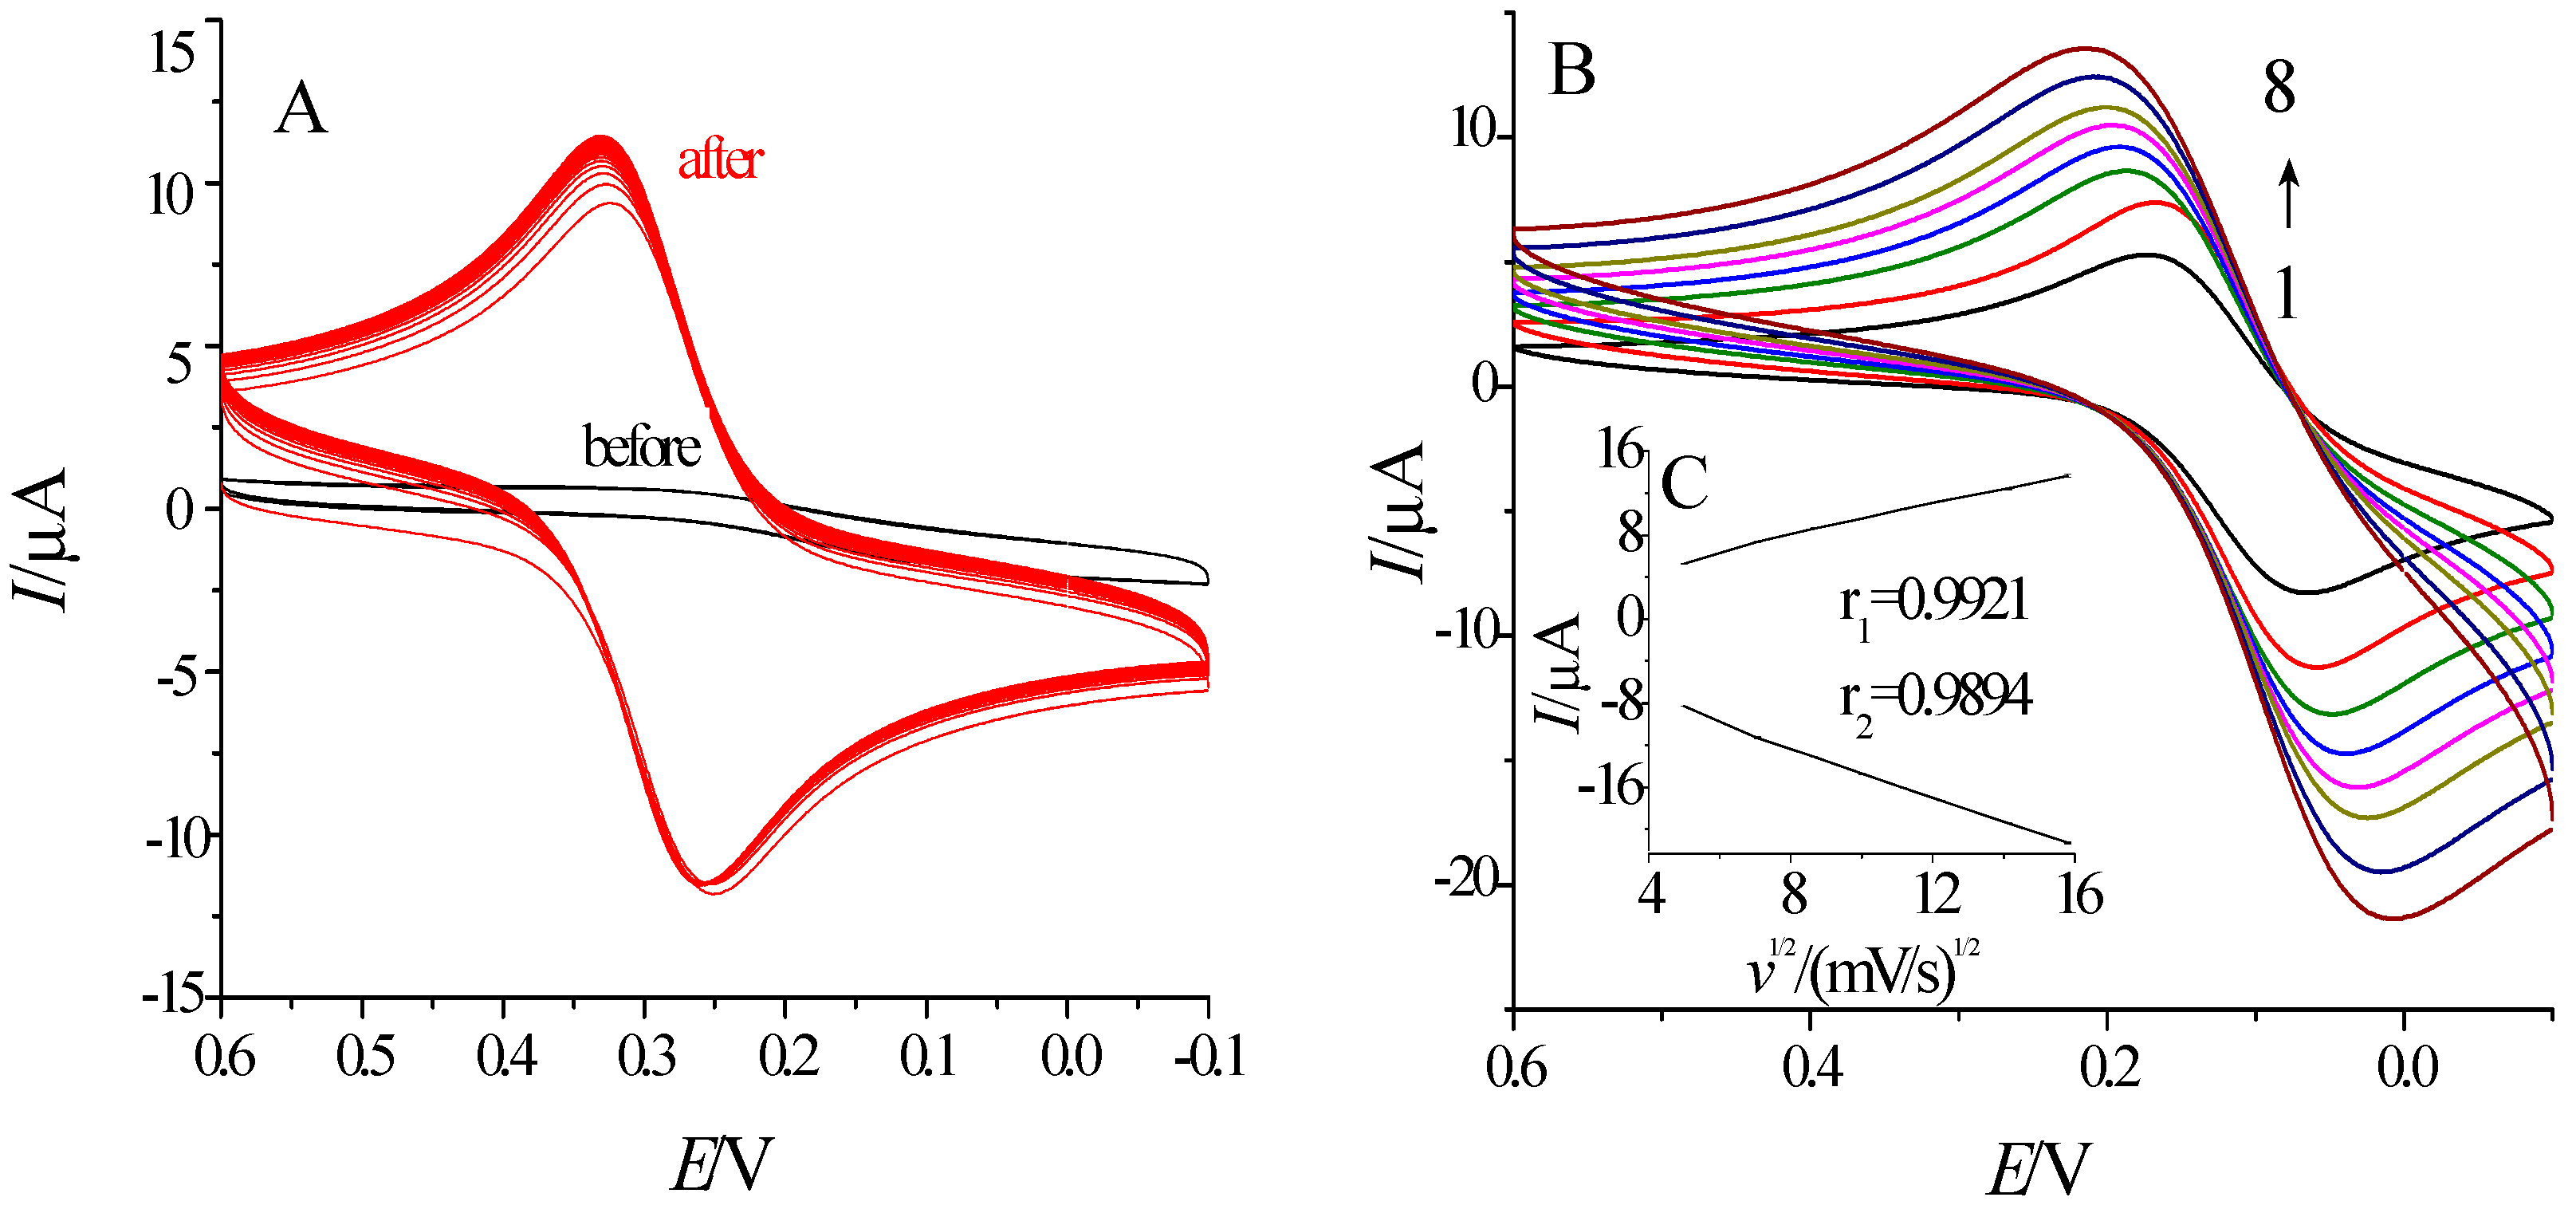
2.4. Cyclic Voltammetry and AC Impedance Graph before and after the Immune Response
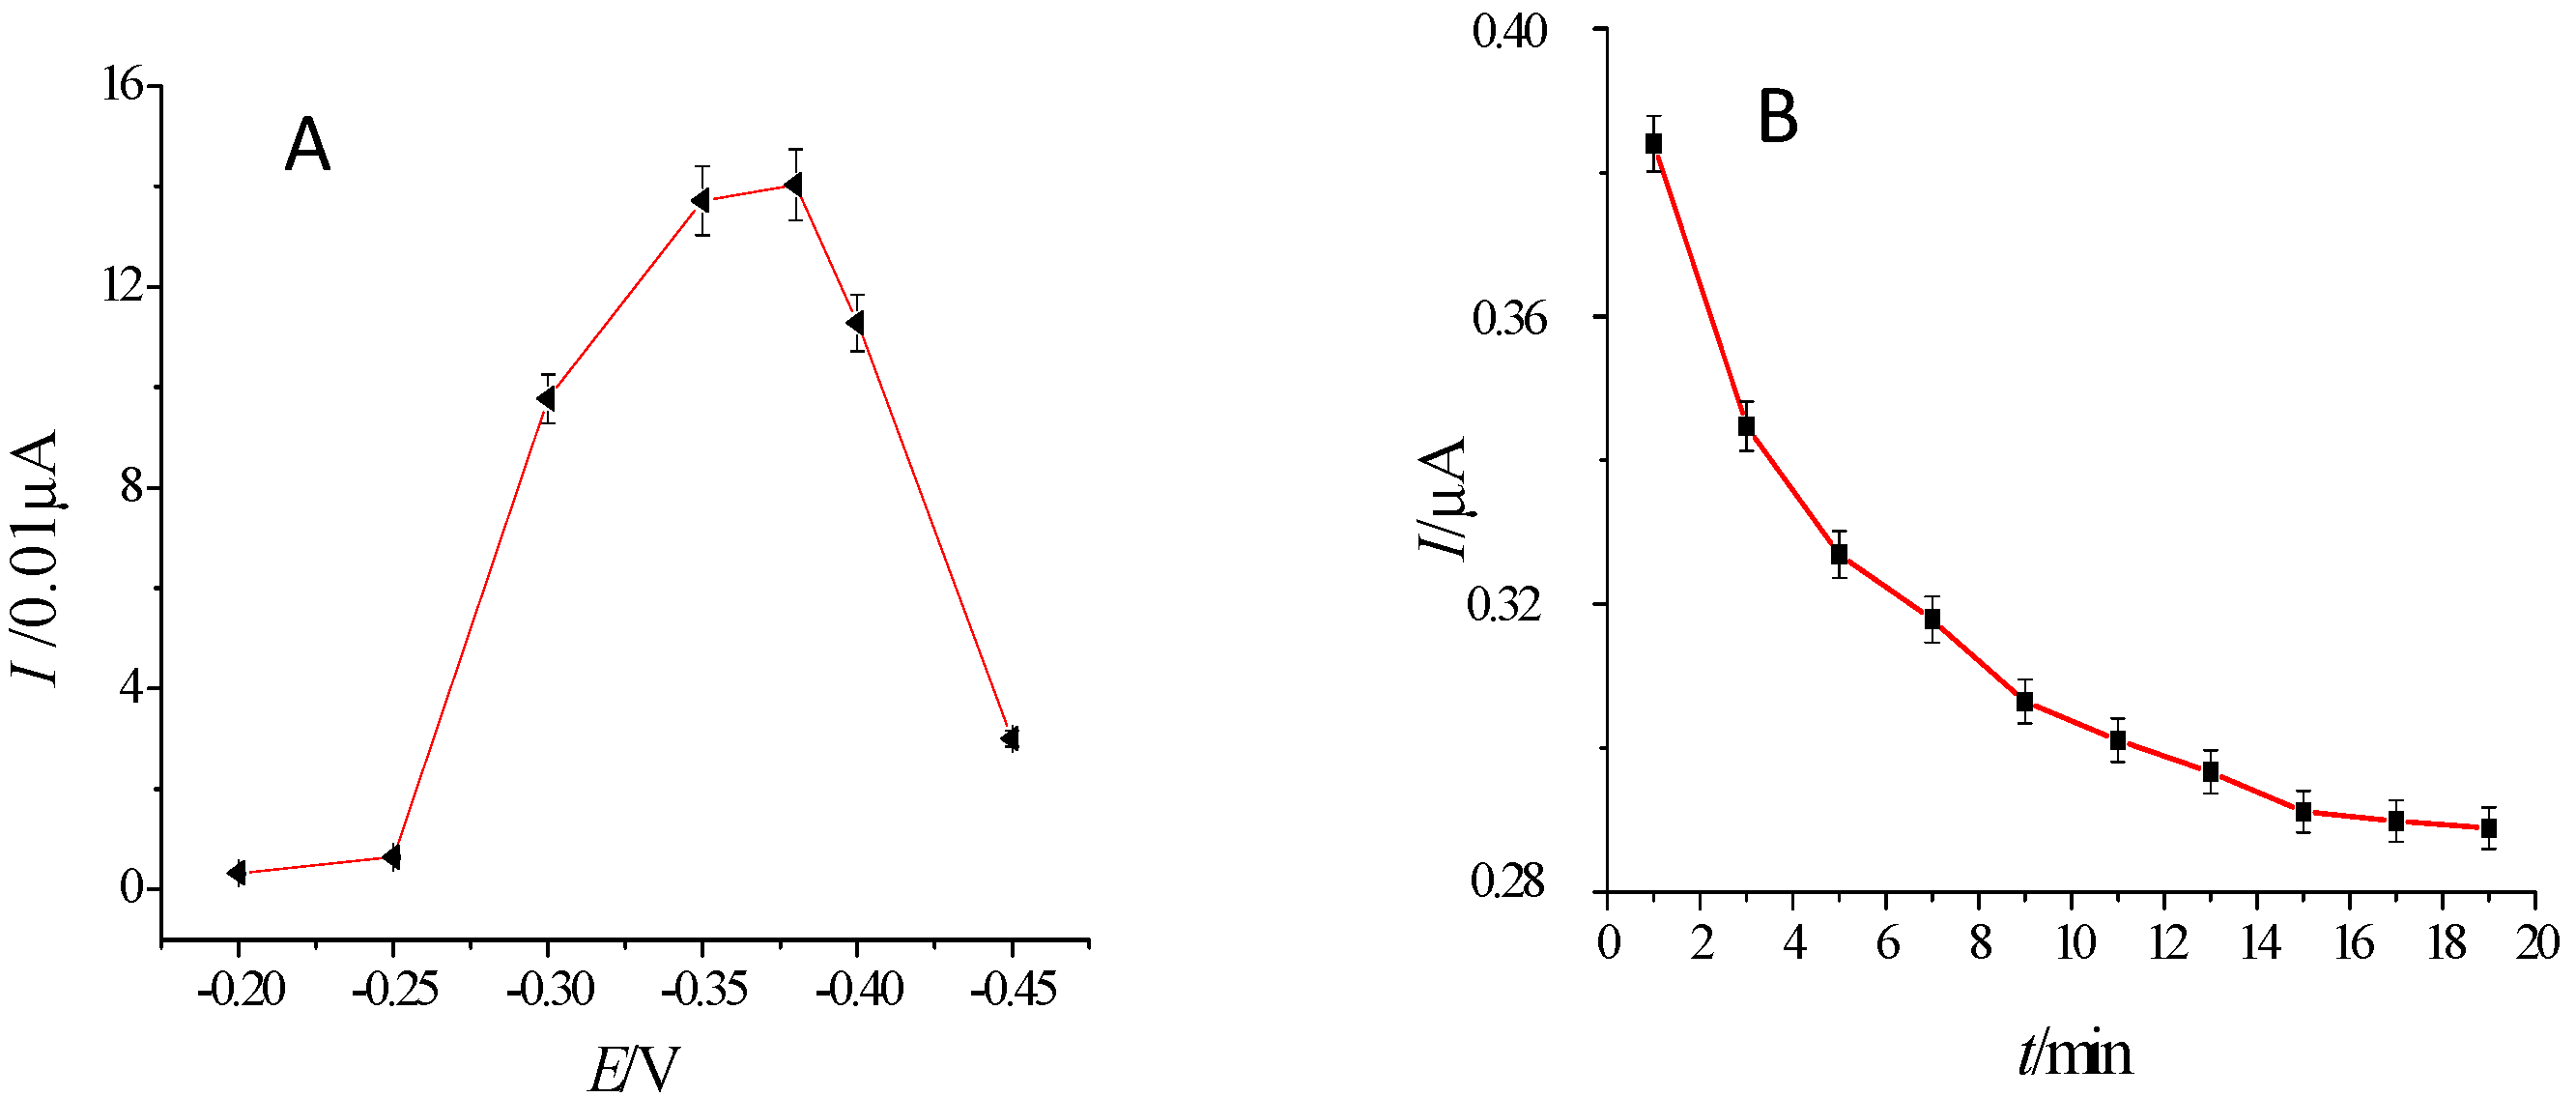
2.5. Optimization of Detection of Potential and Incubation Time
2.6. THC Quantitative Detection
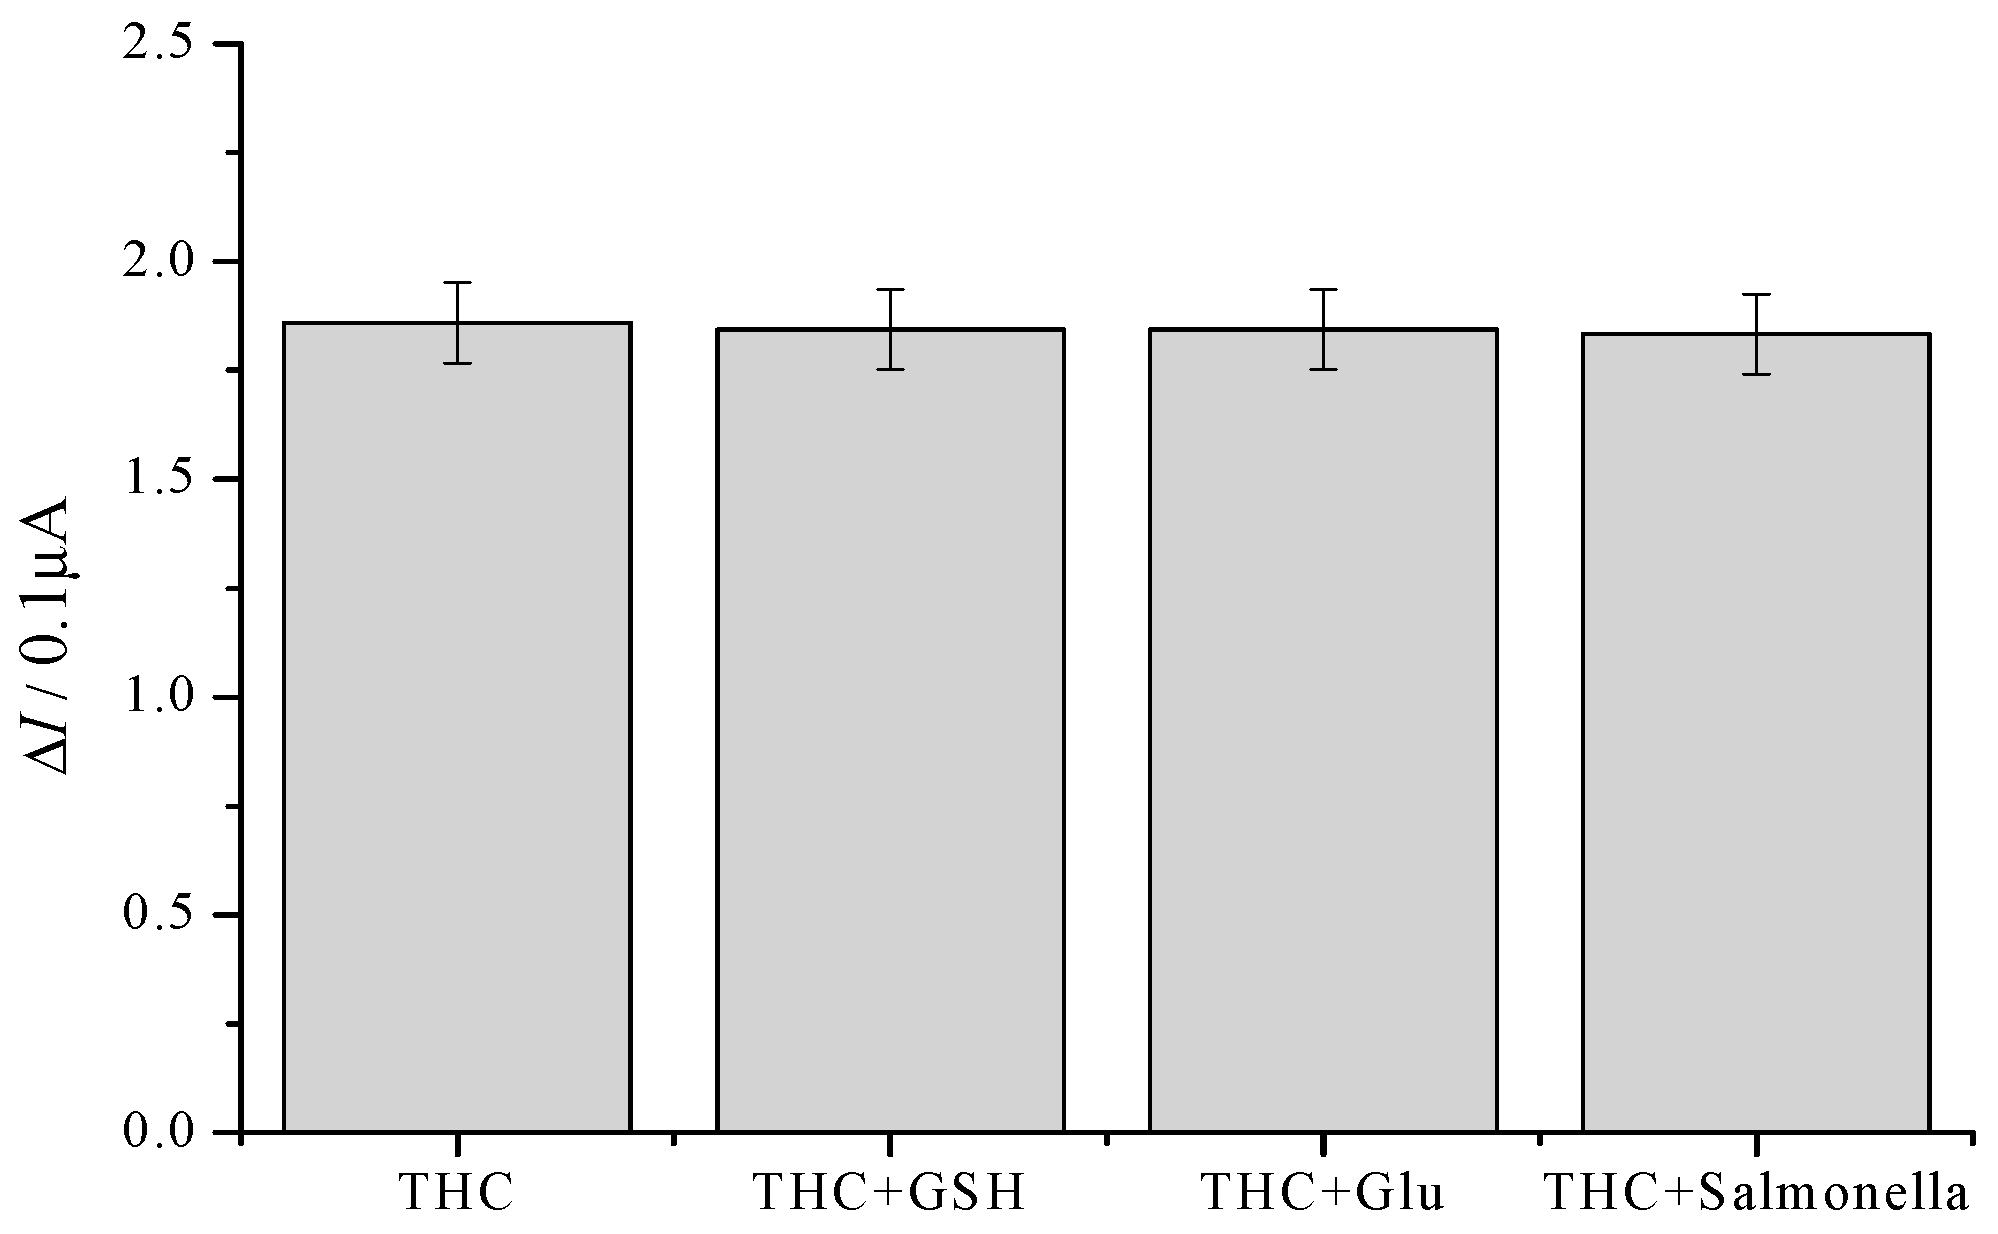
2.7. Specificity, Reproducibility, and Stability of the Immunosensor
2.8. Real Sample Analysis
3. Materials and Methods
3.1. Materials and Reagents
3.2. Apparatus and Facilities
3.3. The Preparation and Characterization of Gold Nanoparticles (GNPs)
3.4. The Preparation of the Copolymer of Thi/Chit
3.5. The Preparatio of GNPs/HRP
3.6. The Pretreatment of Glassy Carbon Electrode (GCE)
3.7. The Preparation of the Immunosensor
3.8. The Determination Method of the Immunosensor
4. Conclusions
Acknowledgments
Author Contributions
Conflicts of Interest
References
- Robson, P. Human Studies of Cannabinoids and Medicinal Cannabis; Cannabinoids Handbook of Experimental Pharmacology; Roger, G.P., Ed.; Springer-Verlag: Berlin, Germany, 2005; Volume 168, pp. 719–756. [Google Scholar]
- Mechoulam, R.; Peters, M.; Murillo-Rodriguez, E.; Hanuš, L.O. Cannabidiol-recent advances. Chem. Biodivers. 2007, 4, 1678–1692. [Google Scholar] [CrossRef] [PubMed]
- Wilson, R.I.; Kunos, G.; Nicoll, R.A. Presynaptic Specificity of Endocannabinoid Signaling in the Hippocampus. Neuron 2001, 31, 453–462. [Google Scholar] [CrossRef]
- Lastres-Becker, I.; Molina-Holgado, F.; Ramos, J.A.; Mechoulam, R.; Fernández-Ruiz, J. Cannabinoids provide neuroprotection against 6-hydroxydopamine toxicity in vivo and in vitro: Relevance to Parkinson’s disease. Neurobiol. Dis. 2005, 19, 96–107. [Google Scholar] [CrossRef] [PubMed]
- Iseger, T.A.; Bossong, M.G. A systematic review of the antipsychotic properties of cannabidiol in humans. Schizophr. Res. 2015, 162, 153–161. [Google Scholar] [CrossRef] [PubMed]
- Burstein, S. Cannabidiol (CBD) and its analogs: A review of their effects on inflammation. Bioorg. Med. Chem. 2015, 23, 1377–1385. [Google Scholar] [CrossRef] [PubMed]
- Campos, A.C.; Fogaça, M.V.; Sonego, A.B.; Guimarães, F.S. Cannabidiol, neuroprotection and neuropsychiatric disorders. Pharmacol. Res. 2009, 112, 119–127. [Google Scholar] [CrossRef] [PubMed]
- Fakhoury, M. Could cannabidiol be used as an alternative to antipsychotics? J. Psychiatr. Res. 2016, 80, 14–21. [Google Scholar] [CrossRef] [PubMed]
- Gururajan, A.; Malone, D.T. Does cannabidiol have a role in the treatment of schizophrenia? Schizophr. Res. 2016, 176, 281–290. [Google Scholar] [CrossRef] [PubMed]
- Backer, B.D.; Debrus, B.; Lebrun, P.; Theunis, L.; Dubois, N.; Decock, L.; Verstraete, A.; Hubert, P.; Charlier, C. Innovative development and validation of an HPLC/DAD method for the qualitative and quantitative determination of major cannabinoids in cannabis plant material. J. Chromatogr. B 2009, 877, 4115–4124. [Google Scholar] [CrossRef] [PubMed]
- Twitchett, P.J.; Williams, P.L.; Moffat, A.C. Photochemical detection in high-performance liquid chromatography and its application to cannabinoid analysis. J. Chromatogr. A 1978, 149, 683–691. [Google Scholar] [CrossRef]
- Abdel-Hay, K.M.; DeRuiter, J.; Smith, F.; Belal, T.S.; Clark, C.R. GC-MS analysis of the regioisomeric methoxy- and methyl-benzoyl-1-pentylindoles: Isomeric synthetic cannabinoids. Sci. Justice 2015, 55, 291–298. [Google Scholar] [CrossRef] [PubMed]
- Simões, S.S.; Silva, I.; Ajenjo, A.C.; Dias, M.J. Validation and application of an UPLC-MS/MS method for the quantification of synthetic cannabinoids in urine samples and analysis of seized materials from the Portuguese market. Forensic Sci. Int. 2014, 243, 117–125. [Google Scholar] [CrossRef] [PubMed]
- Kim, S.Y.; Kim, J.Y.; Kwon, W.; In, M.K.; Kim, Y.E.; Paeng, K.-J. Method development for simultaneous determination of amphetamine type stimulants and cannabinoids in urine using GC-MS. Microchem. J. 2013, 110, 326–333. [Google Scholar] [CrossRef]
- Wang, X.Y.; Pang, G.C. Amplification systems of weak interaction Biosensors: Applications and prospects. Sens. Rev. 2015, 35, 30–42. [Google Scholar] [CrossRef]
- Mao, X.; Jiang, J.H.; Chen, J.W.; Yu, R.Q. Cyclic accumulation of nanoparticles: A new strategy for electrochemical immunoassay based on the reversible reaction between dethiobiotin and avidin. Anal. Chim. Acta 2006, 557, 159–163. [Google Scholar] [CrossRef]
- Rao, V.K.; Rai, G.P.; Agarwal, G.S.; Suresh, S. Amperometric immunosensor for detection of antibodies of Salmonella typhi in patient serum. Anal. Chim. Acta 2005, 531, 173–177. [Google Scholar] [CrossRef]
- Ma, H.H.; Sun, J.Z.; Zhang, Y.; Zhen, T. Label-free immunosensor based on one-step electrodeposition of chitosan-gold nanoparticles biocompatible film on Au microelectrode for determination of aflatoxin B1 in maiz. Biosens. Bioelectron. 2016, 80, 222–229. [Google Scholar] [CrossRef] [PubMed]
- Moreno-Guzmán, M.; Ojeda, I.; Villalonga, R.; González-Cortés, A.; Yáñez-Sedeño, P.; Pingarrón, J.M. Ultrasensitive detection of adrenocorticotropin hormone (ACTH) using disposable phenylboronic-modified electrochemical immunosensors. Biosens. Bioelectron. 2012, 35, 82–86. [Google Scholar] [CrossRef] [PubMed]
- Merola, G.; Martini, E.; Tomassetti, M.; Campanella, L.G. Simple and suitable immunosensor for β-lactam antibiotics analysis in real matrixes: Milk, serum, urine. J. Pharm. Biomed. 2015, 106, 186–196. [Google Scholar] [CrossRef] [PubMed]
- Liu, G.Z.; Guo, W.Q.; Song, D.D. A multianalyte electrochemical immunosensor based on patterned carbon nanotubes modified substrates for detection of pesticides. Biosens. Bioelectron. 2014, 52, 360–366. [Google Scholar] [CrossRef] [PubMed]
- Yang, T.; Wang, S.; Jin, H.L.; Bao, W.W.; Huang, S.M.; Wang, J.C. An electrochemical impedance sensor for the label-free ultrasensitive detection of interleukin-6 antigen. Sens. Actuators B Chem. 2013, 178, 310–315. [Google Scholar] [CrossRef]
- Wang, Y.L.; Li, X.J.; Cao, W.; Li, Y.Y.; Li, H.; Du, B.; Wei, Q. Ultrasensitive sandwich-type electrochemical immunosensor based on a novel signal amplification strategy using highly loaded toluidine blue/gold nanoparticles decorated KIT-6/carboxymethyl chitosan/ionic liquids as signal labels. Biosens. Bioelectron. 2014, 61, 618–624. [Google Scholar] [CrossRef] [PubMed]
- Ji, L.; Guo, Z.K.; Yan, T.; Ma, H.M.; Du, B.; Li, Y.Y.; Wei, Q. Ultrasensitive sandwich-type electrochemical immunosensor based on a novel signal amplification strategy using highly loaded palladium nanoparticles/carbon decorated magnetic microspheres as signal labels. Biosens. Bioelectron. 2015, 68, 757–762. [Google Scholar] [CrossRef] [PubMed]
- Liang, R.P.; Qiu, J.D.; Cai, P.X. A novel amperometric immunosensor based on three-dimensional sol gel network and nanoparticle self-assemble technique. Anal. Chim. Acta 2005, 534, 223–229. [Google Scholar] [CrossRef]
- Tang, J.Q.; Pang, G.C.; Gao, J.R.; Liang, X.Y. Development of Casein Immunosensor Modified by Chitosan and Nano-Gold. Food Sci. Biotechnol. 2010, 29, 533–553. [Google Scholar]
- Kang, S.; Kwok-Keung, S. Scanning tunneling microscopic and voltammetric studies of the surface structures of an electrochemically activated glassy carbon electrode. Anal. Chem. 2002, 74, 879–885. [Google Scholar]
- Nagaoka, T.; Yoshino, T. Surface properties of electrochemically pretreated glassy carbon. Anal. Chem. 1986, 58, 1037–1042. [Google Scholar] [CrossRef]
- Cavicchi, R.E.; Silsbee, R.H. Coulomb suppression of tunneling rate from small metal particles. Phys. Rev. Lett. 1984, 52, 1453–1456. [Google Scholar] [CrossRef]
- Ball, P.; Garwin, L. Science at the atomic scale. Nature 1992, 355, 761–766. [Google Scholar] [CrossRef]
- Pujol, M.L.; Cirimele, V.; Tritsch, P.J.; Villain, M.; Kintz, P. Evaluation of the IDS One-Step™ ELISA kits for the detection of illicit drugs in hair. Forensic Sci. Int. 2007, 170, 189–192. [Google Scholar] [CrossRef] [PubMed]
- Agius, R.; Nadulski, T.; Moore, M. Validation of LUCIO®-Direct-ELISA kits for the detection of drugs of abuse in urine: Application to the new German driving licenses re-granting guidelines. Forensic Sci. Int. 2012, 215, 38–45. [Google Scholar] [CrossRef] [PubMed]
- Park, M.; Kim, J.; Park, Y.; In, S.; Kim, E.; Park, Y. Quantitative determination of 11-nor-9-carboxy-tetrahydrocannabinol in hair by column switching LC-ESI-MS3. J. Chromatogr. 2014, 947–948, 179–185. [Google Scholar] [CrossRef] [PubMed]
- Khajuria, H.; Nayak, B.P. Detection of Δ9-tetrahydrocannabinol (THC) in hair using GC-MS. Egypt. J. Forensic Sci. 2014, 4, 17–20. [Google Scholar] [CrossRef]
- Zgair, A.; Wong, J.C.M.; Sabri, A.; Fischer, P.M.; Barrett, D.A.; Constantinescu, C.S.; Gershkovich, P. Development of a simple and sensitive HPLC–UV method for the simultaneous determination of cannabidiol and Δ9-tetrahydrocannabinol in rat plasma. J. Pharm. Biomed. 2015, 114, 145–151. [Google Scholar] [CrossRef] [PubMed]
- Brabanter, N.D.; Gansbeke, W.V.; Hooghe, F.; Eenoo, P.V. Fast quantification of 11-nor-Δ9-tetrahydrocannabinol-9-carboxylic acid (THCA) using microwave-accelerated derivatisation and gas chromatography–triple quadrupole mass spectrometry. Forensic Sci. Int. 2013, 224, 90–95. [Google Scholar] [CrossRef] [PubMed]
- Mohsen, Y.; Gharbi, N.; Lenouvel, A.; Guignard, C. Detection of Δ9-Tetrahydrocannabinol, Methamphetamine and Amphetamine in air at low ppb level using a Field Asymmetric Ion Mobility Spectrometry microchip sensor. Procedia Eng. 2014, 87, 536–539. [Google Scholar] [CrossRef]
- Cheng, H.L.; Tsai, Y.H.; Hsu, W.L.; Lin, Y.H. An on-line stacking capillary electrophoresis method for the analysis of Δ9-tetrahydrocannabinol and its metabolites. J. Chromatogr. A 2015, 1426, 226–232. [Google Scholar] [CrossRef] [PubMed]
- Saxberg, B.E.; Kowalski, B.R. Generalized Standard Addition Method. Anal. Chem. 1979, 51, 1031–1038. [Google Scholar] [CrossRef]
- Frens, G. Controlled nucleation for the regulation of the particle size in monodisperse gold suspensions. Nat. Phys. Sci. 1973, 241, 20–22. [Google Scholar] [CrossRef]
- Gerbino, L.; Riva, J.S.; Strumia, M.C.; Baruzzi, A.M. Thionine immobilized in crosslinked chitosan films. Sens. Actuators B 2008, 131, 455–461. [Google Scholar] [CrossRef]
- Kang, X.B.; Pang, G.C.; Liang, X.Y.; Wang, M.; Liu, J.; Zhu, W.M. Study on a hydrogen peroxide biosensor based on horseradish peroxidase/GNPs-thionine/chitosan. Electrochim. Acta 2012, 62, 327–334. [Google Scholar] [CrossRef]
- Kang, X.B.; Pang, G.C.; Chen, Q.S.; Liang, X.Y. Fabrication of Bacillus cereus electrochemical immunosensor based on double-layer gold nanoparticles and chitosan. Sens. Actuators B 2013, 177, 1010–1016. [Google Scholar] [CrossRef]
- Lu, D.Q.; Lu, F.P.; Pang, G.C. A novel glutathione-S transferase immunosensor based on horseradish peroxidase and double-layer gold nanoparticles. Biomed. Microdevices 2016, 18, 50. [Google Scholar]
- Sample Availability: Samples of the compounds tetrahydrocannabinol (THC) and anti-THC Balb/C mouse monoclonal antibody are available from the authors.


| Detection Method | Linear Range | LOD | Detection Time | Reference |
|---|---|---|---|---|
| One-StepTM-ELISA | 0.1–6.5 ng/mg | 0.1 ng/mg | ≈2 h | [31] |
| LUCIO®-Direct-ELISA | ≥10 ng/mL | 2.5 ng/mL | ≈2 h | [32] |
| LC-ESI-MS3 | 0.13–15.75 pg/mg | 0.05 pg/mg | [33] | |
| GC-MS | 0.16–2.3 ng/mg | 0.1 ng/mg | >1 h | [34] |
| HPLC-UV | 10–104 ng/mL | 10 ng/mL | >20 min | [35] |
| Microwave-Accelerated Derivatization and GC-MS | 5–100 ng/mL | 5 ng/mL | ≈30 min | [36] |
| Field Asymmetric Ion Mobility Spectrometry Microchip Sensor (FAIMS) | 6.5–40 ng/mg | 6.5 ng/mg | [37] | |
| On-Line Stacking Capillary Electrophoresis | 0.04–6 µg/ml | 10 ng/mL | [38] | |
| Electrochemical Nano Immunosensor | 0.01–103 ng/mL | 3.3 pg/ml | ≈10 min | This work |
| Initial THC Concentration in Sample (ng/mL) | Added THC Concentration (ng/mL) | Measured Concentration after Addition (ng/mL) | RSD (%, n = 5) | Recovery (%, n = 5) |
|---|---|---|---|---|
| 1 | 1 | 2.03, 2.12, 2.2, 2.07, 1.94 | 4.7 | 100.6 |
| 5 | 6.02, 5.97, 6.16, 6.24, 6.19 | 1.89 | 101.5 | |
| 10 | 10.98, 11.46, 10.92, 12.11, 11.07 | 4.38 | 98.2 |
© 2016 by the authors. Licensee MDPI, Basel, Switzerland. This article is an open access article distributed under the terms and conditions of the Creative Commons Attribution (CC-BY) license ( http://creativecommons.org/licenses/by/4.0/).
Share and Cite
Lu, D.; Lu, F.; Pang, G. A Novel Tetrahydrocannabinol Electrochemical Nano Immunosensor Based on Horseradish Peroxidase and Double-Layer Gold Nanoparticles. Molecules 2016, 21, 1377. https://doi.org/10.3390/molecules21101377
Lu D, Lu F, Pang G. A Novel Tetrahydrocannabinol Electrochemical Nano Immunosensor Based on Horseradish Peroxidase and Double-Layer Gold Nanoparticles. Molecules. 2016; 21(10):1377. https://doi.org/10.3390/molecules21101377
Chicago/Turabian StyleLu, Dingqiang, Fuping Lu, and Guangchang Pang. 2016. "A Novel Tetrahydrocannabinol Electrochemical Nano Immunosensor Based on Horseradish Peroxidase and Double-Layer Gold Nanoparticles" Molecules 21, no. 10: 1377. https://doi.org/10.3390/molecules21101377