Article

Functional Characterization of a Dihydroflavanol 4-Reductase from the Fiber of Upland Cotton (Gossypium hirsutum)

1
The State Key Laboratory of Plant Genomics, Institute of Microbiology, Chinese Academy of Sciences, Beijing 100101, China
2
Hunan Provincial Key Laboratory of Plant Resources Conservation and Utilization, College of Biology and Environmental Sciences, Jishou University, No. 120 Ren Min South Road, Jishou 416000, Hunan, China
*
Authors to whom correspondence should be addressed.
These authors contributed equally to this work.
Molecules 2016, 21(2), 32; https://doi.org/10.3390/molecules21020032
Submission received: 30 September 2015 / Revised: 10 December 2015 / Accepted: 21 December 2015 / Published: 26 January 2016
(This article belongs to the Special Issue Recent Advances in Plant Phenolics)

Abstract

:
Dihydroflavanol 4-reductase (DFR) is a key later enzyme involved in two polyphenols’ (anthocyanins and proanthocyanidins (PAs)) biosynthesis, however it is not characterized in cotton yet. In present reports, a DFR cDNA homolog (designated as GhDFR1) was cloned from developing fibers of upland cotton. Silencing GhDFR1 in cotton by virus-induced gene silencing led to significant decrease in accumulation of anthocyanins and PAs. More interestingly, based on LC-MS analysis, two PA monomers, (–)-epicatachin and (–)-epigallocatachin, remarkably decreased in content in fibers of GhDFR1-silenced plants, but two new monomers, (–)-catachin and (–)-gallocatachin were present compared to the control plants infected with empty vector. The ectopic expression of GhDFR1 in an Arabidopsis TT3 mutant allowed for reconstruction of PAs biosynthesis pathway and led to accumulation of PAs in seed coat. Taken together, these data demonstrate that GhDFR1 contributes to the biosynthesis of anthocyanins and PAs in cotton.

Graphical Abstract

1. Introduction

Dihydroflavanol 4-reductase (DFR, EC 1.1.1.219) is a NADPH-dependent oxidoreductase that is a key later enzyme involved in controlling flux into biosynthesis of anthocyanins and proanthocyanidins (PAs), which are two polyphenols [1]. DFR in plants catalyzes the transformation of three dihydroflavonols (dihydrokaempferol, dihydroqeretin, and dihydromyricetin) into the corresponding leucoanthocyanidins (leucopelargonidin, leucocyanidin, and leucodelphinidin), which are ultimately converted into anthocyanins or PAs (Figure 1) [2,3,4]. However, DFRs from some species like Petunia hybrida lack the ability to accept dihydrokaempferol as a substrate, so they cannot produce the pelargonidin-based anthocyanins and PAs [2]. To date, many studies have reported the biochemical and genetic characterization of DFR [1,5,6,7,8,9]. However, most of studies focused on the flower and fruit coloration involved in anthocyanin biosynthesis. Some evidences showed DFR in some plants can biosynthesize and accumulate PAs, which is possibly involved in increased resistance/tolerance to pathogens, insects, and herbivores [10].
Figure 1. Biosynthetic relationship of DFR to anthocyanins, flavan-3-ols, and proanthocyanidins. CHI: chalcone isomerase; F3H: (2S)-flavanone 3-hydroxylase; F3′H: flavonoid 3′-hydroxylase; F3′,5′H: flavonoid 3′,5′-hydroxylase; DFR: dihydroflavonolreductase; ANS: anthocyanidin synthase (also known as leucoanthocyanidin dioxygenase); LAR: leucoanthocyanidin reductase; ANR: anthocyanidin reductase.
Molecules 21 00032 g001
PAs, also known as condensed tannins (polyphenols), are oligomers or polymers of flavan-3-ols [11], widely producing in land plants such as ferns, gymnosperms, and angiosperms [12]. PAs are mainly found distributed in leaves, stems, fruits, roots and seed coats [12,13,14,15,16]. In general, PAs play multiple protective roles against pathogens, herbivores, and UV damage in plants [11,17,18]. Many studies further demonstrate that the structures and contents of PAs are associated with plants’ resistance/tolerance to pathogens, insects, and herbivores [17,19,20,21]. In addition, anthocyanins are a large group of flavonoid (polyphenols) that are ubiquitously present in plants, and provide red, blue, and purple flowers as well as colorful vascular tissues and fruits [22]. In general, anthocyanins help plants attract insects and animals for pollination and dissemination of seeds, as well as protecting them from UV-damage [23].
Cotton (Gossypium spp.) provides over 50% of the fibersused by the textile industry [24]. In the past decades, many breeding programs have worked to improve cotton resistance/tolerance to pathogens and insects, including transgenic Bt cotton [25]. PAs are known as a group of natural products that can protect plants against pathogens and insects [26]. Several studies reported cotton tissues produce PAs [27,28,29], but molecular breeding for PA-rich cotton cultivars still faces many obstacles blocks because the PA biosynthesis pathway in cotton remains unclear. In our previous studies, we characterized an anthocyanidin reductase (ANR) from upland cotton fiber, a key enzyme involved in PAs’ later biosynthesis steps [29]. To date, the steps of PAs biosynthesis before ANR in cotton need further to be elucidated.
We previously demonstrated that upland cotton produces PAs in many tissues in characterizing an ANR [29]. The evidence shows that DFR could be expressed in cotton, but it has not been characterized yet. In this study, we isolated a cDNA encoding a DFR isoenzyme from the fiber of upland cotton (designated as GhDFR1), and revealed the function of GhDFR1 by virus-induced gene silencing (VIGS) in cotton and recovering the phenotype of the TT3 mutant in Arabidopsis.

2. Results and Discussion

2.1. Cloning of DFR Gene from Fiber of G. hirsutum

Previously we characterized a cotton ANR protein which comes after DFR in the PA biosynthesis pathway. Here, we isolated a DFR cDNA from cotton fiber. Based on the available EST sequence of G. hirsutum, a pair of specific primers was designed to amplify and clone GhDFR1 from early development 9 DPA fiber. As a result, an approximately 1 kb in size cDNA fragment has been isolated by reverse transcript PCR. This cDNA fragment was subsequently cloned into a T-easy vector for sequencing. After sequencing, the sequence was composed 1068 nucleotides including start and stop codons which encodes 355 amino acids. The deduced amino acid sequence was analyzed by a blast search at NCBI. The results of alignment showed the amino acid sequence of GhDFR1 is similar to Citrus sinensis DFR (CsDFR) [30], possessing a high conservation at the glycine-rich Rossmann NADPH/NADH-binding domain, which is composed of G-X-X-G-F-X-G. In addition, amino acids from 143 to 172 were shown to be relevant for determining substrate specificity (Figure 2A). The phylogenetic analysis revealed that GhDFR1 and CsDFR were in the same clade (Figure 2B).
Semi-RT-PCR and quantitative real-time PCR (qPCR) have been performed to analyze the GhDFR1 expression profile in cotton. As shown in Figure 3A,B, GhDFR1 expressed in vascular tissues (stem and leaf) and both early (9DPA) and later (21 DPA) development fibers, but the expression level in vascular tissue is very low compared to fibers (Figure 3).

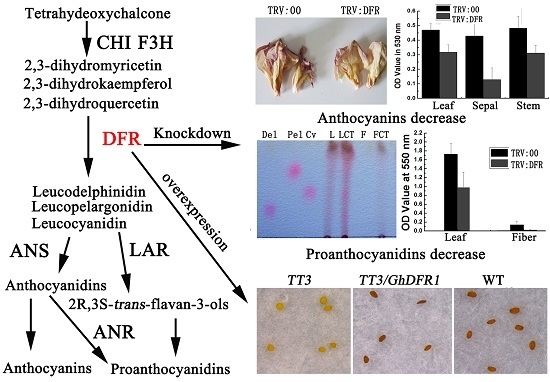
2.2. Silencing GhDFR1 Affected Flower Coloration and Content of Anthocyanins in Cotton Plants by VIGS

According to the VIGS system in G. hirsutum and G. barbadense that we recently developed [29,31], in this study, we silenced the GhDFR1 expression in cotton for analyzing its function. Partial fragments of GhDFR1 open reading frames were subcloned to generate a pYL156-GhDFR1 recombinant vector, which was then introduced into 10-day-old plants mediated by Agrobacterium tumefaciens GV 3101 strain. The GhDFR1-silenced plants and the control plants injected with A. tumefaciens GV 3101 containing empty vector pYL156 grew in the greenhouse until flowering. To investigate the silence efficiency of GhDFR1 in GhDFR1-silenced plants, qPCR was firstly employed to analyze the expression levels of this gene. As shown in Figure 4A, the GhDFR1 expression levels in GhDFR1-silenced plants were almost 50-folds lower than the control. The flowers of GhDFR1-silenced plants showed reduced reddish petal of 4 DPA compared to the control (Figure 4B). These results indicated that GhDFR1 affected anthocyanin biosynthesis in flowers of GhDFR1-silenced plants. To further investigate the decreased levels of anthocyanins in leaves, stems, and sepals, we extracted anthocyanins from these tissues using 50% acidic methanol. After removal of chlorophyll and other pigments by chloroform, the anthocyanin extracts from these three tissues of the control clearly showed a redder color than GhDFR1-silenced plants (Figure 4C). According to the absorbance at 530 nm measured by spectrophotometer, the OD values of leaf, stem, and sepal anthocyanin extracts of GhDFR1-silenced plants are significantly lower than those of the control (Figure 4D).

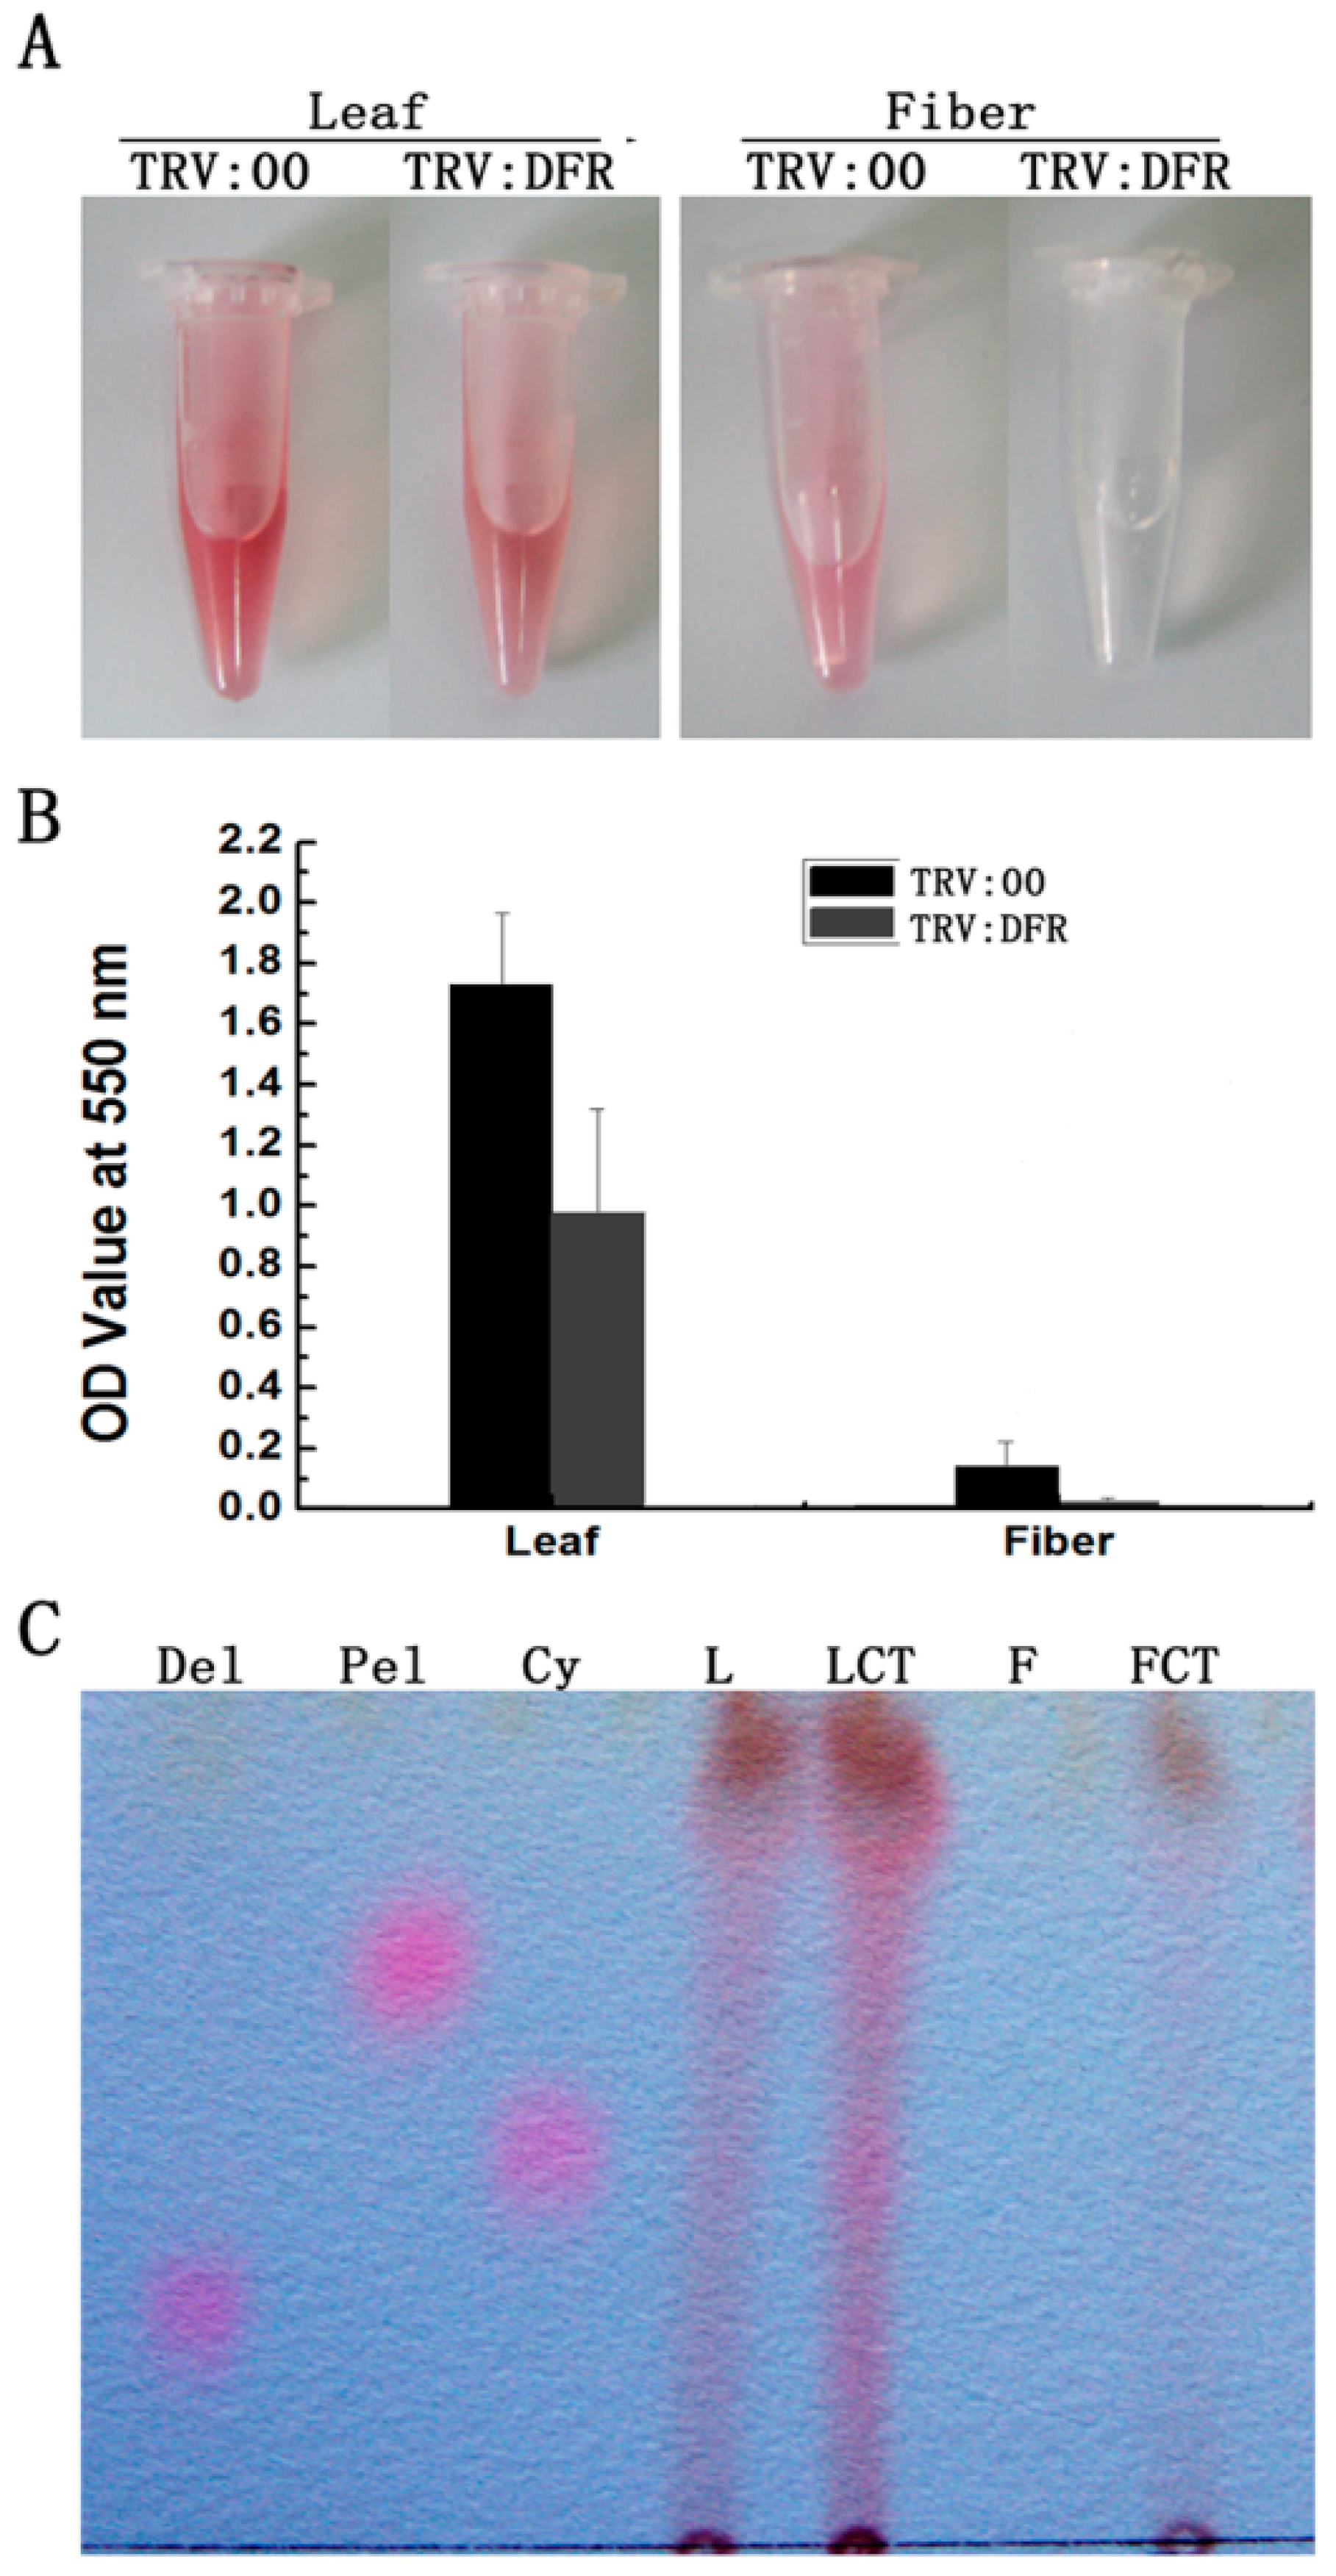
2.3. Silencing GhDFR1 Affected Structure and Content of PAs and Flavan-3-ols in Cotton Plants by VIGS

To investigate if silencing GhDFR1 affecting PA biosynthesis, PAs and flavan-3-ols from fibers and leaves of GhDFR1-silenced plants and the control were extracted. The extractions from leaves and fibers hydrolyzed by boiling butanol:HCl produced a reddish coloration, which resulted from PA-derived anthocynidins [32]. The intensity of reddish coloration of extractions from GhDFR1-silenced plant was lighter than the control (Figure 5A). Further absorbance measurements at 550 nm showed the OD values were significantly lower in extractions from GhDFR1-silenced plant tissues than from the control (Figure 5B). Compared to leaves, the OD values decreased more significantly in fibers.
Figure 2. A sequence alignment (A) and a phylogenetic tree (B) obtained from deduced amino acid sequences of DFR homologs. (A) An amino acid sequence alignment was obtained from 10 deduced DFR amino acid sequences that were aligned on NCBI; (B) An unrooted phylogenetic tree obtained from 14 sequences. “*”: the same amino acid in all 10 sequences; “:”: conserved amino acid residues; “.”: half conserved amino acid residues; “#######”: Rossmann domain GXXGXXG; the underline showed potential domain involved in DFR substrates specificity.
Molecules 21 00032 g002
Figure 3. GhDFR1 expression pattern in cotton. (A,B): Semi-RT-PCR (A) and qPCR (B) results show expression levels of GhDFR1 at stem and leaf tissues, and two points developing fiber in G. hirsutum. DPA: day after flower fiber; Actin: β-actin as reference gene.
Molecules 21 00032 g003
Figure 4. Tissue phenotypes after GhDFR1 knockdown in G. hirsutum by VIGS. (A) GhDFR1 expression levels in GhDFR1-silenced plants and the control by qPCR; (B) Petal phenotypes of GhDFR1-silenced plants and the control; (C) Comparison of red color from anthocyanin extracts from leaf, stem, and sepal of GhDFR1-silenced plants and the control; (D) Absorbance values of anthocyanin extracts from leaves, stems, and sepal of GhDFR1-silenced plants and the control.
Molecules 21 00032 g004
Figure 5. Comparison of PAs from GhDFR1-silenced plants and the control. (A) Color intensity derived from cleavage due to the butanol:HCl boiling of PAs; (B) Absorbance values of anthocyanidins resulting from PA cleavage at 550 nm; (C) TLC profiles showing anthocyanidins intensities from butanol:HCl cleaved PAs; Cy: cyanidin; Pel: pelargonidin; Del: delphinidin.
Molecules 21 00032 g005
Based on further analysis of the boiled extracts by TLC profiling, the results showed cyanidin, delphinidin, and pelargonidin produced from butanol:HCl boiling of PA extracts from GhDFR1-silenced plant tissues show remarkably lower coloration intensity compared to the control, indicating that the PA contents of these tissues were lower in GhDFR1-silenced plants than those in the control. Especially, fiber PA-derived anthocynidins were not observed in TLC profiling (Figure 5C). The structures and contents of flavan-3-ols (monomers of PAs, also polyphenols) were estimated by LC-MS analysis. The resulting data showed that four flavan-3-ols including (–)-catechin, (–)-epicatechin, (–)-gallocatechin, and (–)-epigallocatechin could be detected by LC-MS in leaf tissues of both GhDFR1-silenced plants and the control. However, the contents of these four flavan-3-ols did not differ significantly between GhDFR1-silenced plants and the control, possibly due to low expression level of GhDFR1 in leaf (Figure 6A,B). Interestingly, (–)-epicatechin and (–)-epigallocatechin had been detected in fiber of the control, but in GhDFR1-silenced plants, (–)-catechin, (–)-epicatechin, and (–)-gallocatechin were measured. (–)-Epigallocatechin was only present in the control, (–)-catechin and (–)-gallocatechin were only detected in GhDFR1-silenced plants. Of these flavan-3-ols, (–)-epicatechin contents of fiber of GhDFR1-silenced plants decreased significantly compared to the control (Figure 6C).
Figure 6. LC-MS-based profiling determines the flavan-3-ols from leaves and fibers of GhDFR1-silenced plants and the control in MRM mode. (A) Authentic standards of four flavan-3-ols in in m/z 305→125 [M − H] transition and m/z 289→109 [M − H] transition; (B,C) flavan-3-ols from leaves (B) and fibers (C) of GhDFR1-silenced plants and the control. CA: (–)-catechin; EP: (–)-epicatechin; GC: (–)-gallocatechin; EGC: (–)-epigallocatechin.
Molecules 21 00032 g006

2.4. Overexpression of GhDFR1 Gene in Arabidopsis thaliana TT3 Mutant

The A. thaliana TT3 mutant is characterized by knockout of DFR, leading to a lack of flavan-3-ols and PAs in the seed coat, which consequently shows a white coloration, lacking the brown which results from oxidation of PAs and flavan-3-ols [6]. To investigate GhDFR1 function in plants, it was ectopically expressed in A. thaliana TT3 mutant. Using of a flower dip transformation method, transgenic GhDFR1 plants were obtained. The coloration of T1 GhDFR1 transgenic seeds showed deep brown coloration similar to that of wild type seeds (Figure 7). This result indicated the overexpression of GhDFR1 in TT3 mutant reconstructed the mutated PAs biosynthesis pathway.
Figure 7. Ectopic expression of GhDFR1 in an Arabidopsis thaliana TT3 mutant. Seed coloration of TT3 mutant, ectopically expression GhDFR1, and Columbia wild-type plants.
Molecules 21 00032 g007

2.5. Discussion

DFR is a key enzyme to control the biosynthesis of at least two groups of flavonoids—anthocyanins and PAs—which provide plant pigments and resistance/tolerance to many biotic and abiotic stresses, respectively. In the past decades, many studies have focused on DFR’s functions due to its contribution to the coloration of flowers [1,2,7,8,9]. Some reports showed that DFR was involved in the biosynthesis of PAs participating in plant responses to abiotic and biotic stresses [10,33]. For instance, DFR gene was strongly induced in Populus tremuloides damaged by insect herbivores or treated with methyl jasmonate, leading to an accumulation of PAs [10]. DFRs from Brassica rapa showed responses to cold and freezing stress treatments [33]. Especially, PAs had been shown to limit the pest growth due to nutrition indigestion [34,35]. In cotton, a major goal of breeding is resistance/tolerance to pests to decrease the tremendous yield losses caused by pests [24]. Therefore, breeding of PAs-rich cultivars should be a considerable strategy through some candidate genes including GhDFR1.
In this study, knock-down of GhDFR1 expression in GhDFR1-silenced plants, only 2% of the control (Figure 4A), led to decreased anthocyanins in leaves, sepals, stems and flowers. Analysis of butanol:HCl boiling of methanol extracts indicated that the PA monomers from fibers and leave tissues decreased in GhDFR1-silenced plants. In addition, the TLC profile of PA-derived anthocyanidins showed three anthocyanidins are reduced in GhDFR1-silenced plants, which demonstrates GhDFR1 can accept three substrates. PAs biosynthesis was reconstructed in an A. thaliana TT3 mutant by the ectopic expression of GhDFR. Taken together, the results demonstrate that the GhDFR1 makes a great contribution to the biosyntheses of PAs and anthocyanins in cotton.
In this present study, according to an LC-MS assay, the flavan-3-ols showed similar contents in leaves between GhDFR1-silenced plants and the control, probably due to the low expression level of GhDFR1 in leaves. Interestingly, in fibers, the flavan-3-ols showed different structures and concentrations. (–)-Epicgallocatechin was not present in GhDFR1-silenced plants, but the contents of (–)-catechin and (–)-gallocatechin were increased significantly compared with the control. However, this metabolic shift of flavan-3-ol structures still need to be further investigated.

3. Experimental Section

3.1. Plant Materials

Seeds of G. hirsutum cultivar TM-1 were germinated and grown in a greenhouse. After two week growth at 25 °C and 16/8 h light/dark, seedlings from cotyledon expansion to 4th true leaf emergence were used for VIGS assay. After infection, the GhDFR1-silenced plants were growth in a greenhouse under the same conditions described before. After flowering, the developing fiber, leaves, stems, petals, and sepal were collected for further semi-RT-PCR, qPCR, PA, and anthocyanin assays.

3.2. Total RNA Extract, Semi-RT-PCR, and qPCR

Total RNA of different tissues were extracted by using Plant Total RNA Isolation Kits (Sangon, Shanghai, China). One microgram DNA-free RNA from G. hirsutum young leaf, stem, and developing fiber were reverse transcribed by using BluePrint 1st strand cDNA Synthesis Kit (Takara, Dalian, China) following the manufacturer’s protocol. Semi-RT-PCR was controlled by PCR using 1 μL cDNA in a 25 μL reaction with beta-Actin primers. In this study, 25 cycles of PCR amplification were performed for beta-Actin and 30 cycles were performed for the GhDFR1. PCR products were analyzed by 1% agarose electrophoresis. A pair of primers, the forward primer 5′-CAGATTTAGCTGAAGAGGGAAG-3′, and the reverse primer 5′-GCTCTGCCATTGTCTTGGAG-3′, was designed based on the G. hirsutum DFR gene EST sequence. The qPCR was performed with the SYBR Premix Ex Taq kit (Takara) according to the manufacturer’s guidelines. All PCR were run with three technical replicates and three biological replicates on an IQ5 multicolor detection system (Bio-Rad, Hercules, CA, USA). GhDFR1 gene expression was calculated using the ddCt algorithm. To normalize gene expression, beta-Actin was used as an internal standard. The specific primers of GhDFR1 and Actin genes are designed to use qPCR analysis, which are the primer pairs of GhDFR1 (5′-TGCCAACTGATAATCAAATG-3′ and 5′-TGAGCCATGAACCAATGAAC-3′) and Actin (5′-TTACTCAGTATTGTAAAAGATGGCC-3′ and 5′-AGCATCATCACCAGCAAAAC-3′).

3.3. Cloning of GhDFR1 from G. hirsutum

A pair of primers for clone GhDFR1 complete open reading frame, the forward primer 5′-ATGCCAACTGATAATCAAATG-3′ containing start codon, and the reverse primer 5′-TCAGTCTATGTTTTTGATCT-3′ containing stop codon, was designed based on G. hirsutum DFR gene EST sequence. One microgram DNA-free RNA from G. hirsutum young fiber tissue were reverse transcribed by using BluePrint 1st strand cDNA Synthesis Kit (Takara) following the manufacturer’s protocol. The follow PCR thermo cycles was carried out using Ex-taq DNA polymerase (Takara) at 94 °C for 5 min, 30 cycles of 94 °C for 30 s, 60 °C for 30 s, and 72 °C for 45 s; followed by a 10 min extension at 72 °C. After gel purification, the PCR products were subcloned into a T-easy vector (Promega, Madison, WI, USA) for sequencing.

3.4. VIGS Mediated by Agrobacterium

Seeds of G. hirsutum cultivar TM-1 were germinated and grown in the greenhouse. Seedlings from cotyledon expansion to 4th true leaf emergence were used for VIGS assay. The pYL156-DFR1 was constructed as described before [31]. The pTRV-RNA1, pYL-156-DFR1, and pYL-156 (empty vector) were transformed into A. tumefaciens strains GV3101 by electroporation, respectively.
Agrobacteria were grown overnight at 28 °C, 180 rpm in LB medium containing 50 μg/mL kanamycin, 25 μg/mL gentamicin, 10 mM MES, and 20 μM acetosyringone. The cells were collected by 4000 rpm centrifugation at room temperature for 10 min, and resuspended in MMA (10 mM MES, 10 mM MgCl2, 200 μM acetosyringone) solution to a final OD600 of 1.5. The suspensions were incubated at room temperature for 3 h. Agrobacteria containing pTRV-RNA1 and pYL156-DFR1 or pYL-156 were mixed at ratio 1:1, and infiltrated into fully expanded cotyledons by using needleless syringe.

3.5. Extraction and Assay of Anthocyanins

One hundred mg of fresh material was ground to a fine powder in liquid nitrogen, which was transferred into 1.5 mL tube. 0.5% HCl in 50% methanol (1 mL) was added and allowed to incubate in room temperature for 30 min. The tubes were centrifuged at 10,000 rpm for 10 min, and the liquid phase was transferred into a new tube. Chloroform (0.2 mL) was added in tube, which was vortexed for 30 s and shortly centrifuged to remove the chloroform phase. This step was repeated twice to remove the chlorophyll completely. The concentration of anthocyanins in rough extracts was measured by recording absorbance at 530 nm by UV-spectrum.

3.6. Extraction of the Soluble PAs

All of steps were performed in room temperature. One hundred mg of fresh material was ground to a fine powder by liquid nitrogen and transferred into a 1.5 mL tube. Acetone (1 mL) was added into the 1.5 mL tube immediately. Tubes were vortexed for 30 s, and centrifuged at 6000 rpm for 3 min, and acetone phase was transferred into a new 5 mL tube. After repeating this sequence twice, the acetone phases were combined, followed by vacuum drying to completely remove the acetone. To the residue milliQ water (500 μL) and chloroform (200 μL) were added, and tube was vortexed for 30 s, then briefly centrifuged to remove the chloroform phase. This step was repeated twice to remove chlorophyll completely. Ethyl acetate (500 μL) was added to the water phase, the tube was vortexed for 30 s and briefly centrifuged, and then the ethyl acetate phase was transferred to a new tube. After repeating twice the ethyl acetate phases were combined and vacuum dried to remove the ethyl acetate. The residue was dissolved in 100 μL methanol.

3.7. PAs Hydrolysis and TLC Assay

Each 50 µL PAs extraction was mixed with 950 µL butanol:HCl (95:5, v/v) and the mixture was then boiled for 1 h. After cooling to approximately room temperature, A 550 nm OD value of each sample was measured by spectrophotometry (Shimadzu, Tokyo, Japan). After the measurement, samples dried by rotary evaporator and then resuspended in 50 µL 0.1% HCl methanol. Ten µL were loaded for the TLC assays. The TLC plates used were cellulose F-200 µM chromatography layer. The eluting solvent system consisted of hydrochloric acid–acetic acid–water (3:30:10, v/v). Authentic standards of pelargonidin chloride, cyanidin chloride and delphinidin chloride (Sigma, St. Louis, MO, USA) were loaded as references.

3.8. LC-MS Analysis of Flavan-3-ols

The LC-MS analysis was carried out on an AB SCIEX QTRAP 4500 system (AB SCIEX, Foster, CA, USA). In brief, metabolites were separated on an Eetend-C18 (2.1 mm × 100 mm, 3.5 μm) reverse phase column. The elution solvent system composed of 0.1% formic acid (solvent A) and acetonitrile (solvent B). A gradient program composed of different ratios of solvent A to solvent B was developed to elute metabolites. The program consisted of 95:5 to 0:100 (0–12 min), 0:100 (12–18 min), 0:100 to 95:5 (18–19 min), 95:5 (19–24 min). The injection volume of methanol extraction was set at 5 μL. The flow rate was set at 400 μL/min. The authentic standards (–)-catechin, (–)-epicatechin, (–)-gallocatechin, and (–)-epigallocatechin (Sigma) were injected as quality control. Four potential flavan-3-ols were detected at 280 nm. The separated metabolites were followed by MS analyses conducted in negative-ion mode. The operating parameters were optimized as follows: collision gas (CUR): 20.0; collision gas (CAD): medium; IonSpray voltage (IS): −4500.0; temperature: 500.0 °C; ion source gas 1 (GS1): 55.0; ion source gas 2 (GS2): 55.0; declustering potential (DP): −90.0; entrance potential (EP): −10.0; collision energy (CE): −30.0; collision cell exit potential (CXE): −18.0. Ion detection was performed in multiple reaction monitoring (MRM) mode where in m/z 305→125 [M − H] transition for (–)-gallocatechin and (–)-epigallocatechin and m/z 289→109 [M − H] transition for (–)-catechin and (–)-epicatechin.

3.9. Overexpression of GhDFR1 in A. thaliana TT3 Mutant

To further characterize the function of GhDFR1, we cloned its ORF immediately downstream of the 35S promoter in the T-DNA of pBI121 binary vector by replacing the GUS reporter gene. The recombinant vector pBI121-GhDFR1 was introduced into A. tumefaciens strain EHA 105 by electroporation using a micropulser apparatus (411BR 0454, Bio-Rad). The A. thaliana TT3 mutant was purchased from SALK (SALK ID: CS2114). Seed germination and seeding growth followed the standard Arabidopsis growth protocol. Genetic transformation followed the floral dipping transformation protocol [36]. The growth of infected plants and seed harvesting followed the same protocol as previous reported [29,32]. Under the standard growth conditions, T1 plants begun to develop flowers about 60 days after seed germination. Wild type (Columbia ectype) and TT3 mutant plants were grown as controls. The mature seeds were collected for photographs.

Acknowledgments

This study was supported by grants from the National Natural Science Foundation of China (31471544), the State Key Laboratory of Cotton Biology Open Fund (CB2015B02) and the National Basic Research Priorities Program (Grant No. U1303281).

Author Contributions

J.-H.W. and G.-X.X. designed the experiment, analyzed data and revised the manuscript. L.W., Y.Z., Y.W., and Q.-Z.P. performed analysis, analyzed data and wrote manuscript. P.W. and Q.F. grew plants, prepared samples for analysis.

Conflicts of Interest

The authors declare no conflict of interest.

References

  1. Xie, D.Y.; Jackson, L.A.; Cooper, J.D.; Ferreira, D.; Paiva, N.L. Molecular and biochemical analysis of two cdna clones encoding dihydroflavonol-4-reductase from medicago truncatula. Plant Physiol. 2004, 134, 979–994. [Google Scholar] [CrossRef] [PubMed]
  2. Meyer, P.; Heidmann, I.; Forkmann, G.; Saedler, H. A new petunia flower color generated by transformation of a mutant with a maize gene. Nature 1987, 330, 677–678. [Google Scholar] [CrossRef] [PubMed]
  3. Johnson, E.T.; Ryu, S.; Yi, H.K.; Shin, B.; Cheong, H.; Choi, G. Alteration of a single amino acid changes the substrate specificity of dihydroflavonol 4-reductase. Plant J. 2001, 25, 325–333. [Google Scholar] [CrossRef] [PubMed]
  4. Johnson, E.T.; Yi, H.; Shin, B.; Oh, B.J.; Cheong, H.; Choi, G. Cymbidium hybrida dihydroflavonol 4-reductase does not efficiently reduce dihydrokaempferol to produce orange pelargonidin-type anthocyanins. Plant J. 1999, 19, 81–85. [Google Scholar] [CrossRef] [PubMed]
  5. Kristiansen, K.N.; Rohde, W. Structure of the hordeum-vulgare gene encoding dihydroflavonol-4-reductase and molecular analysis of ant18 mutants blocked in flavonoid synthesis. Mol. Genet. Genom. 1991, 230, 49–59. [Google Scholar] [CrossRef]
  6. Shirley, B.W.; Hanley, S.; Goodman, H.M. Effects of ionizing radiation on a plant genome: Analysis of two arabidopsis transparent testa mutations. Plant Cell 1992, 4, 333–347. [Google Scholar] [CrossRef] [PubMed]
  7. Bonguebartelsman, M.; Oneill, S.D.; Tong, Y.S.; Yoder, J.I. Characterization of the gene encoding dihydroflavonol 4-reductase in tomato. Gene 1994, 138, 153–157. [Google Scholar] [CrossRef]
  8. Gosch, C.; Nagesh, K.M.; Thill, J.; Miosic, S.; Plaschil, S.; Milosevic, M.; Olbricht, K.; Ejaz, S.; Rompel, A.; Stich, K.; et al. Isolation of dihydroflavonol 4-reductase cdna clones from Angelonia x angustifolia and heterologous expression as gst fusion protein in Escherichia coli. PLoS ONE 2014, 9, e107755. [Google Scholar] [CrossRef] [PubMed]
  9. Miosic, S.; Thill, J.; Milosevic, M.; Gosch, C.; Pober, S.; Molitor, C.; Ejaz, S.; Rompel, A.; Stich, K.; Halbwirth, H. Dihydroflavonol 4-reductase genes encode enzymes with contrasting substrate specificity and show divergent gene expression profiles in fragaria species. PLoS ONE 2014, 9, e112707. [Google Scholar] [CrossRef] [PubMed]
  10. Peters, D.J.; Constabel, C.P. Molecular analysis of herbivore-induced condensed tannin synthesis: Cloning and expression of dihydroflavonol reductase from trembling aspen (Populus tremuloides). Plant J. 2002, 32, 701–712. [Google Scholar] [CrossRef]
  11. Xie, D.Y.; Dixon, R.A. Proanthocyanidin biosynthesis—Still more questions than answers? Phytochemistry 2005, 66, 2127–2144. [Google Scholar] [CrossRef] [PubMed]
  12. Peng, Q.Z.; Zhu, Y.; Liu, Z.; Du, C.; Li, K.G.; Xie, D.Y. An integrated approach to demonstrating the anr pathway of proanthocyanidin biosynthesis in plants. Planta 2012, 236, 901–918. [Google Scholar] [CrossRef] [PubMed]
  13. Lin, H.C.; Lee, S.S. Proanthocyanidins from the leaves of machilus philippinensis. J. Nat. Prod. 2010, 73, 1375–1380. [Google Scholar] [CrossRef] [PubMed]
  14. Mole, S. The systematic distribution of tannins in the leaves of angiosperms—A tool for ecological-studies. Biochem. Syst. Ecol. 1993, 21, 833–846. [Google Scholar] [CrossRef]
  15. Hayasaka, Y.; Waters, E.J.; Cheynier, V.; Herderich, M.J.; Vidal, S. Characterization of proanthocyanidins in grape seeds using electrospray mass spectrometry. Rapid Commun. Mass Spectrom. 2003, 17, 9–16. [Google Scholar] [CrossRef] [PubMed]
  16. Prasad, D. Two a-type proanthocyanidins from prunus armeniaca roots. Fitoterapia 2000, 71, 245–253. [Google Scholar] [CrossRef]
  17. Dixon, R.A.; Xie, D.Y.; Sharma, S.B. Proanthocyanidins—A final frontier in flavonoid research? New Phytol. 2005, 165, 9–28. [Google Scholar] [CrossRef] [PubMed]
  18. Mellway, R.D.; Tran, L.T.; Prouse, M.B.; Campbell, M.M.; Constabel, C.P. The wound-, pathogen-, and ultraviolet B-responsive MYB134 gene encodes an R2R3 MYB transcription factor that regulates proanthocyanidin synthesis in poplar. Plant Physiol. 2009, 150, 924–941. [Google Scholar] [CrossRef] [PubMed]
  19. Ayres, M.P.; Clausen, T.P.; MacLean, S.F.; Redman, A.M.; Reichardt, P.B. Diversity of structure and antiherbivore activity in condensed tannins. Ecology 1997, 78, 1696–1712. [Google Scholar] [CrossRef]
  20. Forkner, R.E.; Marquis, R.J.; Lill, J.T. Feeny revisited: Condensed tannins as anti-herbivore defences in leaf-chewing herbivore communities of quercus. Ecol. Entomol. 2004, 29, 174–187. [Google Scholar] [CrossRef]
  21. Pilu, R.; Cassani, E.; Sirizzotti, A.; Petroni, K.; Tonelli, C. Effect of flavonoid pigments on the accumulation of fumonisin b1 in the maize kernel. J. Appl. Genet. 2011, 52, 145–152. [Google Scholar] [CrossRef] [PubMed]
  22. Wang, L.S.; Stoner, G.D. Anthocyanins and their role in cancer prevention. Cancer Lett. 2008, 269, 281–290. [Google Scholar] [CrossRef] [PubMed]
  23. Pandey, N.; Pandey-Rai, S. Modulations of physiological responses and possible involvement of defense-related secondary metabolites in acclimation of artemisia annua l. Against short-term uv-b radiation. Planta 2014, 240, 611–627. [Google Scholar] [CrossRef] [PubMed]
  24. Hagenbucher, S.; Olson, D.M.; Ruberson, J.R.; Wackers, F.L.; Romeis, J. Resistance mechanisms against arthropod herbivores in cotton and their interactions with natural enemies. Crit. Rev. Plant Sci. 2013, 32, 458–482. [Google Scholar] [CrossRef]
  25. Mascarenhas, R.N.; Boethel, D.J.; Leonard, B.R.; Boyd, M.L.; Clemens, C.G. Resistance monitoring to Bacillus thuringiensis insecticides for soybean loopers (Lepidoptera: Noctuidae) collected from soybean and transgenic bt-cotton. J. Econ. Entomol. 1998, 91, 1044–1050. [Google Scholar] [CrossRef]
  26. Smith, C.W.; Mccarty, J.C.; Altamarino, T.P.; Lege, K.E.; Schuster, M.F.; Phillips, J.R.; Lopez, J.D. Condensed tannins in cotton and bollworm-budworm (Lepidoptera: Noctuidae) resistance. J. Econ. Entomol. 1992, 85, 2211–2217. [Google Scholar] [CrossRef]
  27. Hanny, B.W. Gossypol, flavonoid, and condensed tannin content of cream and yellow anthers of 5 cotton (Gossypium hirsutum L.) cultivars. J. Agric. Food Chem. 1980, 28, 504–506. [Google Scholar] [CrossRef]
  28. Lane, H.C.; Schuster, M.F. Condensed tannins of cotton leaves. Phytochemistry 1981, 20, 425–427. [Google Scholar] [CrossRef]
  29. Zhu, Y.; Wang, H.Y.; Peng, Q.Z.; Tang, Y.T.; Xia, G.X.; Wu, J.H.; Xie, D.Y. Functional characterization of an anthocyanidin reductase gene from the fibers of upland cotton (Gossypium hirsutum). Planta 2015, 241, 1075–1089. [Google Scholar] [CrossRef] [PubMed]
  30. Lo Piero, A.R.; Puglisi, I.; Petrone, G. Gene characterization, analysis of expression and in vitro synthesis of dihydroflavonol 4-reductase from [Citrus sinensis (L.) osbeck]. Phytochemistry 2006, 67, 684–695. [Google Scholar] [CrossRef] [PubMed]
  31. Pang, J.H.; Zhu, Y.; Li, Q.; Liu, J.Z.; Tian, Y.C.; Liu, Y.L.; Wu, J.H. Development of agrobacterium-mediated virus-induced gene silencing and performance evaluation of four marker genes in gossypium barbadense. PLoS ONE 2013, 8, e73211. [Google Scholar] [CrossRef] [PubMed]
  32. Zhu, Y.; Peng, Q.Z.; Du, C.; Li, K.G.; Xie, D.Y. Characterization of flavan-3-ols and expression of myb and late pathway genes involved in proanthocyanidin biosynthesis in foliage of vitis bellula. Metabolites 2013, 3, 185–203. [Google Scholar] [CrossRef] [PubMed]
  33. Ahmed, N.U.; Park, J.I.; Jung, H.J.; Yang, T.J.; Hur, Y.; Nou, I.S. Characterization of dihydroflavonol 4-reductase (DFR) genes and their association with cold and freezing stress in brassica rapa. Gene 2014, 550, 46–55. [Google Scholar] [CrossRef] [PubMed]
  34. Bernays, E.A. Plant tannins and insect herbivores—An appraisal. Ecol. Entomol. 1981, 6, 353–360. [Google Scholar] [CrossRef]
  35. Mole, S.; Rogler, J.C.; Morell, C.J.; Butler, L.G. Herbivore growth reduction by tannins—Use of waldbauer ratio techniques and manipulation of salivary protein-production to elucidate mechanisms of action. Biochem. Syst. Ecol. 1990, 18, 183–197. [Google Scholar] [CrossRef]
  36. Clough, S.J.; Bent, A.F. Floral dip: A simplified method for agrobacterium-mediated transformation of arabidopsis thaliana. Plant J. 1998, 16, 735–743. [Google Scholar] [CrossRef] [PubMed]
  • Sample Availability: Samples of compounds are available from the authors.

