Article

Assessing and Broadening Genetic Diversity of Elymus sibiricus Germplasm for the Improvement of Seed Shattering

The State Key Laboratory of Grassland Agro-ecosystems, College of Pastoral Agriculture Science and Technology, Lanzhou University, Lanzhou 730020, China
*
Authors to whom correspondence should be addressed.
Molecules 2016, 21(7), 869; https://doi.org/10.3390/molecules21070869
Submission received: 12 May 2016 / Revised: 14 June 2016 / Accepted: 27 June 2016 / Published: 1 July 2016
(This article belongs to the Section Molecular Diversity)

Abstract

:
Siberian wild rye (Elymus sibiricus L.) is an important native grass in the Qinghai-Tibet Plateau of China. It is difficult to grow for commercial seed production, since seed shattering causes yield losses during harvest. Assessing the genetic diversity and relationships among germplasm from its primary distribution area contributes to evaluating the potential for its utilization as a gene pool to improve the desired agronomic traits. In the study, 40 EST-SSR primers were used to assess the genetic diversity and population structure of 36 E. sibiricus accessions with variation of seed shattering. A total of 380 bands were generated, with an average of 9.5 bands per primer. The polymorphic information content (PIC) ranged from 0.23 to 0.50. The percentage of polymorphic bands (P) for the species was 87.11%, suggesting a high degree of genetic diversity. Based on population structure analysis, four groups were formed, similar to results of principal coordinate analysis (PCoA). The molecular variance analysis (AMOVA) revealed the majority of genetic variation occurred within geographical regions (83.40%). Two genotypes from Y1005 and ZhN06 were used to generate seven F1 hybrids. The molecular and morphological diversity analysis of F1 population revealed rich genetic variation and high level of seed shattering variation in F1 population, resulting in significant improvement of the genetic base and desired agronomic traits.

1. Introduction

Elymus sibiricus L., commonly known as siberian wildrye, is a perennial, cold-season, self-pollinating, and allotetraploid grass with the StStHH genome constitution (2n = 28) [1]. Indigenous to northern Asia, E. sibiricus germplasm are especially rich and diverse in north China, where it is distributed primarily in Qinghai-Tibet Plateau, Inner Mongolia, Sichuan, Xinjiang, and Gansu Provinces [2]. E. sibiricus has been widely grown for pasture and hay, owing to its excellent stress tolerance, good forage quality and adaptability to local environments, and it therefore plays an important role in animal husbandry and sustenance in North China [3].
As an economically important species, E. sibiricus is difficult to grow for commercial seed production since seed shattering can cause up to 80% yield losses if harvesting is delayed [4]. The provinces of Qinghai and Sichuan, China, where the majority of E. sibiricus seed (2,400,000 kg) is produced each year, accounts for over 90% of total seed yield. However, the average seed production of E. sibiricus is only 690 kg∙ha−1 (China Grass Internet). To reduce seed shattering and enhance seed production, one of the most important approaches is to explore genetic diversity.
Morphologically and genetically diverse germplasm is a potentially valuable source for the improvement of desired agronomic traits such as seed yield, quality and stress tolerance [5]. To broaden the genetic base of E. sibiricus germplasm, one important strategy is to develop novel breeding lines by using genetically and phenotypically diverse germplasm to cross with the adapted cultivars. Generally, these resynthesized breeding lines are genetically diverse from inbred line/cultivar [6], and hybrids from two parents with distant genetic base might have higher heterosis [7]. Recent research has revealed wide variation in seed shattering among wild E. sibiricus germplasm from Qinghai-Tibet Plateau [2,8] and suggested these wild germplasm have great potential for the improvement of seed shattering. Additionally, a previous report showed that genetic distance between germplasm can be a predictor of combining ability [9]. It is, therefore, important to study the genetic diversity of E. sibiriucs germplasm with variation of seed shattering from its primary distribution area for improving our understanding of breeding materials and developing more efficient conservation and breeding strategies.
The development of neutral molecular markers has made it fast, reliable and accurate to reveal the genetic diversity of germplasm. Compared with other molecular markers like inter simple sequence repeat (ISSR), sequence-related amplified polymorphism (SRAP), and start codon targeted (SCoT) etc, EST-SSRs are highly polymorphic, abundant and are accessible to research in laboratories via published primers sequences. What is more, EST-SSRs have a higher level of transferability across related species than genomic-SSRs because EST-SSRs originate from the transcribed regions in genomes and possess conserved sequences among homologous genes [5]. Along with the development of next-generation sequencing, transcriptome sequencing has also become an efficient method to identify large EST sequences and develop EST-SSR markers [10]. To date, EST-SSRs have been widely used for genetic diversity [11], genetic mapping [12], and DNA fingerprinting [13].
The pattern of genetic variability of the available germplasm substantially affects the choice of breeding materials and the success of plant breeding programs. The objectives of the present study were to (i) compare the genetic diversity and relationship among E. sibiriucs accessions from North China; (ii) broaden the genetic diversity of E. sibiricus by crossing two genetically and morphologically diverse genotypes and assess genetic variation of the hybrid population.

2. Results

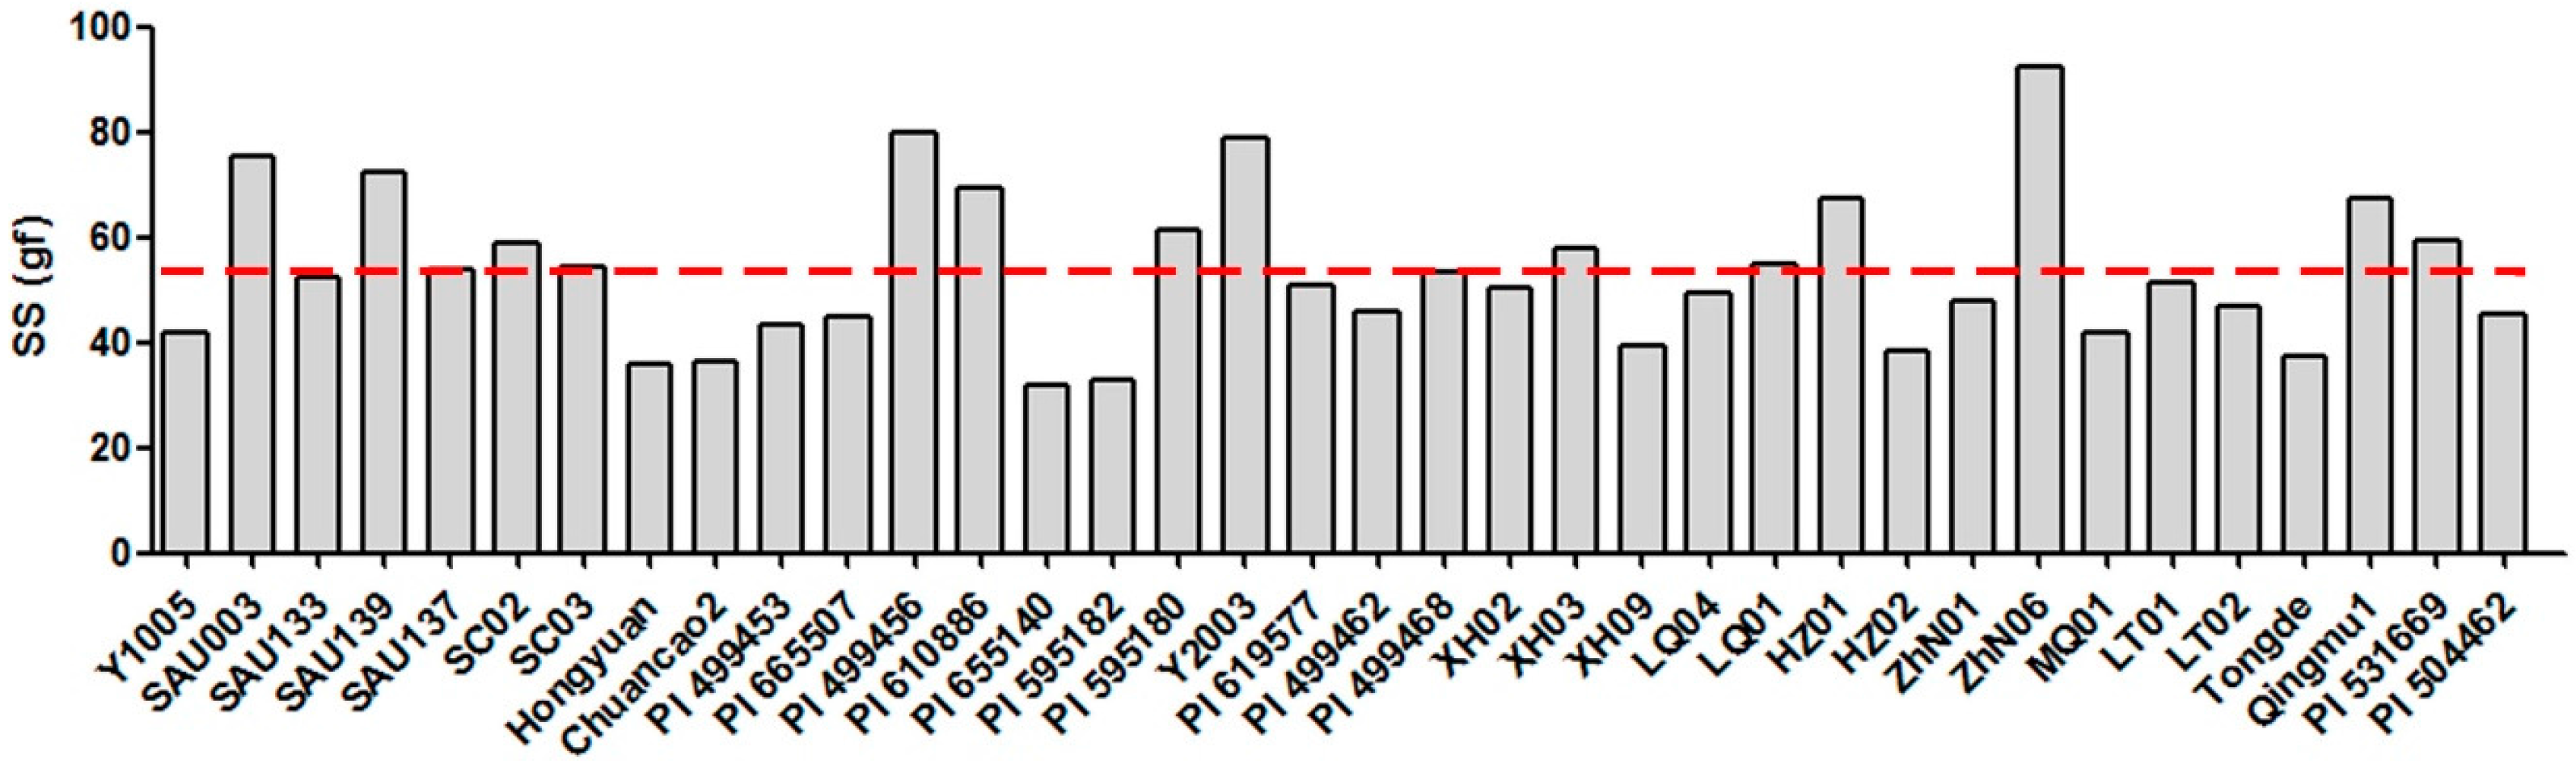
2.1. Seed Shattering Degree of 36 E. sibiricus Accessions

The BTS value among 36 E. sibiricus accessions varied from 31.86 gf (PI655140) to 92.34 gf (ZhN06), with an average of 53.28 gf. Sixteen accessions had a relatively low seed shattering degree with BTS more than the average value of seven accessions including four wild accessions (PI655140, PI595182, HZ02 and XH09) and three cultivars (Hongyuan, Chuancao2 and Tongde) had a relatively high seed shattering degree with the BTS value of less than 40 gf. The other 13 accessions had a moderate seed shattering degree (Figure 1).

2.2. Polymorphism of EST-SSR Markers and Genetic Relationships of 36 E. sibiricus Accessions

Furthermore, we analyzed the genetic diversity and variation of 36 E. sibiricus accessions with variation of seed shattering degree (Table 1). One hundred EST-SSR primers selected from Elymus, Pseudoroegneria and Leymus EST database, and 112 novel E. sibiricus EST-SSR markers developed by transcriptome sequencing were chosen to conduct the primers′ screening. Finally, 40 EST-SSR primers that successfully amplified clear and stable bands were selected to evaluate the genetic diversity of these 36 accessions (Table 2). The 40 primers generated 380 bands, 331 of which were polymorphic. The percentage of polymorphism (P) was 87.11%. The total bands (T) per primer ranged from 2 (ES-405) to 22 (Elw5616s393) with 9.5 bands per primer. Across the 36 accessions, the polymorphic information content (PIC) values ranged from 0.23 (ES-22 and ES-125) to 0.50 (Elw2698s152 and Elw2807s159, etc.) with an average of 0.44, suggesting a high level of polymorphism.
The population structure of the 36 accessions was investigated using the Hardy-Weinberg Equilibrium by using STRUCTURE V2.3.4 software. Based on maximum likelihood and delta K (ΔK) values, the number of optimum groups was four (Figure 2). Among them, 18 accessions from Sichuan, Inner Mongolia and Xinjiang and one from Gansu were assigned to group 1 (SC, NM, XJ); four accessions from Qinghai were assigned to group 2 (QH); eight accessions from Gansu and two from Sichuan were assigned to group 3 (GS-I); three accessions from Gansu were assigned to group 4 (GS-II). Among 36 accessions, Y1005 and ZhN06 showed the largest genetic distance (0.6752). The results of genetic structure showed that there was not a strong relationship between the genetic structure and the geographical origin. For example, SC02 and SC03 from Ruoergai, Sichuan were assigned to group 3, showing close genetic relationship with accessions from Gansu.
The principal coordinate analysis (PCoA) showed about 31.52% of the total variation was described by the first three PCo (Figure 3). The majority of accessions from GS and two from SC (SC02 and SC03) shared the same group, three accessions from GS were assigned to one group, the remaining of SC as well as NM, XJ and QH were assigned to a mixed group. The results of PCoA analysis were similar to structure analysis, indicating the reliability of the results.
Results of POPGENE analysis showed high genetic diversity between geographic regions (Table 3). The values of NPB ranged from 70 (QH) to 299 (GS), with an average of 177.4. The PPB values ranged from 32.71% to 86.17%, with an average of 63.13%. The Shannon information index of diversity (I) values ranged from 0.0946 to 0.3594, with an average of 0.2301. The Nei′s genetic diversity (H) values ranged from 0.0623 to 0.2315, with an average of 0.1510. The observed number of alleles values (Na) ranged from 1.1842 to 1.7868, with an average of 1.4668. Generally, among five geographic regions, GS exhibited the highest level of variability (PPB = 86.17%, I = 0.3594, H = 0.2315, Na = 1.7868), whereas the group QH exhibited the lowest of variability (PPB = 32.17%, I = 0.0946, H = 0.0623, Na = 1.1842). AMOVA analysis showed a significant (p < 0.001) genetic difference among the five regions. A larger proportion variation (83.40%) was apportioned within geographic regions and 16.60% was apportioned between geographic regions (Table 4). The genetic identity among five geographic regions ranged from 0.6170 (between NM and QH) to 0.9552 (between NM and XJ) with an average of 0.8218 (Table 5).

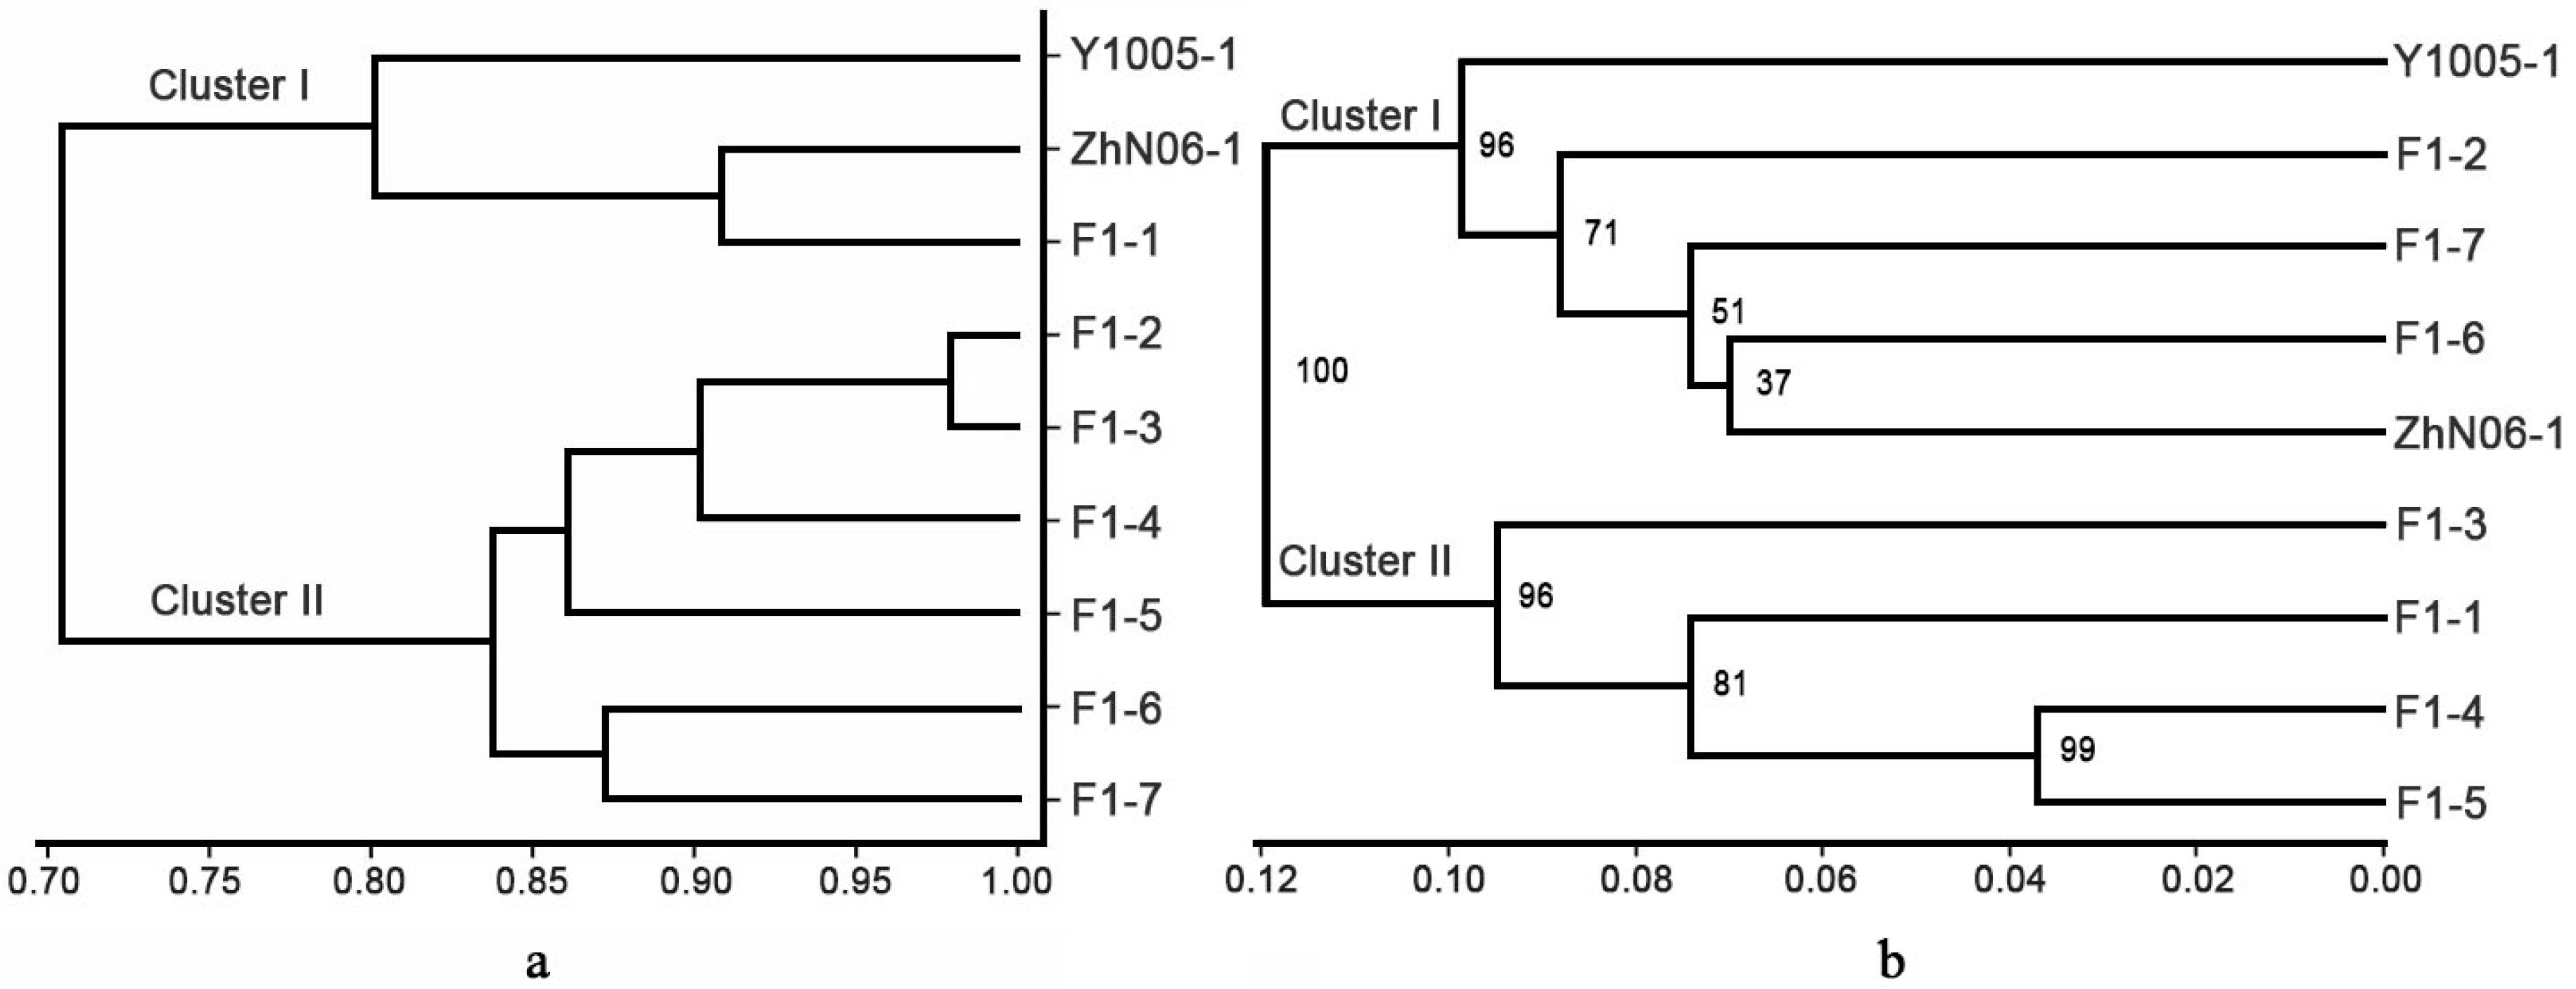
2.3. Genetic and Phenotypic Variation of Hybrid Population

Two parental genotypes: Y1005-1 (moderate seed shattering degree) and ZhN06-1 (lowest seed shattering degree)were selected as parents to produce seven F1 individuals by hand pollination, because they had the highest genetic distance and contrasting seed shattering degree. The phenotypic variation and genetic diversity of the hybrid population and their parents were studied using 12 phenotypic traits and EST-SSR markers. Table 6 showed mid-parent heterosis (MPH), higher-parent heterosis (HPH), and coefficient of variation (CV) of the 12 traits for hybrid population and their parents. The greatest variation was found for 1000-seed weight (CV = 33.11%) and seed shattering (SS) (CV = 32.98%), followed by flag leaf length, flag leaf width, tiller number, leaf length, culm diameter, leaf width, plant height, culm number, awn length and panicle length. Some phenotypic traits of the hybrids showed evidence for significant heterosis, including flag leaf length (MPH = 80.9%, HPH = 80.4%), seed shattering (MPH = 51.1%, HPH = 8.1%), leaf length (MPH = 48.4%, HPH = 32.0%) and flag leaf width (MPH = 44.0%, HPH = 23.5%). Whereas the heterosis of tiller number, plant height, 1000-seed weight and culm diameter was lower than that of other phenotypic traits, some of them showed negative heterosis for F1 hybrids.
The high degree of genetic variation found in morphological traits is in accord with the genetic variability (Table 7). The 40 EST-SSR primers amplified 257 bands (P = 59.92%), with 6.4 bands per primer. PIC ranged from 0.00 to 0.44, with the average of 0.20. The number of bands exclusively present in F1 lines (BEPF) (8.44%) is higher than bands exclusively present in parents (BEPP) (1.95%). 20.78% bands were shared by Y1005-1 and F1 lines, whereas 26.62% bands were shared by ZhN06-1 and F1 lines. These results showed that ZhN06-1 may have a higher heritability than Y1005-1.
The clustering analysis based on phenotypic traits showed two major groups (Figure 4a). Cluster I contained Y1005-1, ZhN01-1 and F1-1. Cluster II included the other six F1 lines, among them F1-2, F1-3 and F1-4 were clustered together in a major subgroup with F1-5, while F1-6 and F1-7 were in a separate subgroup. When compared with the phenotypic-based dendrogram, marker-based cluster revealed poor correlation with morphological characteristics (Figure 4b). Cluster I consisted of Y1005, F1-2, F1-7, F1-6 and ZhN06. Other four F1 lines were grouped into cluster II.

3. Discussion

3.1. Genetic Diversity of E. sibiricus

Genetic diversity is the foundation of species diversity and a crucial precursor in the study of any species, because its quantity and distribution have an effect on the evolutionary and breeding potential of species or populations [14]. As an important forage grass in North China, E. sibiricus possesses great morphological and genetic variation [15]. However, recent research has showed that global climate warming and excessive grazing threaten the productivity and growth of E. sibiricus, causing losses of genetic diversity [16]. It is, therefore, necessary to evaluate the level and distribution of genetic variability for effective exploitation and utilization of E. sibiricus. Former studies have assessed E. sibiricus accessions and populations of different origins using some molecular markers, including ISSR [17], SRAP [18], SCoT [19] and EST-SSR [2]. Each study found high genetic diversity within accessions or populations. Similar genetic diversity level (87.11%) was found in this study, which might be due to the diverse geographic origins of materials tested. Among five geographic regions, GS has higher genetic diversity (86.17%) than the other four regions: SC, XJ, NM and QH. Accessions from QH revealed the highest genetic distance when compared with other populations. Previous studies showed that environment parameters such as latitude, longitude and altitude are highly correlated with the magnitude and distribution of genetic diversity [3]. The wide geographical range of five E. sibiricus populations studied may have contributed to the difference of genetic diversity. Sample size is also an important factor affecting the measurement of genetic diversity [2]. There was a positive correlation between sample size and genetic diversity [19]. In this study, small sample size from some geographic regions (e.g., four accessions from QH) may have resulted in a lower estimate of genetic diversity.
Typically, self-pollinating species possess relatively less within-population genetic variability than out-crossing species [20]. In this study, 83.40% of the genetic variance was apportioned within geographic regions, similar to values previously reported for E. sibiricus [2,3,18] and other self-pollinating Elymus species. For instance, Stevens et al. [21] found 85.0% within-population variation by analyzing four E. trchycaulus populations using SSR markers. Many factors previously reported can affect the pattern of genetic variability such as gene mutation, genetic drift, selection, gene flow, reproduction mode and population size [2,22,23,24]. In this study, genetic divergence may be more related to complex eco-geographical factors within the E. sibiricus distribution area.

3.2. Broadening Genetic Diversity for Seed Shattering Improvement

Like most native grasses, E. sibiricus is difficult to grow for commercial seed production, since seed shattering causes large yield losses during harvest. A major limitation of plant improvement program is the lack of plant materials exhibiting genetic variation for traits of interest [25]. The challenge that exists for plant development is to maintain the genetic diversity within a species while improving desired traits that enable plant materials to perform well. To broaden the genetic diversity of E. sibiricus for future breeding improvement programs, two parental genotypes (Y1005-1 and ZhN06-1) with genetic difference sand contrasting seed shattering habits were selected to produce F1 lines. Our results showed seed shattering degree in hybrid population ranged from 68.2 gf (F1-1) to 143.4 gf (F1-6), with an average of 97.2 gf. Three F1 individuals (F1-4, F1-6 and F1-7) had lower seed shattering degree than low seed shattering parent ZhN06-1 (97.2). Thus, these individuals could be used as breeding materials for developing low seed shattering cultivars in the future. Except for seed shattering, other traits such as flag leaf length and width also showed the positive heterosis. Our results confirmed that some morphological traits of E. sibiricus could be improved by means of hybridization. When compared with the phenotypic-based dendrogram, marker-based cluster revealed poor correlation with morphological characteristics. The phenotypic-based dendrogram using limited morphological data could be affected by environment factors. In comparison, a marker-based cluster is more efficient and allows genetic diversity analysis using any physiological stage or tissue, suggesting its potential in analyzing genetic diversity and relationship of E. sibiricus.
Based on our results, the genetic diversity of hybrid population is 59.92%. Furthermore, 8.44% and 1.95% of polymorphic bands were exclusively present in F1 lines and parents, respectively. These gained and missed bands were considered as polyploidization-induced rearrangements within coding regions. Hybridization of more genomes with different sizes and compositions in a single nucleus followed by chromosome doubling can induce several types of genomic modifications and rearrangement in the hybrids [26,27]. These new rearranged bands might be associated with effects of heterosis and contribute to surprisingly low seed shattering in the hybrids. However, whether these novel bands were responsible for new genes associated with seed shattering or other important traits is still not clear. In the future, molecular markers combined with sequence data might provide new evidence.

4. Materials and Methods

4.1. Plant Materials

A total of 36 E. sibiricus accessions were used in the study, comprising wild collections, breeding lines, cultivars, and cultivated types (Table 1). Seeds of these accessions were obtained from National Plant Germplasm System (NPGS, USA), Lanzhou University, Sichuan Agricultural University and Sichuan Academy of Grassland Science. All accessions were grouped into five geographic regions: SC (Sichuan), NM (Inner Mongolia), XJ (Xinjiang), GS (Gansu) and QH (Qinghai) based on their origin and physical-geographical regionalization. Moreover, eight F1 lines derived from a pair cross between two parental genotypes: Y1005-1 and ZhN06-1 were also used for genetic diversity analysis (Table 2).

4.2. DNA Extraction and PCR Amplification

Twenty individuals of each accession were sampled for the extraction of bulked DNA. Leaf tissues were collected from young plants, and were lyophilized for DNA extraction using a modified cetyltrimethyl ammonium bromide (CTAB) method [28]. DNA concentration and quality were determined using a Nanodrop spectrophotometer (NanoDrop Products, Wilmington, DE, USA) and agarose gel electrophoresis. Finally, the DNA samples were diluted to 25 ng/µL and stored at −20 °C prior to PCR amplification.
A total of 212 EST-SSR primers from different resources were used for genotyping, of which 100 EST-SSR markers were previously developed from Elymus (Elw hereafter), Pseudoroegneria (Ps hereafter) and Leymus (Lt hereafter) EST database [29,30,31] and 112 novel E. sibiricus EST-SSR markers were developed by transcriptome sequencing [32]. The DNA samples of 5 accessions with different geographical origins were used for primer screening. Then 40 EST-SSR primers that successfully amplified and produced clear and stable bands of the expected size by PCR amplification were used in the final analysis (Table 3). The PCR amplification and SSR genotyping were carried out as described by Xie et al. [2] and Zhou et al. [32]. Amplification fragments were then separated on 6% denatured polyacrylamide gels electrophoresis (PAGE). The resulting gel was stained by AgNO3 solution, and photographed by a digital camera (D7000, Nikon, Tokyo, Japan).

4.3. Phenotypic Traits Measurement

The seeds of F1 lines and their parents were germinated in plastic boxes with moistened blotter paper at room temperature. After germination seedlings were grown in a greenhouse under a 25/15 °C day/night temperature regimes until they were 8 weeks old. Then they were transplanted to field plots in the research farm, Yuzhong, Gansu, China (latitude 35°34′ N, longitude 103°34′ E, elevation 1720 m). Plants were spaced 0.5 m within rows and 1 m between rows. A total of 12 phenotypic traits, including seed shattering (SS), plant height (PH), leaf length (LL), leaf width (LW), flag leaf length (FLL), flag leaf width (FLW), culm diameter (CD), culm number (CN), tiller number (TN), panicle length (PL), awn length (AL) and 1000-seed weight (1000-SW) were measured using the methods described by Zhao et al. [8]. Seed shattering degree of E. sibiricus accessions was determined by measuring pedicel breaking tensile strength (BTS), which is inversely proportional to shattering degree. Thirty randomly chosen spikelets of each plant were examined at 28 days after heading, and their average BTS values were calculated. The heterosis of hybrids were estimated on mid-parent values and high-parent value using the following formula: mid-parent heterosis (%) = (F1 − MP)/MP × 100%, higher-parent heterosis (%) = (F1 − HP)/HP × 100 %, where F1 is the mean of the hybrids, MP is the mean of parents, HP is the value of higher parent [33].

4.4. Data Analysis

The amplified bands were scored as present (1) or absent (0), and only reproducible bands were considered. The resulting present/absent data matrix was analyzed using POPGENE 32 Version 1.31 [34]. Number of polymorphic band (NPB), percentage polymorphic band (PPB), Shannon information index of diversity (I), Nei′s gene diversity (H), and observed number of alleles (Na) and polymorphic information content (PIC) were used to evaluate genetic diversity. PIC was calculated for each primer according to the formula: PIC = 1 − p2 − q2, where p is frequency of present band and q is frequency of absent band [35]. The Analysis of Molecular Variance (AMOVA) was used to partition the total EST-SSR variation into within populations and among populations [36]. The input files for POPGENE and AMOVA were prepared with the aid of DCFA1.1 program written by Zhang and Ge [37]. Population structure of the 36 E. sibiricus accessions was analyzed using STRUCTURE v2.3.4 software with the ′admixture mode′, burn-in period of 10,000 iterations and a run of 100,000 replications of Markov Chain Monte Carlo (MCMC) after burn in [38]. For each run, 10 independent runs of STRUCTURE were performed with the number of clusters (K) varying from 1 to 8. Mean L (K) and delta K (ΔK) were estimated using the method described by Evanno et al. [39], maximum likelihood and delta K (ΔK) values were used to determine the optimum number of groups. A principal coordinate analysis (PCoA) was constructed based on Jaccard′s genetic similarity matrix using DCENTER module in NTSYS (version 2.10) [40]. A dendrogram was constructed using the GenStat (version 17.1) and free tree + tree view (version 1.6.6 for Windows) software. The phenotypic data were analyzed using SPSS software (SPSS, version 22 for Windows, SPSS Inc., Chicago, IL, USA).

5. Conclusions

This study showed a high level of genetic diversity and a clear population structure of 36 E. sibiricus accessions from its primary distribution area in China. The finding that larger variation existed within geographical regions will provide a guideline for the collection and conservation of E. sibiricus germplasm. More genetic variation of the species can be captured when sampling a larger number of plants from special eco-geographical regions. Meanwhile, cross breeding is an effective way to obtain more genetic and phenotypic variation. F1 lines of E. sibiricus exhibited a higher genetic variation in the major agronomic traits. In addition, some F1 lines showed obvious heterosis over parents, especially in seed shattering performance. These hybrids could be used as important genetic resources for genetic improvement of E. sibiricus in future breeding improvement programs.

Acknowledgments

This study was supported by grants from the Chinese National Science Foundation (No. 31302023), the Chinese National Basic Research Program (No. 2014CB138704), the program for Changjiang Scholars and Innovation Research Team in University (IRT13019), and supported by the Fundamental Research Funds for Central Universities (lzujbky-2016-7, lzujbky-2016-183).

Author Contributions

Conceived and designed the experiments: W.X., Y.W.; Performed the experiments: Z.Z., J.Z., X.Z.; Analyzed the data: Z.Z., J.Z.; Wrote the paper: Z.Z., W.X.

Conflicts of Interest

All authors declare that they have no conflict of interest.

References

  1. Dewey, D.R. Cytogenetics of Elymus sibiricus and its hybrids with Agropyron tauri, Elymus canadensis, and Agropyron caninus. Bot. Gaz. 1994, 135, 80–87. [Google Scholar] [CrossRef]
  2. Xie, W.G.; Zhao, X.H.; Zhang, J.Q.; Wang, Y.R.; Liu, W.X. Assessment of genetic diversity of Siberian wild rye (Elymus sibiricus L.) germplasms with variation of seed shattering and implication for future genetic improvement. Biochem. Syst. Ecol. 2015, 58, 211–218. [Google Scholar] [CrossRef]
  3. Ma, X.; Chen, S.Y.; Bai, S.Q.; Zhang, X.Q.; Li, D.X.; Zhang, C.B.; Yan, J.J. RAPD analysis of genetic diversity and population structure of Elymus sibiricus (Poaceae) native to the southeastern Qinghai-Tibet Plateau, China. Genet. Mol. Res. 2012, 11, 2708–2718. [Google Scholar] [CrossRef] [PubMed]
  4. You, M.H.; Liu, J.P.; Bai, S.Q.; Zhang, X.Q.; Yan, J.J. Study on relationship of seed shattering, seed development and yield traits of Elymus sibiricus L. Southwest China J. Agric. Sci. 2011, 24, 1256–1260. [Google Scholar]
  5. Wu, J.F.; Li, F.; Xu, K.; Gao, G.Z.; Chen, B.Y.; Yan, G.X.; Wang, N.; Qiao, J.W.; Li, J.; Li, H.; et al. Assessing and broadening genetic diversity of a rapeseed germplasm collection. Breeding Sci. 2014, 64, 321–330. [Google Scholar] [CrossRef] [PubMed]
  6. Jesske, T.; Olberg, B.; Schierholy, A.; Becker, H.C. Resynthesized lines from domesticated and wild Brassica taxa and their hybrids with B. napus L.: Genetic diversity and hybrid yield. Theor. Appl. Genet. 2013, 126, 1053–1065. [Google Scholar] [CrossRef] [PubMed]
  7. Shen, J.X.; Fu, T.D.; Yang, G.S. Relationship between hybrid performance and genetic diversity based on SSRs and ISSRs in Brassica napus L. Agric. Sci. China 2003, 2, 1083–1090. [Google Scholar]
  8. Zhao, X.H.; Jiang, X.; Zhao, K.; Zhao, X.H.; Yin, J.; Xie, W.G. Screening of germplasm with low seed shattering rate and evaluation on agronomic traits in Elymus sibiricus L. J. Plant Gen. Resour. 2015, 16, 691–699. [Google Scholar]
  9. Robins, J.G.; Bushman, B.S.; Jensen, K.B. Dry matter yield combining ability among nine sources of orchardgrass germplasm. Euphytica 2012, 188, 419–428. [Google Scholar] [CrossRef]
  10. Jia, X.P.; Deng, Y.M.; Sun, X.B.; Liang, L.J.; Ye, X.P. Characterization of the global transcriptome using Illumina sequencing and novel microsatellite marker information in seashore paspalum. Genes Genom. 2015, 37, 77–86. [Google Scholar] [CrossRef]
  11. Ramu, P.; Billot, C.; Rami, J.F.; Senthilvel, S.; Upadhyaya, H.D.; Reddy, L.A.; Hash, C.T. Assessment of genetic diversity in the sorghum reference set using EST-SSR markers. Theor. Appl. Genet. 2013, 126, 2051–2064. [Google Scholar] [CrossRef] [PubMed] [Green Version]
  12. Xie, W.G.; Robins, J.G.; Bushman, B.S. A genetic linkage map of tetraploid orchardgrass (Dactylis glomerata L.) and quantitative trait loci for heading date. Genome 2012, 55, 360–369. [Google Scholar] [CrossRef] [PubMed]
  13. Huang, L.K.; Huang, X.; Yan, H.D.; Yin, G.H.; Zhang, X.Q.; Tian, Y.; Zhang, Y.; Jiang, X.M.; Yan, Y.H.; Ma, X.; et al. Constructing DNA fingerprinting of Hemarthria cultivars using EST-SSR and SCoT markers. Genet. Resour. Crop. Evol. 2014, 61, 1047–1055. [Google Scholar] [CrossRef]
  14. Futuyma, D.J. Evolutionary Biology; Sinauer Associates: Sunderland, MA, USA, 1986; p. 2. [Google Scholar]
  15. Yan, J.J.; Bai, S.Q.; Zhang, C.B.; You, M.H. A primary investigation report for the wild germplasm of Elymus sibiricus in the Northwest Plateau of Sichuan province. Pruatacult Anim. Husb. 2006, 27, 23–26. [Google Scholar]
  16. Lei, Y.T.; Zhao, Y.Y.; Yu, F.; Li, Y.; Dou, Q.W. Development and characterization of 53 polymorphic genomic-SSR markers in Siberian wildrye (Elymus sibiricus L.). Conserv. Genet Resour. 2014, 6, 861–864. [Google Scholar] [CrossRef]
  17. Ma, X.; Zhang, X.Q.; Zhou, Y.H.; Bai, S.Q.; Liu, W. Assessing genetic diversity of Elymus sibiricus (Poaceae: Triticeae) populations from Qinghai-Tibet Plateau by ISSR markers. Biochem. Syst. Ecol. 2008, 36, 514–522. [Google Scholar] [CrossRef]
  18. Yan, J.J.; Bai, S.Q.; Zhang, X.Q.; You, M.H.; Zhang, C.B.; Li, D.X.; Zeng, Y. Genetic diversity of wild Elymus sibiricus germplasm from the Qinghai-Tibetan Plateau in China detected by SRAP markers. Acta. Prataculturae Sin. 2010, 19, 173–183. [Google Scholar]
  19. Zhang, J.C.; Xie, W.G.; Wang, Y.R.; Zhao, X.H. Potential of Start Codon Targeted (SCoT) Markers to Estimate Genetic Diversity and Relationships among Chinese Elymus sibiricus Accessions. Molecules 2015, 20, 5987–6001. [Google Scholar] [CrossRef] [PubMed]
  20. Schoen, D.J.; Brown, A.H.D. Intraspecific variation in population gene diversity and effective population size correlates with the mating system in plants. Proc. Natl. Acad. Sci. USA 1991, 88, 4494–4497. [Google Scholar] [CrossRef] [PubMed]
  21. Stevens, L.; Salomon, B.; Sun, G. Microsatellite variability and heterozygote excess in Elymus trachycaulus population from British Columbia in Canada. Biochem. Syst. Ecol. 2007, 35, 725–736. [Google Scholar] [CrossRef]
  22. Slatkin, M. Gene flow and the geographic structure of natural populations. Science 1987, 236, 778–792. [Google Scholar] [CrossRef]
  23. Schaal, B.A.; Hayworth, D.A.; Olsen, K.M.; Rauscher, J.T.; Smith, W.A. Phylogeographic studies in plants: Problems and prospects. Mol. Ecol. 1998, 7, 465–474. [Google Scholar] [CrossRef]
  24. Jin, Y.; Lu, B.R. Sampling strategy for genetic diversity. Chin. Biodivers. 2003, 11, 155–161. [Google Scholar]
  25. Jensen, K.B.; Mott, I.W.; Robins, J.G.; Waldron, B.L.; Nelson, M. Genetic improvement and diversity in Snake River wheatgrass (Elymus wawawaiensis) (Poaceae: Triticeae). Rangeland Ecol. Manag. 2012, 65, 76–84. [Google Scholar] [CrossRef]
  26. Ozkan, H.; Levy, A.A.; Feldman, M. Allopolyploidy-induced rapid genome evolution in the wheat (Aegilops-Triticum) group. Plant Cell 2001, 13, 1735–1747. [Google Scholar] [CrossRef] [PubMed]
  27. Levy, A.A.; Feldman, M. The impact of polyploidy on grass genome evolution. Plant Physiol. 2002, 130, 1587–1593. [Google Scholar] [CrossRef] [PubMed]
  28. Doyle, J.J. DNA protocols for plants-CTAB total DNA isolation. In Molecular Techniques in Taxonomy; Hewit, G.M., Ed.; Springer-Verlag: Berlin, Germany, 1991; pp. 283–293. [Google Scholar]
  29. Larson, S.R.; Kellogg, E. Genetic dissection of seed production traits and identification of a major-effect seed retention QTL in hybrid Leymus (Triticeae) wildrye. Crop Sci. 2009, 49, 29–40. [Google Scholar] [CrossRef]
  30. Mott, I.W.; Larson, S.R.; Jones, T.A.; Robins, J.G.; Jensen, K.B.; Peel, M.D. A molecular genetic linkage map identifying the St and H subgenomes of Elymus (Poaceae: Triticeae) wheatgrass. Genome 2011, 54, 819–828. [Google Scholar] [CrossRef] [PubMed]
  31. Mott, I.W.; Larson, S.R.; Bushman, B.S. Simple sequence repeat (SSR) markers for Elymus, Pseudoroegneria and Pascopyrum species (Triticeae: Gramineae). Plant Genet. Resour. 2011, 9, 489–494. [Google Scholar] [CrossRef]
  32. Zhou, Q.; Luo, D.; Ma, L.C.; Xie, W.G.; Wang, Y.; Wang, Y.R.; Liu, Z.P. Development and cross-species transferability of EST-SSR markers in Siberian wildrye (Elymus sibiricus L.) using Illumina sequencing. Sci. Rep. 2016, 6, 20549. [Google Scholar] [CrossRef] [PubMed]
  33. Zhao, Y.F.; Zhang, X.Q.; Ma, X.; Xie, W.G.; Huang, L.K. Morphological and genetic characteristics of hybrid population of Dactylis glomerata. Genet. Mol. Res. 2014, 13, 2491–2503. [Google Scholar] [CrossRef] [PubMed]
  34. Yeh, F.; Yang, R.; Boyle, T. Quick User Guide. In Popgene; University of Alberta: Edmonton, AB, Canada, 1999. [Google Scholar]
  35. Ghislain, M.; Zhang, D.P.; Fajardo, D.; Huamán, Z.; Hijmans, R.J. Marker-assisted sampling of the cultivated Andean potato Solanum phureja collection using RAPD markers. Gen. Resour. 1999, 46, 547–555. [Google Scholar]
  36. Mengoni, A.; Bazzicalupo, M. The statistical treatment of data and the analysis of molecular variance (AMOVA) in molecular microbial ecology. Ann. Microbiol. 2002, 52, 95–102. [Google Scholar]
  37. Zhang, F.M.; Ge, S. Data analysis in population genetics. I. analysis of RAPD data with AMOVA. Biodivers. Sci. 2002, 10, 438–444. [Google Scholar]
  38. Pritchard, J.K.; Stephens, M.; Donnelly, P. Inference of population structure from multilocus genotype data. Genetics 2000, 155, 945–959. [Google Scholar] [PubMed]
  39. Evanno, G.; Regnaut, S.; Goudet, J. Detecting the number of clusters of individuals using the software structure: A simulation study. Mol. Ecol. 2005, 14, 2611–2620. [Google Scholar] [CrossRef] [PubMed]
  40. Rohlf, F.J. NTSYS-pc: Numerical Taxonomy and Multivariate Analysis System; Exeter Software: New York, NY, USA, 1992. [Google Scholar]
  • Sample Availability: Samples of the compounds are available from the authors.
Figure 1. Seed shattering degree (SS) of 36 E. sibiricus accessions. The red dotted line represents the average value of seed shattering.
Molecules 21 00869 g001
Figure 2. Four groups of 36 E. sibiricus accessions inferred from STRUCTURE analysis and the description of detected the optimum value of K by using graphical method. (a) Mean L (K) over 20 runs for each K value; (b) Maximum delta K (△K) values were used to determine the uppermost level of structure for K ranging from 2 to 7, here K is four and four clusters; (c) The vertical coordinate of each group indicates the membership coefficients for each accessions. Red zone: SC, NM and XJ; Green zone: QH; Blue zone: GS-I; Yellow zone: GS-II.
Molecules 21 00869 g002
Figure 3. Principal coordinates analysis for the first and second coordinates estimated for EST-SSR markers using Jaccard′s genetic similarity matrix for 36 E. sibiricus accessions.
Molecules 21 00869 g003
Figure 4. Dendrograms of the parents and F1 generations of E. sibiricus using UPGMA from phenotypic data (a) and marker-based data (b). The numbers marked on the branches (b) are bootstrap values (%) out of 1000 bootstrapping.
Molecules 21 00869 g004
Table 1. E. sibiricus accessions used in the study.
PopulationCodeAccessionOriginStatus
SC1Y1005Sichuan, ChinaWild
SC2SAU003Kangding, Sichuan, ChinaWild
SC3SAU133Aba, Sichuan, ChinaWild
SC4SAU139Kangding, Sichuan, ChinaWild
SC5SAU137Aba, Sichuan, ChinaWild
SC6SC02Ruoergai, Sichuan, ChinaWild
SC7SC03Ruoergai, Sichuan, ChinaWild
SC8HongyuanHongyuan, Sichuan, ChinaBreeding line
SC9Chuancao2Hongyuan, Sichuan, ChinaCultivar
NM10PI 499453Inner Mongolia, ChinaWild
NM11PI 665507Inner Mongolia ,ChinaWild
NM12PI 499456Inner Mongolia, ChinaCultivated
NM13PI 610886Inner Mongolia, ChinaWild
XJ14PI 655140Xinjiang, ChinaWild
XJ15PI 595182Xinjiang, ChinaWild
XJ16PI 595180Xinjiang, ChinaWild
XJ17Y2003Xinjiang, ChinaWild
XJ18PI 619577Xinjiang, ChinaWild
XJ19PI 499462Xinjiang, ChinaWild
XJ20PI 499468Xinjiang, ChinaCultivated
GS21XH02Xiahe, Gansu, ChinaWild
GS22XH03Xiahe, Gansu, ChinaWild
GS23XH09Xiahe, Gansu, ChinaWild
GS24LQ04Luqu, Gansu, ChinaWild
GS25LQ01Luqu, Gansu, ChinaWild
GS26HZ01Hezuo, Gansu, ChinaWild
GS27HZ02Hezuo, Gansu, ChinaWild
GS28ZhN01Zhuoni, Gansu, ChinaWild
GS29ZhN06Zhuoni, Gansu, ChinaWild
GS30MQ01Maqu, Gansu, ChinaWild
GS31LT01Lintan, Gansu, ChinaWild
GS32LT02Lintan, Gansu, ChinaWild
QH33TongdeQinghai, ChinaCultivar
QH34Qingmu1Qinghai, ChinaCultivar
QH35PI 531669Qinghai, ChinaWild
QH36PI 504462Qinghai, ChinaWild
Note: SC, Sichuan, China; NM, Inner Mongolia, China; XJ, Xinjiang, China; GS, Gansu, China; QH, Qinghai, China.
Table 2. Results achieved by Elymus (Elw), Pseudoroegneria (Ps), Leymus (Lt) and E. sibiricus (ES) EST-SSR markers, all detected in 36 E. sibiricus accessions.
Primer IDForward Primer (5′-3′)Reverse Primer (5′-3′)TMTP%PPIC
Elw0300s019TTCATCCATCCAATTCTAGCACAAGAAGGAGAAGATGGAATCCTTGAA808100.000.49
Elw0669s043CATCTCACGGCAAGTAAATGAACATGCGAGATGGGGTACAATTTTTAT12012100.000.35
Elw1197s069ATGGCCGTAACCCTTTACCTGTATTTTCAAAGCCTTTCCAAGTGAATC71685.710.48
Elw1420s081GGATAGACCCATGAGCTGACTGATCTTTCTCCACAAGTTGAACACAAGA11011100.000.35
Elw1468s087TAGCAATAAGTTGCTGCTGCTGTTCCACCTCTAAATTAATCACCACGAA11011100.000.47
Elw1675s092CAGTTAAAATGCTTGTCCAAATGCCCATGATTGTTCTGTCAAGAAACG101990.000.48
Elw2676s146AATTCGAAAGCTGTGGACTTGTCTCAATTTTGCTCTCAAGAGAACCGT101990.000.48
Elw2698s152CAAAGCATGTGTAGGCAGTCTTGTTAACAATGATCAGTTGATCGGACC909100.000.50
Elw2807s159CCCAAGAAGCAAAAGTGAAGTTGAATAATTGCTGTAAAACGGCAGGAA11011100.000.50
Elw2808s160TTTCATATCCGATACCCAGAAAGCGGGCGACAAGGGTACTACTAACAA404100.000.45
Elw3264s184TGGACTGCTTTGGGACATAATAGGCTGAATCATAGCCACCCTGAAAAC606100.000.42
Elw3384s187AGCTCCTGATAGAAAGAGCCATCAGGCTGCTGGAACTGAAGACAGTA16016100.000.36
Elw3492s190TGTTGTTGTTCCAGTTCCAGTCTCAAAAACAACCACACAAGGTTGTCA92777.780.43
Elw3995s226CTCTAGGGTTTTGGGATTTTAGCCGTTGTGGAGGTCGGAGAAGGT707100.000.49
Elw4419s261AGGGTGACTTGTCTTTGGGTGTAAAGTCAGATGAAGGATGGCTGAAAC81787.500.50
Elw5447s306TCCTCAAACTCCTCCTCTCTTCGGAGGTAAGTCTCGACATCCTCGAC909100.000.50
Elw5616s393TAGTAGCGTGGCACTCCTCTTCTTGGTACAAACCACCAAAGGTACTGC22022100.000.42
Elw5627s404AGATGAAGCTGGTAACCGAGACAGATTTCCTCTAATGGAAGCTCTGGC17017100.000.46
Ps2283GCCACAACAAGAGAAGACCTTGCGACCTGCATGATGCTCTCGC13013100.000.40
Ps261CTCGAATCCAGCTGAACAATTTCTAGTCGATCCTCACCTTCATCTCC909100.000.45
Ps3447AGCTTTATGAAGATCGCCACTCACCTGCTGCTGCTACCGTTCTTATTT13013100.000.50
Ps3577CATCTTGCATATAGCTCCTTCGCTCTCAAGAAACCCACAATCCAATTC505100.000.48
Ps938TTGCTCCTATGGTTCCACGTAGTTAAAGTGAAATTCTGCCATCAGAGC1311292.310.49
Ltc0209CAGGAACATGAACAGAAGCCTGTCGTACTGGTCGAACCACCCAAAGT1211191.670.50
Ltc0096GCGCACTACCGCCTCTTAGTTGTCCAGGTAGCACACCTCCG82675.000.49
ES-7CCTCCTCCGTTACCATGTTGCCCTGCTTTTCCCTCTCTG43125.000.27
ES-22AAGATATCCTGATGCTGGACAAAGATCAGATCAATAGCTTGAGCG75228.570.23
ES-23CGTACTTGCGCCAGAAGTGAGGTGTCCATCGAAGGGTC1421285.710.45
ES-51GAGCTGAGCTGAGAAGAAAACAGCACAATCATCTCATCTTCCTTCC14014100.000.44
ES-97ACTGTGGGAGAAGGTGAGAGACTCTTTCCTCCAGCTCATGGTG84450.000.49
ES-123AGCATGAAGCTCGACTGTGAGTGCGAGTACATCTCGTACTTCTGG124866.670.49
ES-125GAGCATCGACAGATTATTCCTTGCGAAGGAACCTCTGCAAGAC53240.000.23
ES-144GGTAGTCGTTGACCCAGATGTCCACATTGTAAACTGGTCCTCCTC505100.000.49
ES-231TAGCTGGTCATGCCTAGGAGTAGCCAGGTGTCAGGATATAGCAAAA61583.330.44
ES-236TCGCATGCTTATAATCCTTTGACTGAGGTCTCTGTCAATACCAACA63350.000.35
ES-253CATCTCTTCAAACTTGGATTGGTGTGATCTATACCATTGGCCTCAA124866.670.46
ES-259CTCCTCTACCTGTCTGCTGCTAAGATCGTCGACTACGTCAAGAAG11011100.000.47
ES-310CGTAGCAATTCCATTCTATCCAGTGGTGAGCTAGATTGACACTGAG96333.330.33
ES-347CATGAAGATGATGCGTGTTTTAATCCGACTCCTAATTGAACTCGTAA53240.000.47
ES-405AGAGAAAAGGAGATTCTCATCCCGCTGCTCTGCATCCTACTCTATC21150.000.43
Mean 9.51.28.387.110.44
Total 38049331
T, total number of amplified bands; M, number of monomorphic bands; TP, total number of polymorphic bands; % P, percentage of polymorphism; PIC, polymorphic information content.
Table 3. Genetic variability within five geographic regions of E. sibiricus.
POPNPBPPB (%)IHNa
SC20473.120.26500.17391.5368
NM13756.850.19470.13011.3605
XJ17766.790.23680.15701.4658
GS29986.170.35940.23151.7868
QH7032.710.09460.06231.1842
Mean177.463.130.23010.15101.4668
NPB, number of polymorphic band; PPB, percentage of polymorphic bands; I, Shannon information index of diversity; H, Nei′s genetic diversity; Na, observed number of alleles.
Table 4. Analysis of molecular variance (AMOVA) of five geographic regions.
Source of VarianceDegree of FreedomSum of SquaresVariance ComponentTotal Variation (%)
Among geographic regions4403.458.4816.60
Within geographic regions311320.1342.5883.40
Table 5. Nei’s original measures of genetic identity (above diagonal) and genetic distance (below diagonal) of five geographic regions E. sibiricus.
PopulationSCNMXJGSQH
SC 0.94600.94780.91920.6453
NM0.0555 0.95520.87830.6170
XJ0.05360.0458 0.90240.6514
GS0.08430.12970.1027 0.7553
QH0.43810.48290.42860.2807
SC, Sichuan, China; NM, Inner Mongolia, China; XJ, Xinjiang, China; GS, Gansu, China; QH, Qinghai, China.
Table 6. Agronomic performance and the coefficients of variation (CV), mid-parent (MPH) and higher-parent heterosis (HPH) of hybrid population and parents.
Material
Name
PH
(cm)
LL
(cm)
LW
(cm)
FLL
(cm)
FLW
(cm)
CD
(cm)
CN
(No.)
TN
(No.)
PL
(cm)
AL
(cm)
1000-SW (g)SS (gf)C.VV (%)
Y1005-156.312.60.99.10.80.23.118320.01.14.441.918.37
ZhN06-198.016.20.89.10.60.43.415219.21.12.497.217.09
F1-169.018.40.713.50.70.43.213517.81.03.468.217.82
F1-279.020.21.015.70.90.43.311120.01.13.593.016.03
F1-388.021.41.115.61.00.43.411421.71.12.882.119.83
F1-482.022.61.117.51.10.43.19523.31.35.1114.914.46
F1-576.523.11.318.01.30.44.49522.51.25.496.414.32
F1-681.722.80.918.81.10.33.713219.41.11.8143.416.82
F1-777.520.81.115.81.10.34.016521.31.43.7137.514.62
Max98.023.11.318.81.30.44.418323.31.45.4143.419.83
Min56.312.60.79.10.60.23.19517.81.01.841.914.32
Mean78.719.81.014.81.00.33.5131.320.61.23.697.216.59
MPH (%)2.548.421.880.944.013.310.3-27.86.47.47.651.1
HPH (%)-19.332.010.080.423.5-9.65.5-33.94.26.9-16.58.1
SD11.623.510.173.600.230.060.4430.821.750.121.1932.05
CV (%)14.7817.7417.2824.3223.5517.4712.6123.478.5010.2833.1132.98
PH: Plant height; LL: Leaf length; LW: Leaf width; FLL: Flag leaf length; FLW: Flag leaf width; CD: Culm diameter; CN: Culm number; TN: Tiller number; PL: Panicle length; AL: Awn length; 1000-SW: 1000-seed weight; SS: Seed shattering degree; C.VV: C.V between varieties; MPH: mid-parent heterosis; HPH: higher-parent heterosis; SD: standard deviation.
Table 7. Results achieved by Elymus (Elw), Pseudoroegneria (Ps), Leymus (Lt) and E. sibiricus (ES) EST-SSR markers, all detected in two parents and seven F1s.
Primer IDBands InformationBSYFBSZFBEPPBEPF
TMTP% PPIC
Elw0300s01932133.330.150000
Elw0669s043909100.000.423600
Elw1197s06962466.670.303000
Elw1420s081404100.000.420102
Elw1468s087909100.000.381500
Elw1675s09281787.500.300201
Elw2676s14691888.890.330400
Elw2698s15291888.890.340000
Elw2807s15995444.440.142100
Elw2808s16041375.000.353000
Elw3264s18471685.710.372200
Elw3384s18761583.330.412002
Elw3492s19074342.860.160100
Elw3995s22653240.000.080100
Elw4419s2614400.000.000000
Elw5447s30661583.330.310001
Elw5616s3931711694.120.401700
Elw5627s40410010100.000.393100
Ps2283505100.000.441003
Ps26193666.670.254011
Ps344754120.000.041000
Ps357742250.000.100110
Ps93886225.000.091000
Ltc020981787.500.312200
Ltc009653240.000.171000
ES-73300.000.000000
ES-226600.000.000000
ES-2343125.000.050010
ES-5181787.500.380400
ES-974400.000.000000
ES-12375228.570.100100
ES-1255500.000.000000
ES-14454120.000.071000
ES-2314400.000.000000
ES-23654120.000.040000
ES-253116545.450.131001
ES-259808100.000.410202
ES-3107700.000.000000
ES-3473300.000.000000
ES-4051100.000.000000
Mean6.42.63.959.920.200.81.00.10.3
Total257103154 3241313
T, total number of amplified bands; M, number of monomorphic bands; TP, total number of polymorphic bands; % P, percentage of polymorphism; PIC, polymorphic information content; BSYF, bands shared by Y1005-1 and F1s; BSZF, bands shared by ZhN06-1 and F1s; BEPP, bands exclusively present in the parents; BEPF, bands exclusively present in F1s.

