2. Materials and Methods
Dimethyl sulfoxide, n-octanol, mebendazole, Cremophor ELpH-range 6.0–8.0, naproxen, and amoxicillin were purchased from Sigma Aldrich (Steinheim, Germany). Methanol, acetonitrile, and water were HPLC grade, and the sodium hydroxide, phenolphthalein, monobasic sodium phosphate, phosphoric acid, and potassium biphthalate were obtained from J.T. Baker (J.T. Baker, Co., Center Valley, PA, USA). Clofibric acid (Compound 2) was purchased from Sigma Aldrich (Steinheim, Germany). Compound 1 was synthesized in the Medicinal Chemistry Laboratory of the Pharmacy Faculty, Autonomous University of the State of Morelos (Universidad Autónoma del Estado de Morelos, or UAEM), Mexico.
2.1. Physicochemical Evaluations
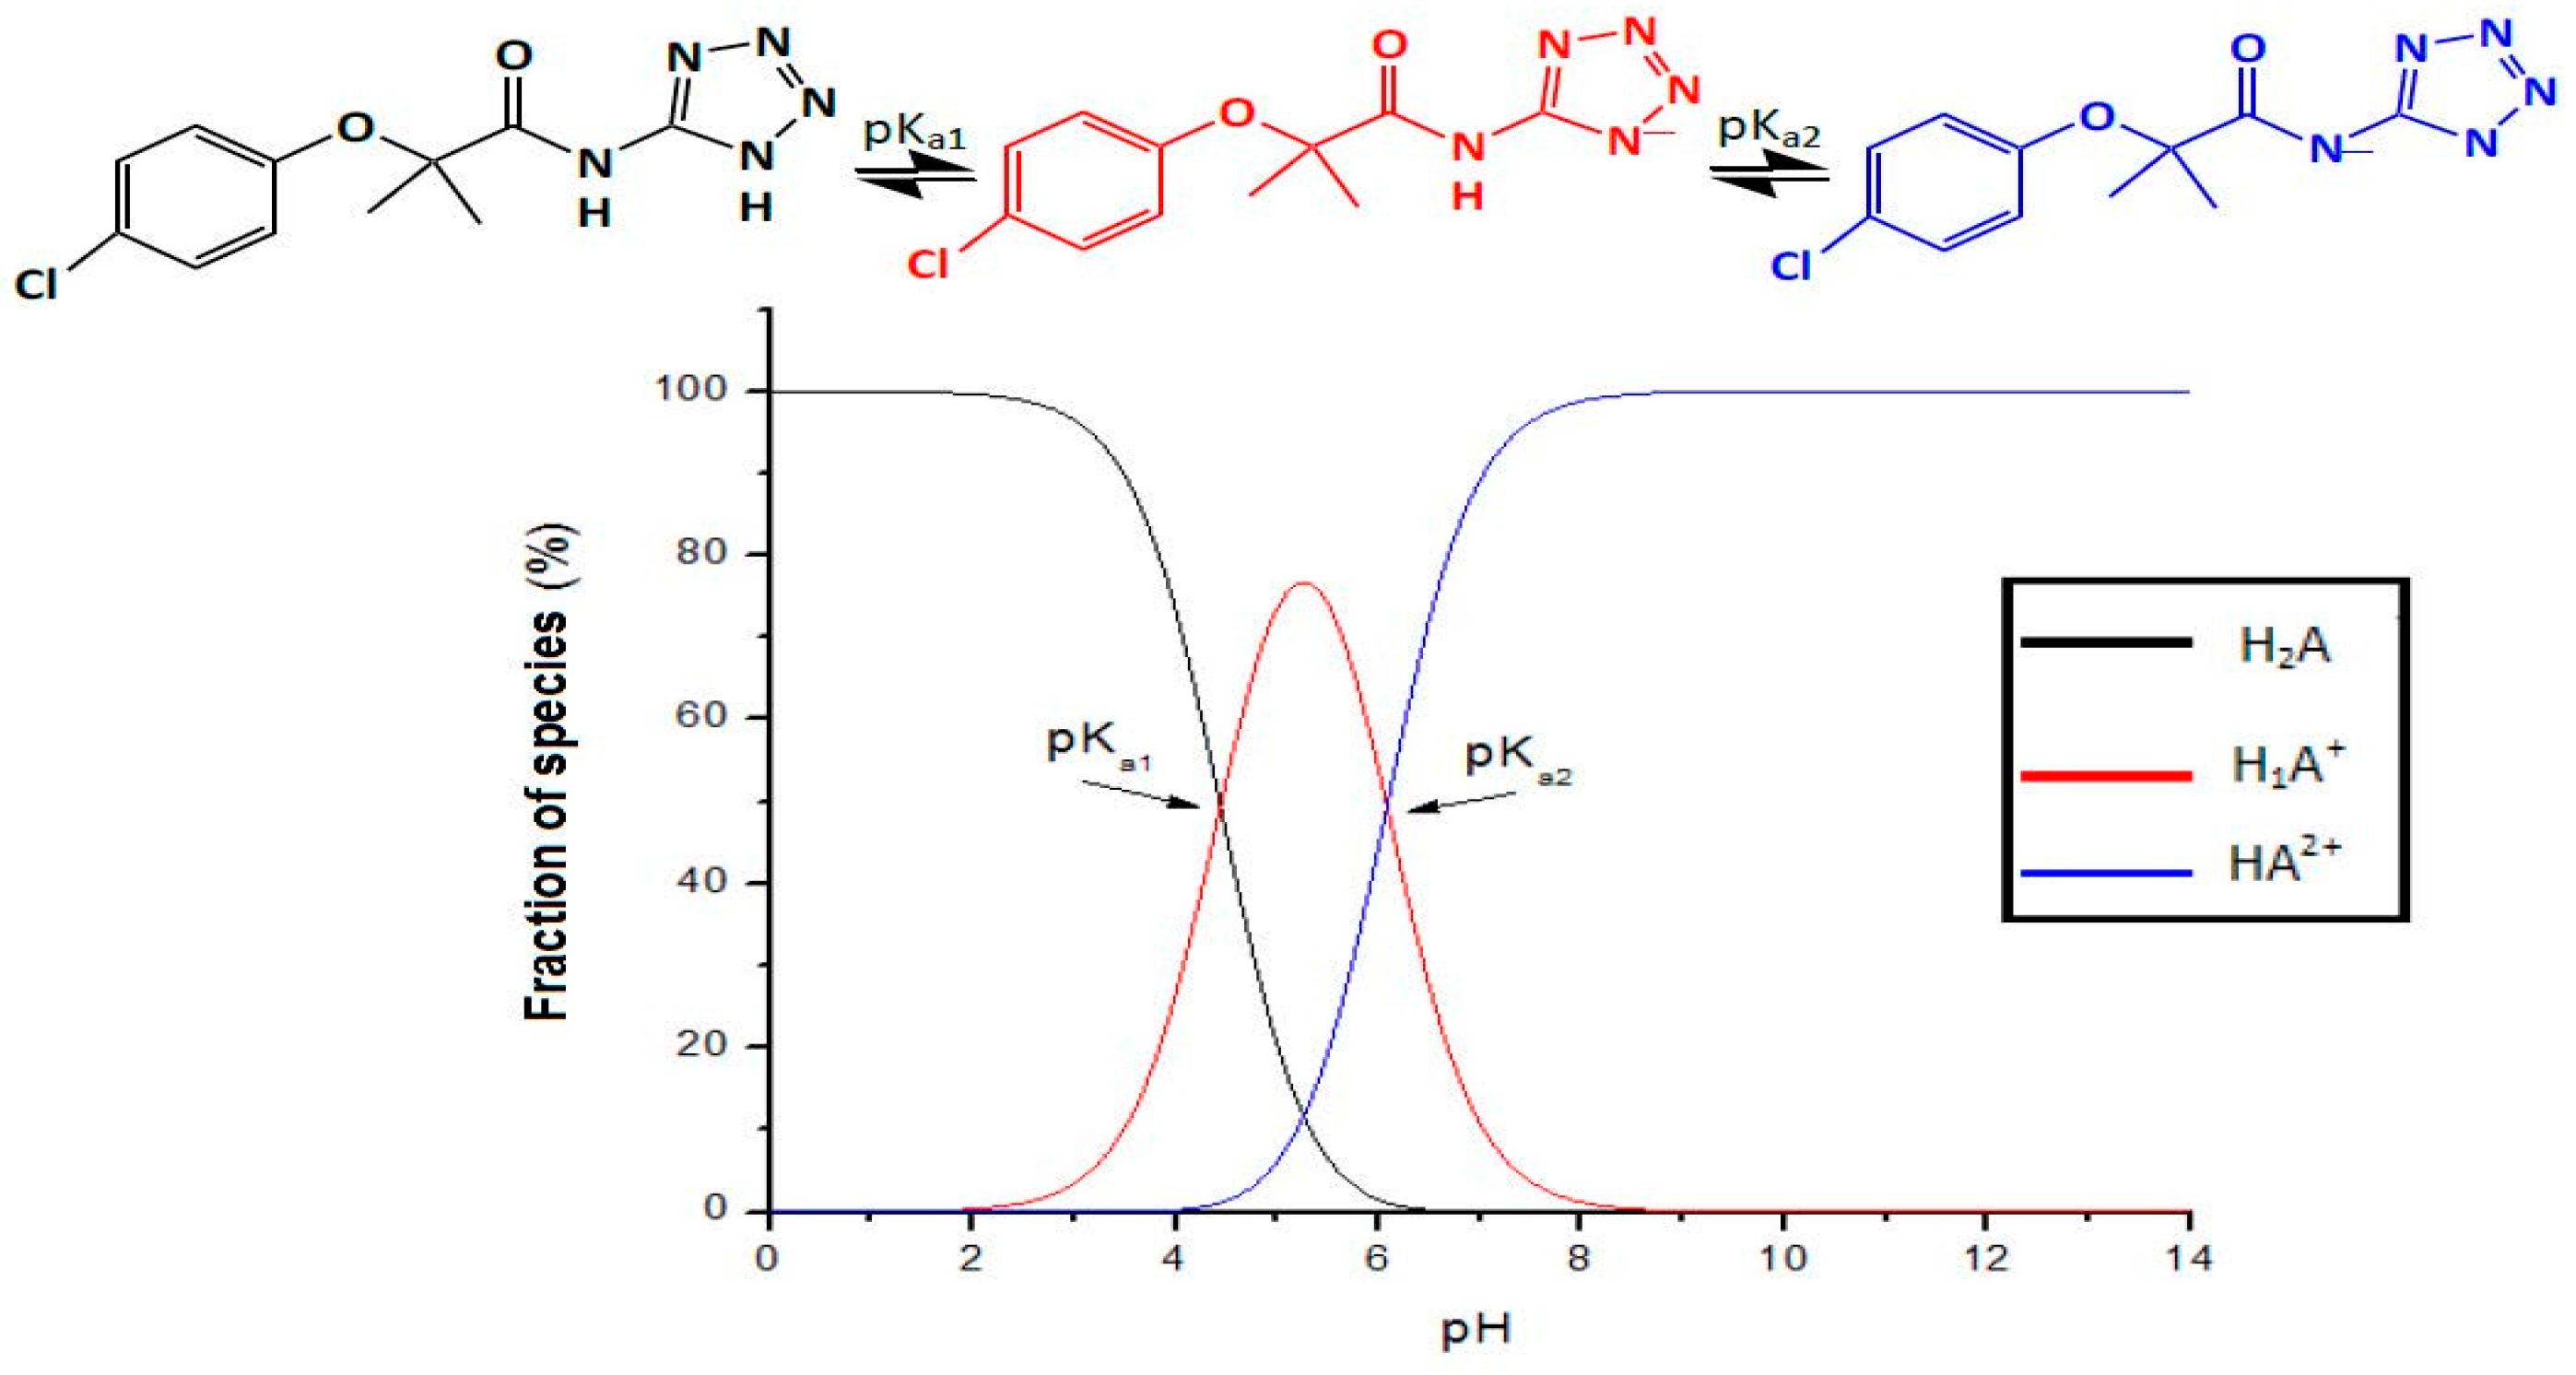
2.1.1. pKa Determination via Potentiometric Analysis
The determination of p
Ka was undertaken as described by Babic A. et al. [
18,
20]. Compound
1 was prepared by weighing 0.001 equivalents, which were dissolved in the minimum volume of methanol, to which aqueous solution with an ionic strength of 0.02 M was added to obtain a final concentration for Compound
1 of 0.006 M. It was titrated with NaOH 0.01 N, which had been previously evaluated with an ionic strength of 0.02 M using Logger Pro 3.5.0 software (Vernier Software & Technology, Beaverton, OR, USA). The study was conducted in triplicate, determining the final points using the criteria from the first and second derivative test [
21].
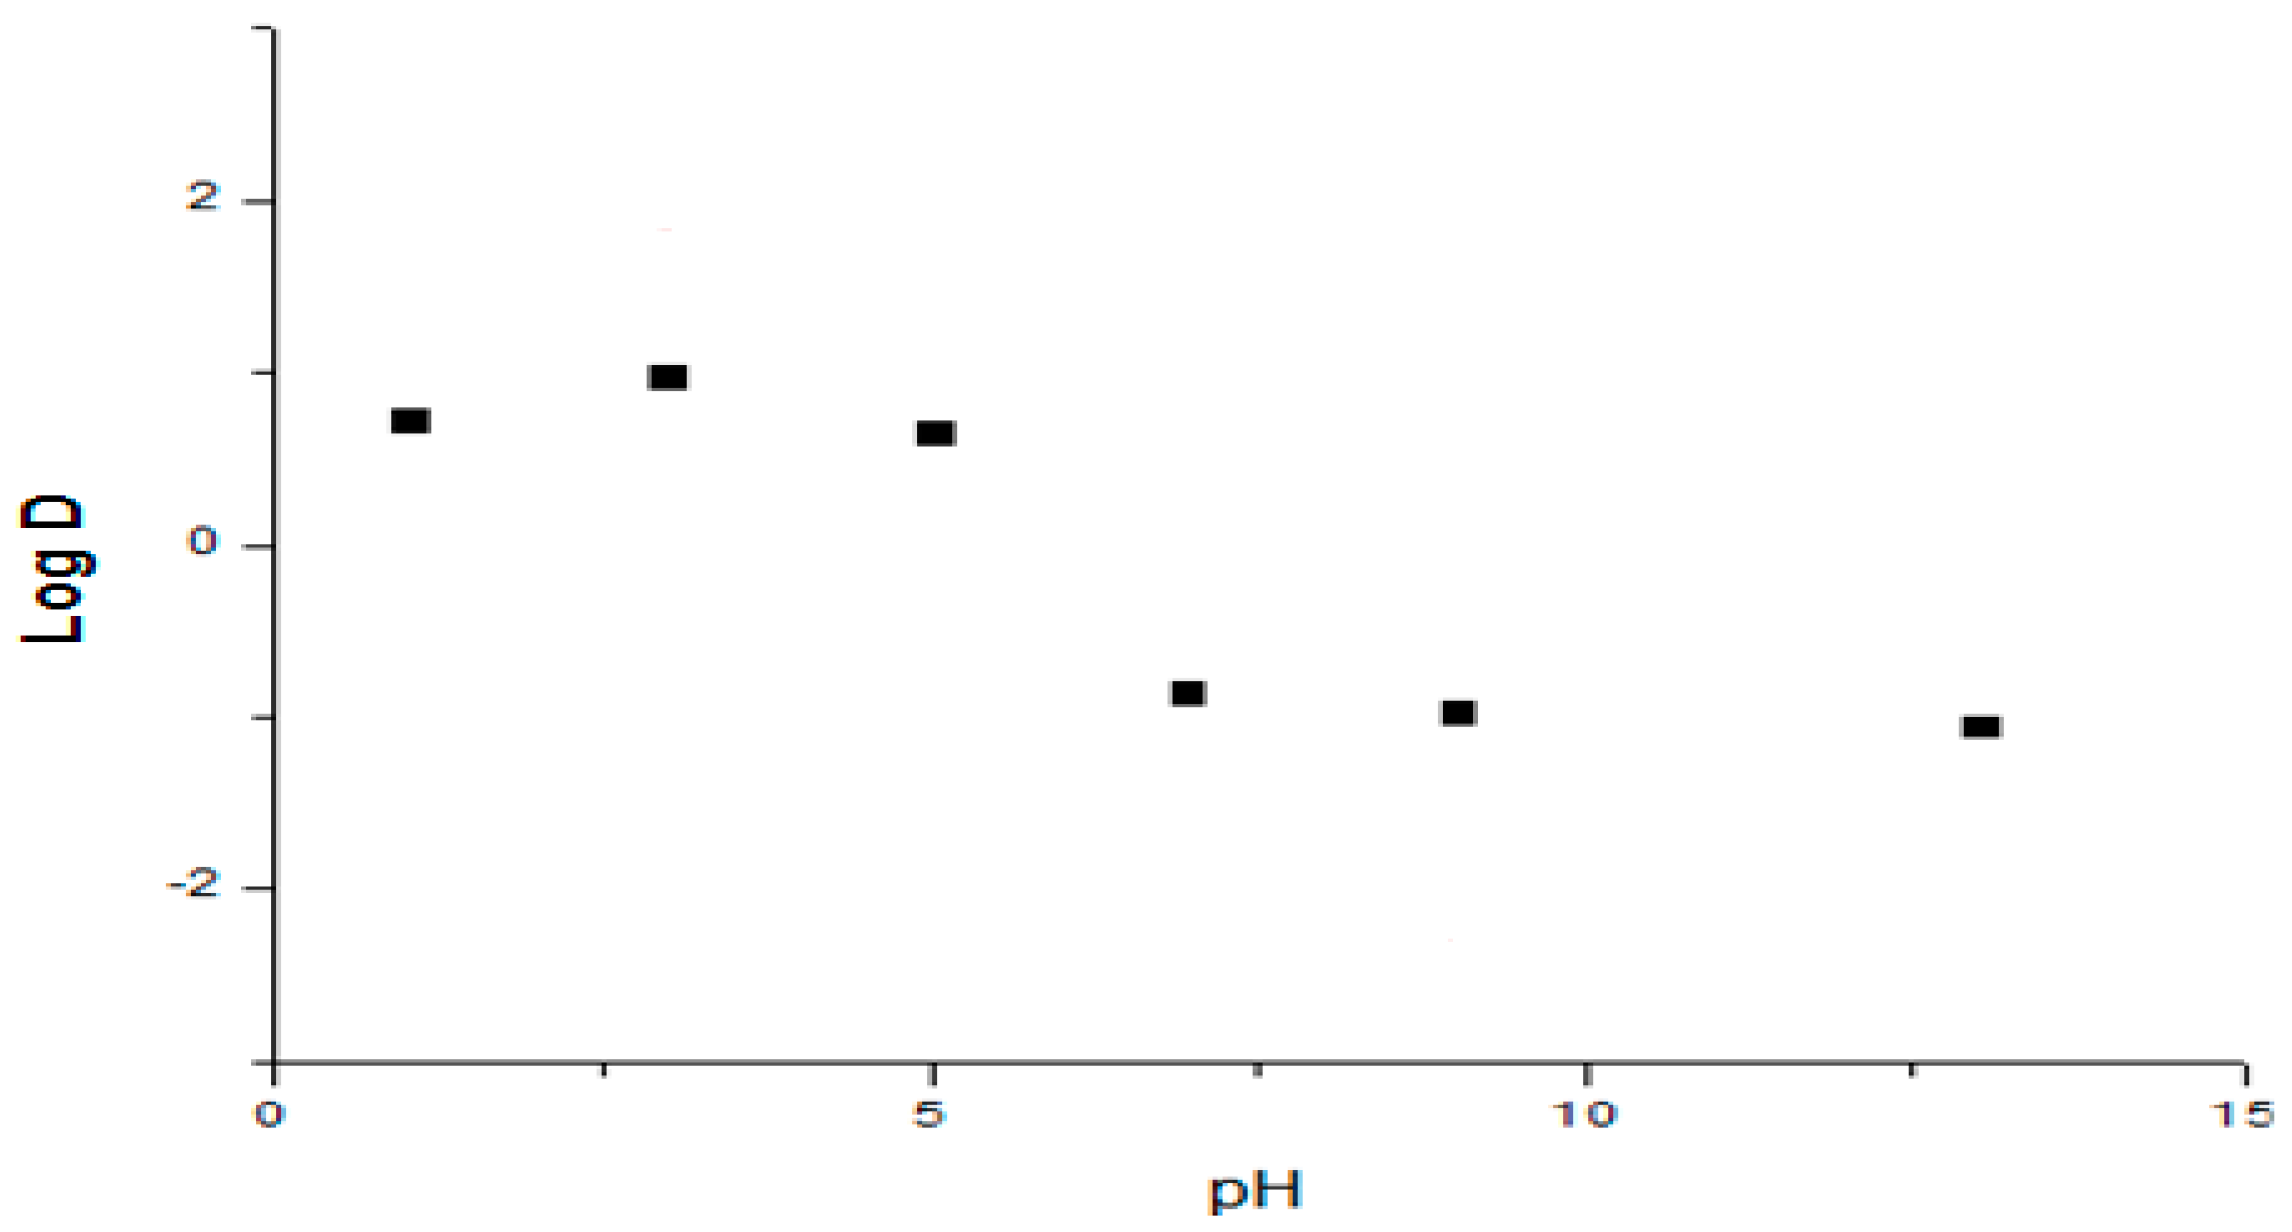
2.1.2. Apparent Partition Coefficient
The octanol-water distribution coefficient was determined using the shake-flask method. The two phases were mutually saturated by shaking for 15 min. Phosphate buffers were used as the aqueous phase for the pH range 1.2 to 13. 5 mL portions of different buffer solutions (pH 1.2 to 13) containing 100 μg/mL of Compound
1 were mixed with 2.5 mL of
n-Octanol. The mixture was shaken for 30 min, centrifuged at 8000×
g for 10 min, after which the aqueous and organic phases were separated. Aqueous samples were analyzed at 222 nm using a validated spectrophotometric method (5–200 μg·mL
−1) [
22,
23,
24]. The distribution coefficient (log D) was calculated according to Equation (1) for each pH value:
where
[Compound]org is the drug concentration in the organic phase (determined by mass balance) and
[Compound]aq is the drug concentration in the aqueous phase for each buffer solution. Every experiment was evaluated in triplicate.
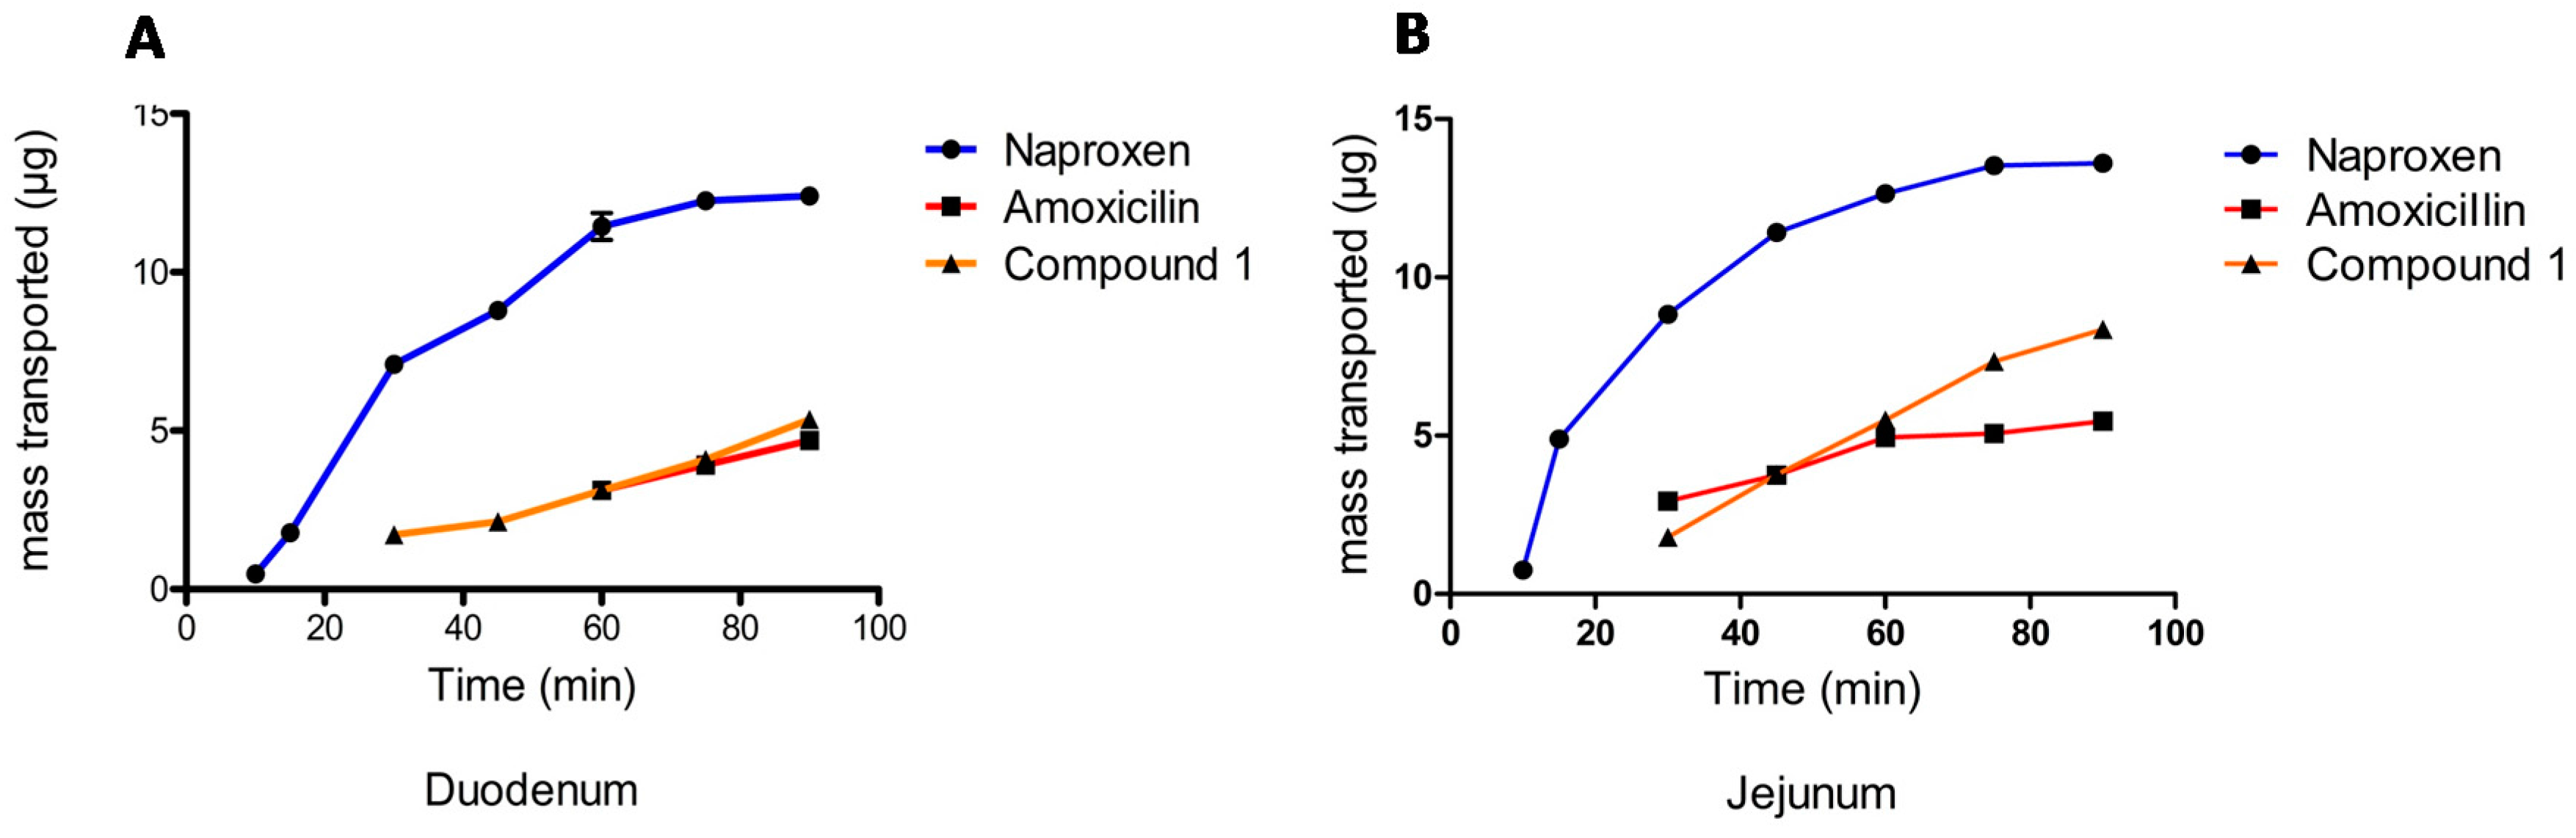
2.1.3. Permeability Assay
Male Wistar rats weighing 200–250 g were used in this research. Everted intestinal sacs were prepared by quickly removing the small intestine from starved rats killed under ether anesthesia. All experiments were carried out after pre-incubation at 37 ± 0.5 °C, with the duodenum and jejunum then excised, flushed-through several times with saline solution at room temperature, and placed immediately into simulated intestinal fluid (SIF). The intestine was gently everted over a steel rod and filled with fresh SIF. The sacs were preincubated in oxygenated buffer solution for 5 min and then placed in 100 mL of oxygenated SIF solution containing 0.0001 M (100 μM) of Compound
1 at 37 °C. Oxygen was bubbled with a pump to maintain viable tissue [
25].
The everted intestinal sac was filled with 1.5 mL of SIF solution, while a test compound solution (0.0001 M) remained external to the everted sac. The high and low permeability markers, naproxen and amoxicillin, were prepared in the same way [
26]. 300 μL samples were collected from inside the sac with a metallic cannula at 5, 10, 15, 30, 45, 60, 90, and 120 min (apical-basolateral transport A-B), after which a medium replacement was made. Both an initial and final sample of the outside solution were analyzed by HPLC.
The apparent intestinal permeability (
Papp) was calculated according to Equation (2):
where
Papp = Apparent Permeability (cm/s),
V = Intestinal Volume (mL),
A = Surface Area (cm
2),
dC/dt = Concentration Gradient, and,
Co = Initial Concentration (μg/mL).
2.2. Chromatographic Conditions
The samples of Compound 1 were analyzed using a Waters chromatographic system equipped with a 717 plus auto-sampler, a model 515 isocratic pump, and a model 2487 UV-Vis detector. The software used was N2000 Chromatostation. The separation was performed on a 4.6 × 250 mm Zorbax CN (Agilent technologies, Santa Clara, CA, USA). The mobile phase consisted of phosphate buffer (0.05 M, pH 3.5) with 0.06% ethanol and methanol HPLC grade (64:36), filtered through 0.2 μm Nylon membrane (Nylaflo™) from PALL Corporation (Washington, NY, USA) and sonicated for 30 min. The flow rate was 1.0 mL/min. The column was kept at room temperature. Total run time was 25 min, with the detection carried out at 223 nm. The injection volume was 10 μL.
2.2.1. Calibration Curve
A methanol solution of Compound 1 and clofibric acid (Compound 2) was prepared to a final concentration of 100 μg/mL (working solutions). The calibration curves were prepared using appropriate volumes of Compound 1, Compound 2, and rat plasma to obtain the following concentrations: 0.46, 0.93, 3.75, 7.5, 15, 30 μg/mL (Compound 1); and, 0.78, 1.56, 6.25, 12.5, 25, and 50 μg/mL (Compound 2), simultaneously. Internal standard (mebendazole) was prepared at a concentration of 20 μg/mL (IS working solution).
2.2.2. Sample Preparation
100 μL of plasma containing Compounds 1 and 2 at different concentrations were transferred to Eppendorf tubes, with 10 μL of IS working solution, 100 μL 1% solution phosphoric acid then added. Samples were shaken in a vortex for 30 s. Strata-X 33 μm cartridges (Polymeric Reversed Phase, 30 mg, Phenomenex) were conditioned with 2 mL of methanol and 1 mL of water, with the sample in the cartridge then left to stand for 2 min and immediately washed with 1 mL of a 95:5 water methanol solution. Finally, the sample was eluted four times with 500 μL of a 50:50 methanol acetonitrile solution. Samples were evaporated under atmospheric nitrogen at 40 °C. The waste reconstituted in methanol and 10 μL was injected into the HPLC.
2.3. Analytical Method Validation
The analytical method was validated in plasma using the following parameters: selectivity, linearity, precision, accuracy, absolute recovery, and LOQ [
27].
2.3.1. Selectivity
Blank plasma samples from different rat sources were prepared as previously described, to check for signals that might interfere with the detection of the analytes (Compound 1 and Compound 2) or the IS. Additionally, the blank sample (a processed matrix sample without analyte and without IS) and a zero sample (a processed matrix with IS) were analyzed.
Also, specificity was demonstrated by comparing samples containing Cremophore EL and Heparine 10 UI/mL.
2.3.2. Linearity
The calibration curve was prepared in triplicate on two different days and the data analyzed as described above. The area ratio of Compound 1/IS peaks (AR) was calculated. The linearity was determined between the 0.46–30 μg/mL recorded for Compound 1 and the 0.78–50 μg/mL recorded for Compound 2, with the linear regression parameters as determined were the confidence intervals for slope and intercept.
2.3.3. Precision and Accuracy
Aliquots of blank plasma were spiked with the corresponding volume of Compound 1 working solution and metabolite to obtain quality control (QC) samples containing 1.5 μg/mL (LQC), 18 μg/mL (MQC) and 24 μg/mL (HQC). For precision, the quality control samples were prepared in quintuplicate on two different days. Repeatability and reproducibility were calculated and expressed as RSD%. The within-run and between-run RSD% values were not to exceed 15% for each QC level. For accuracy, the QC samples were analyzed against a freshly calculated calibration curve, with the obtained concentrations compared with the nominal value. The accuracy was reported as a percentage of the nominal value. The mean concentration was to be within 15% of the nominal values for the QC samples.
2.3.4. Extraction Efficiency
The efficiency of the extraction method was determined by comparing the plasma QC samples with aqueous QC solutions at corresponding levels for Compound 1 and Compound 2 to compare recovery, and measured in triplicate in the same analytical batch. Extraction efficiency was expressed as a percentage of the nominal concentration.
2.3.5. Limit of Quantification (LOQ) and Limit of Detection (LOD)
The LOQ for the proposed methods was established through the analysis of the blank samples containing the lowest concentration level on each curve for every compound, determined experimentally by analyzing six replicates with suitable precision and accuracy (RSD < 20%).
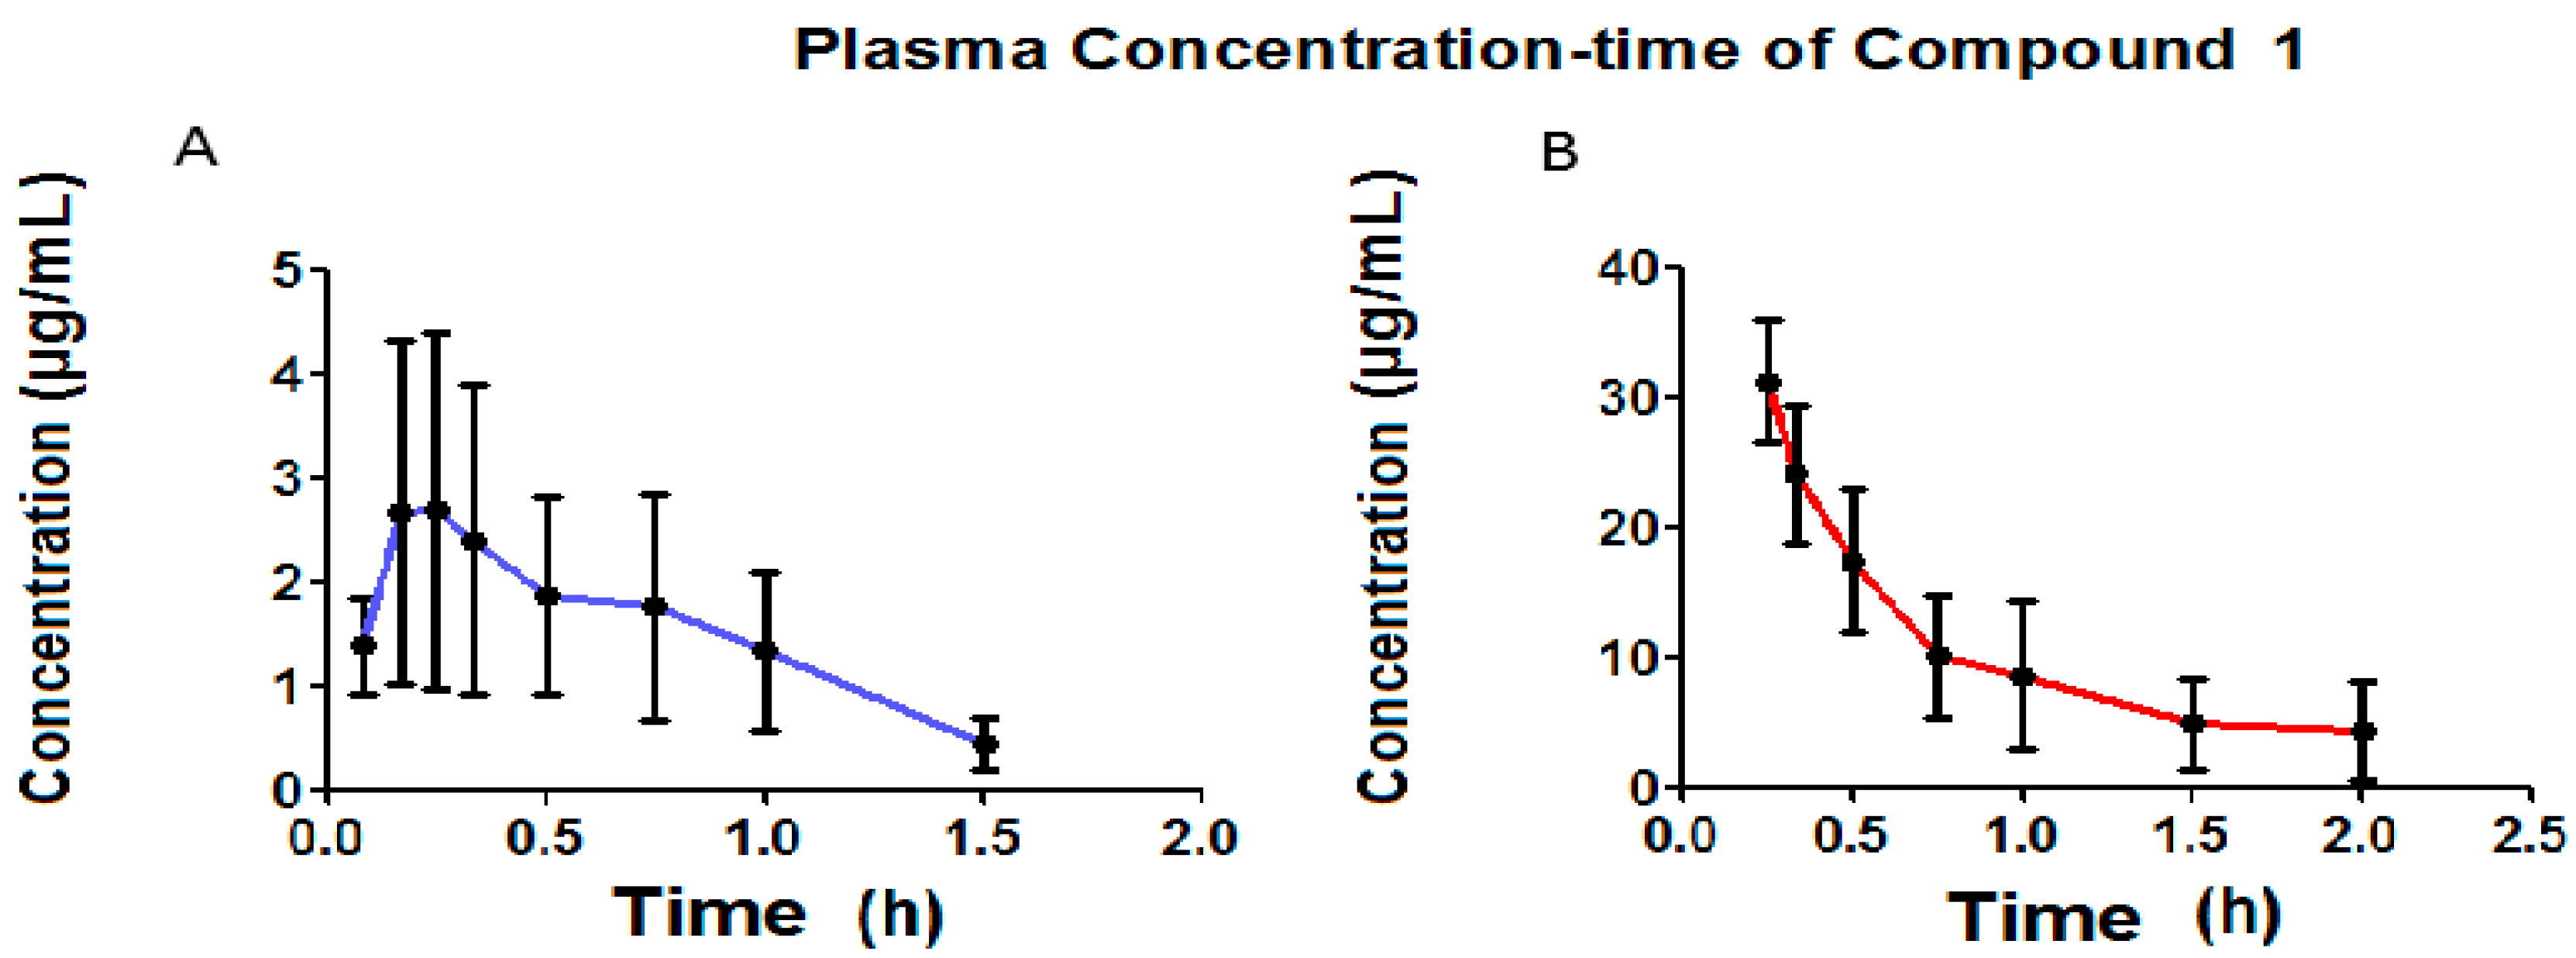
7. Bioavailability Evaluation
Figure 7 presents the pharmacokinetic profiles of Compound
1 after the oral and intravenous administration of a single 50 mg/kg dose. The non-compartmental analysis is shown in
Table 5.
Figure 7 shows that, in orally administration, Compound
1 presents a C
max of 3.57 μg/mL, and that it was only possible to determine its plasmatic concentrations up to one hour after oral administration. Plasmatic concentrations were found up to two hours after intravenous administration.
Rapid absorption was observed for the oral administration of Compound
1, presenting a constant average absorption of 3.05 h
−1 and an average C
max of 3.57 μg/mL at 0.33 h. The average elimination rate constant for oral administration was 1.81 h
−1, while, for intravenous administration this was 1.21 h
−1, a difference which was not statistically significant using the
t-test for unequal variances (
p = 0.1410). The average distribution volume for oral administration is 419.4 mL, while this was 399.6 mL for intravenous administration, with neither administration pathways presenting a statistically significant difference (
p = 0.8296). With the average distribution expressed in L/kg due to the fact that it varies along with the animal’s body weight, the calculation of the relationship between distribution volume and body weight gives an average distribution volume for oral administration of 1.43 L/kg and 1.30 L/kg for intravenous administration, indicating a wide distribution of Compound
1 in the rat organism. Rodents (rat) have been reported to present a total blood volume of 64 mL/kg, giving 3.2 mL [
34] of total blood in a rat weighing approximately 200 g. This data shows that Compound
1 is widely distributed in the rat organism. Moreover, distribution volume is a constant parameter for a specific molecule. Compound
1 presents an average clearance (CL) of 751.2 mL/min for oral administration and 484.5 mL/min for intravenous administration, indicating a wide clearance in the rat organism. The clearance for Compound
1 for both administration pathways did not present statistically significant differences (
p = 0.2018). The bioavailability of Compound
1 was 10.4%, which suggests that the metabolism suffers due to the effect of the first step. The average ABC
0–α for oral administration was 2.58 (μg·mL/h), which is lower than the average ABC
0–α recorded for intravenous administration, 38.8 (μg·mL/h), indicating that a lower amount of Compound
1 reaches the central circulatory system via oral administration. Some pharmacokinetic parameters for fibrates, such as clofibrate, which generates clofibric acid (its active metabolite) with an average lifetime of 7–8 h reported in the rat [
35,
36] are very different to Compound
1, which presented an average lifetime of 0.71 h. It is likely that, in the future, Compound
1 could be used as a prodrug, in that it generates a metabolite with an average lifetime of 9 h, which is very similar to that reported for clofibric acid.
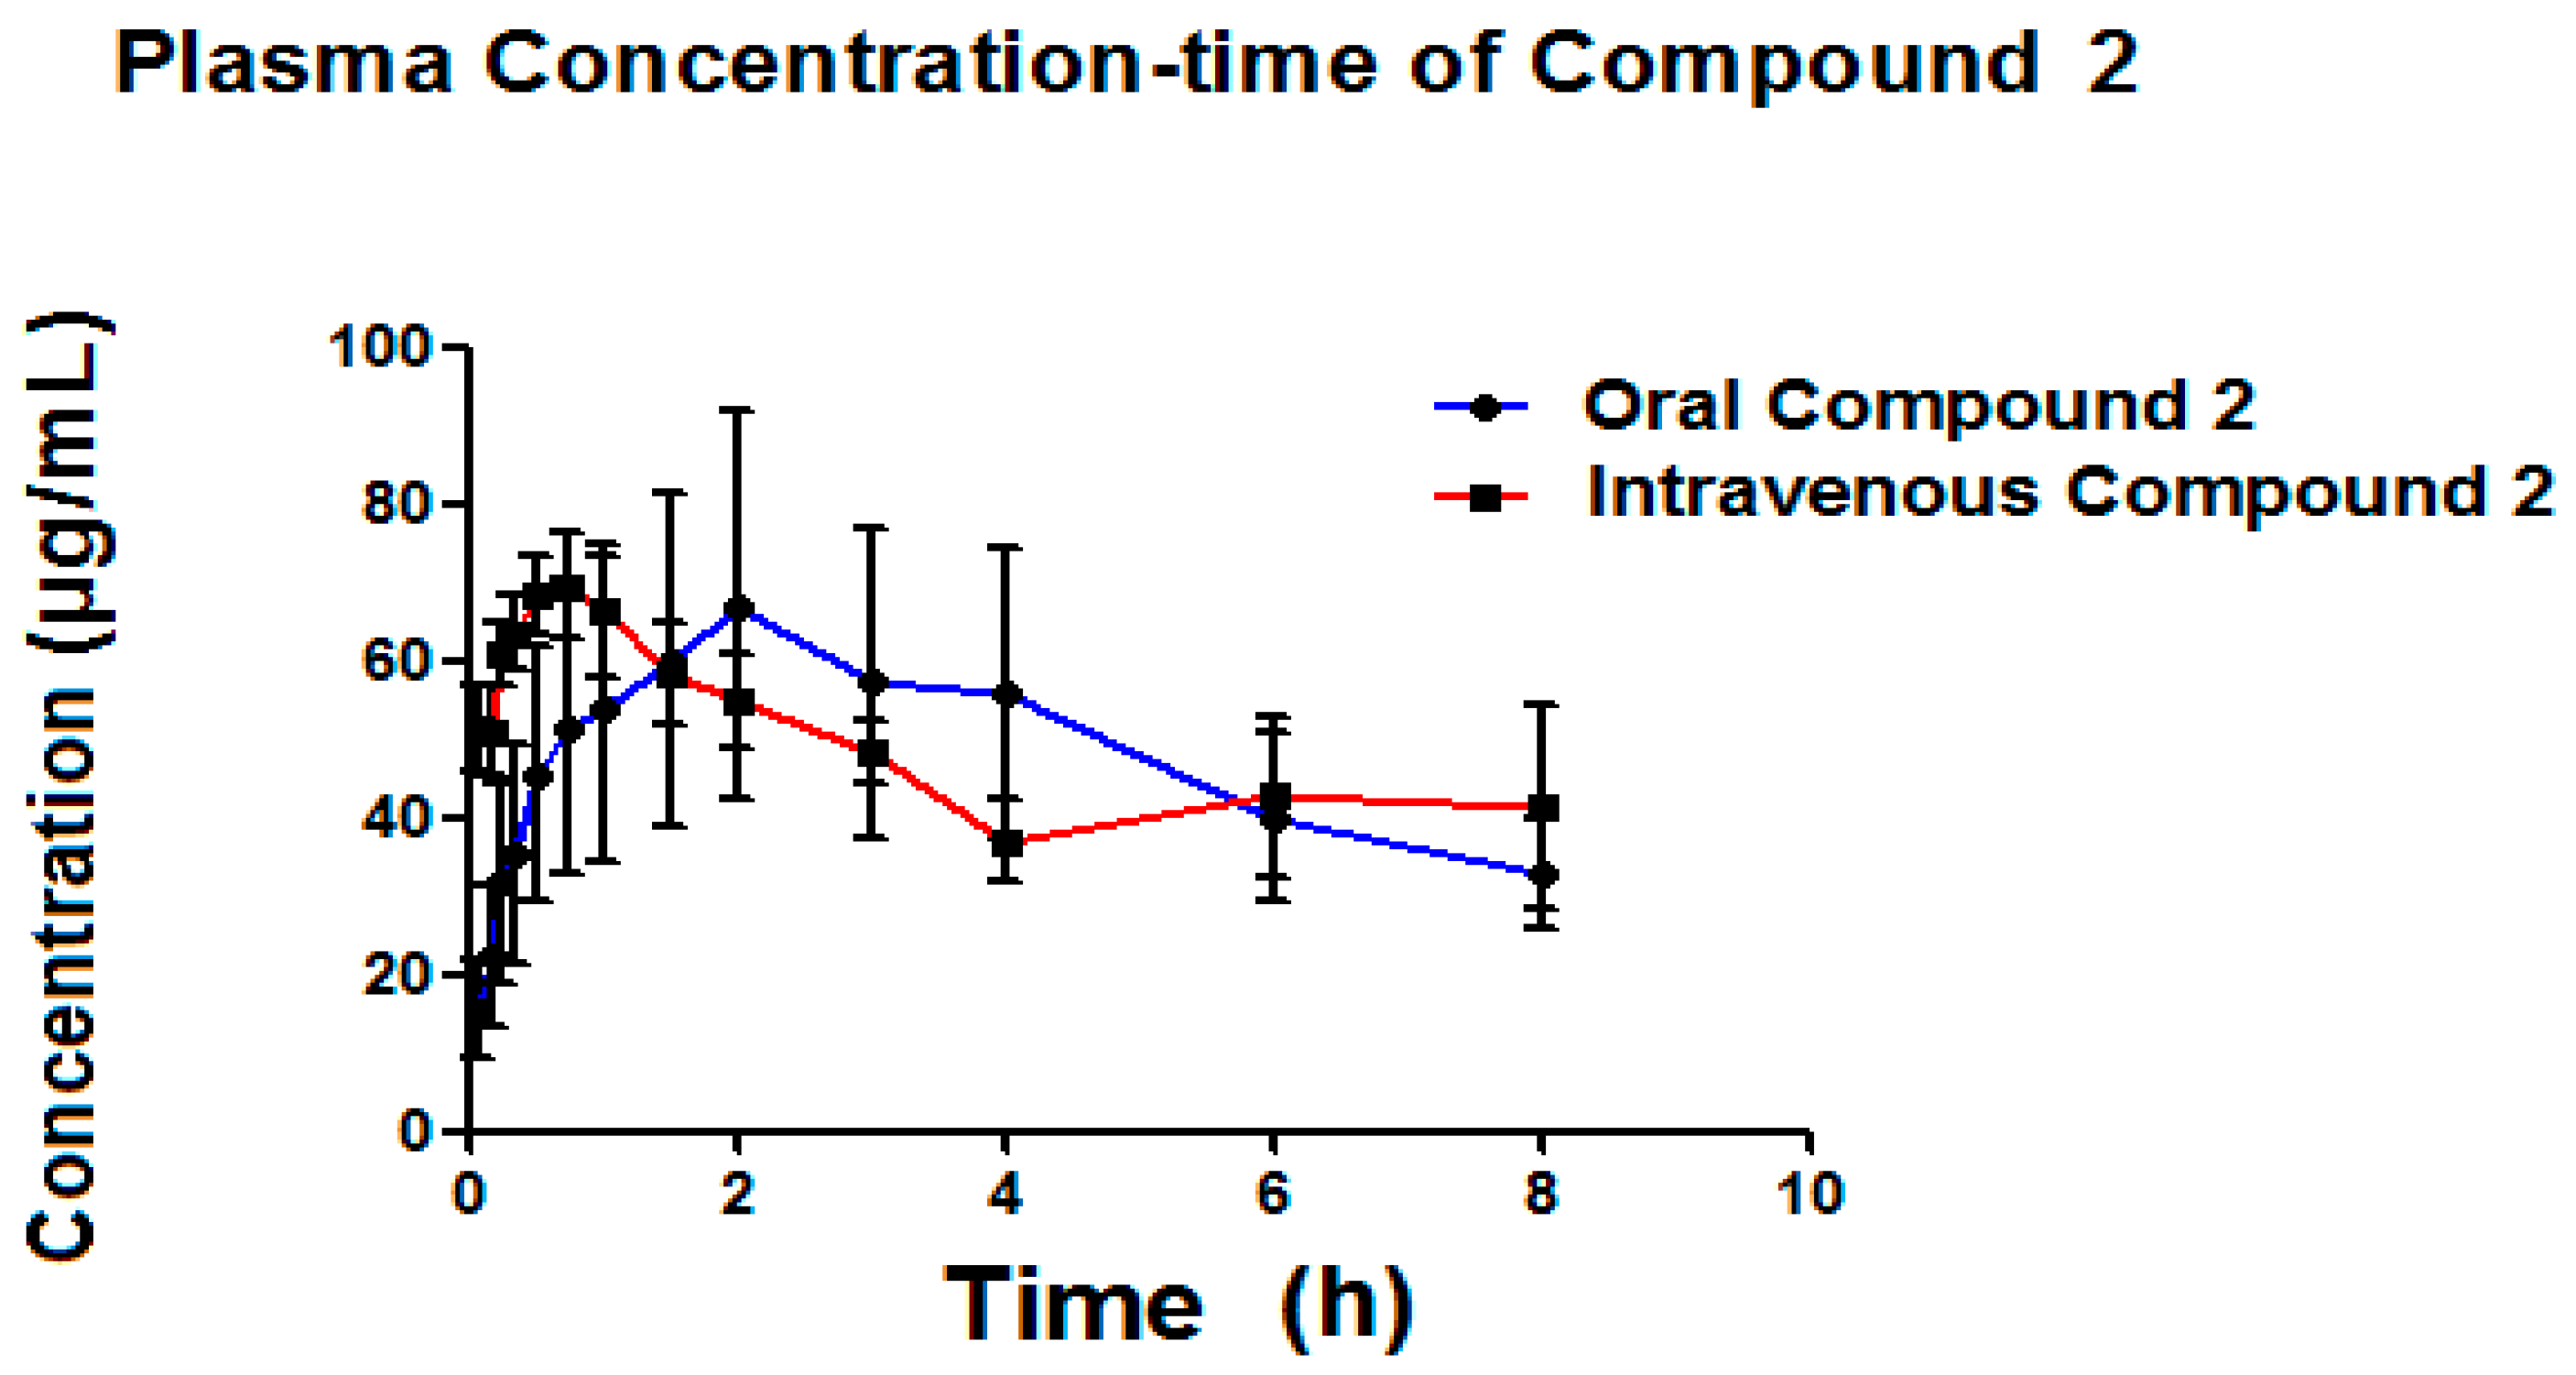
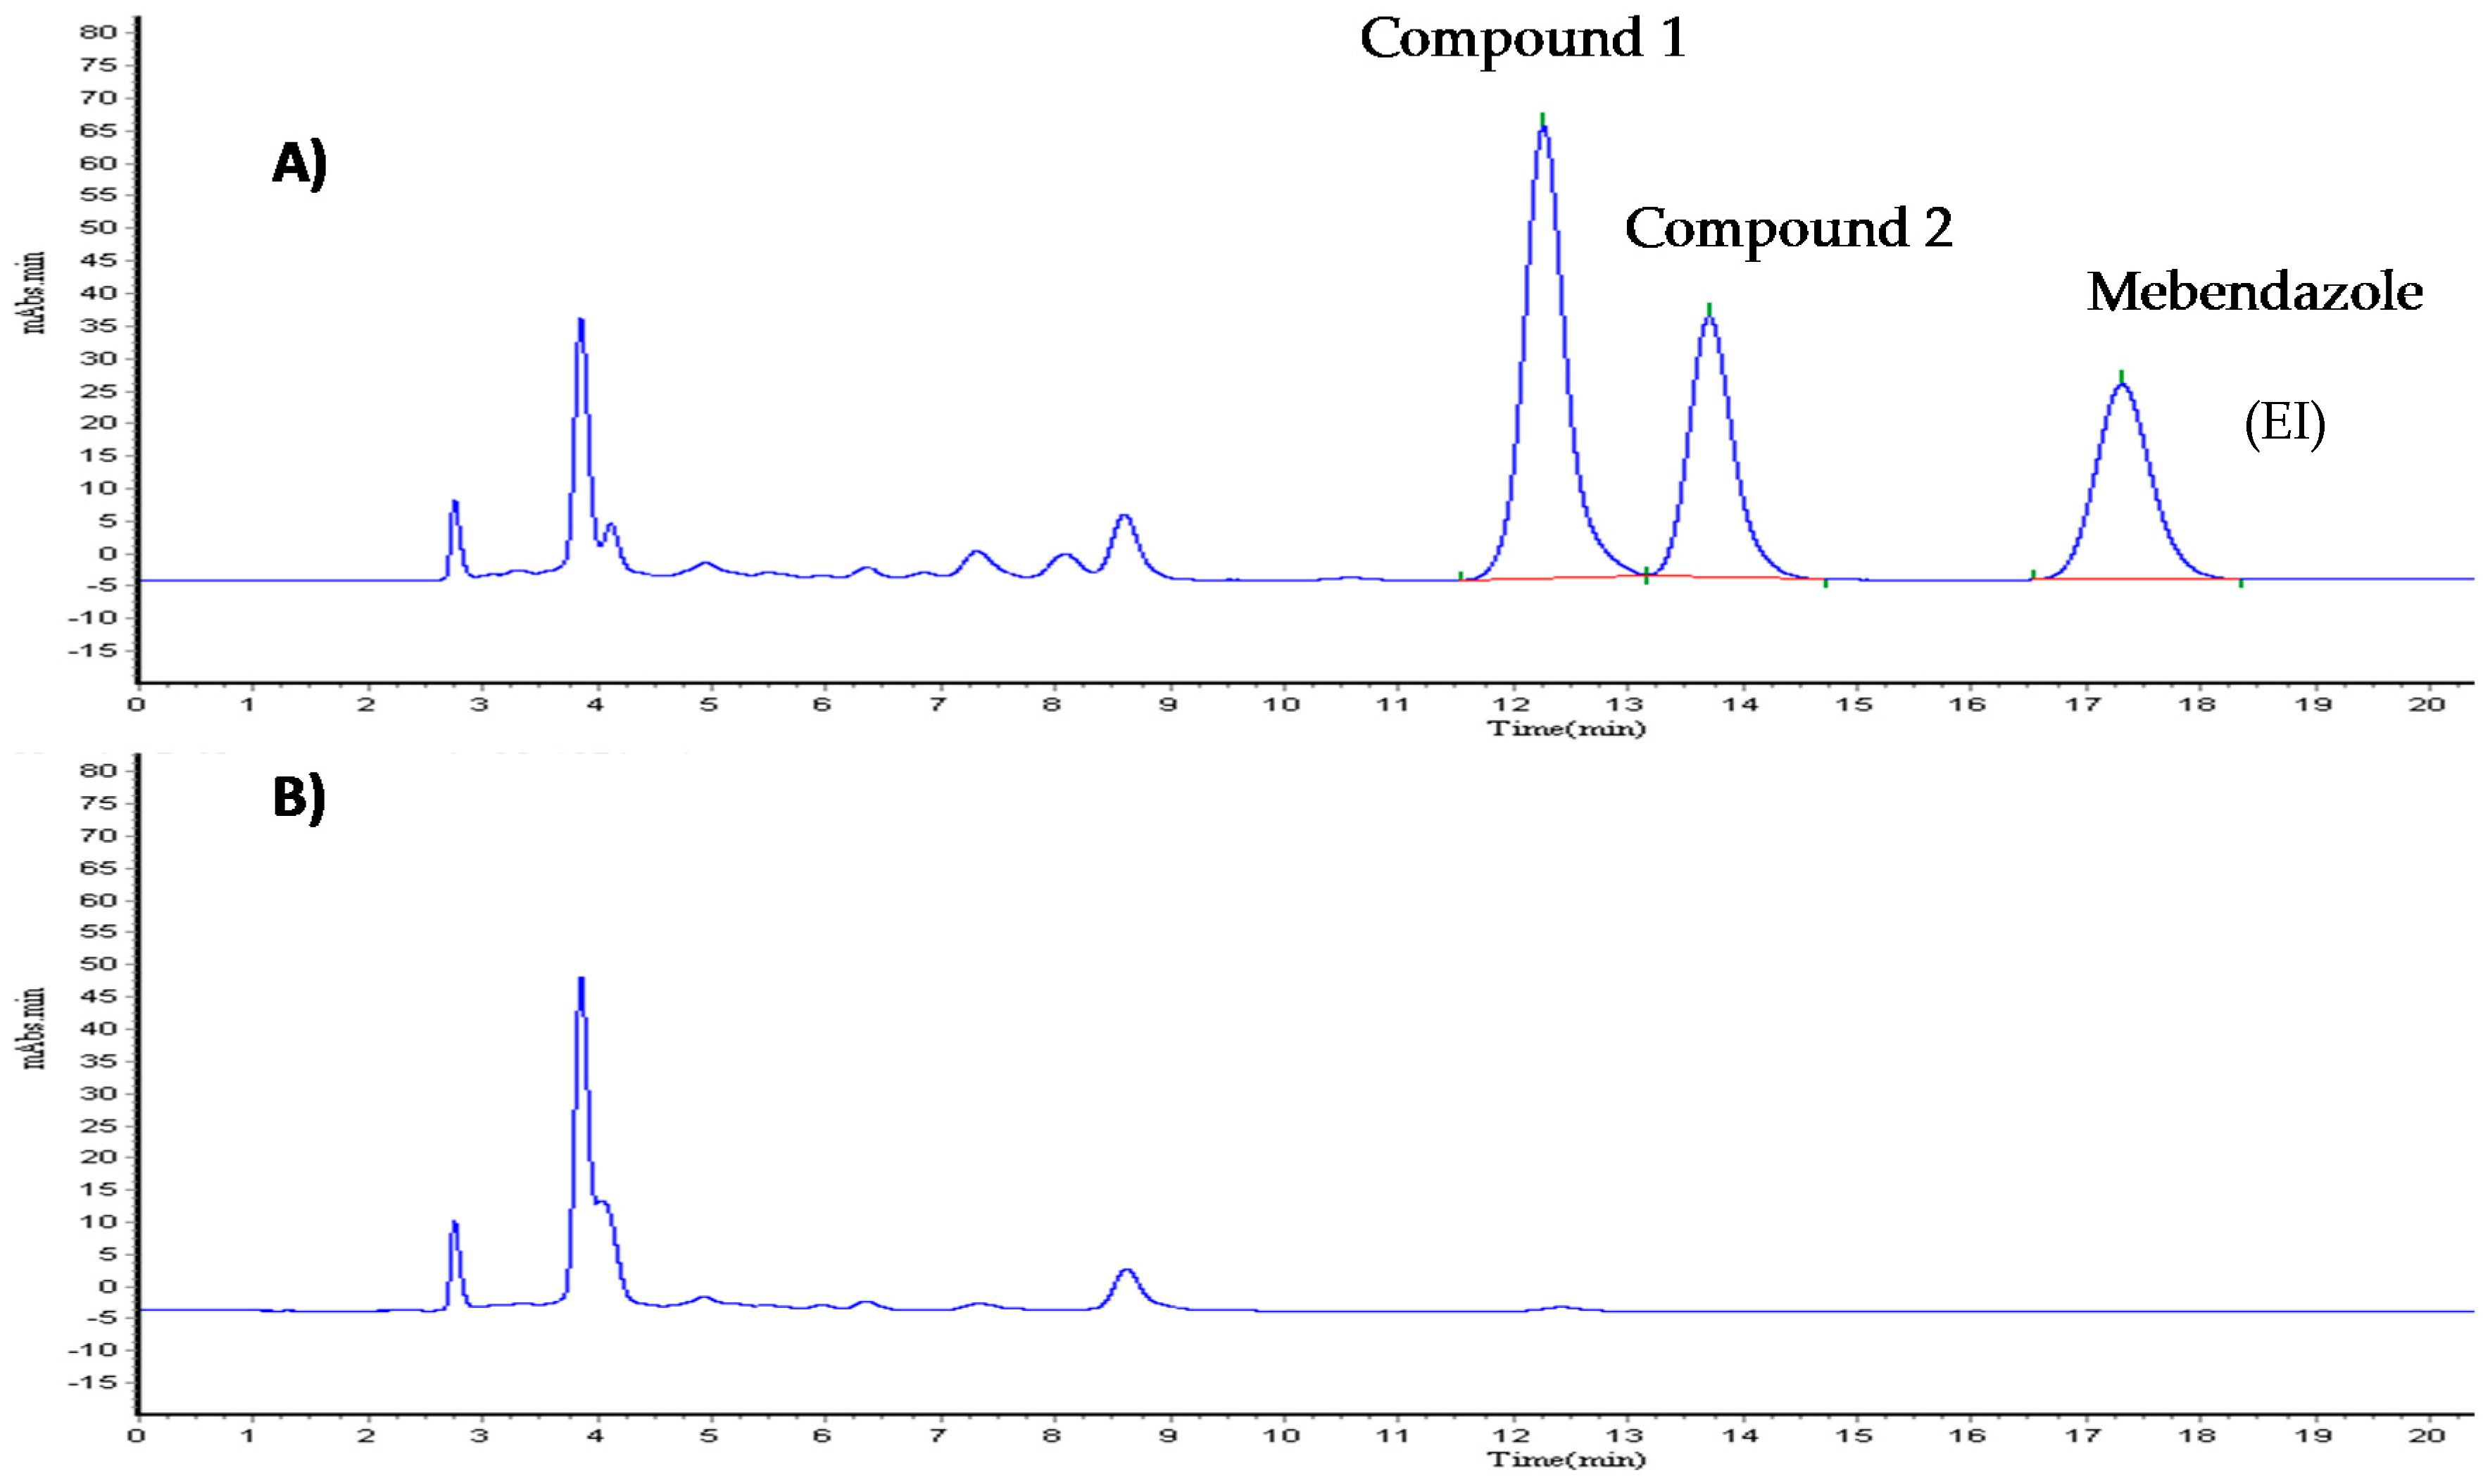
Table 6 presents the pharmacokinetic parameters of the Compound
2 (metabolite) (
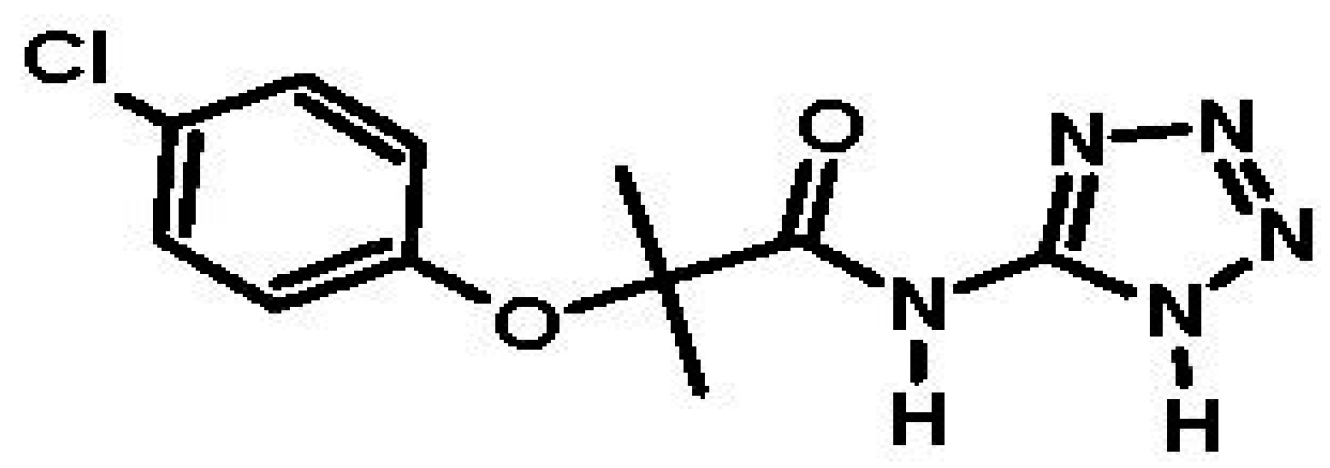
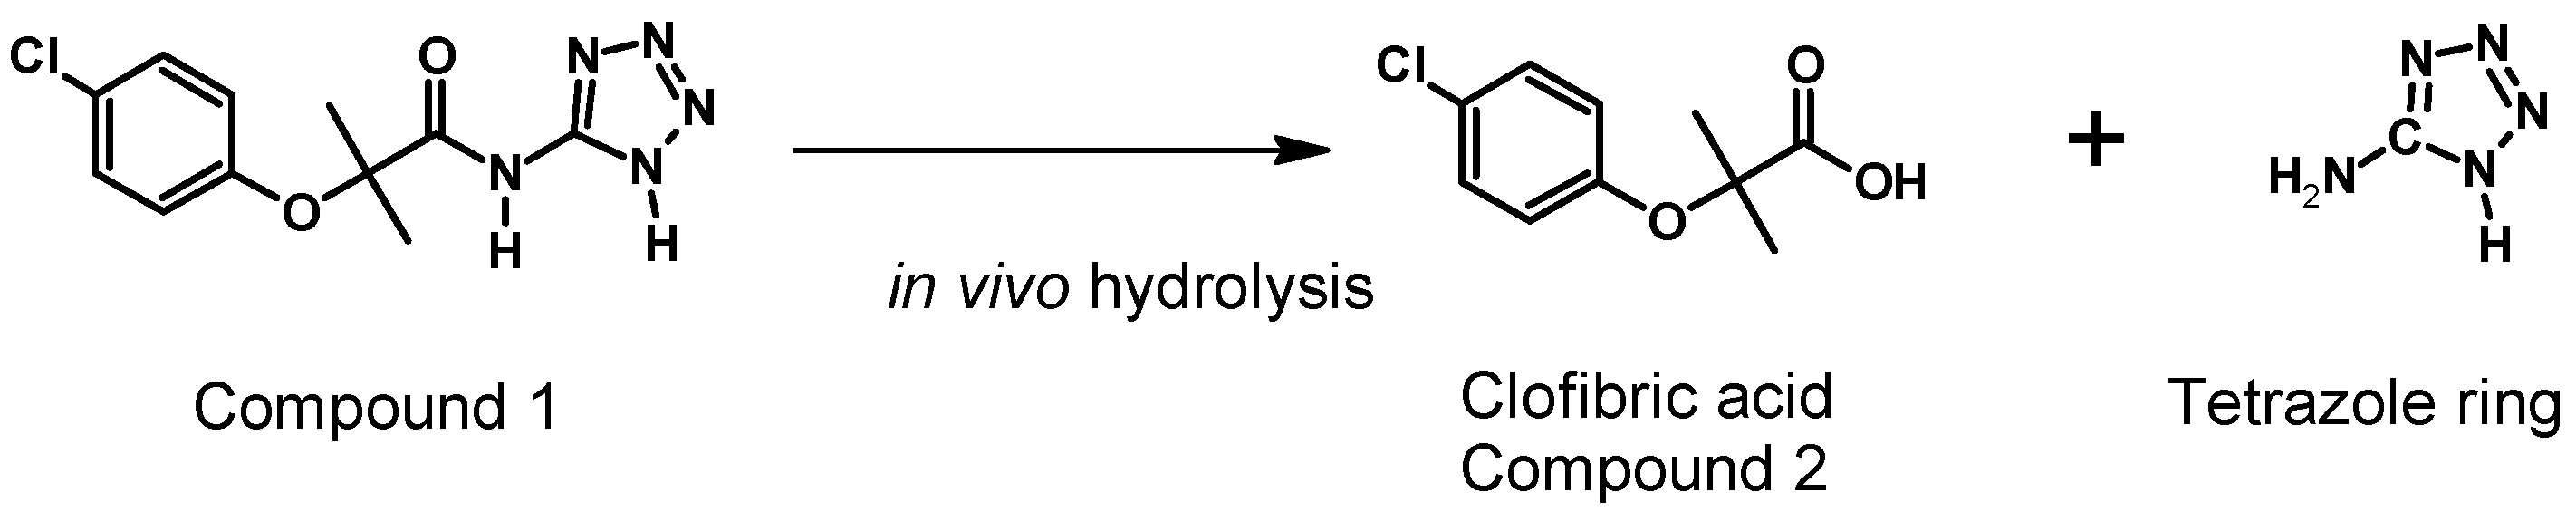
Figure 8) formed by both administration pathways (oral and intravenous). This Compound
2 is possibly associated with clofibric acid through the administration of a single 50 mg/kg dose of Compound
1, given that the metabolism of Compound
1 is thought to be principally related to enzymatic hydrolysis, as shown in
Figure 9.
As seen in
Figure 9, it was possible to detect, simultaneous to the analysis of Compound
1, the appearance of a Compound
2, which is possibly related to clofibric acid.
Certain parameters of the metabolite were able to be detected (
Table 6), such as: ABC
0–t, ABC
0–α, C
max, and T
max. It can be seen that the area below the curve for both metabolites is very similar, where, with intravenous administration, it can be seen that the metabolite is generated more quickly than with oral administration, indicating a higher plasmatic metabolism. The C
max for the metabolite obtained via intravenous administration is slightly higher (70.58 μg/mL) than the C
max obtained via oral administration (69.64 μg/mL), reinforcing the idea that Compound
1 is metabolized by the liver. The Compound
2, as generated via both administration pathways, is capable of maintaining itself in concentrations still quantifiable after more than 8 h (
Figure 8).
Table 6 presents the pharmacokinetic parameters obtained for the Compound
2. The elimination of constant of the Compound
2 (k
elm) generated oral pathway is 0.10 h
−1 on average, while for generated intravenous recorded an average of 0.11 h
−1, results which do not present a statistically significant difference in the
t-test (
p = 0.1143). The average elimination of constant of the Compound
2 (k
elm) generated via oral pathway (0.10 h
−1) is very similar to that reported for clofibric acid in the rat (0.11 h
−1) [
36]. The average lifetime for the Compound
2 when generated oral pathway is 9.24 h and 9.0 h for the intravenous pathway, results which do not present a statistically significant difference in the
t-test (0.1590). The average lifetime reported for clofibric acid administered orally in the rat is found to be within the range of 7–8 h [
36], which provides evidence that the Compound
2 originated is likely to be said compound. The average ABC
0–t for the Compound
2 originating from the oral pathway was 340.94 (μ/mL·h), and 386.98 (μ/mL·h) for the intravenous pathway, results which were not statistically different, according to the T-test (
p = 0.7317).
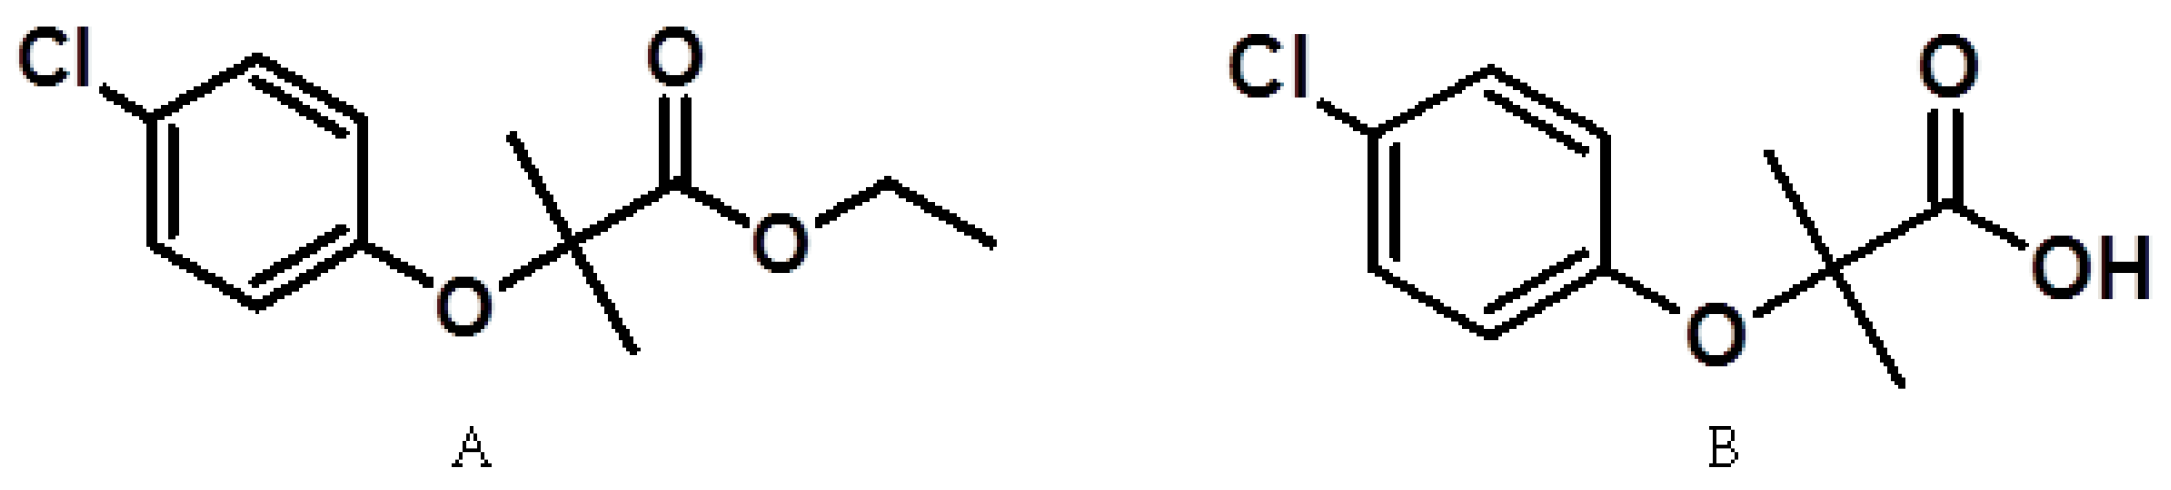
8. Conclusions
According to the results obtained, Compound
1 is a molecule of average polarity, with the non-ionized species formed having a pH lower than 5. It presents the behavior of a diacid and has a low permeability. However, its permeability is slightly higher than that shown by amoxicillin, the standard for low permeability. The average lifetime of its absorption was 3.05 h, while the elimination half-life was approximately 0.38 h, presenting a low level of bioavailability, with an average of 10.4%, generating a metabolite that is most likely to be clofibric acid. On appearing, said metabolite is responsible for the therapeutic effect, presenting an average elimination half-life of 9.24 h. This indicates that Compound
1 is a possible prodrug candidate, in that clofibrate is a liquid prodrug that is not very soluble in aqueous media and that generates its active metabolite, clofibric acid, via hydrolysis in vivo. This Compound
2 has a reported DL
50 of 940 mg/kg [
37] via oral administration in the rat, while, according to in silico predictions, Compound
1 has a DL
50 of 2200 mg/kg [
17] being a compound with a lower toxicity than clofibrate. It should also be noted that another advantage of Compound
1 is that it is a solid powder, making it easier to formulate than clofibrate. One of the disadvantages of Compound
1 is that, like clofibrate, it has little aqueous solubility, requiring it to be used in an adequate formulation in order to obtain optimal solubility for Compound
1 in aqueous media.


 ,
, 


