Article

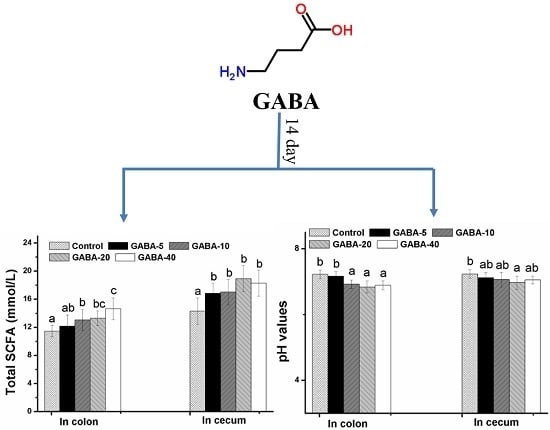
Gamma-Aminobutyric Acid Increases the Production of Short-Chain Fatty Acids and Decreases pH Values in Mouse Colon

State Key Laboratory of Food Science and Technology, Nanchang University, Nanchang 330047, China
*
Authors to whom correspondence should be addressed.
Molecules 2017, 22(4), 653; https://doi.org/10.3390/molecules22040653
Submission received: 10 March 2017 / Revised: 12 April 2017 / Accepted: 14 April 2017 / Published: 20 April 2017
(This article belongs to the Section Medicinal Chemistry)

Abstract

:
Gamma-Aminobutyric acid (GABA) could regulate physiological functions in the gastrointestinal tract. The present study aimed to investigate the effect of GABA on colon health in mice. The female Kunming mice were given GABA at doses of 5, 10, 20 and 40 mg/kg/d for 14 days. Afterwards, the short-chain fatty acids (SCFAs) concentrations, pH values, colon index, colon length and weight of colonic and cecal contents were determined to evaluate the effects of GABA on colon health. The results showed that intake of GABA could increase the concentrations of acetate, propionate, butyrate and total SCFAs in colonic and cecal contents, as well as the weight of colonic and cecal contents. The colon index and length of the 40 mg/kg/d GABA-treated group were significantly higher than those of the control group (p < 0.05). In addition, decrease of pH values in colonic and cecal contents was also observed. These results suggest that GABA may improve colon health.

Graphical Abstract

1. Introduction

The colon can maintain the health of the whole body by absorbing water and electrolytes, and salvaging unabsorbed nutrients [1]. It has been shown that short chain fatty acid (SCFA) and pH values play crucial roles in intestinal tract health [2,3,4]. SCFA are metabolic by-products of the gut microbiota fermentation in the colon [5]. This could provide energy for colonic epithelia to maintain normal colonic cell phenotype, stimulate the growth of colorectal cells, and colonic blood flow [2,6]. Acetate, propionate and butyrate are the primary forms of SCFA. Acetate constitutes a majority of the total SCFA in feces (about 60–75%) [7]. Propionate and butyrate could accelerate differentiation and apoptosis of colon cancer cells, and thus protect the colon from carcinogenesis [8]. In addition, the decrease of pH values was also beneficial to colon health by preventing overgrowth of pH-sensitive pathogenic bacteria in colon [6].
Gamma-aminobutyric acid (GABA) is a non-protein amino acid and main inhibitory neurotransmitter in the central nervous system [9,10], which is expressed in the central nervous system and non-neuronal peripheral tissues including the intestine [11]. It has been authenticated as a ‘new resources’ food by the State Food and Drug Administration in China. Several studies have shown that GABA could regulate many intestinal physiological functions, such as intestinal fluid secretion, blood flow and ulceration [12,13]. The GABA or GABAA receptor has been reported to regulate motility in the small intestinal and colon through regulating acetylcholine release from cholinergic neurons [14,15,16]. Krantis et al. [12] found that GABA improved intestinal mucosal activity by regulating intestinal fluid and electrolyte transport due to its presence in myenteric neurons. In addition, Song et al. [17] also suggested that GABA might play an auxiliary role in the polychemotherapy of colon cancer by inhibiting proliferation of the colon cancer cell. The above studies suggested the pivotal role of GABA in protecting intestinal health. However, to the best of our knowledge, there are few reports on the influences of GABA on colonic metabolism and growth status.
In this study, colonic metabolism parameters such as SCFAs production, pH values in colonic and cecal contents and weight of colonic and cecal contents were analyzed. Colonic growth parameters such as colon length and index were measured to describe the growth status of the colon. The results would have potential value for commercial exploration of GABA, especially on colon health.

2. Results

2.1. Weight and Health Status of Mice

The body mass of mice during the experiment is shown in Table 1. During the experimental period, the body mass of mice rose but there was no significant difference between the GABA-treated groups and the control group (p > 0.05). No obvious abnormal behavior, treatment-related illness or death was observed. The appearance of diarrhea and constipation in mice did not occur. There were also no remarkable differences in hair luster of the mice among the five groups.

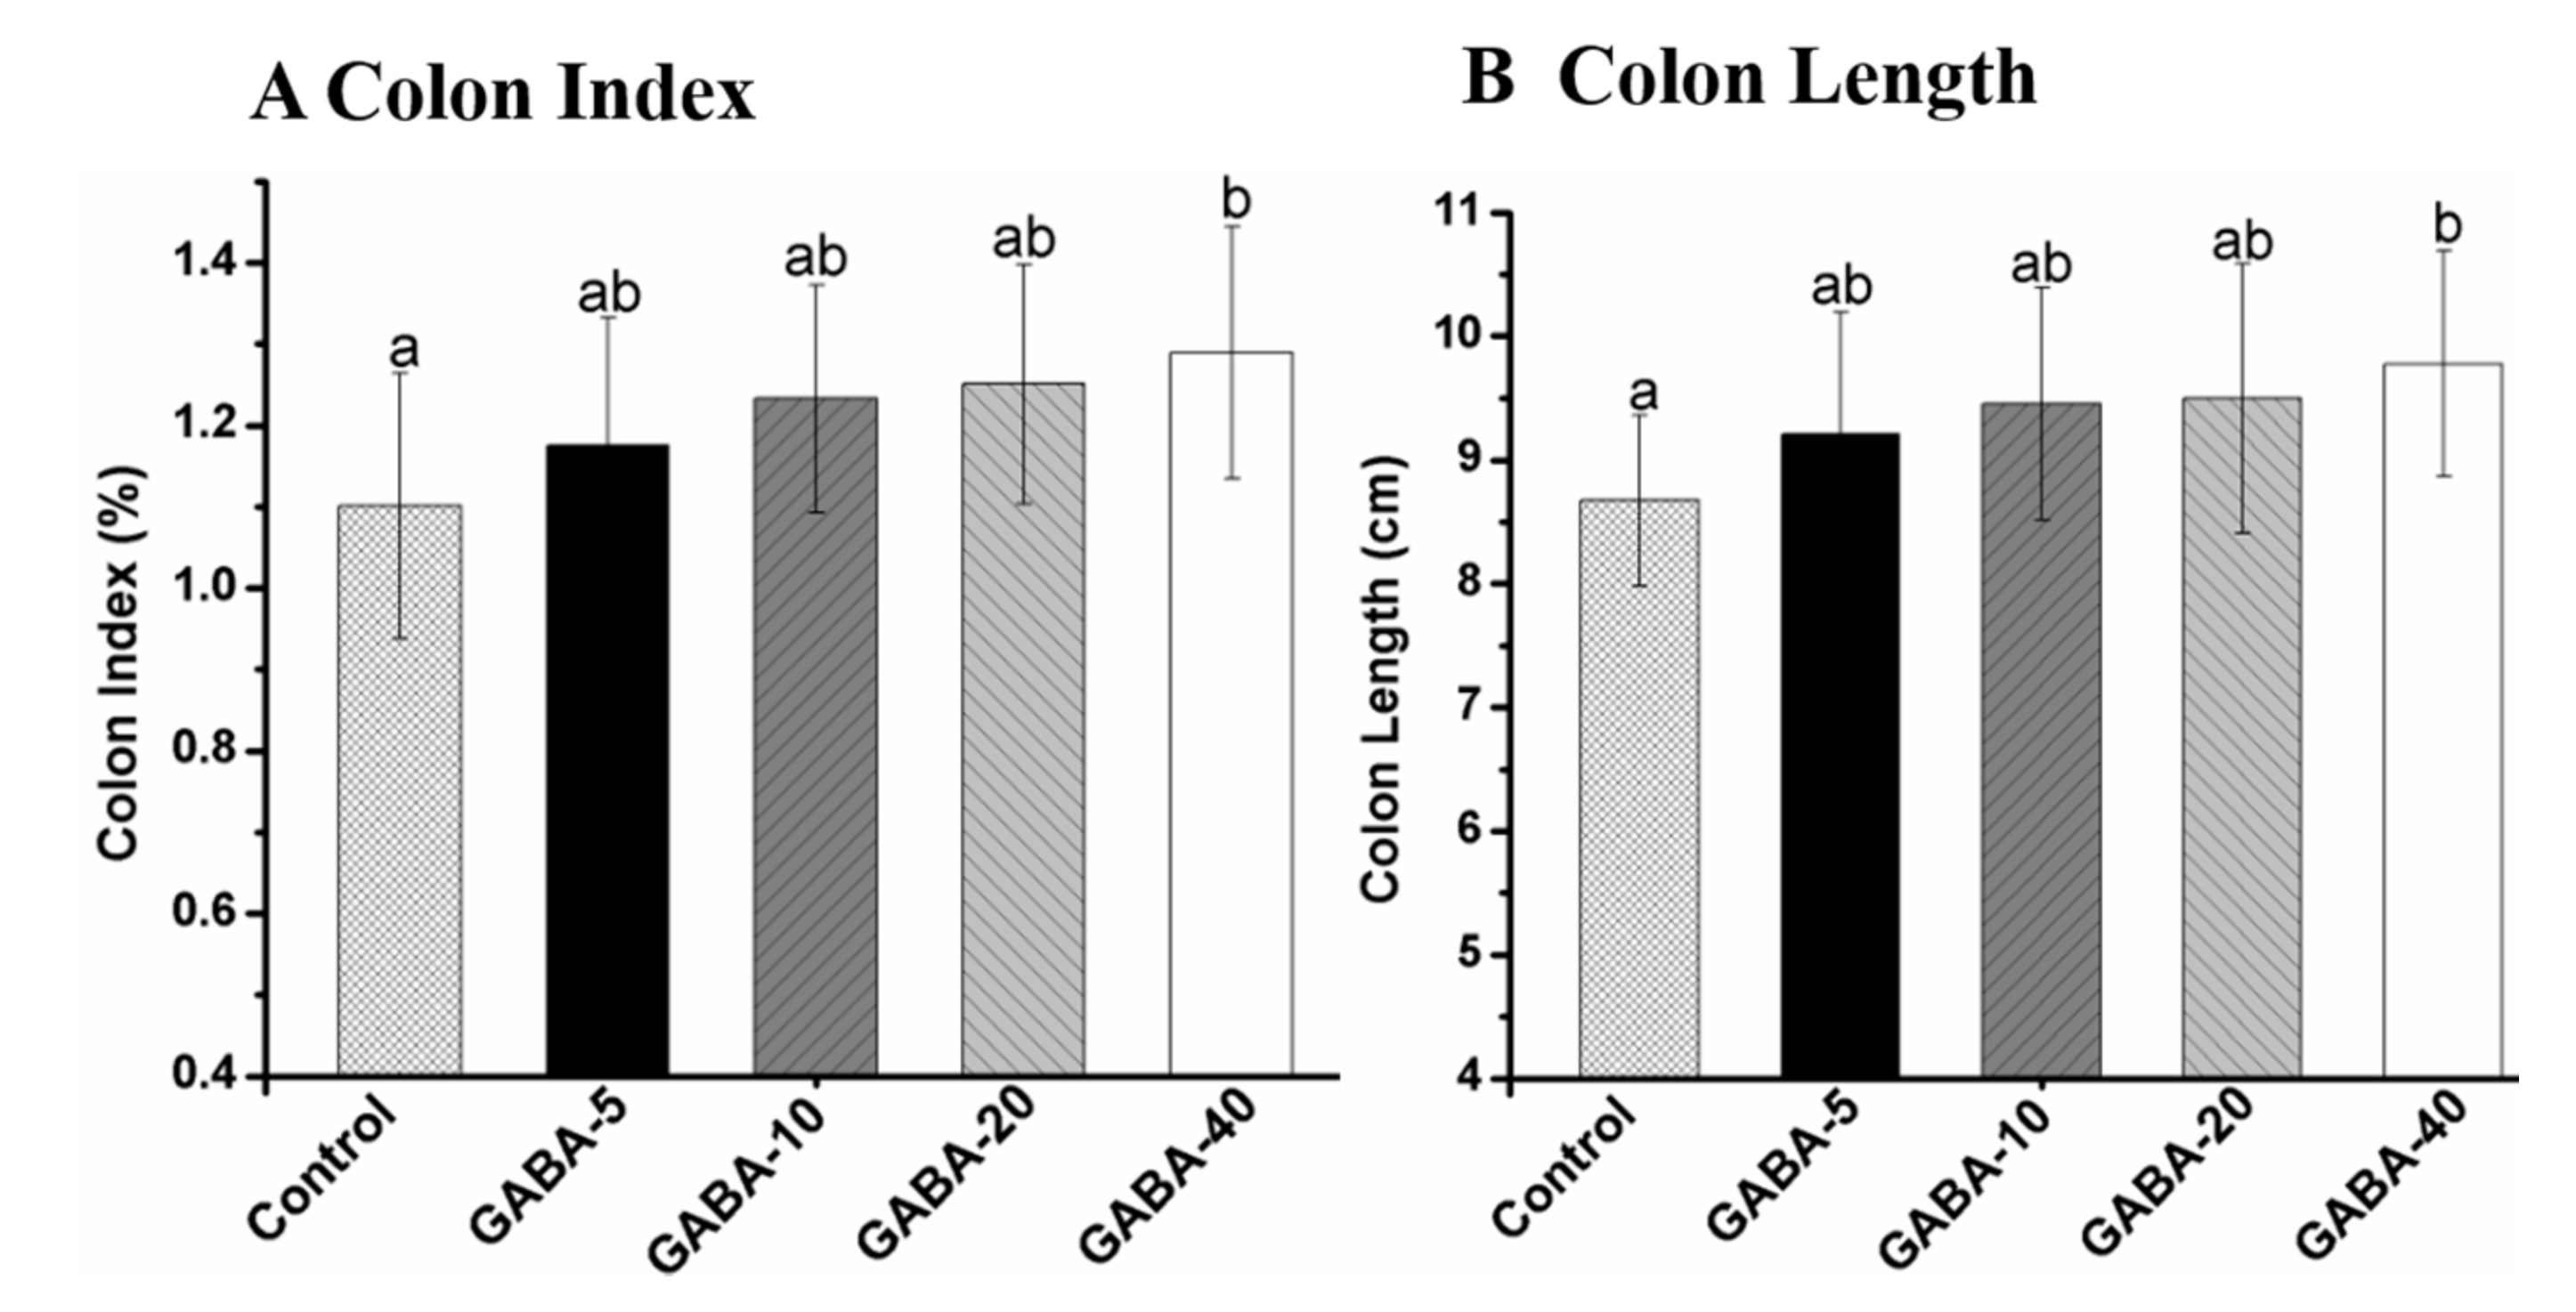
2.2. Colon Index and Length

The effects of GABA on colon index and length are presented in Figure 1. The colon index and length in the 40 mg/kg/d GABA-treated group were significantly increased compared with the control group (p < 0.05). However, there was no significant difference between the other GABA groups and the control group (p > 0.05). The increments of the colon index and length were in a dose-dependent manner in GABA-treated groups.

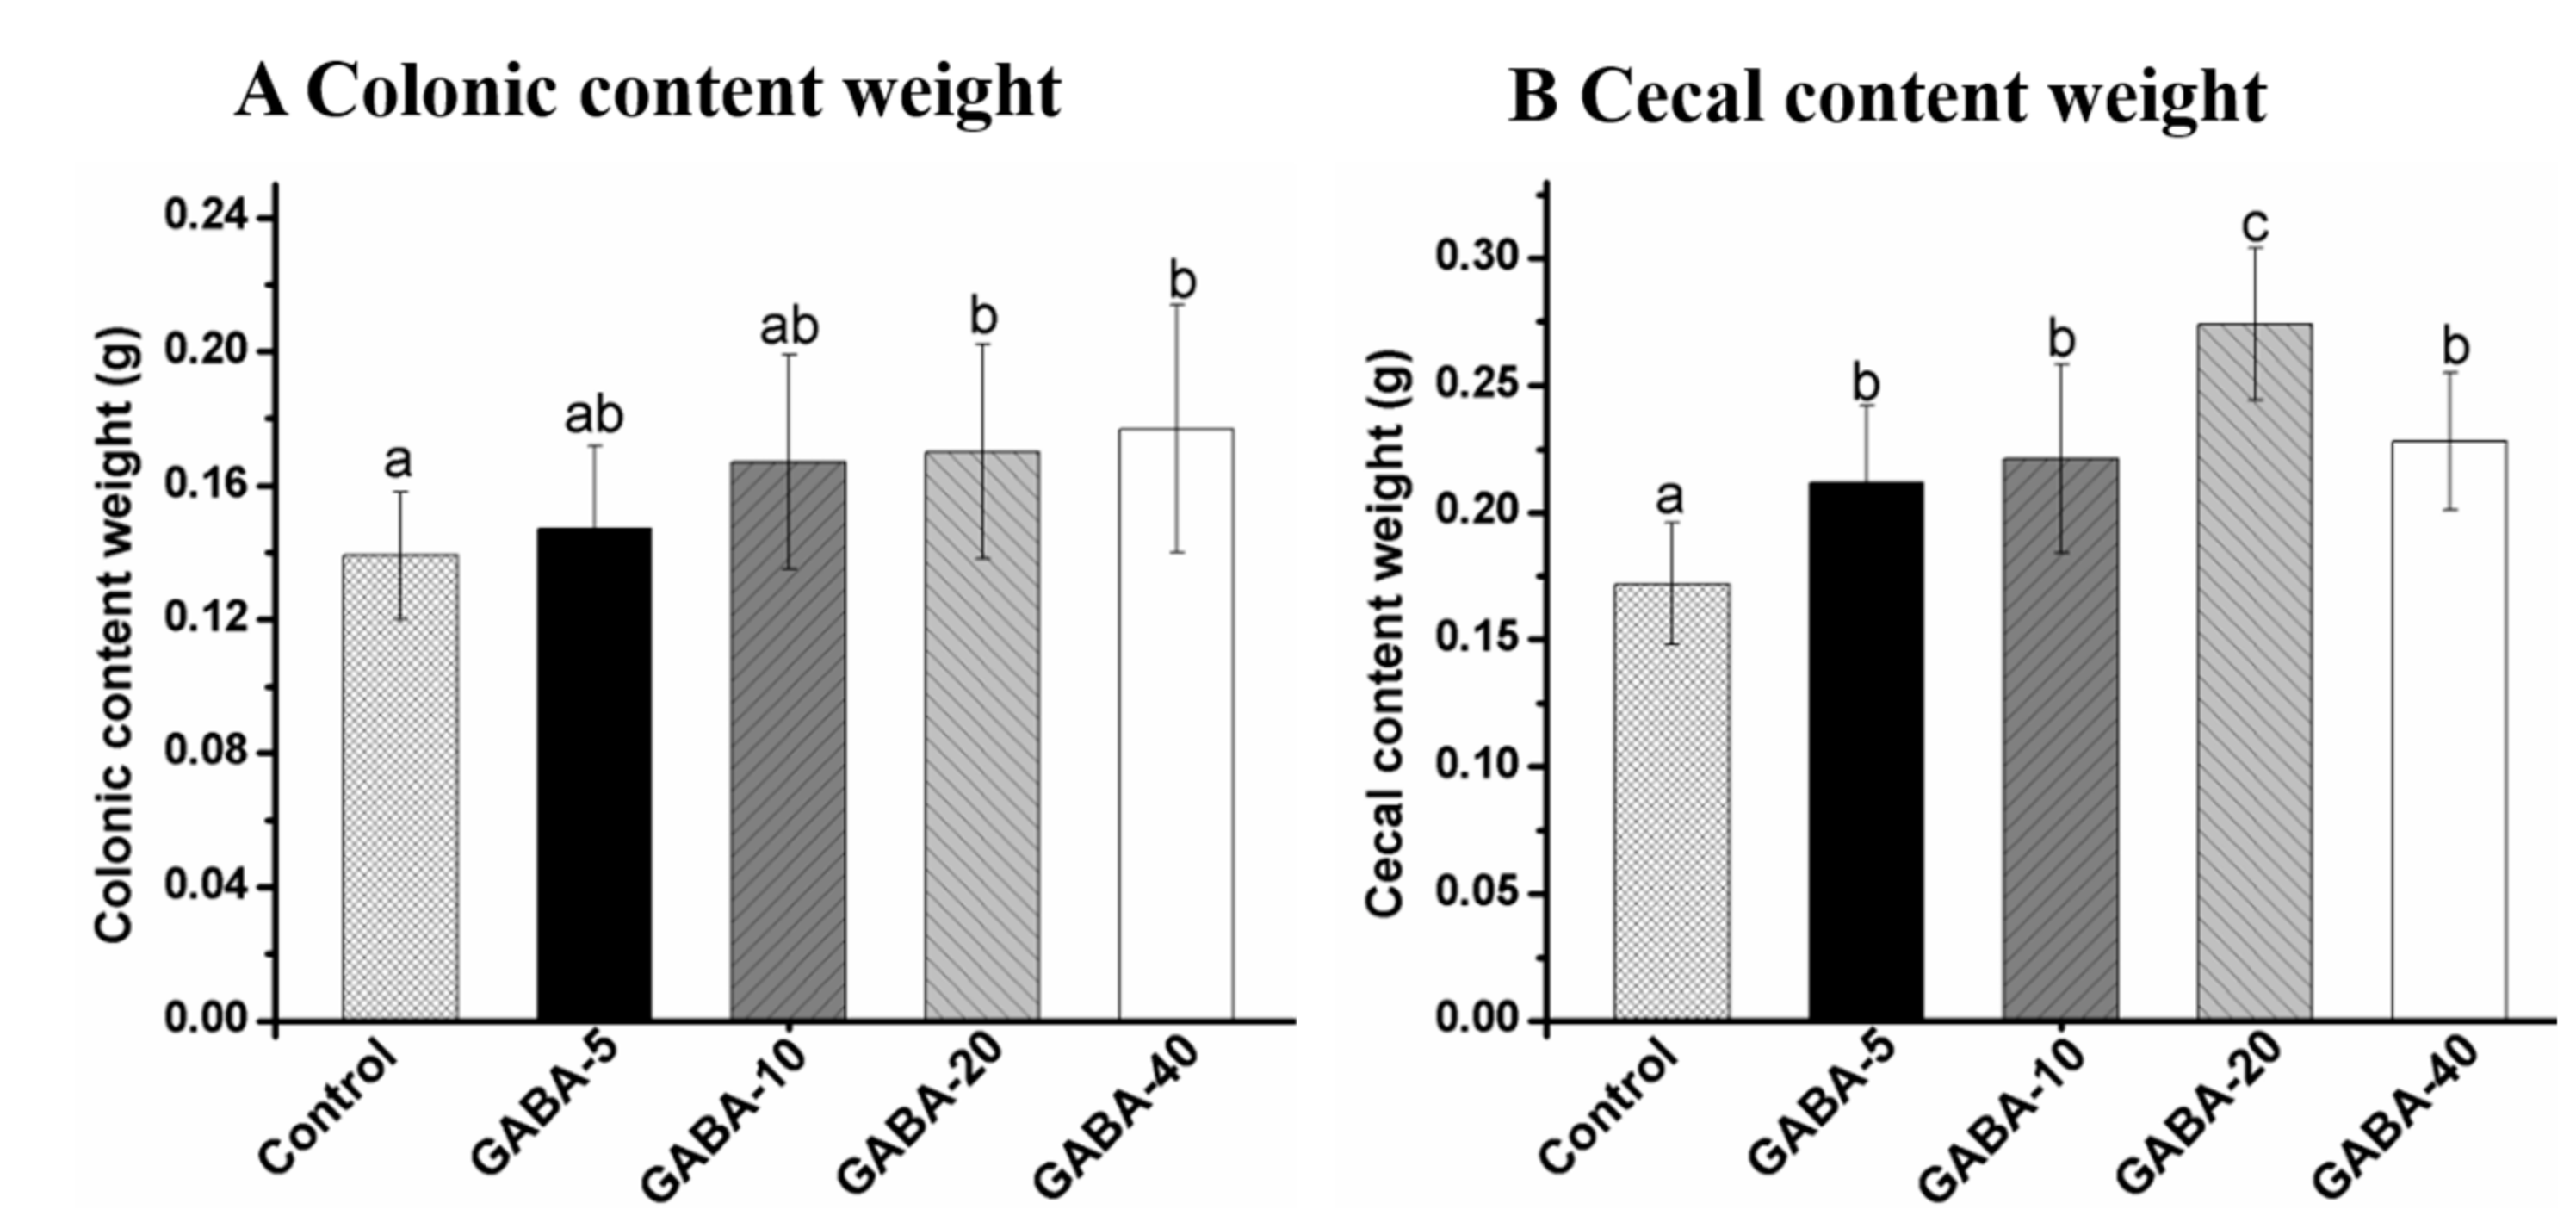
2.3. Effect of GABA on Weight of Colonic and Cecal Contents

The effects of GABA on weight of colonic and cecal contents are presented in Figure 2. Compared with the control group, the colonic content weight in the 20 and 40 mg/kg/d GABA-treated groups were significantly increased (p < 0.05). GABA pretreatment significantly increased the cecal content weight compared with the control group (p < 0.05). Moreover, the cecal content weight reached the highest value (0.274 ± 0.030) in the 20 mg/kg/d GABA-treated group. Furthermore, the colonic content weight was found to be increased in a dose-dependent manner in the GABA-treated groups.

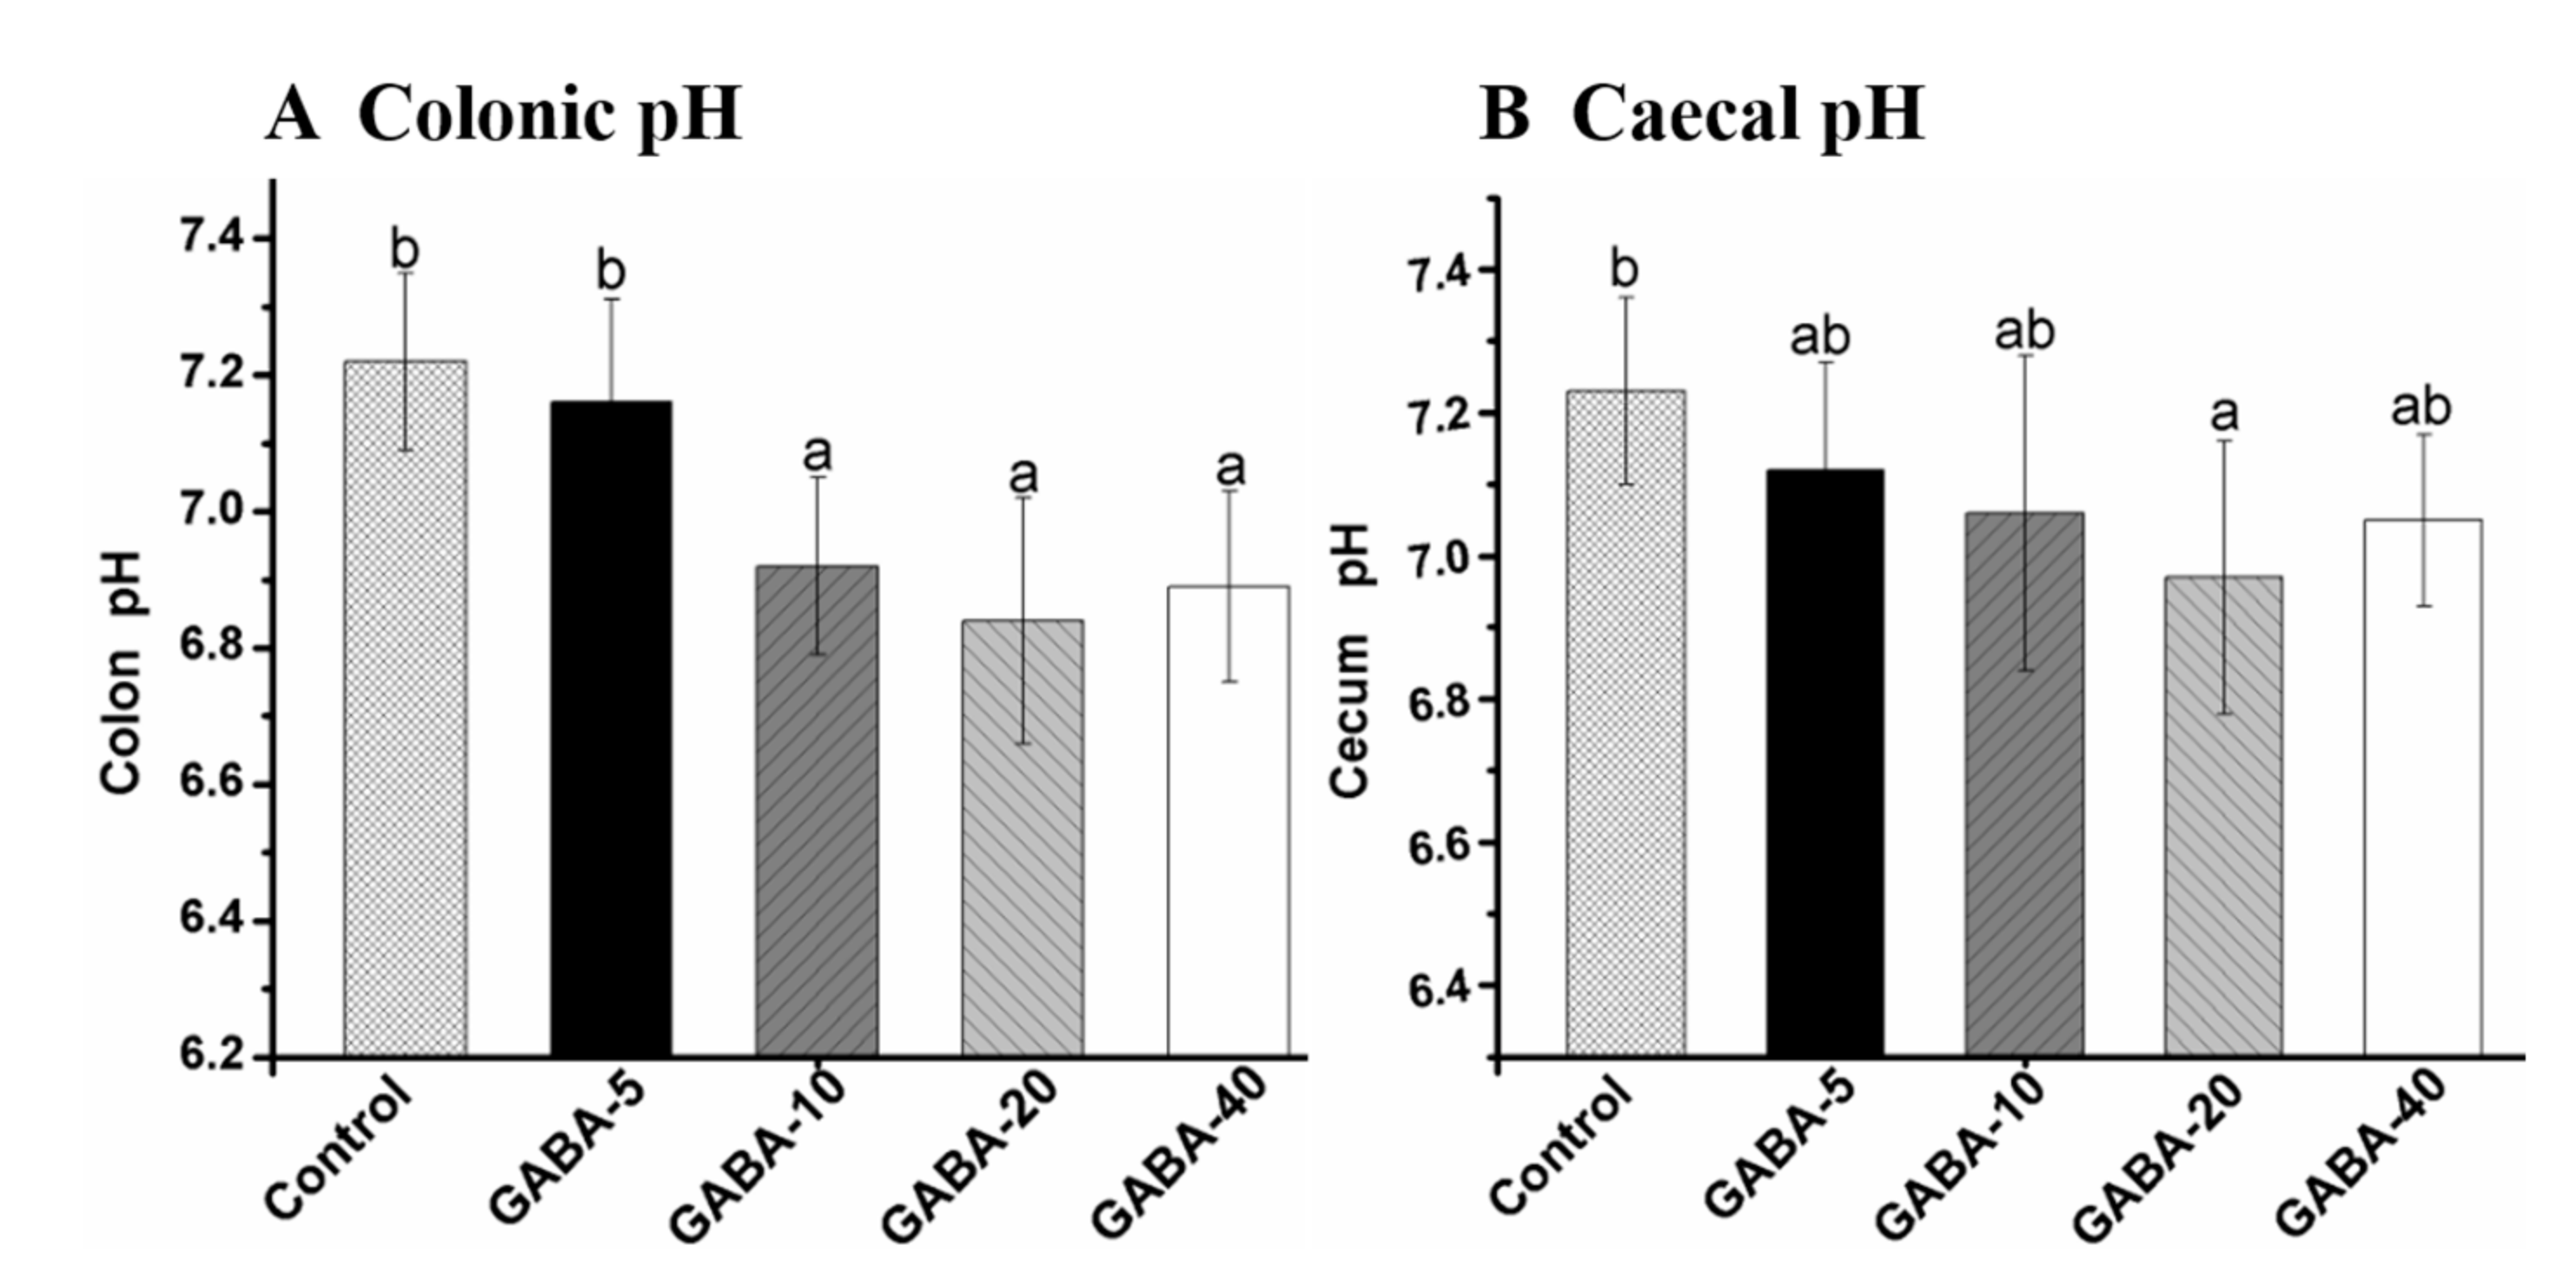
2.4. Effect of GABA on pH Value in the Colonic and Cecal Contents

As one of the key parameters for determining intestinal health, pH values could regulate the growth of microorganisms and enzyme activities in metabolism [18]. The effects of GABA on pH values in colonic and cecal contents are presented at Figure 3A,B respectively. Administration of GABA at doses of 10, 20 and 40 mg/kg/d significantly decreased the pH values (6.92 ± 0.13, 6.84 ± 0.18 and 6.89 ± 0.14) in the colonic content compared with the control group (p < 0.05). The pH values (6.97 ± 0.19) in cecal content from the 20 mg/kg/d GABA-treated group were significantly lower than that in the control group (7.23 ± 0.13). Nevertheless, there was no significant difference in pH values between the other GABA groups and the control group in cecal content (p > 0.05).

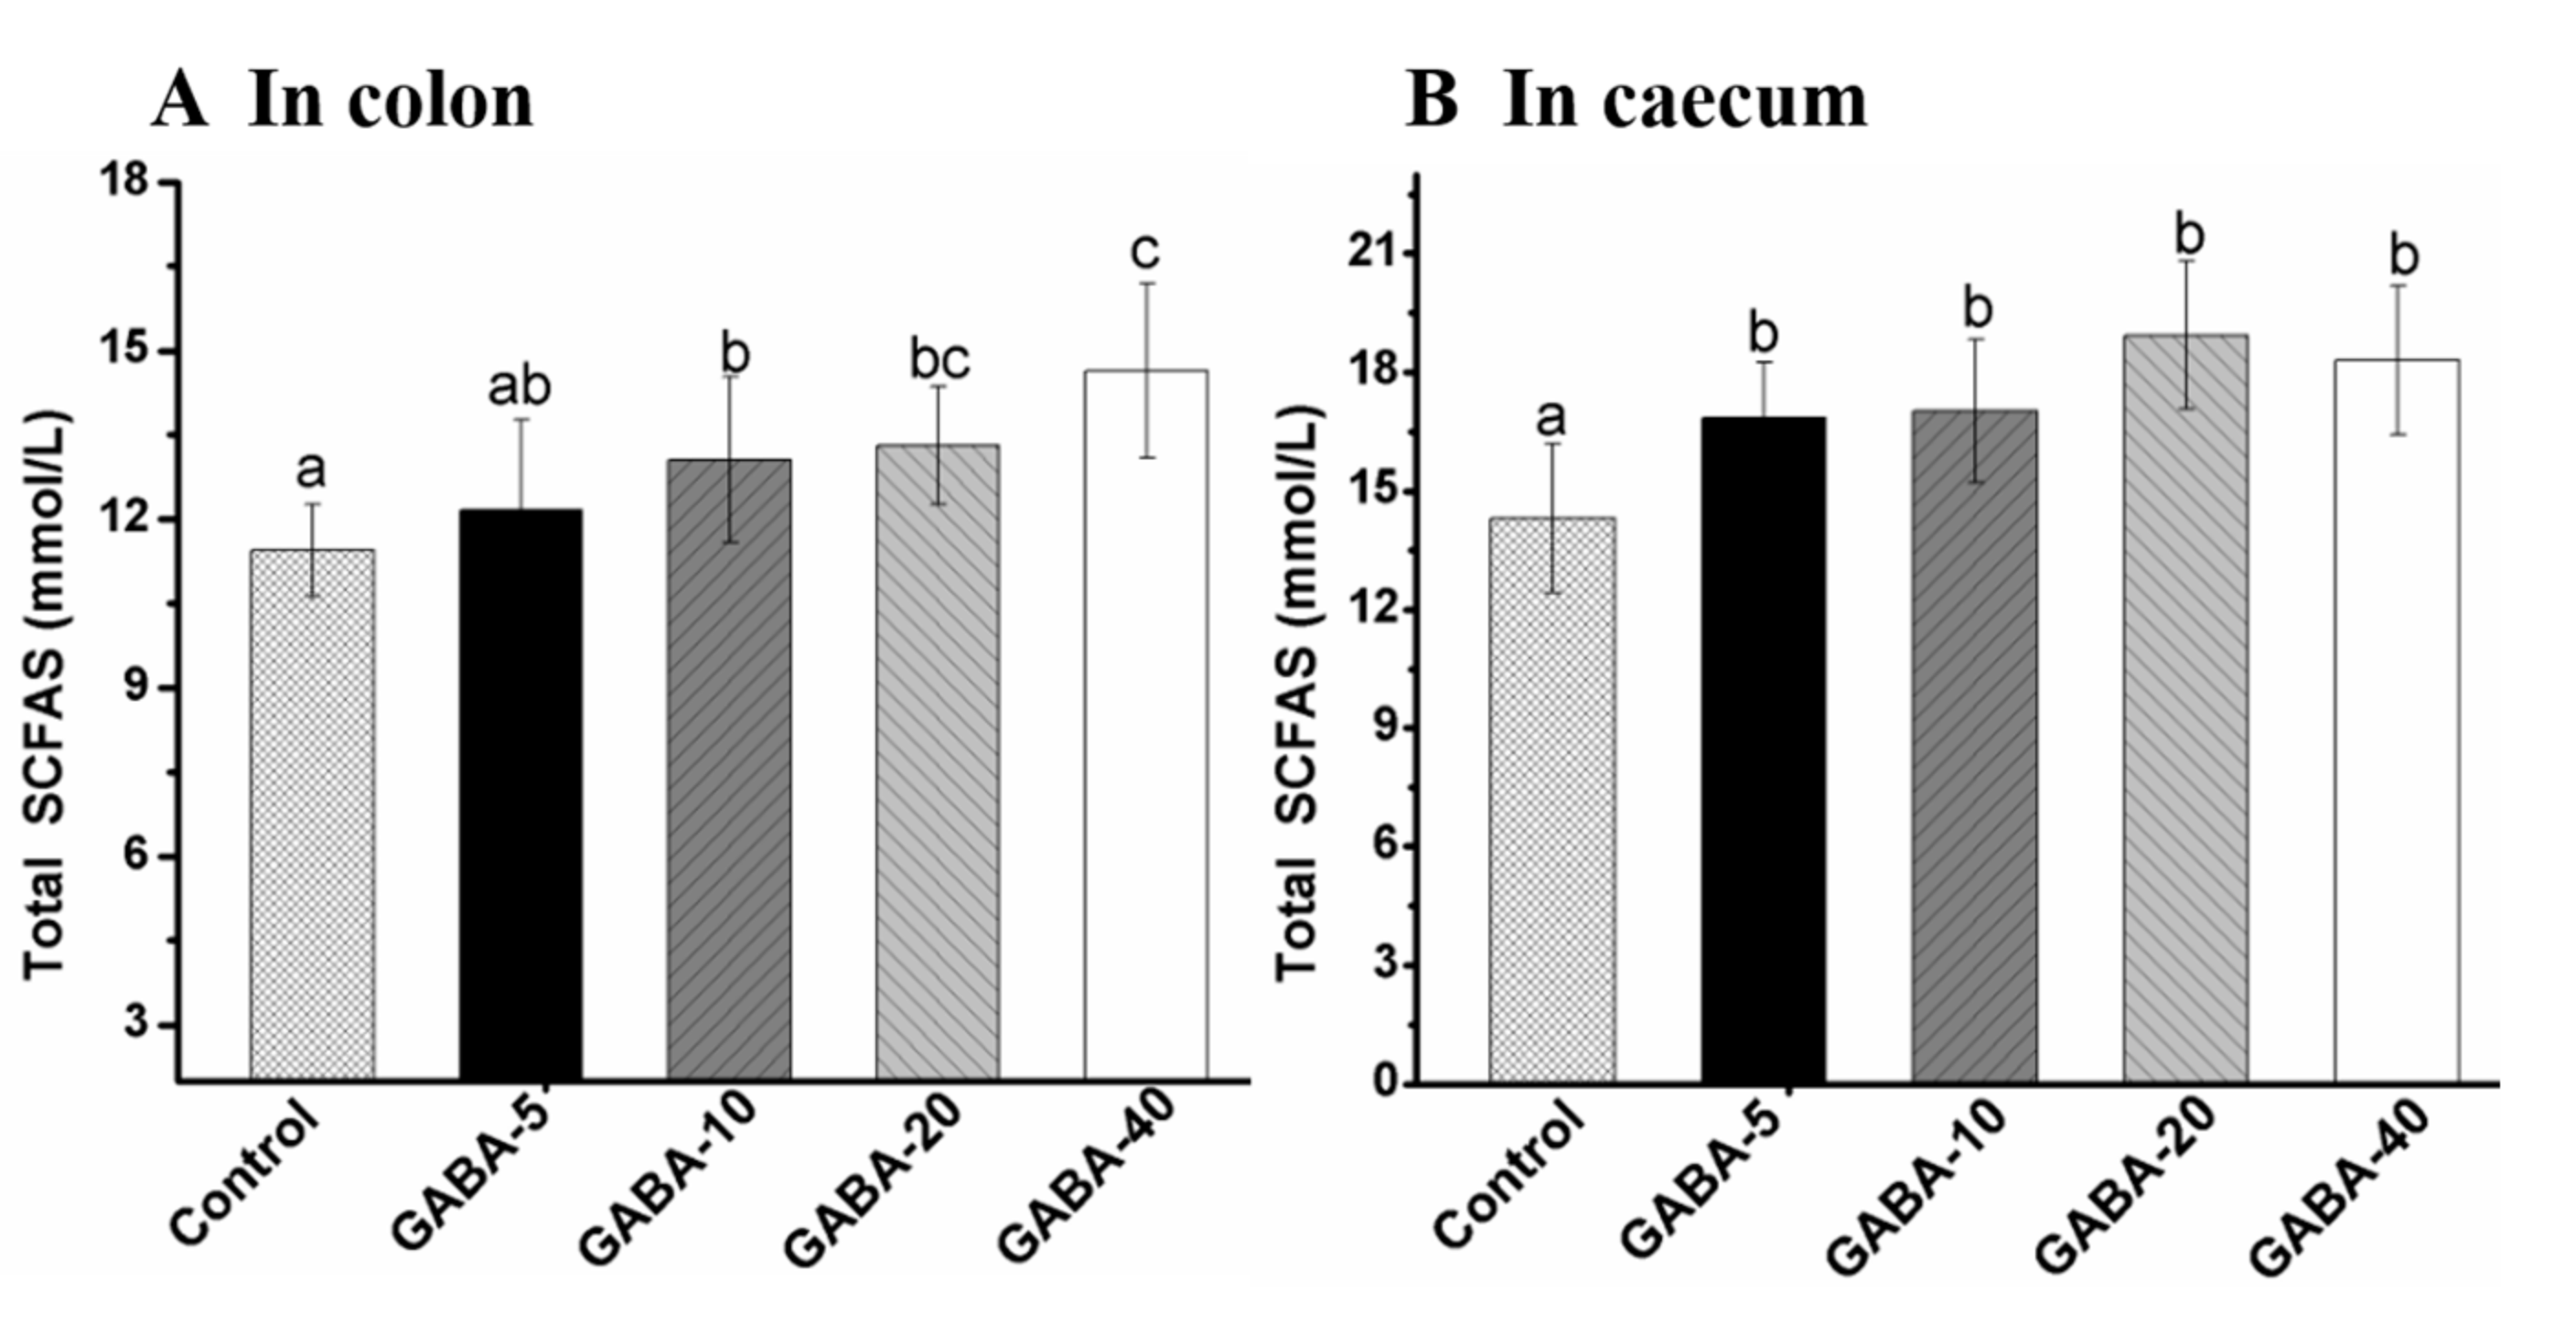
2.5. Effect of GABA on Total SCFA in the Colonic and Cecal Contents

SCFAs derived from carbohydrate fermentation by anaerobic bacteria are the principal energy source for colonic epithelial cells [19,20,21,22]. The accumulations of SCFAs primarily take place in the proximal colon and cecum in mice [23,24]. Total SCFA concentrations in the colonic and cecal contents are presented in Figure 4A,B. The calibration curves for SCFAs data were linear with all R2 > 0.999. The significant higher concentrations of total SCFA in the colonic and cecal contents of GABA-treated groups were observed compared with the control group, except for the 5 mg/kg/d GABA-treated group in the colon (p < 0.05). The concentration of total SCFA in cecal content was the highest in the 20 mg/kg/d GABA-treated group. The total SCFA concentrations in the colonic content were found to be increased in a dose-dependent manner in GABA-treated groups.

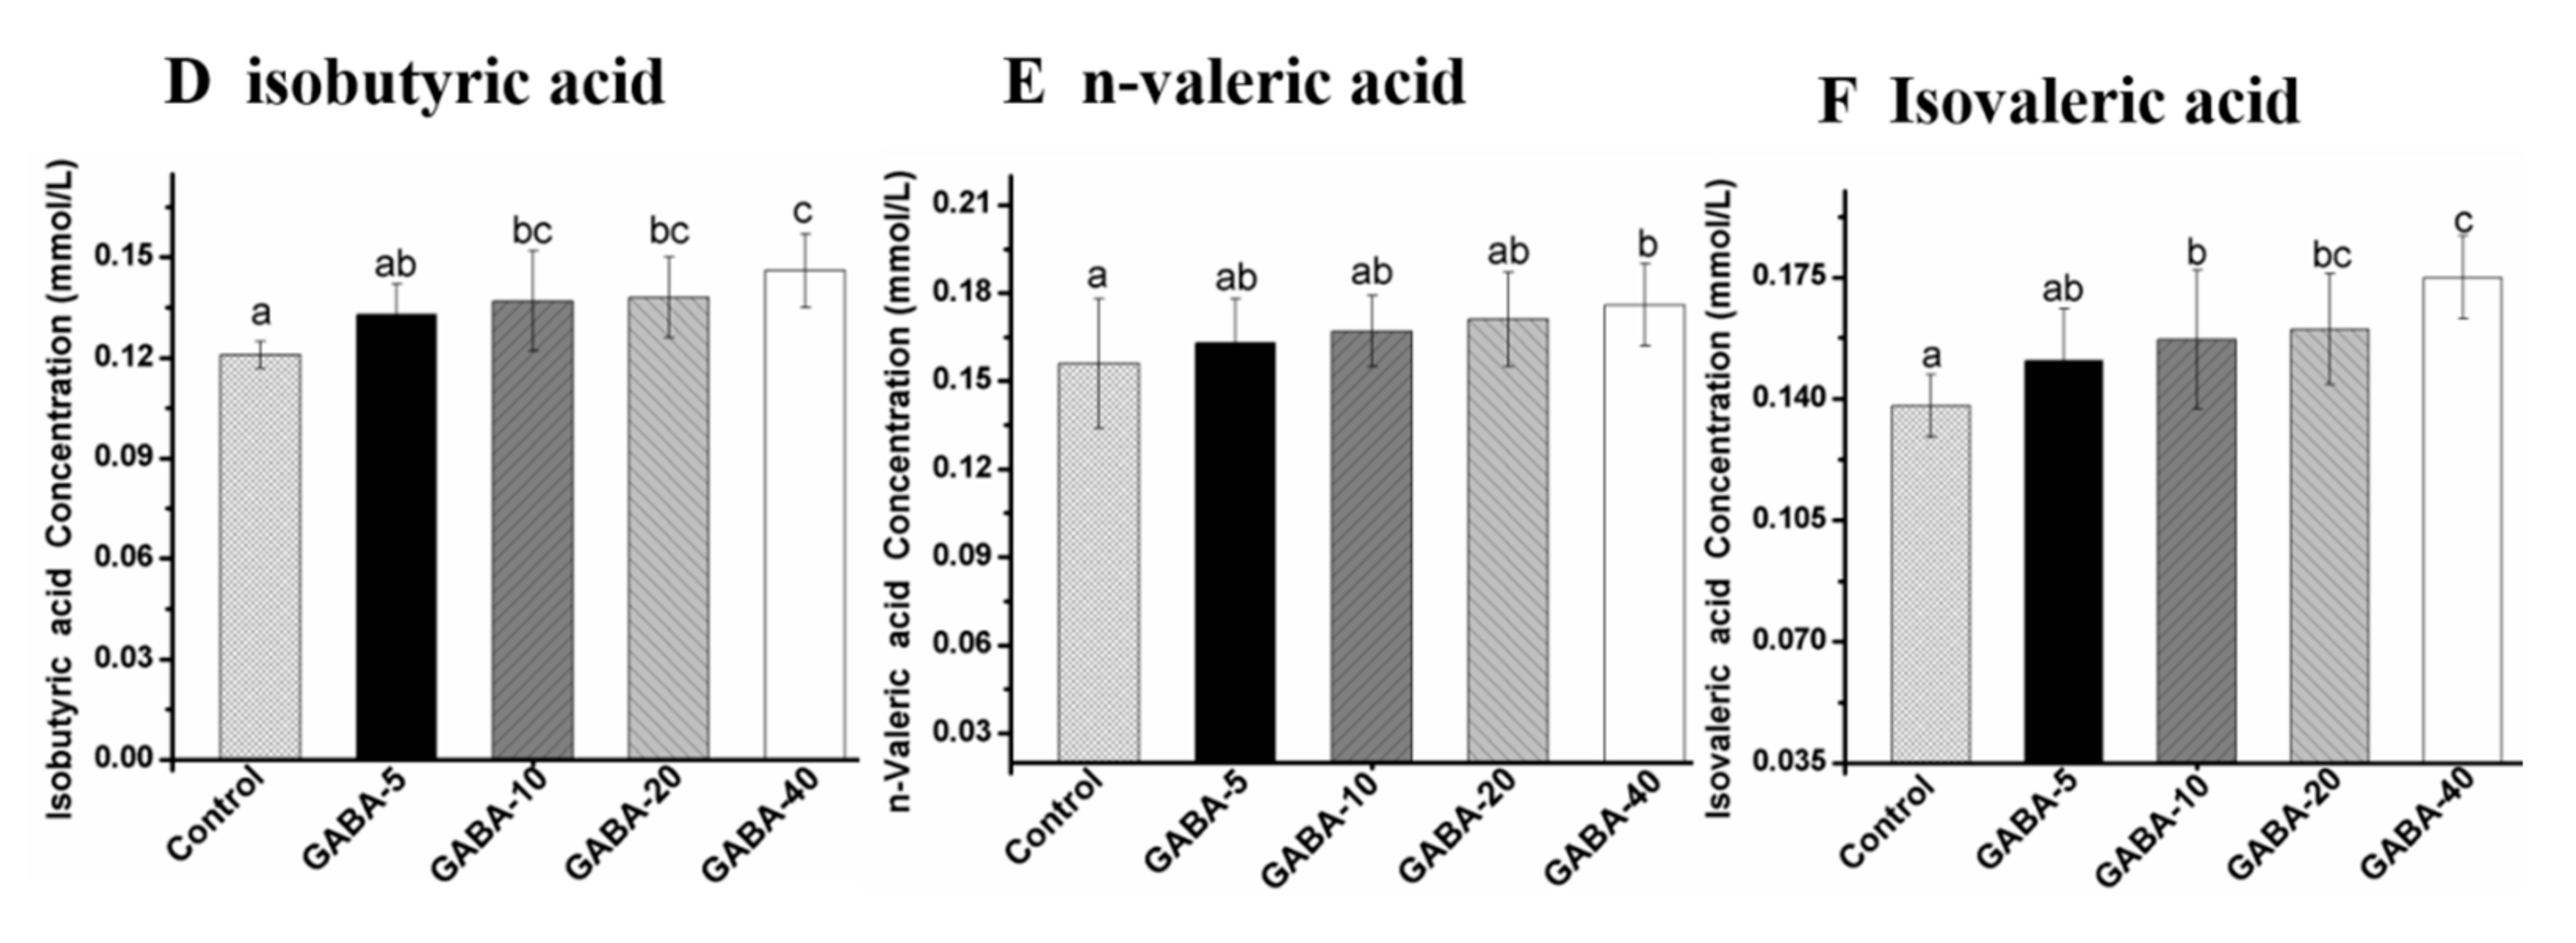
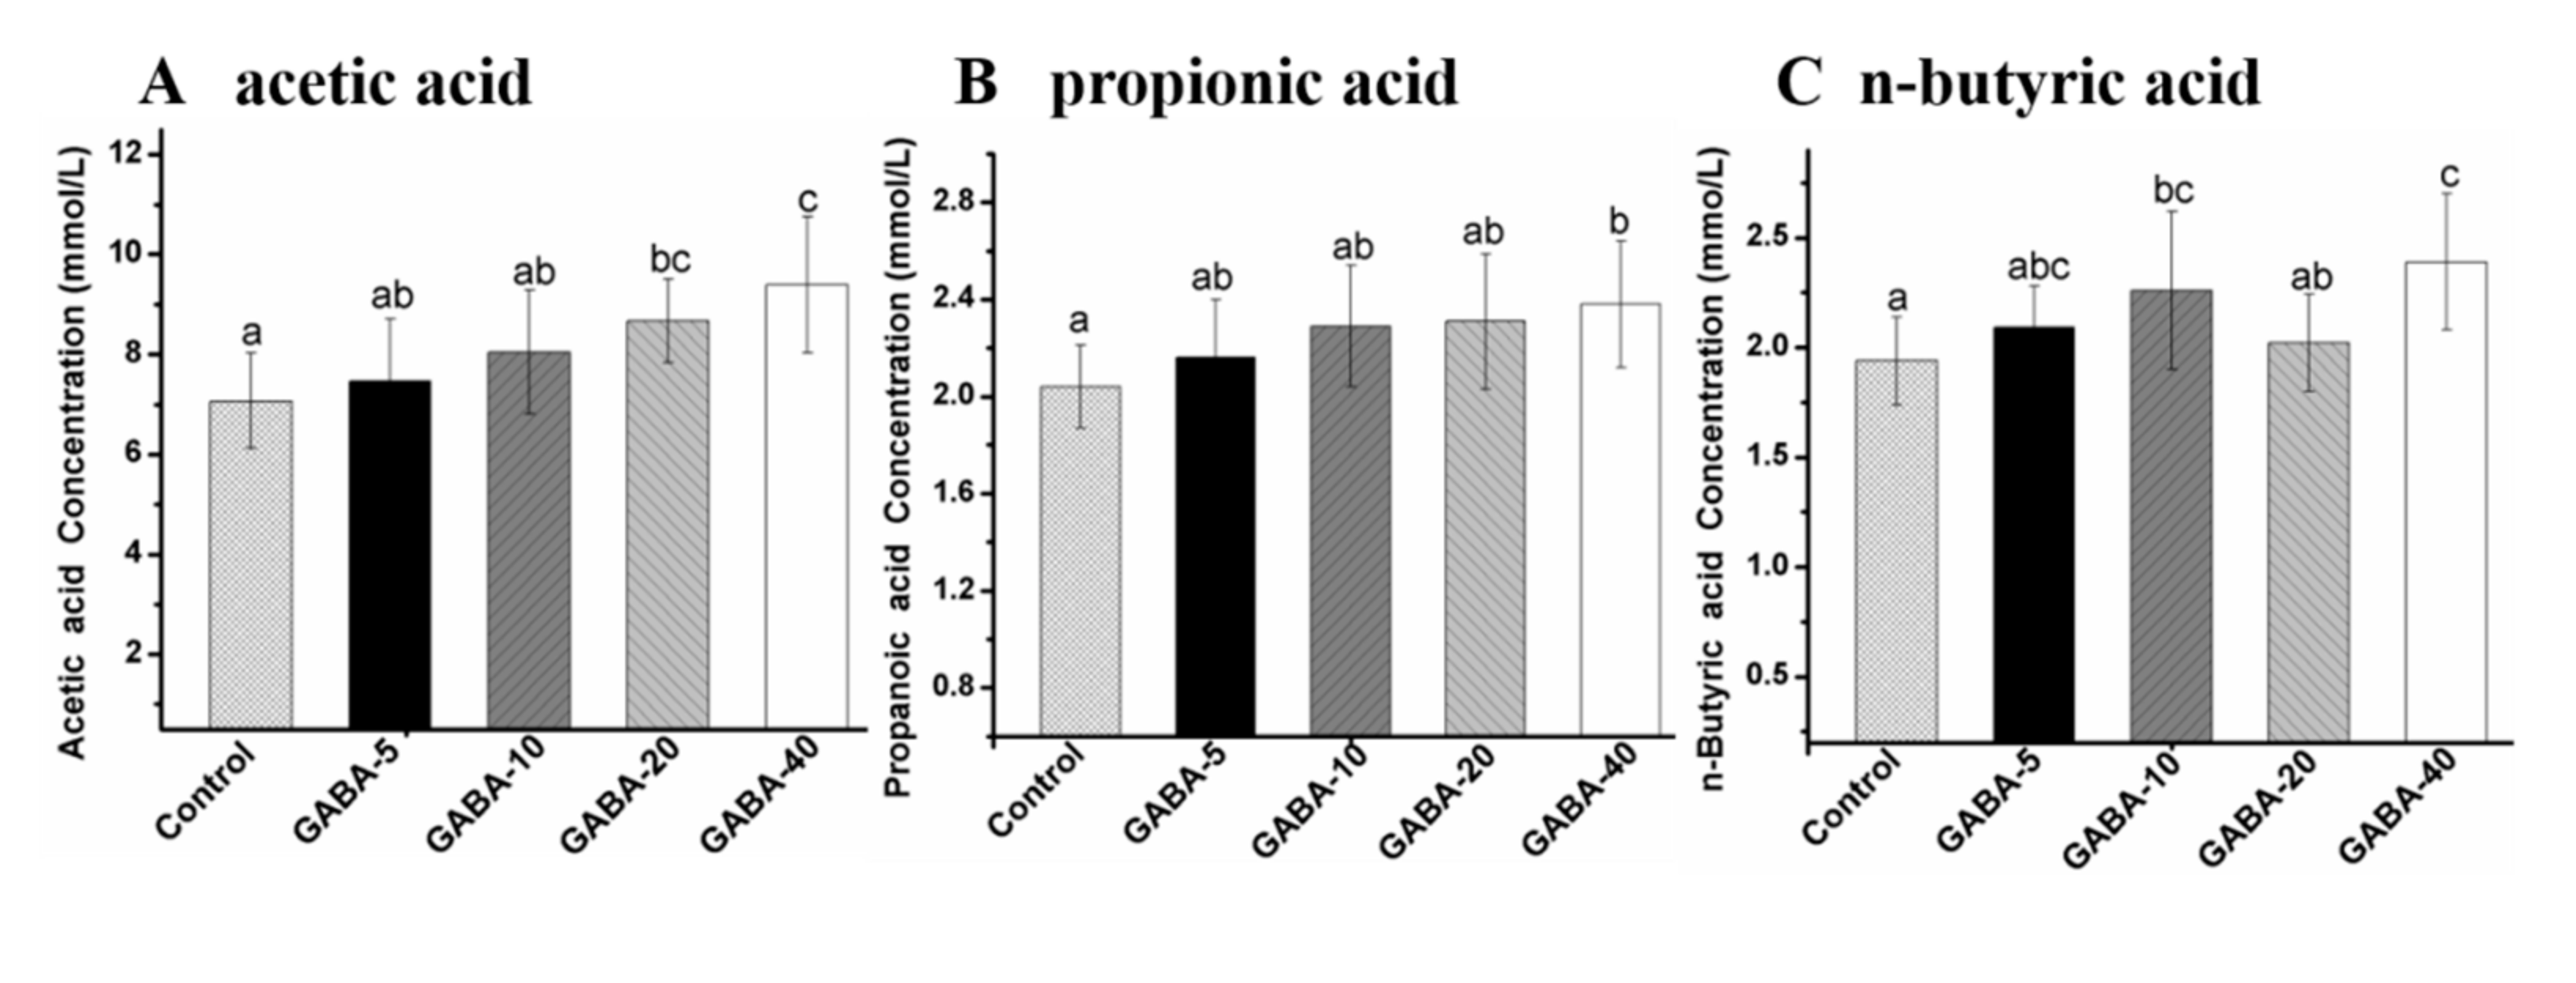
2.6. Effect of GABA on Individual SCFA in the Colonic Contents

Acetic acid, propionic, and n-butyric acids are the three primary types of SCFAs with an average ratio of 57:22:21 in the large intestine [25]. In contrast, low amounts of isobutyric acid, n-valeric acid and isovaleric acid are detected in colonic and cecal contents. The levels of individual SCFA in colonic content are shown in Figure 5. As shown in Figure 5, the significant higher levels of acetic acid, propionic acid, n-valeric acid, isobutyric acid, n-valeric acid, and isovaleric acid were observed in 40 mg/kg/d GABA-treated group compared with the control group (p < 0.05). Moreover, the level of acetic acid in 20 mg/kg/d GABA-treated group and the level of n-valeric acid in the 10 mg/kg/d GABA-treated group were significantly higher than those in the control group (p < 0.05). Moreover, the levels of isobutyric acid and isovaleric acid in the 10, 20 mg/kg/d GABA-treated groups were also significantly increased compared with the control group (p < 0.05). The levels of acetic acid, propionic acid, isobutyric acid, n-valeric acid and isovaleric acid were increased in a dose-dependent manner except for the n-butyric acid in the colonic content of the GABA-treated groups.

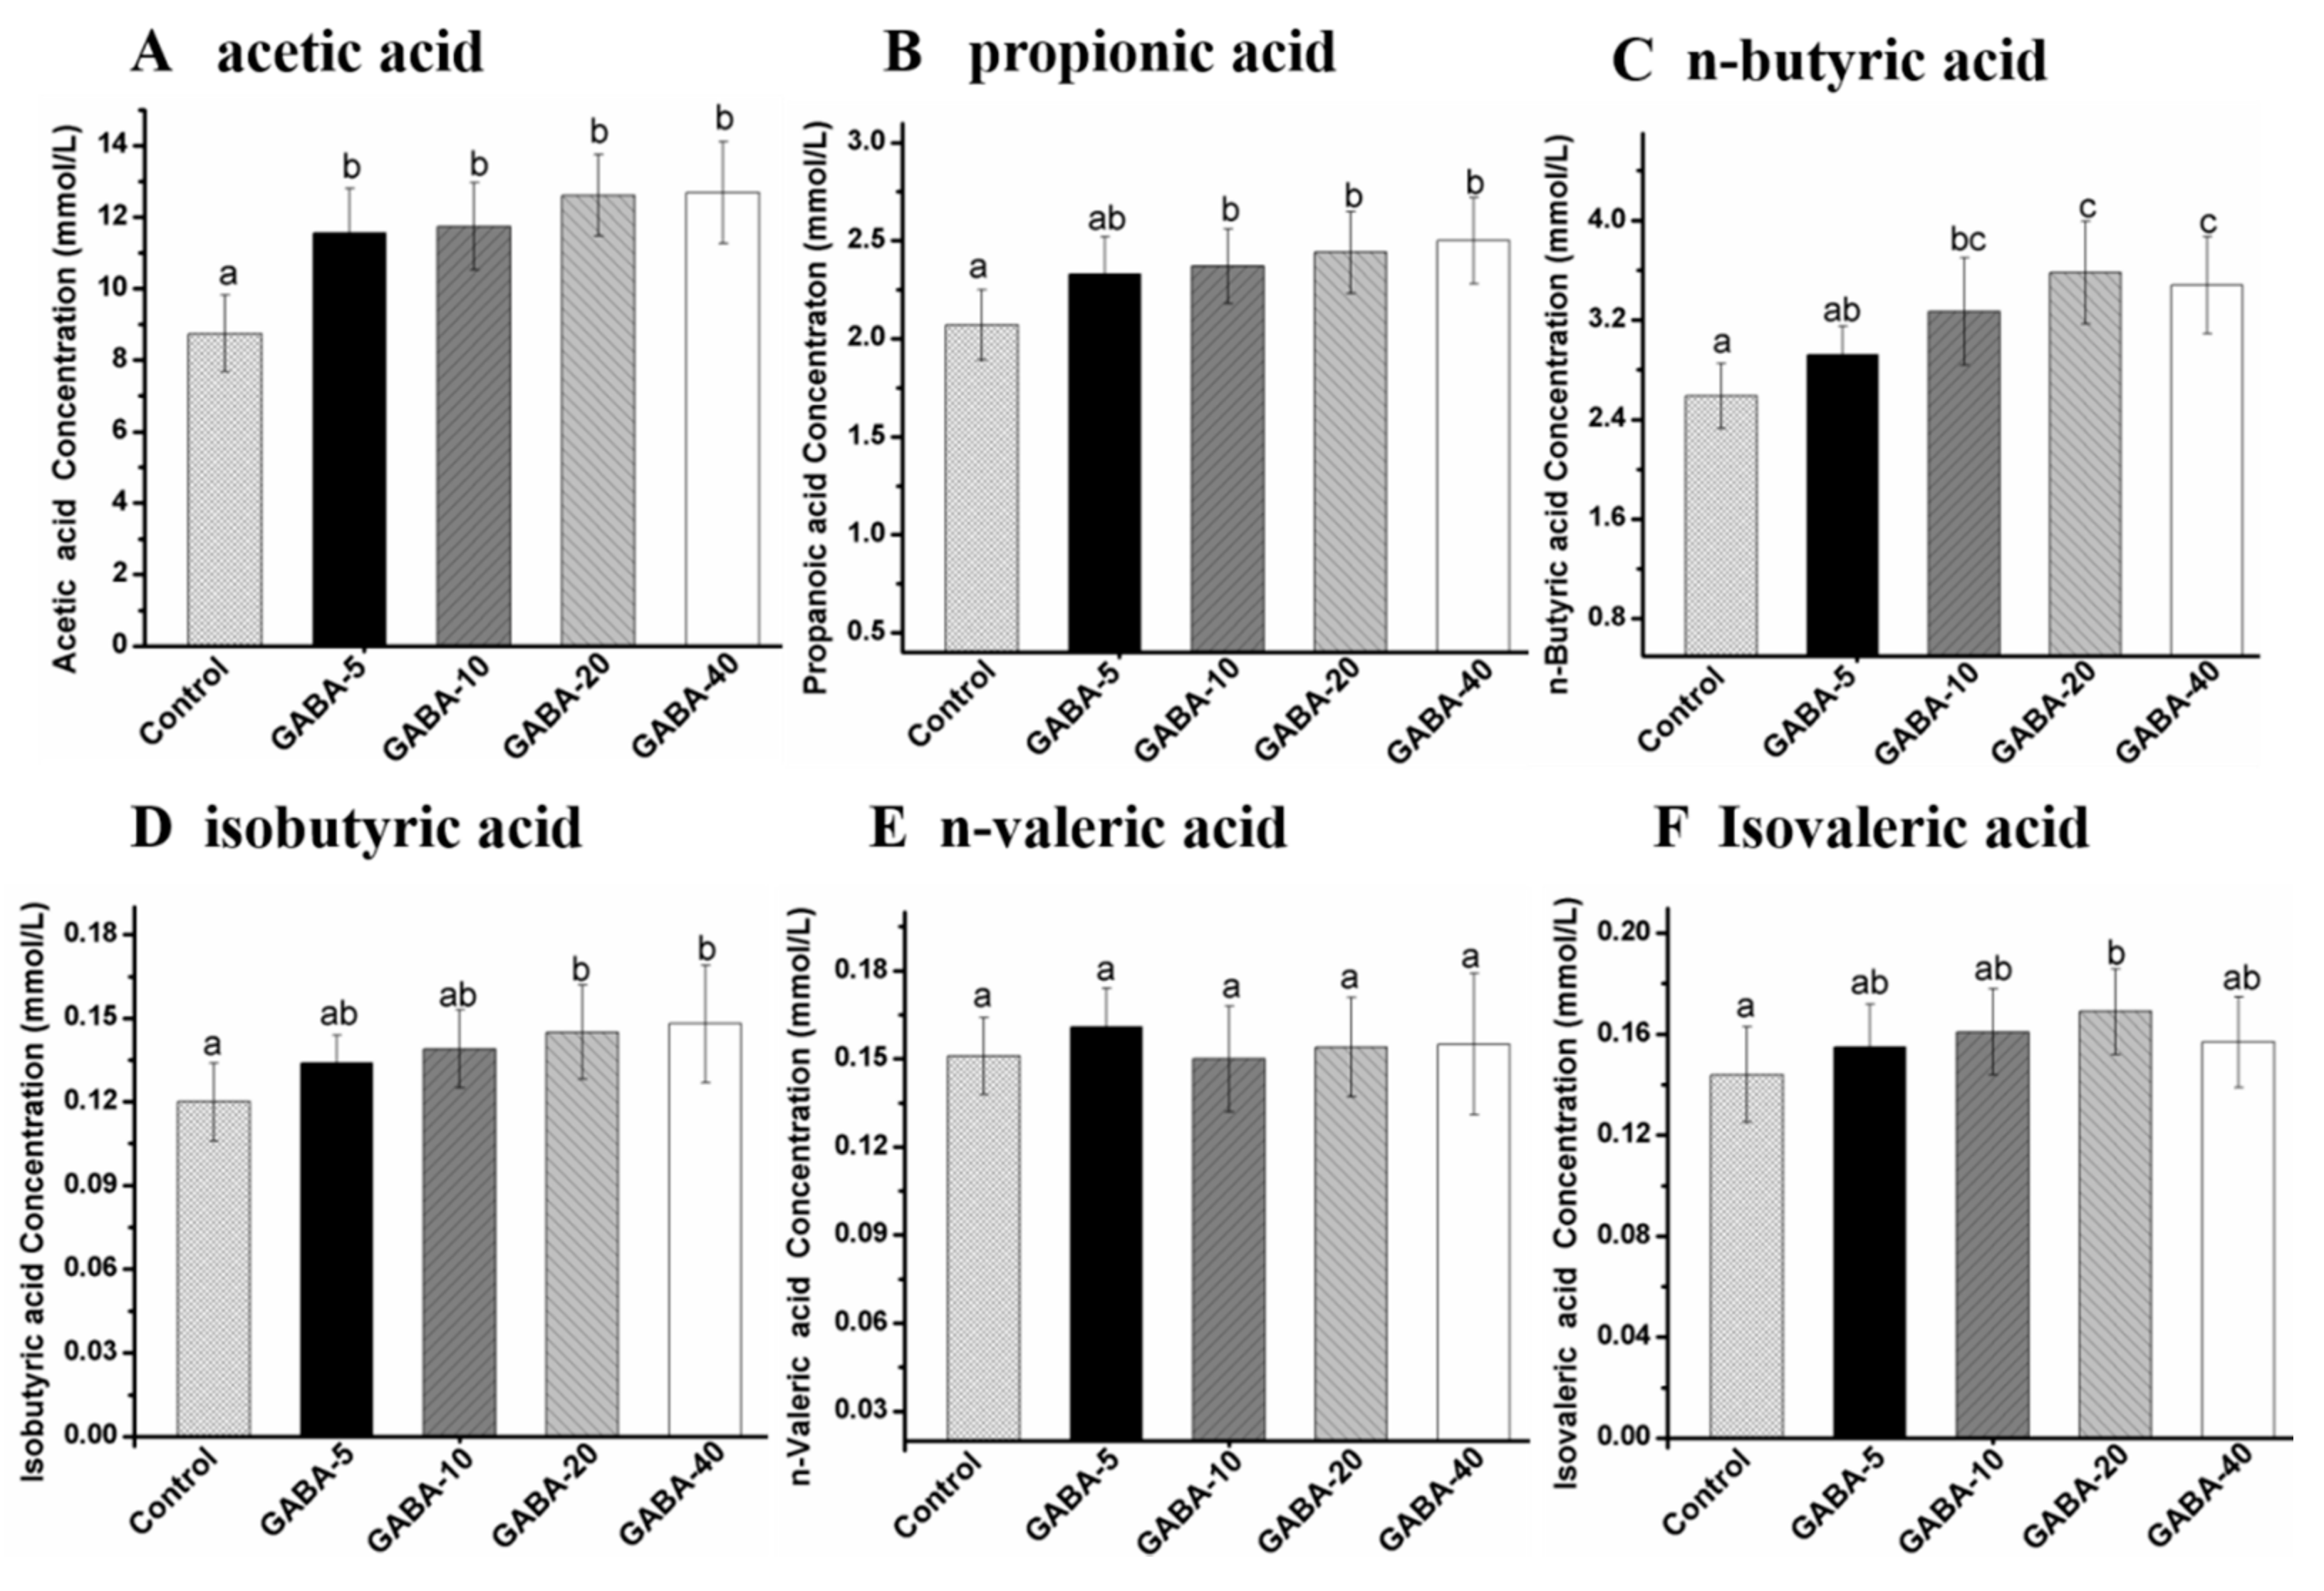
2.7. Effect of GABA on Individual SCFA in Cecal Contents

The concentrations of individual SCFA in cecal content are presented at Figure 6. As seen in Figure 6, compared with the control group, administration of GABA significantly increased the concentration of acetic acid in cecal content (p < 0.05). The concentrations of propionic acid and n-butyric acid in 10, 20 and 40 mg/kg/d GABA-treated groups were significantly elevated compared with the control group (p < 0.05). The concentrations of isobutyric acid in 20 and 40 mg/kg/d GABA were significantly higher than those in the control group (p < 0.05). In addition, the concentrations of n-valeric acid and isovaleric acid were increased, with no significant difference (p > 0.05). The concentrations of acetic acid, propionic acid and isobutyric acid were augmented with a dose-dependent manner in GABA-treated groups.

3. Discussion

The aim of present study was to evaluate the effect of GABA on colon health. Previous studies have suggested that the colon health was closely correlated to the increase of SCFAs production, colon length and index, and the decrease of pH values, which provided the theoretical basis for our research [26,27]. Our results, for the first time, suggest that GABA may promote colon health by increasing the production of SCFAs, colon index, colon length, weight of colonic and cecal contents and reducing the pH values in mice.
SCFAs have been reported to contribute to colon heath through many physiological mechanisms, which included inhibiting the growth of the intestinal pathogenic bacteria [28,29], and reducing inflammatory responses [30] and secondary bile acid formation in the colon [27]. Furthermore, the increase of SCFAs concentrations could result in increasing mineral substance absorption and stimulating epithelial cell proliferation [31]. Acetate, as the most abundant SCFA in colonic and cecal contents, has a trophic effect on colonic epithelium by increasing mucosal blood flow [32]. It has been demonstrated that acetate and propionate could obviously reduce serum cholesterol and inhibit adipogenesis [33,34,35]. Butyrate could be absorbed by the colonocyte as the primary energy source for the colonic epithelium to boost the growth of colonic tissue and colonic mucosa [27,36]. It could also maintain gut health through regulating intestinal motility, reducing oxidative stress, enhancing immune activity and inhibiting colon cancer [37,38,39]. Additionally, some literatures have shown that the increase of SCFAs may beneficial to maintain colon health [26,40]. In our study, the concentrations of total SCFAs, acetic acid, propionic acid and butyric acid in colonic and cecal contents of GABA-treated groups were higher than those in the control group. Therefore, we suggest that increasing SCFAs concentrations is a critical factor for GABA to improve colon health. However, the mechanism of the GABA effect on increase of SCFAs is still unclear. GABA has been established as a possible route for gut microbiota to communicate with the gut-brain-axis, produced and utilized by intestinal probiotic bacteria, which may potentially be used as a “prebiotic” for intestine health [41,42,43]. Whether GABA could increase SCFAs by its action on gut microbiota needs further investigation in the future.
Interestingly, the results in our study also showed that pretreatment with GABA increased the concentrations of isobutyrate and iso-valerate in line with the increase of SCFA production, which is in accordance with the results of several studies in the literature [44,45,46]. In the large intestine, protein is fermented by bacteria, which produces SCFAs, branched-chain fatty acids (BCFA) such as isobutyrate and iso-valerate, and potentially toxic compounds [47]. Additionally, it was well known that the basal diet contained proteins in our study. GABA could increase food intake by stimulating ingestive behavior [48], which may result in the increases of isobutyrate and iso-valerate concentrations.
It is worth noting that the increase of colon length and index may be involved in promoting colon health [26,44]. A greater-than-normal colon length could promote colon health by preventing degenerative bowel disease [49]. Moreover, the colon length was decreased in the colitis induced by a relatively low dose of dextran sulfate sodium [50]. Campbell et al. [3] found that the increase of colonic and cecal tissue weight might result from the augmentation of crypt depth and cell density by providing butyrate as an energy source. The results in this study indicated that pretreatment with GABA could increase colon length and index compared with the control group. Moreover, GABA has been reported to protect intestinal mucosal by increasing crypt depth, intestinal wall thickness and the number of goblet cells [51], which may account for the increase of colon index and length in our study.
The weights of colonic and cecal contents were involved in improving intestinal health [52,53]. Zhou et al. [40] reported that the increase of the cecal content and cecal wall weight might result from the formation of SCFAs. Our results indicated that GABA pretreatment at doses of 20 and 40 mg/kg/d could significantly increase the weight of colonic and cecal contents, compared with the control group.
pH values in colonic and cecal contents is also an important indicator to evaluate the health status of the colon. Lower colonic pH has been suggested to inhibit chronic bowel diseases, colorectal cancer, and the bacterial conversion of primary to secondary bile acid [54]. A lowering pH value could also prevent the growth of pathogenic bacteria such as Salmonella [55,56]. Our results indicated that the pH values were decreased in colonic and cecal contents in GABA-treated groups, which was in line with these studies. Furthermore, it has been reported that the increase in SCFAs productions could contribute to the decrease of luminal pH [18,27]. This implies that GABA may lower pH values due to the increase of SCFAs production.
GABA plays a crucial role in colon health in mice. However, whether dietary GABA could reach the cecum and colon in order to work is still unclear. It has been shown that GABA exerts its actions through three types of receptors, including GABAA, GABAB and GABAC receptors [57]. These GABA receptors could be found to express in the colon [57,58]. In addition, GABA could modulate peristaltic activity in mouse colon through activation of GABAA or GABAB receptors [16]. The GABAA receptor was also reported to increase the sodium and water intake by the disinhibition effect of GABAergic [59]. Furthermore, the colon health was closely related to sodium and water absorption [60]. It has also been shown that the increase of sodium and water absorption contributed to SCFA production and absorption [61,62]. Therefore, the effect of GABA on colon health may be associated with sodium and water absorption regulated by GABA receptors.

4. Materials and Methods

4.1. Materials

GABA (≥99% purity) was purchased from Solarbio Company (Beijing, China), the high-purity SCFAs were used as standard solutions for gas chromatographic analysis. Acetic acid (100% purity) was obtained from Merck Co. (Darmstadt, Germany). Propionic acid (100% purity) was purchased from Janssen Chimica (Beerse, Belgium). Isobutyric acid (99.9% purity), n-butyric acid (100% purity), n-valeric acid (99.9% purity) and isovaleric acid (100% purity) were from Sigma Corporation (St. Louis, MO, USA). All the others were of analytical grade.

4.2. Animals

All experiments were approved by the Animal Care Review Committee (Animal application approval number 0064257), Nanchang University, China. Female 6-week-old Kunming mice, weighing 18.0 ± 2.0 g, were provided by Animal Breeding Center, Nanchang University, Nanchang, Jiangxi Province, China. All animals were cared for in accordance with the Guide for Care and Use of Laboratory Animals, published by the Institute of Laboratory Animal Resources, Commission on Life Sciences, National Research Council, National Academy Press (NIH Publication 85–23, revised 1996).

4.3. Animal Experiment

All mice were acclimatized at least 7 days before the experiments and fed with the same basal diet from Animal Breeding Center, Nanchang University, Jiangxi Province, China. The composition of the basal diet was in accordance with the report of Hu et al. [63]. Sixty mice were randomly divided into 5 groups, including the 5, 10, 20 and 40 mg/kg/d GABA groups (GABA-5, GABA-10, GABA-20 and GABA-40) and the control group. The doses for the GABA administrated were selected according to the standard issued by the National Health and Family Planning Commission of the People’s Republic of China, where GABA consumption for people is less than 500 mg per person per day.
All mice were raised in a room with controlled temperature at 25 ± 0.5 °C, relative humidity of 50% ± 5% and a 12 h light/dark cycle. The mice in the GABA-treated groups were given different doses of GABA. The mice in the control group were given the corresponding volume of saline. Furthermore, all mice were weighed at approximately 09:00 every day before oral administration, and the volume of GABA and saline was adjusted in a dose of 10 mL/kg according to the body mass. All mice were killed after 14 days of oral administration. The colon and cecum were aseptically removed immediately, placed on an ice-cold plate and opened longitudinally. The colonic and cecal contents were collected, weighted and stored at −80 °C for determining SCFAs contents and pH values. The colon tissue was rinsed with physiological saline, and collected for the measurements of colon index.

4.4. Analysis of SCFAs

The colonic and cecal contents were weighed and immediately placed into a round-bottomed stoppered tube in an ice-cold water bath. The colonic and cecal contents were diluted by adding deionized water in a ratio of 1:7. All the samples were mixed for 3 min by a vortex mixer and executed with ultrasonic-processing continuously for 5 min. The processes of the vortex and ultrasound were repeated once. The sample was extracted by standing in an ice-cold water bath for 20 min and then centrifuged at 4800× g for 20 min at 4 °C. The supernatant was transferred into another tube. All the above processes were repeated once. The supernatant was mixed and divided into two parts for analysis of SCFAs by gas chromatography and determination of pH values.
Gas chromatography was executed using an Agilent 6890 N GC system equipped with a flame ionization detector and an N10149 automatic liquid sampler (Agilent Technologies Inc., Palo Alto, CA, USA). The running parameters were set and adjusted according to the report of Hu et al. [63]. Standard curves were made in the range 1–20 mmol/L for acetic acid, 0.5–12.5 mmol/L for n-butyric acid, 0.75–15 mmol/L for propionic acid, 0.05–1.25 mmol/L for isobutyric acid, n-valeric acid and isovaleric acid (3 replicated for each level, 8 concentration levels), with deionized water as a blank control. The gas chromatography conditions were shown in Table 2.

4.5. Determination of Colon Index and Length

The colon length was measured by the ruler. Then, the colonic contents and fat around the colon were cleared away completely. The colon tissue was weighed. The colon index was calculated by the following formula [26,44]:
Colon index (%) = W1/W2 × 100,
where W1 represented the weight of colonic tissue of every mouse (g), W2 represented the body weight of the mice (g).

4.6. Determination of pH Value

Another portion of the supernatant (Collected in Section 2.4) was used to determine pH values by a PB-21 pH meter (Sartorius Corporation, Gottingen, Germany). The same sample was repeatedly measured 3 times for pH values.

4.7. Statistical Analysis

Statistical analysis was carried out by using SPSS Statistics Software (version 19.0, Chicago, IL, USA). The results were expressed as mean ± standard deviations (SD) with 12 animals in each group (n = 12). Data was evaluated by one-way analysis of variance, followed by Tukey test to calculate the significant difference. The significance level was set at p < 0.05.

5. Conclusions

In our study, administration with GABA increased the productions of SCFAs, colon index, colon length, weight of colonic and cecal contents and lowered the pH value in colonic and cecal contents. These findings suggested that GABA may be beneficial in improving colon health. However, the mechanisms by which GABA affect colon health need to be further explored.

Acknowledgments

This work was supported by National Natural Science Foundation of China for Excellent Young Scholars (31422042) and National Key Technology R & D Program of China (2012BAD33B06).

Author Contributions

X.M., Y.J.Y. and X.M.Y. conceived and designed the experiments; X.M. and C.H.H. performed the experiments; X.M. analyzed the data and wrote the first draft; X.M.Y., N.S.P. and Y.J.Y. revised the manuscript. All the authors read and approved the final manuscript and all authors’ names added in manuscript.

Conflicts of Interest

The authors declare no conflict of interest.

References

  1. Bustos-Fernandez, L. Colon. Structure and Function; Plenum Medical Book Co.: New York, NY, USA, 1983; p. 691. [Google Scholar]
  2. Wong, J.M.; De, S.R.; Kendall, C.W.; Emam, A.; Jenkins, D.J. Colonic health: Fermentation and short chain fatty acids. J. Clin. Gastroenterol. 2006, 40, 235–243. [Google Scholar] [CrossRef] [PubMed]
  3. Campbell, J.M.; Fahey, G.C.; Wolf, B.W. Selected indigestible oligosaccharides affect large bowel mass, cecal and fecal short-chain fatty acids, pH and microflora in rats. J. Nutr. 1997, 127, 130–136. [Google Scholar] [PubMed]
  4. Fallingborg, J. Intraluminal pH of the human gastrointestinal tract. Dan. Med. Bull. 1999, 46, 183–196. [Google Scholar] [PubMed]
  5. Rios-Covian, D.; Ruas-Madiedo, P.; Margolles, A.; Gueimonde, M.; Reyes-Gavilán, C.G.; Salazar, N. Intestinal short chain fatty acids and their link with diet and human health. Front. Microbiol. 2016, 7, 185. [Google Scholar] [CrossRef] [PubMed]
  6. Topping, D.L.; Clifton, P.M. Short-chain fatty acids and human colonic function: Roles of resistant starch and nonstarch polysaccharides. Physiol. Rev. 2001, 81, 1031–1064. [Google Scholar] [PubMed]
  7. Louis, P.; Scott, K.P.; Duncan, S.H.; Flint, H.J. Understanding the effects of diet on bacterial metabolism in the large intestine. J. Appl. Microbiol. 2007, 102, 1197–1208. [Google Scholar] [CrossRef] [PubMed]
  8. Fukuda, K. Induction of tissue transglutaminase expression by propionate and n-butyrate in colon cancer cell lines. J. Nutr. Biochem. 1999, 10, 397–404. [Google Scholar] [CrossRef]
  9. Diana, M.; Quílez, J.; Rafecas, M. Gamma-aminobutyric acid as a bioactive compound in foods: A review. J. Funct. Foods 2014, 10, 407–420. [Google Scholar] [CrossRef]
  10. Kimura, M.; Hayakawa, K.; Sansawa, H. Involvement of gamma-aminobutyric acid (GABA) B receptors in the hypotensive effect of systemically administered GABA in spontaneously hypertensive rats. Jpn. J. Pharmacol. 2002, 89, 388–394. [Google Scholar] [CrossRef] [PubMed]
  11. Thaker, P.H.; Yokoi, K.; Jennings, N.B.; Li, Y.; Rebhun, R.B.; Rousseau, D.L., Jr.; Fan, D.; Sood, A.K. Inhibition of experimental colon cancer metastasis by the GABA-receptor agonist nembutal. Cancer Biol. Ther. 2005, 4, 753–758. [Google Scholar] [CrossRef] [PubMed]
  12. Krantis, A. GABA in the mammalian enteric nervous system. Physiology 2000, 15, 284–290. [Google Scholar]
  13. Li, Y.; Xiang, Y.Y.; Lu, W.Y.; Liu, C.; Li, J. A novel role of intestine epithelial GABAergic signaling in regulating intestinal fluid secretion. Am. J. Physiol. 2012, 303, G453–G460. [Google Scholar] [CrossRef] [PubMed]
  14. Zizzo, M.G.; Mulè, F.; Serio, R. Functional evidence for GABA as modulator of the contractility of the longitudinal muscle in mouse duodenum: Role of GABA A and GABA C receptors. Neuropharmacology 2007, 52, 1685–1690. [Google Scholar] [CrossRef] [PubMed]
  15. Auteri, M.; Zizzo, M.G.; Serio, R. GABA and GABA receptors in the gastrointestinal tract: From motility to inflammation. Pharmacol. Res. 2015, 93, 11–21. [Google Scholar] [CrossRef] [PubMed]
  16. Auteri, M.; Zizzo, M.G.; Mastropaolo, M.; Serio, R. Opposite role played by GABA A and GABA B receptors in the modulation of peristaltic activity in mouse distal colon. Eur. J. Pharmacol. 2014, 731, 93–99. [Google Scholar] [CrossRef] [PubMed]
  17. Song, L.; Du, A.; Xiong, Y.; Jiang, J.; Zhang, Y.; Tian, Z.; Yan, H. γ-Aminobutyric acid inhibits the proliferation and increases oxaliplatin sensitivity in human colon cancer cells. Tumor Biol. 2016, 37, 14885–14894. [Google Scholar] [CrossRef] [PubMed]
  18. Chung, Y.C.; Hsu, C.K.; Ko, C.Y.; Chan, Y.C. Dietary intake of xylooligosaccharides improves the intestinal microbiota, fecal moisture, and pH value in the elderly. Nutr. Res. 2007, 27, 756–761. [Google Scholar] [CrossRef]
  19. Scheppach, W. Effects of short chain fatty acids on gut morphology and function. Gut 1994, 35, S35–S38. [Google Scholar] [CrossRef] [PubMed]
  20. Roediger, W. Role of anaerobic bacteria in the metabolic welfare of the colonic mucosa in man. Gut 1980, 21, 793–798. [Google Scholar] [CrossRef] [PubMed]
  21. Harig, J.M.; Soergel, K.H.; Komorowski, R.A.; Wood, C.M. Treatment of diversion colitis with short-chain-fatty acid irrigation. N. Engl. J. Med. 1989, 320, 23–28. [Google Scholar] [CrossRef] [PubMed]
  22. Roediger, W. Utilization of nutrients by isolated epithelial cells of the rat colon. Gastroenterology 1982, 83, 424–429. [Google Scholar] [PubMed]
  23. Cummings, J.H. Short chain fatty acids in the human colon. Gut 1981, 22, 763–779. [Google Scholar] [CrossRef] [PubMed]
  24. Remesy, C.; Demigne, C. Partition and absorption of volatile fatty acids in the alimentary canal of the rat. Ann. Rech. Vet. 1976, 7, 39–55. [Google Scholar] [PubMed]
  25. Macfarlane, S.; Macfarlane, G.T. Regulation of short-chain fatty acid production. Proc. Nutr. Soc. 2003, 62, 67–72. [Google Scholar] [CrossRef] [PubMed]
  26. Min, F.F.; Wan, Y.J.; Nie, S.P.; Xie, M.Y. Study on colon health benefit of polysaccharide from Cyclocarya paliurus leaves in vivo. J. Funct. Foods 2014, 11, 203–209. [Google Scholar] [CrossRef]
  27. Henningsson, I.; Bjiirck, I.; Nyman, M. Short-chain fatty acid formation at fermentation of indigestible carbohydrates. Food Nutr. Res. 2001, 45, 165–168. [Google Scholar] [CrossRef]
  28. Meynell, G. Antibacterial mechanisms of the mouse gut: II. The role of Eh and volatile fatty acids in the normal gut. Br. J. Exp. Pathol. 1963, 44, 209–219. [Google Scholar] [PubMed]
  29. Hentges, D.J. Inhibition of Shigella flexneri by the normal intestinal flora I. Mechanisms of inhibition by Klebsiella. J. Bacteriol. 1967, 93, 1369–1373. [Google Scholar] [PubMed]
  30. Morrison, D.J.; Preston, T. Formation of short chain fatty acids by the gut microbiota and their impact on human metabolism. Gut Microbes 2016, 7, 189–200. [Google Scholar] [CrossRef] [PubMed]
  31. Sakata, T. Stimulatory effect of short-chain fatty acids on epithelial cell proliferation in the rat intestine: A possible explanation for trophic effects of fermentable fibre, gut microbes and luminal trophic factors. Br. J. Nutr. 1987, 58, 95–103. [Google Scholar] [CrossRef] [PubMed]
  32. Scheppach, W.; Pomare, E.; Elia, M.; Cummings, J. The contribution of the large intestine to blood acetate in man. Clin. Sci. 1991, 80, 177–182. [Google Scholar] [CrossRef] [PubMed]
  33. Kishimoto, Y.; Wakabayashi, S.; Takeda, H. Effects of intravenous injection and intraperitoneal continual administration of sodium propionate on serum cholesterol levels in rats. J. Nutr. Sci. Vitaminol. 1995, 41, 73–81. [Google Scholar] [CrossRef] [PubMed]
  34. Arora, T.; Sharma, R.; Frost, G. Propionate. Anti-obesity and satiety enhancing factor? Appetite 2011, 56, 511–515. [Google Scholar] [CrossRef] [PubMed]
  35. Hara, H.; Haga, S.; Kasai, T.; Kiriyama, S. Fermentation products of sugar-beet fiber by cecal bacteria lower plasma cholesterol concentration in rats. J. Nutr. 1998, 128, 688–693. [Google Scholar] [PubMed]
  36. Whitehead, R.; Young, G.; Bhathal, P. Effects of short chain fatty acids on a new human colon carcinoma cell line (LIM1215). Gut 1986, 27, 1457–1463. [Google Scholar] [CrossRef] [PubMed]
  37. Leonel, A.J.; Alvarez-Leite, J.I. Butyrate: Implications for intestinal function. Curr. Opin. Clin. Nutr. Metab. Care 2012, 15, 474–479. [Google Scholar] [CrossRef] [PubMed]
  38. Qiao, Y.; Qian, J.; Lu, Q.; Tian, Y.; Chen, Q.; Zhang, Y. Protective effects of butyrate on intestinal ischemia—Reperfusion injury in rats. J. Surg. Res. 2015, 197, 324–330. [Google Scholar] [CrossRef] [PubMed]
  39. Zhang, L.; Jin, S.; Wang, C.; Jiang, R.; Wan, J. Histone Deacetylase Inhibitors Attenuate Acute Lung Injury During Cecal Ligation and Puncture-Induced Polymicrobial Sepsis. World J. Surg. 2010, 34, 1676–1683. [Google Scholar] [CrossRef] [PubMed]
  40. Zhou, M.; Pu, C.; Xia, L.; Yu, X.; Zhu, B.; Cheng, R.; Xu, L.; Zhang, J. Salecan diet increases short chain fatty acids and enriches beneficial microbiota in the mouse cecum. Carbohydr. Polym. 2014, 102, 772–779. [Google Scholar] [CrossRef] [PubMed]
  41. Barrett, E.; Ross, R.; O’Toole, P.; Fitzgerald, G.; Stanton, C. γ-Aminobutyric acid production by culturable bacteria from the human intestine. J. Appl. Microbiol. 2012, 113, 411–417. [Google Scholar] [CrossRef] [PubMed]
  42. Maqsood, R.; Stone, T.W. The Gut-Brain Axis, BDNF, NMDA and CNS Disorders. Neurochem. Res. 2016, 41, 2819–2835. [Google Scholar] [CrossRef] [PubMed]
  43. Oriach, C.S.; Robertson, R.C.; Stanton, C.; Cryan, J.F.; Dinan, T.G. Food for thought: The role of nutrition in the microbiota-gut-brain axis. Clin. Nutr. Exp. 2016, 6, 25–38. [Google Scholar] [CrossRef]
  44. Zhang, G.Y.; Nie, S.P.; Huang, X.J.; Hu, J.J.; Cui, S.W.; Xie, M.Y.; Phillips, G.O. Study on Dendrobium officinale O-acetyl-glucomannan (Dendronan®): Part VII. improving effects on colonic health of mice. J. Agric. Food Chem. 2015, 64, 2485–2491. [Google Scholar] [CrossRef] [PubMed]
  45. Knapp, B.K.; Bauer, L.L.; Swanson, K.S.; Tappenden, K.A.; Fahey, G.C.; Godoy, M.R.C.D. Soluble Fiber Dextrin and Soluble Corn Fiber Supplementation Modify Indices of Health in Cecum and Colon of Sprague-Dawley Rats. Nutrients 2013, 5, 396–410. [Google Scholar] [CrossRef] [PubMed]
  46. Koecher, K.J.; Noack, J.A.; Timm, D.A.; Klosterbuer, A.S.; Thomas, W.; Slavin, J.L. Estimation and interpretation of fermentation in the gut: Coupling results from a 24 h batch in vitro system with fecal measurements from a human intervention feeding study using fructo-oligosaccharides, inulin, gum acacia, and pea fiber. J. Agric. Food Chem. 2014, 62, 1332–1337. [Google Scholar] [CrossRef] [PubMed]
  47. Cummings, J.H.; Macfarlane, G.T. The control and consequences of bacterial fermentation in the human colon. J. Appl. Microbiol. 1991, 70, 443–459. [Google Scholar] [CrossRef]
  48. Grandison, L.; Guidotti, A. Stimulation of food intake by muscimol and beta endorphin. Neuropharmacology 1977, 16, 533–536. [Google Scholar] [CrossRef]
  49. Topping, D.L.; Gooden, J.M.; Brown, I.L.; Biebrick, D.A.; Mcgrath, L.; Trimble, R.P.; Choct, M.; Illman, R.J. A high amylose (amylomaize) starch raises proximal large bowel starch and increases colon length in pigs. J. Nutr. 1997, 127, 615–622. [Google Scholar] [PubMed]
  50. Jädert, C.; Phillipson, M.; Holm, L.; Lundberg, J.O.; Borniquel, S. Preventive and therapeutic effects of nitrite supplementation in experimental inflammatory bowel disease. Redox Biol. 2014, 2, 73–81. [Google Scholar] [CrossRef] [PubMed]
  51. Chen, Z.; Xie, J.; Hu, M.; Tang, J.; Shao, Z.; Li, M. Protective effects of γ-aminobutyric acid (GABA) on the small intestinal mucosa in heat-stressed Wenchang chicken. J. Anim. Plant Sci. 2015, 25, 78–87. [Google Scholar]
  52. Carvalho, L.; Brait, D.; Vaz, M.; Lollo, P.; Morato, P.; Oesterreich, S.; Raposo, J.; Freitas, K. Partially Hydrolyzed Guar Gum Increases Ferroportin Expression in the Colon of Anemic Growing Rats. Nutrients 2017, 9, 228. [Google Scholar] [CrossRef] [PubMed]
  53. Pattananandecha, T.; Sirilun, S.; Duangjitcharoen, Y.; Sivamaruthi, B.S.; Suwannalert, P.; Peerajan, S.; Chaiyasut, C. Hydrolysed inulin alleviates the azoxymethane-induced preneoplastic aberrant crypt foci by altering selected intestinal microbiota in Sprague-Dawley rats. Pharm. Biol. 2016, 54, 1596–1605. [Google Scholar] [CrossRef] [PubMed]
  54. Macdonald, I.A.; Singh, G.; Mahony, D.E.; Meier, C.E. Effect of pH on bile salt degradation by mixed fecal cultures. Steroids 1978, 32, 245–256. [Google Scholar] [CrossRef]
  55. Uraipan, S.; Brigidi, P.; Hongpattarakere, T. Antagonistic mechanisms of synbiosis between Lactobacillus plantarum CIF17AN2 and green banana starch in the proximal colon model challenged with Salmonella Typhimurium. Anaerobe 2014, 28, 44–53. [Google Scholar] [CrossRef] [PubMed]
  56. Xie, J.H.; Fan, S.T.; Nie, S.P.; Yu, Q.; Xiong, T.; Gong, D.; Xie, M.Y. Lactobacillus plantarum NCU116 attenuates cyclophosphamide-induced intestinal mucosal injury, metabolism and intestinal microbiota disorders in mice. Food Funct. 2016, 7, 1584–1592. [Google Scholar] [CrossRef] [PubMed]
  57. Fletcher, E.; Clark, M.; Senior, P.; Furness, J. Gene expression and localization of GABA C receptors in neurons of the rat gastrointestinal tract. Neuroscience 2001, 107, 181–189. [Google Scholar] [CrossRef]
  58. Uezono, Y.; Kaibara, M.; Hayashi, H.; Kawakami, S.; Enjoji, A.; Kanematsu, T.; Taniyama, K. Characterization of GABAB receptor in the human colon. J. Pharmacol. Sci. 2004, 94, 211–213. [Google Scholar] [CrossRef] [PubMed]
  59. Kimura, E.H.; Oliveira, L.B.; Colombari, D.S.A.; De Luca, L.A.; Menani, J.V.; Callera, J.C. Sodium intake by hyperosmotic rats treated with a GABA(A) receptor agonist into the lateral parabrachial nucleus. Brain Res. 2008, 1190, 86–93. [Google Scholar] [CrossRef] [PubMed]
  60. Sandle, G.I. Salt and water absorption in the human colon: A modern appraisal. Gut 1998, 43, 294–299. [Google Scholar] [CrossRef] [PubMed]
  61. Mortensen, P.B.; Clausen, M.R. Short-Chain Fatty Acids in the Human Colon: Relation to Gastrointestinal Health and Disease. Scand. J. Gastroenterol. 1996, 216, 132–148. [Google Scholar] [CrossRef]
  62. Ruppin, H.; Barmeir, S.; Soergel, K.H.; Wood, C.M.; Schmitt, M.G. Absorption of short-chain fatty acids by the colon. Gastroenterology 1980, 78, 1500–1507. [Google Scholar] [PubMed]
  63. Hu, J.L.; Nie, S.P.; Min, F.F.; Xie, M.Y. Polysaccharide from seeds of Plantago asiatica L. increases short-chain fatty acid production and fecal moisture along with lowering pH in mouse colon. J. Agric. Food Chem. 2012, 60, 11525–11532. [Google Scholar] [CrossRef] [PubMed]
Sample Availability: Not Available.
Figure 1. The colon index (A) and colon length (B) of mice treated with gamma-Aminobutyric acid (GABA). Results are expressed as mean value ± SD (n = 12). Data with different letters in the same column means significant difference among groups (p < 0.05). Colon index was calculated by using Equation (1).
Molecules 22 00653 g001
Figure 2. The weight of colonic (A) and cecal (B) contents of mice treated with GABA. Result are expressed as means value ± SD (n = 12). Data with different letters in the same column means significant difference among groups (p < 0.05).
Molecules 22 00653 g002
Figure 3. pH values change in colonic (A) and cecal contents (B) of mice treated with GABA. The results were expressed as mean ± SD (n = 12), and evaluated by one way ANOVA with turkey test. Values with different letters indicated significant different among groups (p < 0.05).
Molecules 22 00653 g003
Figure 4. The effect of GABA on total short-chain fatty acid (SCFA) concentrations in the mice colonic (A) and cecal (B) contents. Data was represented as mean ± SD (n = 12), and evaluated by one way ANOVA with turkey test. Values with different letters expressed significant differences among groups (p < 0.05).
Molecules 22 00653 g004
Figure 5. The effect of GABA on individual SCFA concentration in the mice colonic content, acetic acid (A), propionic acid (B), n-butyric acid (C), isobutyric acid (D), n-valeric acid (E), isovaleric acid (F), respectively The data was presented as mean ± SD (n = 12), and evaluated by one way ANOVA with turkey test. Values with different letters in the same chart indicated significant differences among groups (p< 0.05).
Molecules 22 00653 g005aMolecules 22 00653 g005b
Figure 6. The effect of GABA on individual SCFA in the mice cecal content, acetic acid (A), propionic acid (B), n-butyric acid (C), isobutyric acid (D), n-valeric acid (E), isovaleric acid (F), respectively. Data was expressed as mean ± SD (n = 12), and evaluated by one way ANOVA with turkey test. Results with different letters showed significant differences from each group (p < 0.05).
Molecules 22 00653 g006
Table 1. Body mass of mice during the experiment period a (g).
Group0 Day7 Day14 Day
Control22.98 ± 1.72 a27.46 ± 1.77 b30.74 ± 2.08 c
GABA-522.40 ± 1.47 a27.15 ± 2.57 b30.68 ± 1.93 c
GABA-1022.96 ± 1.25 a27.45 ± 1.62 b30.71 ± 1.75 c
GABA-2023.13 ± 1.32 a28.14 ± 1.51 b31.62 ± 1.54 c
GABA-4022.89 ± 2.06 a27.71 ± 1.89 b31.11 ± 1.84 c
a Data was expressed as mean ± SD (n = 12).Values in the column with different letters indicated significant differences (p < 0.05).
Table 2. Gas chromatographic conditions.
ConditionRunning Parameter
Chromatographic columnHP-INNOWAX (30 m × 0.32 mm × 0.5 μm)
Detector and temperatureFID, 240 °C
Carrier gas and flow rateN2, 1.2 mL/min
Injection volume0.2 μL
Air velocity300 mL/min
Hydrogen flow rate30 mL/min
Split ratio0
Temperature-rising procedure100 °C (0.5 min, 4 °C/min) − 170 °C; 170 °C (20 °C/min) − 230 °C

